3.1. Sample Characteristics
Of the 192 responses obtained, 161 were complete and were included in the subsequent analysis at a 95% confidence rate, which indicated a confidence interval of 7.68. Responses were obtained from all USDA National Agricultural Statistics Service regions, with the largest number of responses (40.5%) from the Northern Plains states where the survey was administered, followed by 15.7% from the Northeastern states. Sixty-five responses from the Northern Plains region would represent 10.3% of the establishments identified by the 2012 Economic Census. There were also four responses from Canada. Based on the zip codes of the business location, 42.9% were located in communities with less than 10,000 people.
Respondents represented businesses of various sizes, with a disproportionate number of businesses grossing sales over
$500,000 annually (
Table 1), compared to the distribution of horticultural specialty operations in the 2014 Census of Horticultural Specialties [
17] across the sales categories. More than half (57.1%) of the businesses in the sample sold
$500,000 or more in 2014, with the median response category of sales being between
$500,000 and
$1 million. In comparison, 8.7% sold less than
$25,000. For reference, the average market value of products sold by nurseries, greenhouses, and floriculture farms, according to the 2012 Census of Agriculture, was
$353,788 [
3]. While the Census data are likely skewed to the right, suggesting the average would exceed the median, our sample was skewed to the left.
Most businesses (87.6%) in the sample were well established, having been in operation for more than 10 years. Overall, response categories were represented almost uniformly in the sample, with a small number of businesses having been in operation for more than 100 years (5.0%). Nearly two-thirds (64.0%) of businesses were open year-round.
The primary marketing channel was retail to consumers, accounting for 90% or more of total sales for half of the respondents (
Table 2). The second most popular marketing channel was wholesalers to landscapers, other garden centers, and re-wholesalers. “Re-wholesalers” generally do not own production facilities, but instead buy products wholesale from producers to sell at a wholesale price to allied horticulture industry businesses, such as landscapers and garden centers. In contrast, 95.6% of respondents did not sell any of their products through the mass merchandisers’ channel. Respondents also reported selling up to 10% of their products through channels not listed in the questionnaire including construction and maintenance firms, municipalities, universities, and non-profit organizations.
Adopting the description of ornamental horticulture-industry products and services by Hall et al. [
1], the questionnaire asked respondents to identify products and services their business offered. Consistent with the marketing channels, retail product offering was the most prevalent (
Table 3). Within the retail product category, bedding and nursery stock was offered by 73.3% of respondents, followed by lawn and garden products (54.7%), general merchandise (54.0%), and landscape materials (42.2%). Bedding and nursery stock and landscape materials were the most common products among those who wholesaled. According to the 2012 Agricultural Census, nursery stock crops and bedding and garden plants were the highest valued (
$5 billion and
$3.6 billion, respectively) in ornamental horticulture industries [
3]. Respondents mentioned various other activities including pottery, gift and jewelry retail, herbs, vegetables, pet shop, agritourism, educational services, and vocational training for individuals with disabilities.
Individuals who responded to the questionnaire on behalf of the businesses were on average 50 years of age, with slightly fewer female respondents (48.5%) than male respondents. More than half of the respondents held a baccalaureate degree (67.1%), with most (88.8%) attending some amount of college. Nearly two-thirds (63.4%) of the respondents were business owners, while 23.6% were managers. Thirteen respondents (8.1%) were marketing managers. This low representation of marketing managers might suggest that either owners or managers conduct their own marketing activities, including social media, or contract their marketing services to third-party consultants. Other respondent roles included extension master gardener, office manager, sales manager, and search engine optimizer. The majority (62.7%) of respondents had worked at the business for 10 years or more. Only 3.1% of the respondents had joined or owned the business within one year. Most owners (76%) had worked at their business for at least 10 years.
3.2. Marketing Practices
The extent of marketing efforts, in terms of expenses and hours, was asked in open-ended questions. Reported marketing expenses for 2014 ranged from
$0 to
$1 million, with an average of
$53,050 and median of
$10,000 (
Table 4, first column). On the lower end, nearly half (42.9%) reported marketing expenses under
$4,000, almost half (43.5%) of which reported less than
$500. On the upper end, 11 businesses (6.8%) reported marketing expenses over
$200,000. In terms of hours allocated to marketing efforts, the businesses reported spending on average 13.7 h per week performing various marketing activities, with half of the businesses spending four or fewer hours. Six businesses reported spending 40 to 60 h per week, suggesting two individuals were allocating at least half of their time to marketing, while five businesses reported more than 90 h per week, suggesting more than one full-time individual was assigned to marketing efforts.
Given the large disparity in size, businesses were grouped into three sales categories (less than $250,000, $250,000 to less than $1 million, and $1 million or more) for additional insight. The categories corresponded to intervals used in the Census report, placing 50, 41, and 70 businesses into the respective sales categories. Though the subsamples were too small to establish any statistical significance of differences observed, the categorization offered additional insight.
In
Table 4, responses by the three groups are reported in respective columns. The average marketing expenses for the smallest businesses (
$2,844) was 18.9% of that for the large businesses (grossing
$250,000 or more, but less than
$1 million), and 2.6% of that for the largest businesses (grossing
$1 million or more). While there were businesses that spent at least 10% of their sales on marketing, there were some reporting
$0 and zero hours for marketing efforts, even among businesses selling more than
$1 million. Similarly, in terms of hours allocated to marketing efforts, the largest businesses had, on average, one half-time person tasked with marketing, while marketing activities at smaller businesses were mostly carried out by individuals with other primary tasks.
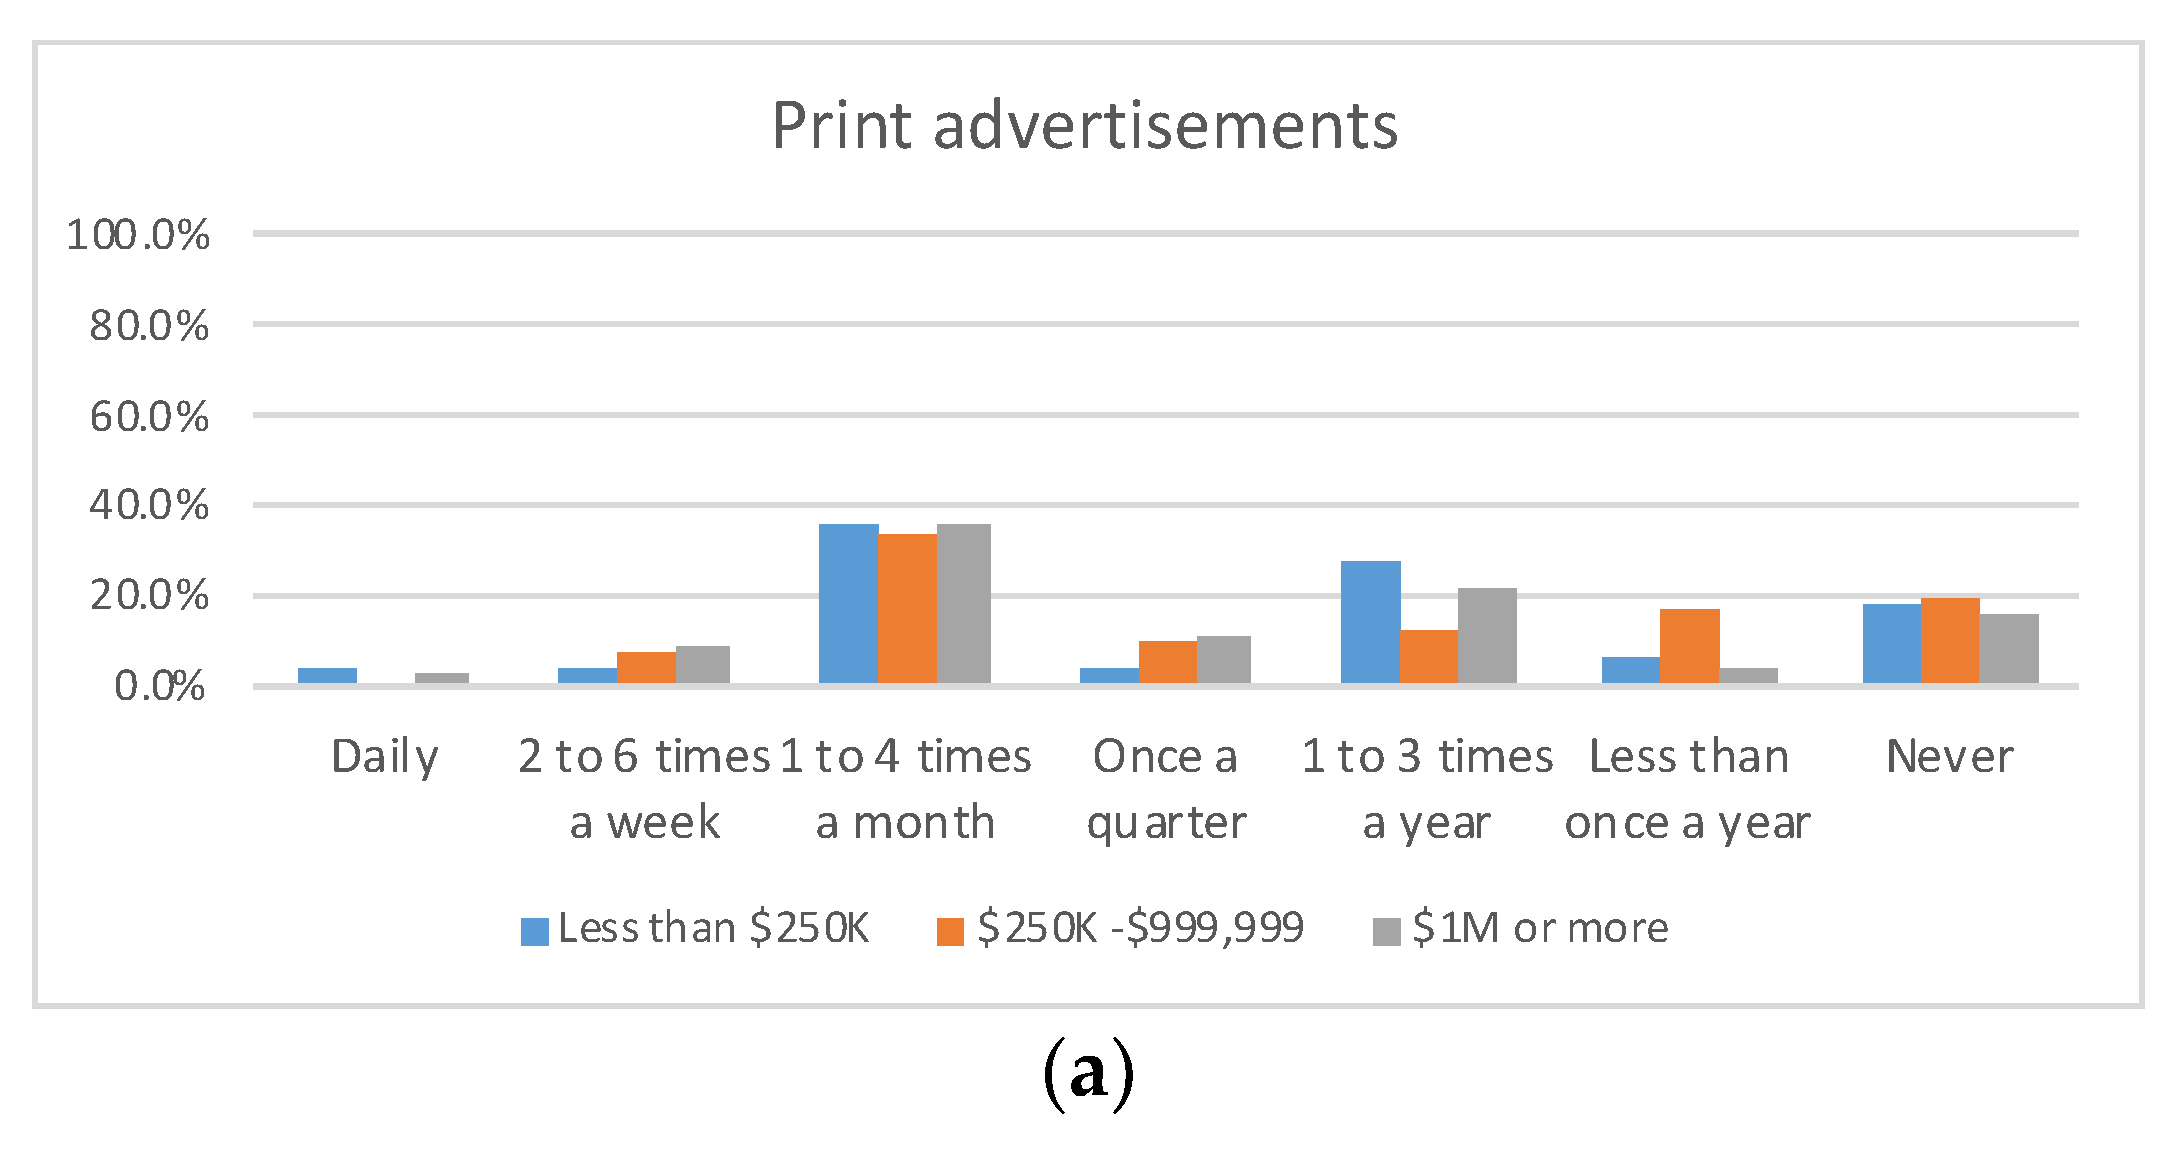
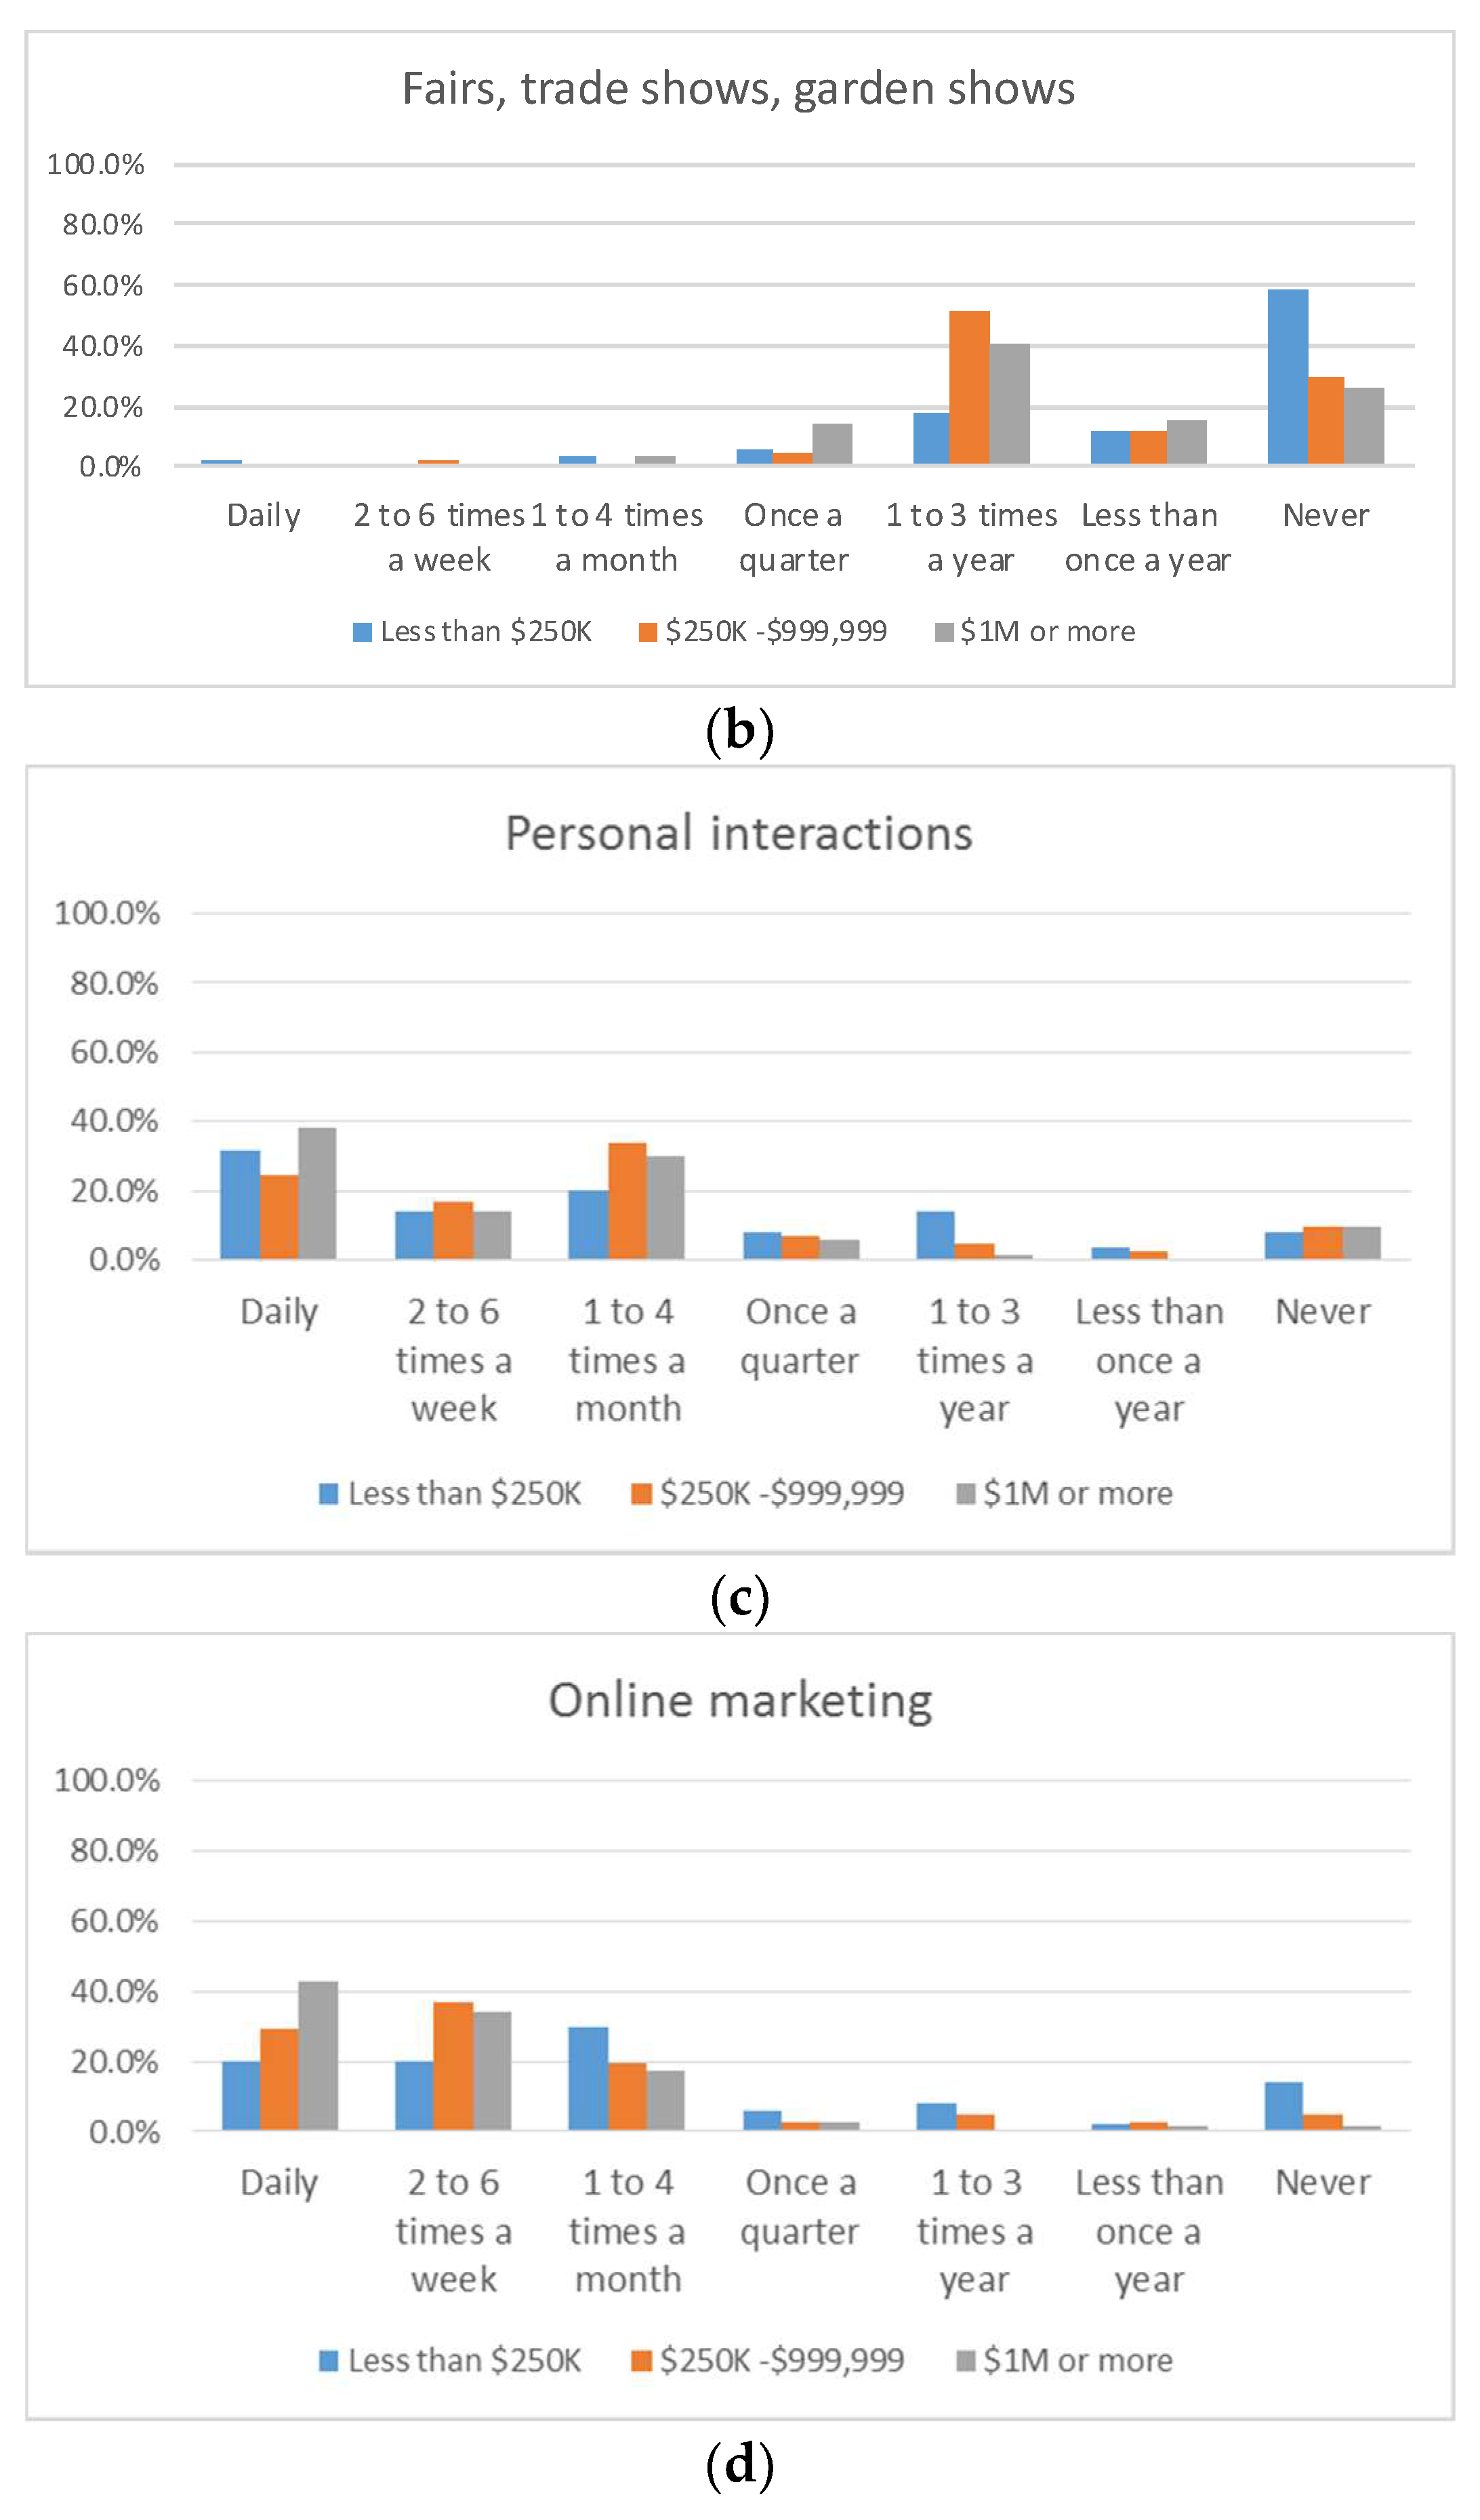
Figure 1 depicts the frequency of use of selected marketing channels for the smallest, large, and largest businesses. Use of print advertisements and personal interactions were relatively similar across the groups. About 35% of businesses used print advertisements one to four times per month, and 17% did not use these at all. Nearly half (47.8%) reported reaching out to their customers with phone calls, emails, and visits more than once a week. In contrast, use patterns varied by sales category for fairs and trade/garden shows and online marketing. Nearly 60% of businesses grossing
$250,000 or more attended fairs and trade/garden shows at least once a year, whereas 58% of the smaller businesses never did. Average proportions of non-users of online marketing varied from 14% among smaller businesses to 5% of large businesses and 1.4% of the largest businesses. Among online marketing users, larger businesses used it more frequently than smaller businesses.
Delving deeper into use of online marketing,
Table 5 summarizes the status of online-platform accounts used by businesses. Facebook was the predominant platform, regardless of business size (
Table 5). The use of Twitter and blogs was limited among the smallest and large businesses, with blogs being the least popular platform for both size groups. Conversely, more than 40% of the largest businesses were actively using Twitter and blogs. The use of HTML newsletters was linearly associated with business size, currently by 30%, 54%, and 83% of the smallest, large, and largest businesses, respectively. The variation in use of blogs, Twitter, and HTML newsletters, between small, medium, and large business, might reflect that these tools require specific writing skills and a significant time commitment, for which only larger business can afford to seek out and allocate resources to actively and effectively use these platforms.
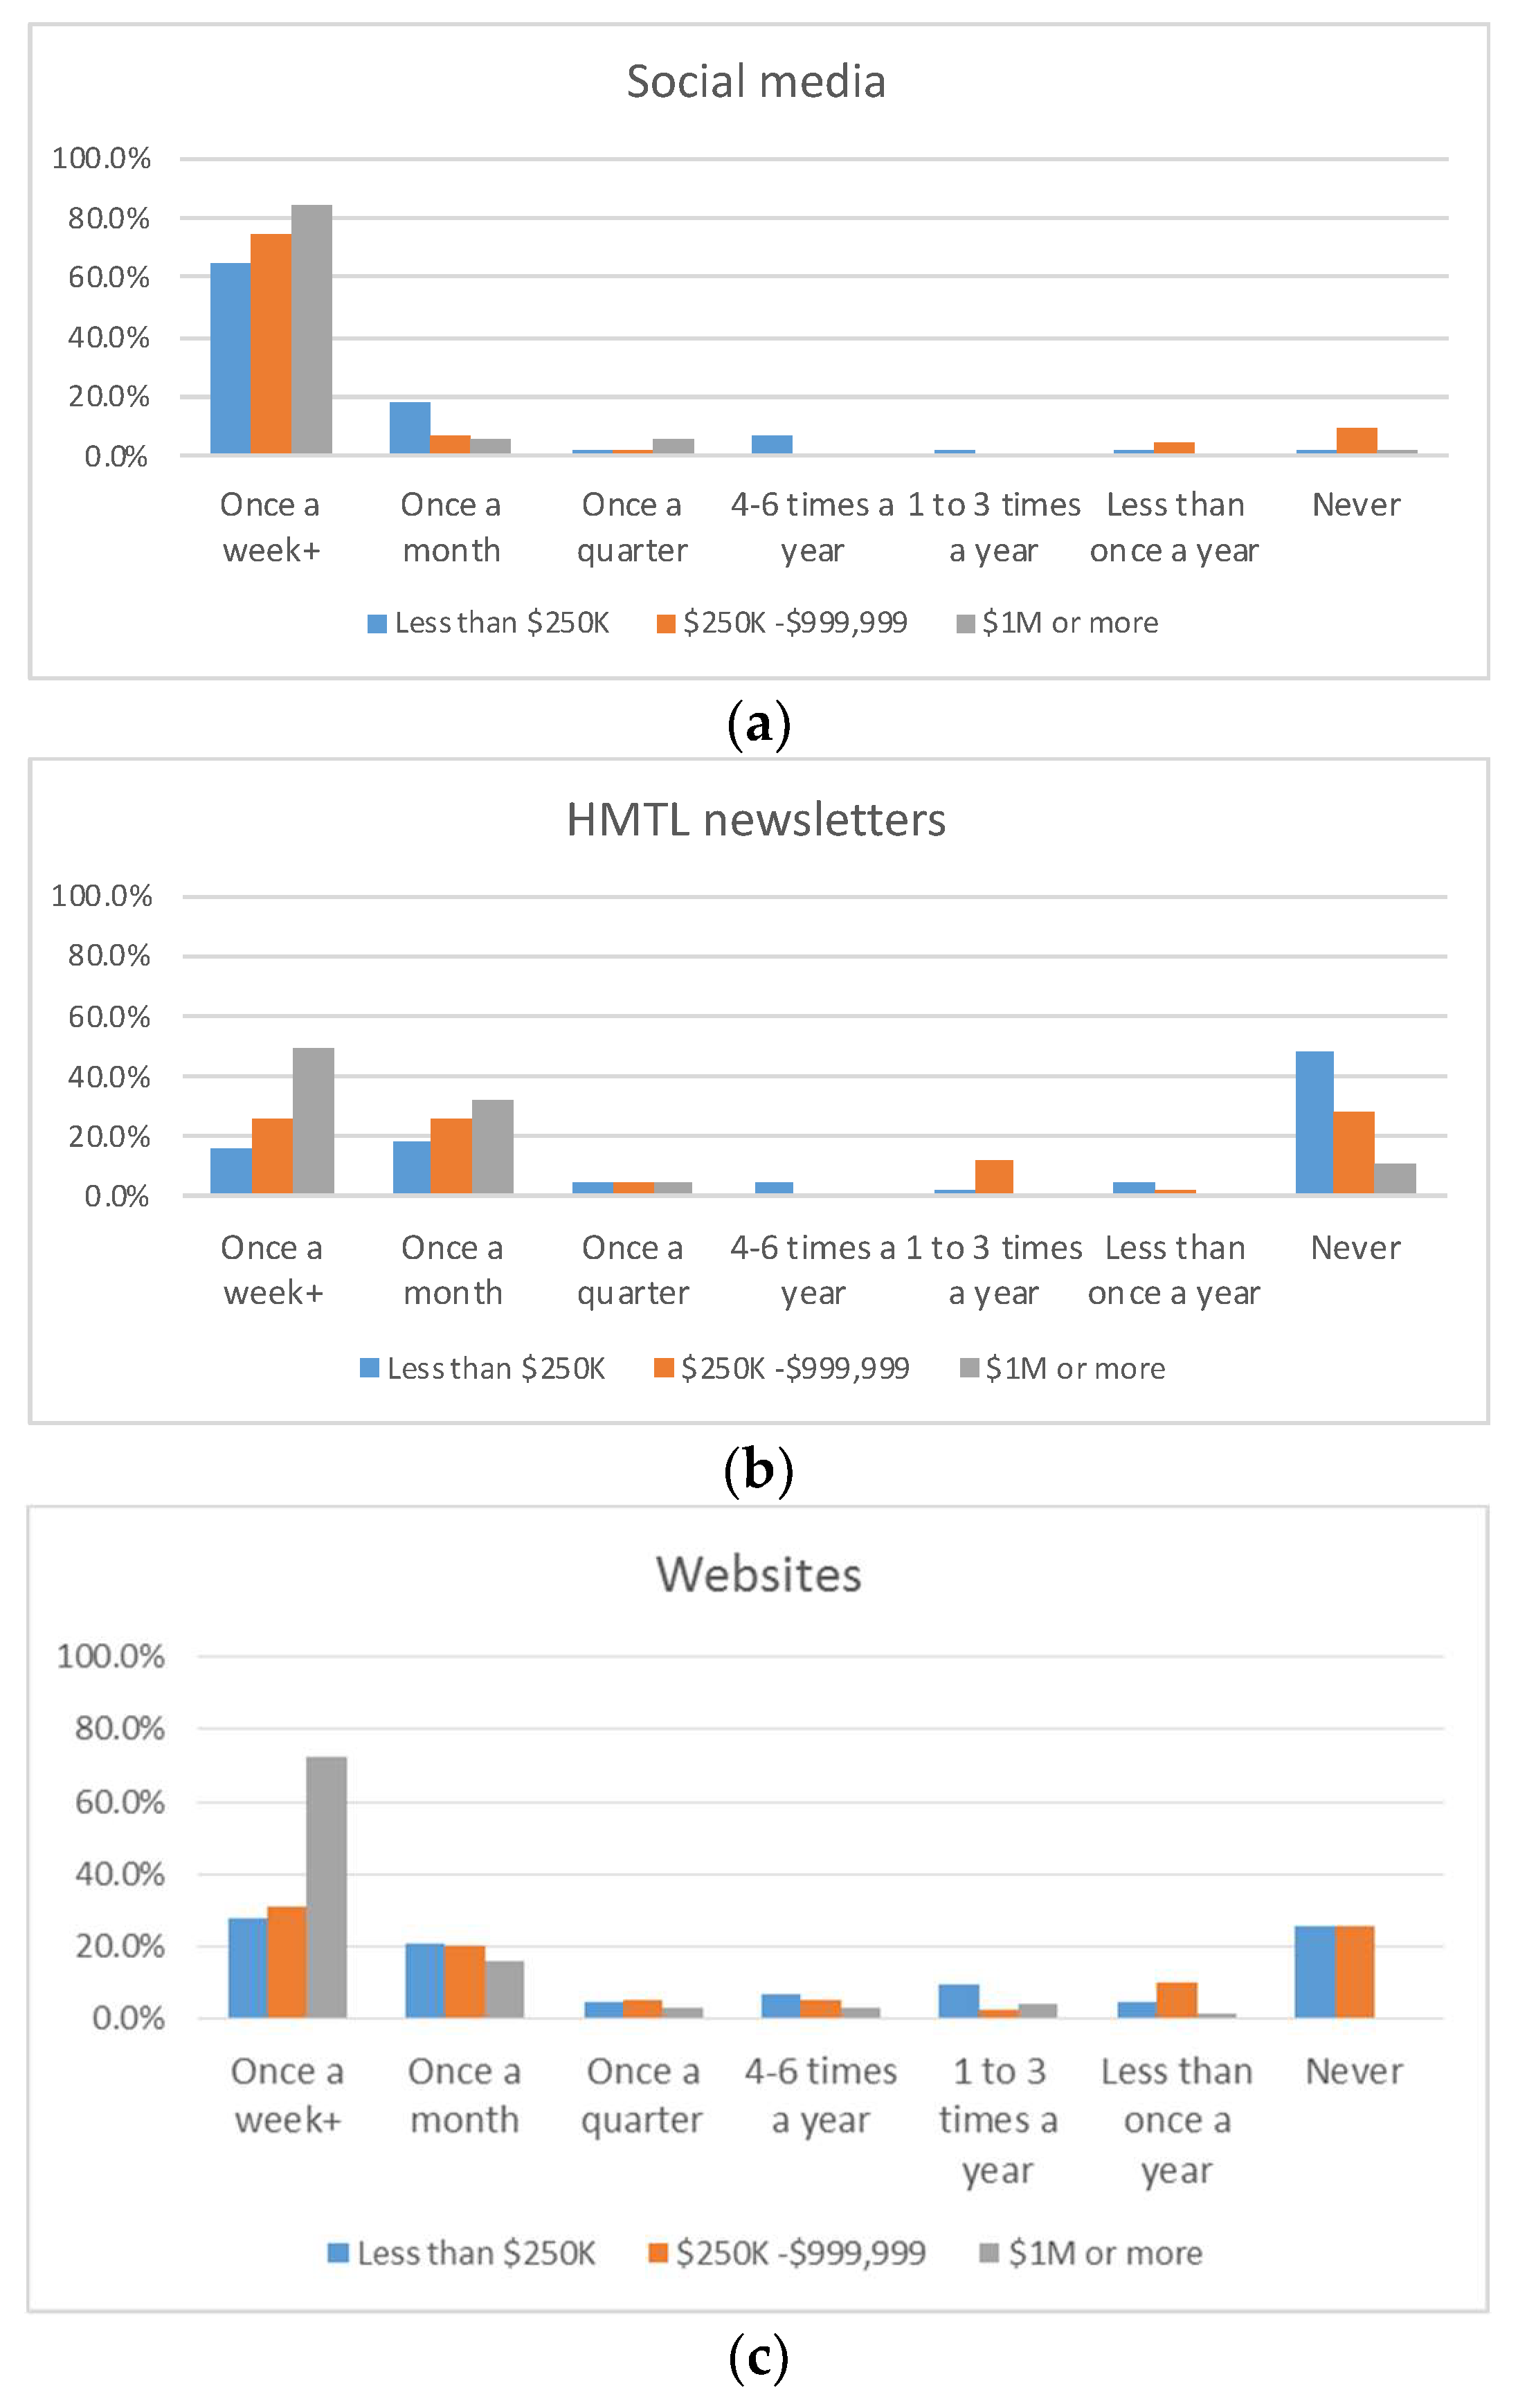
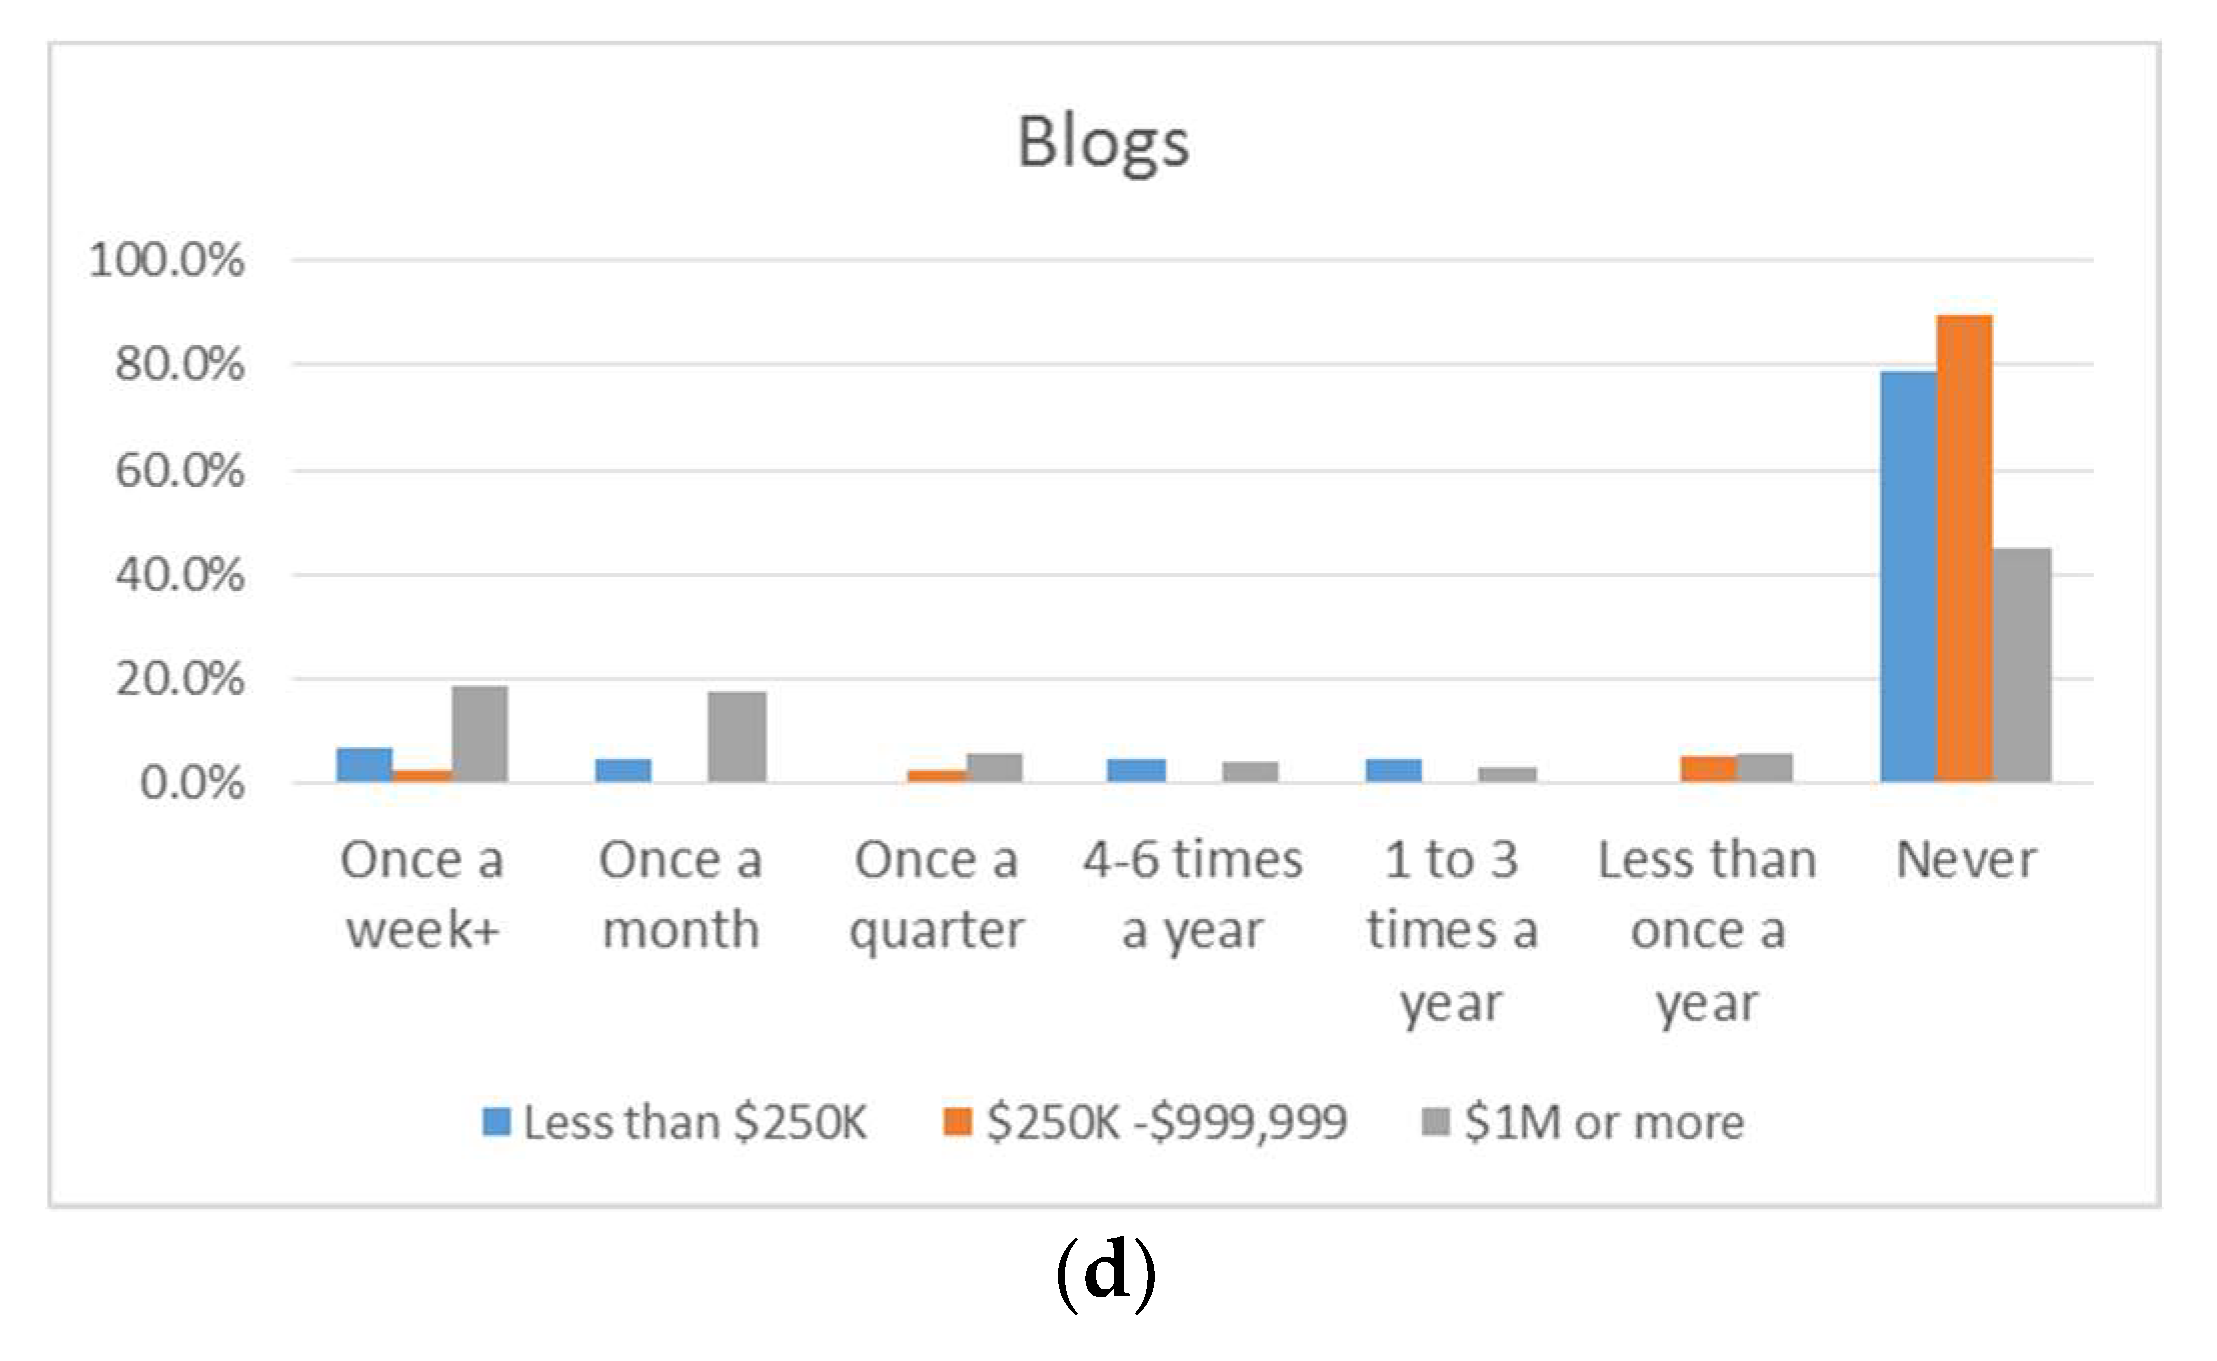
Figure 2 illustrates the frequency of use of online platforms to reach customers. The three charts show similar trends across platforms in all sales categories, with the most frequent activity being on social media, followed by websites, HTML newsletters, and blogs. In general, larger businesses used all platforms more frequently than smaller businesses, except a larger portion of the middle-size businesses were less frequently active on blogs than the smallest businesses. Overall, 76.2% of businesses used social media once a week or more, while 9.3% of businesses (14.0% of smaller businesses and about 7% of both groups of larger businesses) used social media once a quarter or less. Frequency of posting is a difficult concept to manage and depends on the needs of each businesses’ customer, but posting once a quarter may make it appear that a business is inactive and/or no longer in business [
18,
19].
Specifically related to social media, all businesses that engaged in online marketing reported using some form of social media, with the range of use from one to 15 years, and a median of five years. This may indicate that the sample included more businesses that had a social-media presence. Eighty-nine point six percent of businesses indicated their social-media account was created by the owner, manager, or an employee. Others (6.3%) received free help from friends or family, while a few (3.5%) hired a consultant or third-party company.
Twelve point six percent of respondents hired a third party to conduct their social-media activity in 2014. Social-media marketing expenses through consulting services averaged $11,700, representing 22% of total marketing expenses. This result indicated that new-media marketing generally received less attention from ornamental horticulture businesses than traditional marketing venues. The Pearson correlation coefficient between the amount allocated to social-media services and the sales dollar amount was 0.58, indicating that bigger firms allocated more resources to social-media marketing.
3.4. Technical Environment
To understand their technical environment at work, respondents were asked to identify the type of internet connection available at the business location, as well as the device used for their new-media marketing activities. Regarding the type of connection, wireless (45.3%), cable (30.4%), and digital subscriber line (DSL) (24.2%) were the connections respondents reported using. Results also show that more than one type of connection was available in many businesses. Pertaining to the device used for new-media marketing, desktops (73.3%) and smartphones (62.1%) were the most prominent, followed by laptops (51.6%) and tablets (34.2%). Similar to the type of connection, businesses used more than one device for their new-media marketing activity.
As a measure of online activeness, respondents were asked for the number of businesses they followed online on a regular basis. The term “regularly” stressed a relatively permanent contact with the group. “Number of businesses monitored online” represents the breadth of their online network, a group from which the business owner or manager can learn online marketing tips or imitate what peers are doing by observing. For all businesses in the sample, the numbers of businesses were relatively uniformly distributed over the network size, from one to six, but the network size on average was bigger for larger businesses. One-third of the large and largest businesses had a network size of 10 or more, compared to 14.0% among the smallest businesses, and 8.7% of the largest businesses had a network size of 0 compared to 14.0% and 12.8% among the smallest and large businesses, respectively.
The individual’s technical environment at home was assessed by way of their personal use of social media, and the size of their personal online network was measured by the number of people (likes or friends on Facebook, Twitter, LinkedIn, etc.) they personally followed on a regular basis. More than half of the respondents (58.4%, n = 161) were daily social-media users, while only 11.2% did not use social media for personal purposes. There was a notably large proportion (22.0%) of individuals at large businesses who were non-users for personal purposes, and consequently had no personal online network. Otherwise, the size of the personal online network tended to be positively correlated with the size of the business, averaging 126 and 256 individuals among the smallest and the largest businesses, respectively.


