1. Introduction
Feeding a global population of 9.5 billion by 2050 is anticipated to become one of the greatest challenges of our time [
1,
2,
3]. Rapid population growth [
1,
3,
4,
5,
6,
7], decreasing agricultural productivity [
8,
9,
10], climate change [
3,
10,
11], natural resource scarcity [
3,
12], and biofuel production [
3,
13,
14,
15,
16,
17,
18] collectively undermine the current and future capacity of global food production systems. The risk of food insecurity is no longer a challenge exclusive to lesser-developed countries. In Australia, one in six Australians reported having experienced food insecurity in 2016 [
10], with an estimated 2 million people having sought food relief [
19,
20].
While there have been considerable effort to identify strategies to enhance and diversify current food production systems [
4,
5,
9], of equal importance is an increasing realisation of significant inefficiencies in the global food system due to food loss and waste (FLW) [
6,
21,
22,
23,
24,
25]. Global FLW has been estimated to represent 27% to 50% of total agricultural production [
26,
27,
28,
29,
30,
31]. Annually, there is around 4 Mt or AUD8 billion worth of FLW in Australia, 33% of which is horticultural product [
19,
32,
33]. Due to their relative perishability, horticultural products are considered particularly vulnerable to elevated losses. Until recently, reliable and systematic estimations of global FLW have been difficult to determine, due to an absence of a universal and consistent quantification methodology for reporting and managing food removed from the food supply chain [
31,
34,
35,
36]. In response, the Food Loss and Waste Protocol was established in 2013, with the first international
FLW Accounting and Reporting Standard ratified in June 2016 during the Global Green Growth Forum (3GF) in Copenhagen.
FLW within commercial food supply chains is shaped by multifarious contributors, including various types of production system inefficiencies and consumer behaviour [
21,
23,
24,
27,
28]. Of increasing concern and importance is the discourse between the food marketing and consumer purchasing behaviour that is perpetuating FLW throughout the food supply chain [
3,
6,
22,
25,
31,
37,
38]. Supermarkets showcase only premium and unblemished product, fabricating unrealistic expectations of how fruits and vegetables should appear. Accordingly, consumers often equate food safety and freshness with elevated cosmetic standards. In combination, these factors have created intrinsically wasteful food systems [
1,
3,
19,
22,
24,
25,
27,
29,
31,
35,
39]. Private food policy and standards aligned with marketing campaigns often reinforce high levels of FLW via cosmetic product specifications and use-by-dates, driving losses up-stream within the food supply chain [
3,
19,
37].
In seeking to address FLW, potential remediation strategies are predominantly directed at the consumer-end of the food supply chain, in part due to difficulties in quantifying loss at the primary production stages [
6]. Highlighting this fact, a newly established protocol for quantification of FLW [
40] specifically quantifies postharvest losses, deliberately excluding pre-harvest losses and consumer waste. There is a premise that commercial farms, operating highly mechanised and technology-centric agricultural production systems have achieved an optimum level of FLW minimisation [
31,
41]. While it is intuitive to presume low levels of FLW within technology-dense horticultural supply chains, there is increasing evidence to the contrary [
21,
22,
25,
27,
28,
42] proposing that such production systems may in fact be more wasteful given the stringent adherence to private food policy and standards.
This study sought to quantify horticultural postharvest losses associated with a highly mechanised commercial tomato enterprise with access to appropriate and effective postharvest handling equipment and infrastructure. The aim of this study was to document accumulative and overall postharvest losses, and to better understand the impacts of technology (e.g., packing shed mechanisation and grading/sorting automation), supply chain length (distance, time, and biophysical conditions), and private food policy and standards (i.e., supermarket standards and product specification) on FLW. To do so, a multi-disciplinary approach was undertaken, based on quantitative documentation of postharvest losses and handling conditions, and qualitative techniques to identify the drivers of the loss and contextualise the findings within the food supply chain.
2. Materials and Methods
2.1. Experimental Design
Two medium-sized (annual pack volume 4500 t) commercial domestic tomato supply chains, with product sourced from the same farm but with divergent market destinations and associated transport distance were assessed. Harvesting and handling practices and biophysical conditions were documented, postharvest loss along the food supply chain was quantified by weight, and interviews were conducted to evaluate how supply chain actors influenced postharvest losses in their decision-making. This study was collectively undertaken in November to December 2014. FLW calculations included postharvest and destination of loss, but did not include pre-harvest losses and consumer waste. However, an opportunistic and independent assessment of pre-harvest losses was undertaken and documented here, but losses were not included with the total postharvest loss for the supply chains assessed. Terminology used in this paper is based on the
FLW Accounting and Reporting Standard 2016, with destination of loss referring to the end use or destination of product removed from the commercial food supply. Pre-harvest loss, such as weather or pest-related damage is about maximising potential, as opposed to addressing losses of material ready for harvest or in subsequent stages of the food supply chain [
40].
2.2. Study Location and Production System
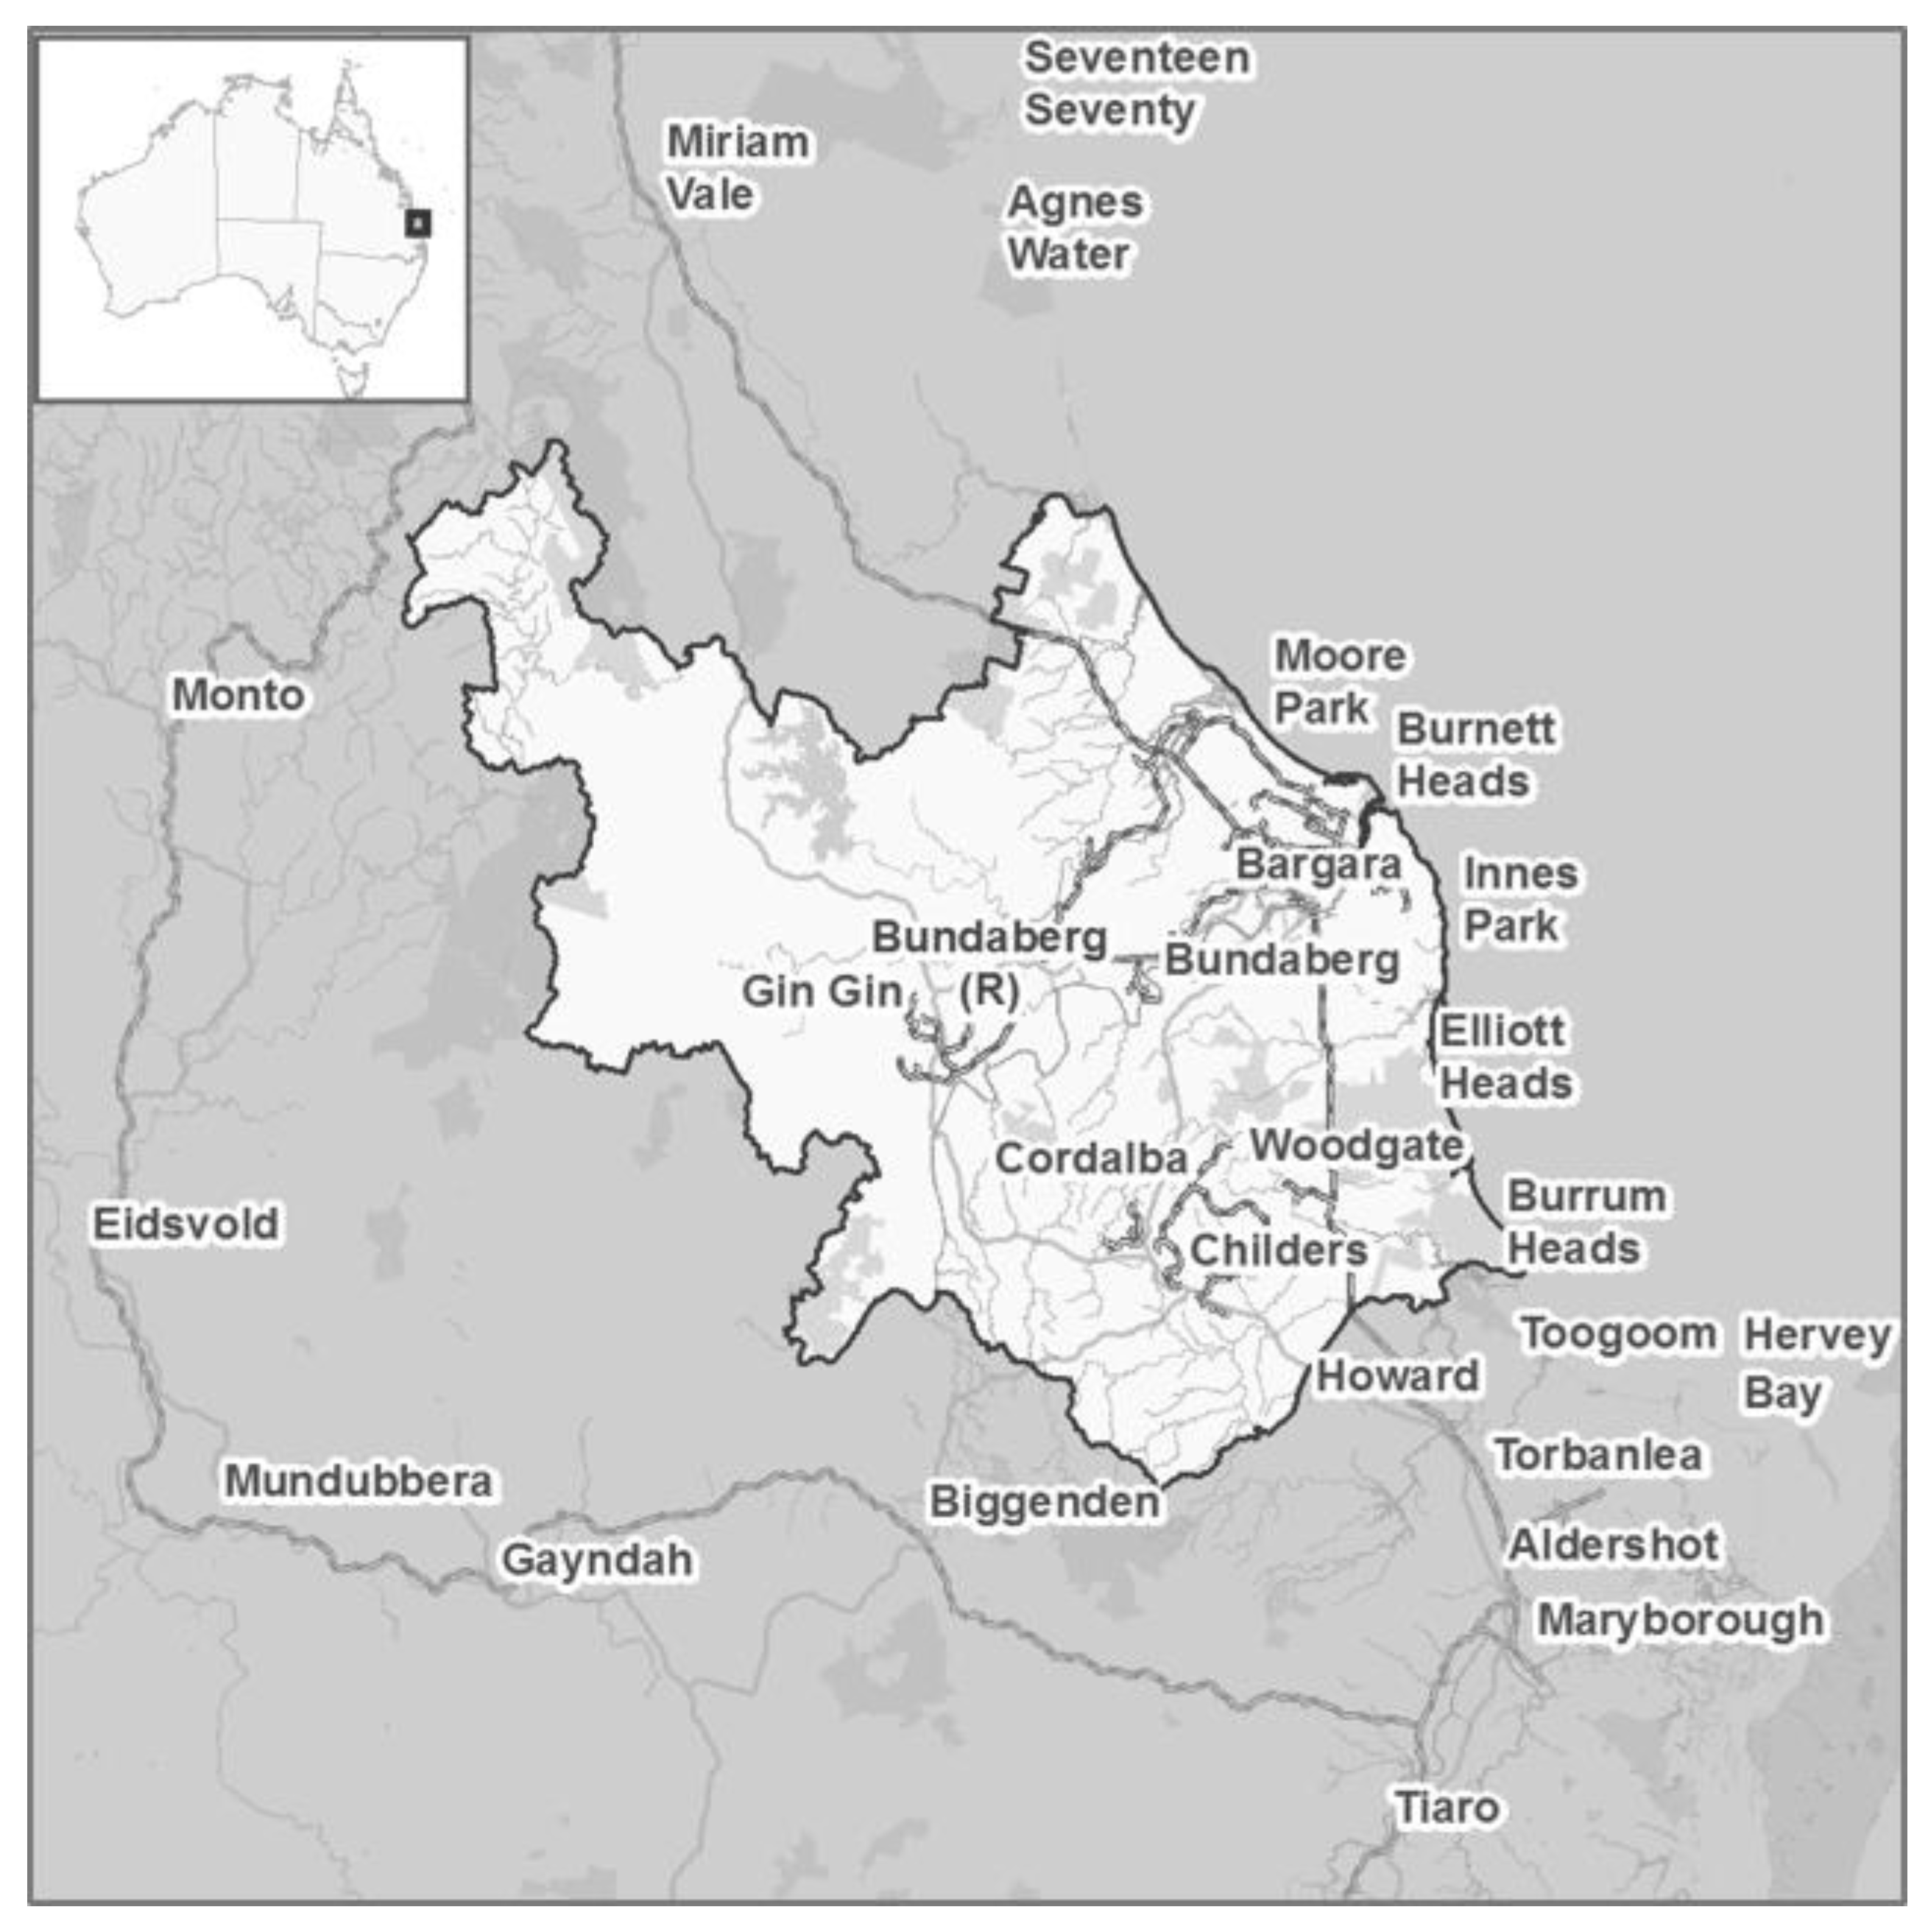
The farm selected for this study was located in Queensland’s Bundaberg region, one of Australia’s largest tomato production regions, with an annual farm-gate value of AUD500 million [
43]. The selection of the farm was undertaken in consultation with the Bundaberg Fruit and Vegetable Growers Association to ensure production; postharvest handling and transport practices were typical for the region. The farm, located in Elliot Heads (
Figure 1), was supplying tomatoes (
var. Lava) to domestic markets in either Brisbane or Bundaberg. Product for the two trials was sourced from separate harvests in the spring/summer season of 2014. Both supply chains were based on tomatoes being trellis-grown in an open field with a rain-fed production system, and incorporated mechanized harvesting, modern and efficient packaging and grading equipment, and access to cool storage infrastructure.
2.3. Supply Chains Assessed
The first supply chain (SC1) involved product sourced during the mid-season harvest (11–18 November) using a mechanical harvest aid, transportation to a commercial packing shed for sorting, grading, packing, and refrigerated storage, then transportation by a fully-enclosed, refrigerated semi-trailer truck to the Rocklea Wholesale Fruit and Vegetable Market, Brisbane, and further transportation by a fully-enclosed, unrefrigerated light truck to a retail outlet in Morningside, Brisbane.
The second supply chain (SC2) involved the same commercial farm and associated harvesting and pre-distribution practices, however, product was sourced from a harvest one month later (10–13 December) at the end of season and was instead transported by a small, fully-enclosed, unrefrigerated truck to a small local wholesale/retail outlet in Bundaberg.
2.4. Quantification of Loss
2.4.1. Field and Packing Shed Horticultural Postharvest Losses
Quantification of loss was based on weight or volume, consistent with direct measurement methods of the
FLW Accounting and Reporting Standard [
40]. Field losses were determined by counting the number of individual pieces of fruit of commercial maturity (one-quarter to full-colour fruit) that remained in-field immediately following a completed harvesting cycle, based on a sub-sample of 608.18 kg, within a transect of 1311.80 m
2. Field losses were then calculated relative to a total harvested area of 8.5 and 12.14 ha respectively for SC1 and SC2. Field loss was defined as mature fruit left on the vine or product on the ground left by the harvest aid and/or bucket pickers, or discarded from the harvest aid where preliminary discarding of product was performed. The primary destination of all field loss was via ‘land application’. ‘Land application’ is the term used to describe the destination whereby losses are discarded through spreading, spraying, injecting, or incorporating organic material onto or below the surface of the land to enhance soil quality [
40].
During the harvest of SC1, a sub-sample of 100 fruits was taken to determine the mean weight of a single tomato at the field and packing shed stages of the supply chain. During the harvest of SC2, three random sub-samples of discarded field and shed product were utilised to determine the causal factors of out-grading. Product that left the supply chain was deemed unsalable based on product specification (i.e., physical blemishes/abrasions, size and shape), colour and maturity, or physical damage (punctures or pathogenic deterioration).
Postharvest loss in the on-farm packaging shed was calculated based on the volume of product removed during sorting and grading, proportional to total volume of product initially arriving at the shed. Packing shed volumes were based on a count of harvest bins with a mean net weight of 330 kg, entering and leaving the packing shed during a complete harvesting cycle. Saleable product was packaged in 10-kg cardboard cartons, and pre-cooled prior to transportation to market within 24 h. The destinations of packing shed losses were partially quantified; they were used for ‘land application’ and ‘animal feed’. ‘Animal feed’ refers to destination of loss by diverting material from the food supply chain (directly or after processing) to animals [
40]. Truck transport for the discarded product was empty at the commencement and cessation of the sampling period. To further validate loss at this stage, packing shed losses were recorded for a further two days consecutive to the SC2 trial period using the same method.
As SC2 represented a late seasonal harvest and was immediately followed by an abrupt cessation of seasonal harvesting due to depreciation of the market, we were also able to determine pre-harvest loss and destination of loss, independent of the SC1 and SC2 postharvest loss trials. Pre-harvest loss included unharvested product from the commercial harvesting cycle, being mature residual product remaining in-field on or off the vine, at the cessation of the commercial harvesting season. On completion of seasonal harvesting a field of 3.64 ha was defoliated in preparation for the next seasons planting. An assessment of pre-harvest loss was undertaken to determine percentage loss relative to the volume of the entire seasonal harvest for the field. Twenty-six trellises were randomly selected within the field of 8400 trellises. The number of individual fruits remaining on each vine was counted and recorded for each trellis and later extrapolated across the field’s entire seasonal harvest based on carton volume leaving the farm.
2.4.2. Wholesale and Retail Horticultural Postharvest Losses
Wholesale and retail losses were determined by individually counting the number of unsaleable fruit based on a sub-sample of 3 × 10.80-kg cartons at the wholesale stage, and a subsequent 1 × 10.80-kg carton at the retail stage. Wholesale losses of the sub-sample were determined on point of arrival at market. Retail losses of the sub-sample were determined at the end of the retail period, when the last of the sub-samples was sold to consumers. For SC1, this was done using simulated conditions following a period of refrigerated storage with the retailer. The sub-sample was collected from the retailer to be held under ambient conditions for 24 h simulating the display period prior to consumer purchase in the retail store. For SC2, the wholesale and retail enterprises were combined, located within the same outlet. Wholesale losses were determined as in SC1. Retail losses were determined by the retailer using a logbook to document daily losses, consistent with the
FLW Accounting and Reporting Standard 2016 [
40].
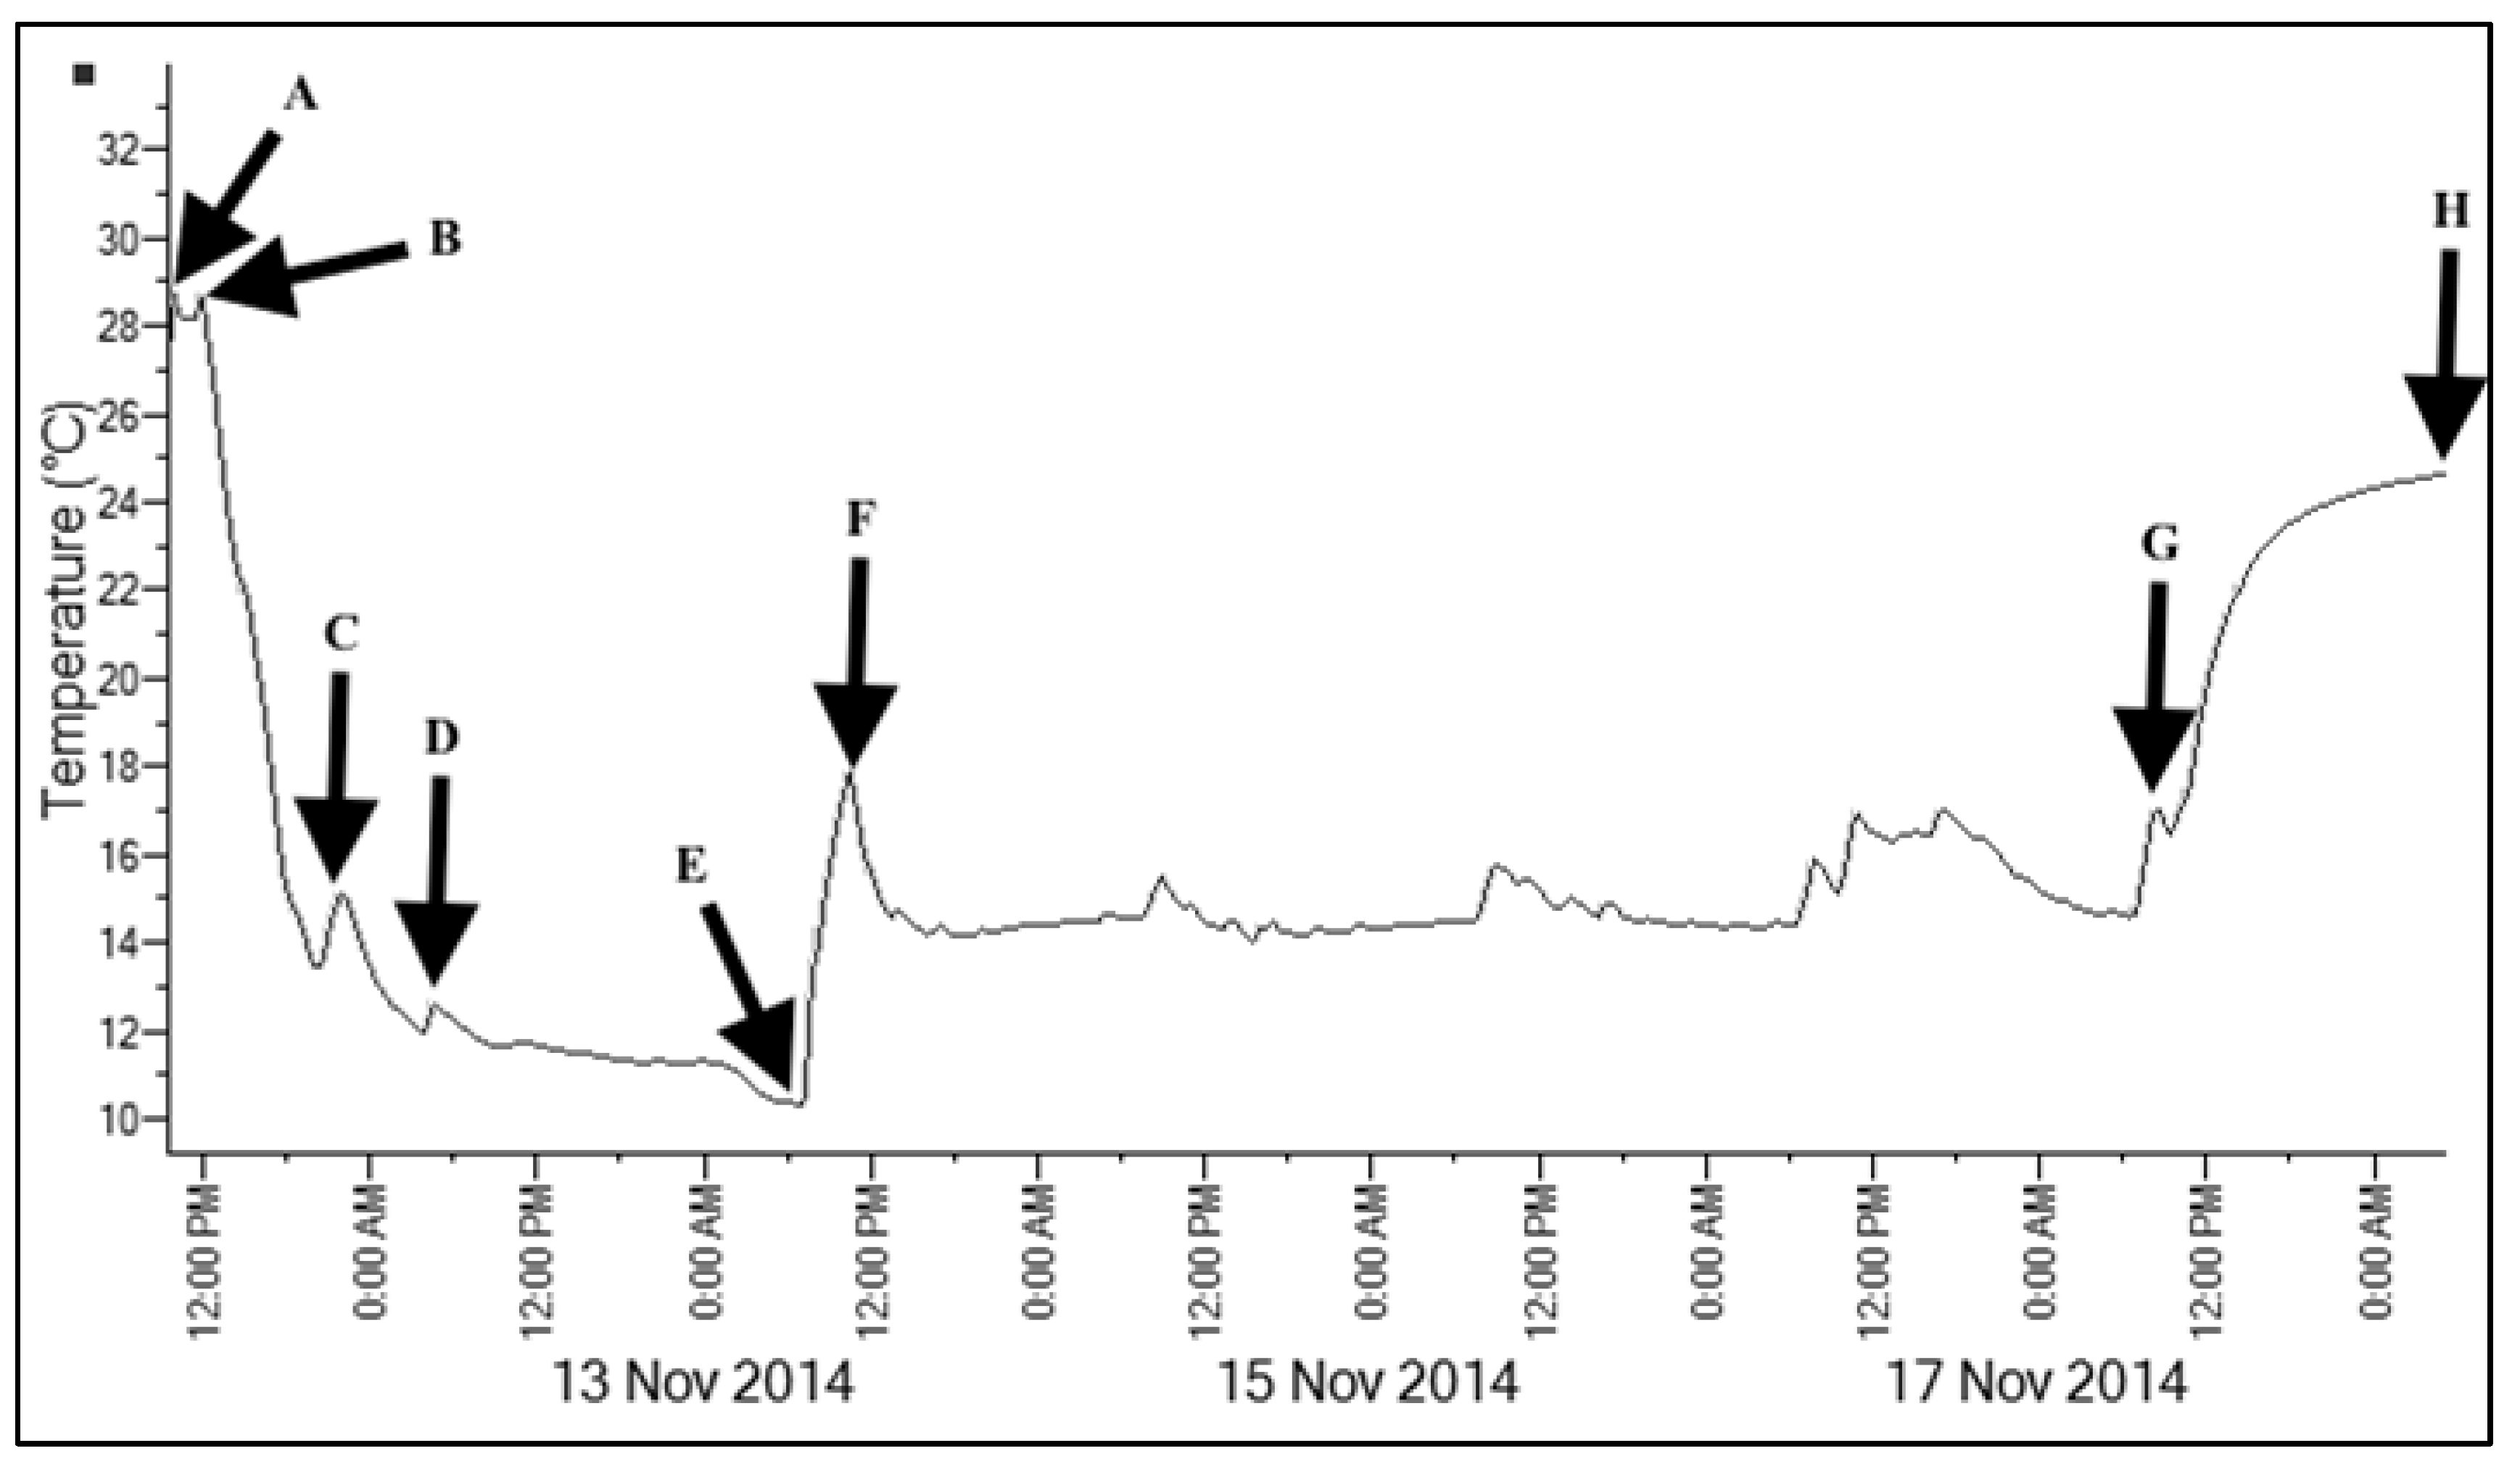
2.5. Bio-Physical Postharvest Conditions
Temperature management along the supply chain was assessed to determine whether storage conditions were a potential contributor to observed postharvest losses. Postharvest storage conditions were assessed based on continuous sub-sampling of mean fruit core temperature from point-of-harvest to retail point-of-sale using an EcoScan Temp 5 with thermistor probe (Eutech Netherlands). In SC2, the storage and transport temperature was also continuously recorded every 2 min using a Tiny Tag Tansit-2 temperature logger (Gemini Data loggers, West Sussex, UK). Temperature loggers were located centrally within the product load during harvest, storage and transport.
Truck routes were concurrently recorded every 2 s, using a Super Trackstick® (Telespial Systems Inc., Burbank, CA, USA) with global positioning system (GPS) referencing uploaded onto Google EarthTM. All loggers and GPS devices were time-synchronised to allow spatial and temporal cross-referencing of truck speed and product temperature.
2.6. Informal and Semi-Structured Interviews
Nineteen informal interviews (
Table 1) along both supply chains were undertaken to understand the decision-making of supply chain actors and how these factors influenced postharvest losses. Interviews were conducted on-farm concurrent to the quantitative assessment, as farm workers went about their daily duties, with each interview lasting up to 20 min. Following the supply chain assessments, five semi-structured interviews (
Table 2) with key supply chain actors and industry specialists were undertaken to reflect on findings and investigate the drivers and impacts of FLW, specifically drawing on the role of technology, supply chain length, and private food policy and standards. With participant consent, all interviews were audio-recorded and transcribed verbatim. Standard thematic analysis techniques were used, supported by NVivo qualitative data analysis Software (QSR International Pty Ltd., version 11.4.0). All subjects gave their informed consent for inclusion prior to participation in the study. The study was conducted in accordance with the Declaration of Helsinki, and the protocol was approved by the Ethics Committee of the University of the Sunshine Coast (HREC S/14/691).
No statistical analysis was undertaken in this case study as data was based on overall actual loss at each point along the chain, rather than replicated mean sub-sampling. This approach is consistent with recent FLW studies [
44,
45,
46] and reflects an emphasis on comparative loss along the chain rather than specific loss.
4. Discussion
Postharvest loss in the two commercial tomato supply chains assessed in this case study was between 40.3% (55.34 t) and 55.9% (29.61 t). The highest incidence of postharvest loss occurred at the harvesting and grading stages of the supply chains, including field and packing shed losses, accounting for between 90.3% and 97.5% of overall losses. The lowest incidence of postharvest loss occurred after the farm-gate, accounting for between 2.5% and 9.7% of overall losses. Retail losses were 2.4% and 5.4%, with the highest incidence in SC1, which was the longer (by distance and time) of the two supply chains. Destination of loss was predominantly to land application, due to the high incidence of point-of-harvest field loss. It is difficult to contextualise these findings due to few comparable horticultural FLW studies of technology-dense supply chains, with no previous FLW assessment of tomato supply chains in developed counties identified in the literature. In an older study Parfitt et al. [
31] reported postharvest losses in tomatoes of 18% to 43% in Egypt. Underhill and Kumar [
45], in an assessment of smallholder farmer tomato supply chains in Fiji, found destination losses of 60.8%, whereas a Cambodian study found losses between 22.5% and 23% in a comparative study between traditional and modern supply chains [
47]. None of these studies assessed in-field point-of-harvest losses, so it is difficult to draw a meaningful conclusion as to relative postharvest losses observed in the two supply chains. Given the importance of global tomato production [
48], the apparent dearth of previous FLW tomato studies, especially pertaining to developed countries, is interesting. In comparison to global FLW loss, where it is widely accepted that one-third of total agricultural production is lost or wasted along current food supply chains [
27], the level of FLW within the two Bundaberg tomato chains appears to be comparatively high.
The finding that loss was concentrated at the primary production end of the chain is consistent with a study [
27] of FLW in North America and Oceania, where 26% of FLW was attributed to the primary production level and 12% to the distribution and retail stages [
27]. However, the present results are inconsistent with Lipinski et al. [
24] who reported 24% of total production was lost at the point of production, and another 24% during transport and storage, and Griffin et al. [
42] who found losses of 20% at primary production, 1% during processing and 19% during distribution. An American report described losses of 15% to 35% at the production stage and 27% at the retail level [
30]. While much of the current literature advocates equal losses between the retail and primary production ends of the supply chain, the omission or limited inclusion of point-of-harvest loss would appear to have resulted in proportionally higher losses elsewhere along the chain. Results in this study were consistent with the consensus that horticultural commodities experience comparatively higher FLW than most other commodities, with FLW at around 50% of total production [
28,
36,
39,
49]. Postharvest losses in our study exceeded findings of a synthesis report [
49] indicating horticultural postharvest losses in a developed country between 2% and 23% at the production end, dependent on horticultural commodity. However, our study was more consistent with an Iranian study [
50] finding postharvest losses in strawberries of 35% to 40% and a study from the United Kingdom [
39] stating that characteristic losses for fresh vegetables could be as high as 50% in the primary production stages of a fresh food supply chain.
Few studies of FLW have sought to quantify and segregate destination of losses [
28,
29,
39,
42]. Noting the exclusion of in-field point-of-harvest losses in quantifying FLW in those studies, it is not surprising that landfill, rather than land application, is the predominant destination of loss.
High levels of FLW are immanent to horticultural production systems of developed countries, driven by fierce competition and financial incentives that have crafted the current ‘business model’ that favours wasteful practices [
2,
28,
35,
39]. Edible products are being removed from the commercial food supply chain as outgrades deemed cosmetically defective [
31]. Private standards, prescribing ‘perfect’ product ensure high levels of FLW, inducing consumer intolerance of ‘substandard’ product and impacting purchasing behaviour [
3,
22,
28,
37]. Extension officer 2 broached the subject of consumer demand and the implications of those at the primary production level. Among consumers in developed countries, there was limited understanding around the implications and prevention of waste, [
3,
6,
22,
25,
31,
37,
38] perpetuated by supermarkets who showcase only premium, unblemished product fabricating unrealistic expectations of how fruit and vegetables should appear.
The quantification of FLW in the context of high-technology production systems in developed countries has received relatively little attention. The premise that developed countries operate highly efficient agricultural systems optimising FLW minimisation [
31,
41], may in part explain this situation. Central to this view is a pre-occupation with consumer waste [
6] in affluent populations as the largest and most visible portion of FLW [
31,
35] and that, given the inherent difficulty in changing human behaviour [
24], no significant or further FLW reductions can be achieved [
51]. In this study, to the contrary, the highest postharvest losses occurred at the primary production end of the chain. Discussions with industry experts revealed the potential role of technology, particularly packing shed mechanisation, in driving high levels of FLW due to uniformity of product in the sorting and grading processes. Contributing factors of FLW observed in the two tomato chains in the study were not due to poor postharvest or storage practices, or transport distance, but rather a series of commercial decisions. The most apparent driver was the cost-benefit of harvesting, based on market price, supply volume, and perceptions of retailer and consumer purchasing behaviour, which effectively made high levels of loss an economically acceptable outcome. The supply chain actors were both aware of the extent of loss and had strong and consistent views as to these key contributors. With only 44.1% and 59.7% of harvestable crop reaching the consumers of the two supply chains assessed, perhaps there should be discussion of a food “waste” chain as opposed to a food “supply” chain.


