Article

Growth and Tissue Elemental Composition Response of Butterhead Lettuce (Lactuca sativa, cv. Flandria) to Hydroponic and Aquaponic Conditions

by
Tyler S. Anderson
1,
David De Villiers
2 and
Michael B. Timmons
1,*
1
Department of Biological and Environmental Engineering, Cornell University, Ithaca, NY 14853, USA
2
Department of Horticulture, Cornell University, Ithaca, NY 14853, USA
*
Author to whom correspondence should be addressed.
Horticulturae 2017, 3(3), 43; https://doi.org/10.3390/horticulturae3030043
Submission received: 29 April 2017 / Revised: 14 July 2017 / Accepted: 19 July 2017 / Published: 26 July 2017

Abstract

:
The primary objective of this research was to compare lettuce performance under conventional hydroponics at pH 5.8 (referred to as H5), hydroponics at pH 7.0 (referred to as H7), and recirculated aquaponic water at pH 7.0 (referred to as A7). Aquaponic nutrients were supplied by continuously recirculating water between a fish rearing system (recirculating aquaculture system or RAS) and the lettuce growing system (with the sole addition being chelated iron). This paper builds upon our previous research where we found that H7 produced 26% less shoot fresh weight (FW) growth than H5 and an 18% reduction in dry weight (DW). In this research, we also evaluated the inorganic hydroponics nutrient solution at pH 7.0 (H7) to provide continuity between experiments and to isolate the pH effect. The A7 plant biomass responses were not different from H5 in all biomass response categories. H7 was different from H5 in shoot FW, DW, and DW/FW, as well as root FW and DW. H7 was different from the A7 in shoot FW, DW/FW, and root DW. There were no tissue elemental differences between H5 and H7 except Cu. The Ca and Na contents differed between H5 and A7, while the microelements Mn, Mo, and Zn differed. Generally, the elemental tissue differences between treatments were proportional to the differences for the same elements in the nutrient solutions. Aquaponic systems are often viewed to be more complicated and more risky because two complex systems are being joined (hydroponics plus RAS). However, the aquaponics system proved to be surprisingly simple to manage in daily operations. Our data suggested that the aquaponics system (A7), which was operated at a higher pH 7.0, was able to offset any negative biomass and elemental effects that occurred in the inorganic hydroponic pH 7.0 treatment (H7) from its increased pH and less optimized nutrient solution elemental concentrations.

1. Introduction

Hydroponics is the soil-less culture of plants in nutrient solution that contains ions of all of the necessary elements for good plant growth. Resh [1] provides a review of the major hydroponic production systems, e.g., nutrient film technique (NFT), deep water culture (DWC) or raft [2], and soil-less media beds. Hydroponics is an increasingly important field due to its increased nutrient, water, and space use efficiencies [3]. Another form of sustainable food production is from recirculating aquaculture systems (RAS) that produce aquatic and/or marine organisms. RAS is an intensive form of fish or other aquatic organism production (henceforth referred to as fish for brevity) using supplemental aeration and biological filtration to maintain the necessary water quality conditions [4].
In such systems, fish excrete organic nutrients into the recirculating water that are waste products from feed ingestion and digestion. Wastes produced by the fish are primarily N, P, and C (carbon) along with feed micronutrients that are not fully absorbed by the fish. The composition of fish excretions after biological processing by the fish of what they are normally fed commercially has been reported as 78–80% of ingested C, 66–86% of ingested N, and 50% of ingested P [4,5]. These waste nutrients can be used to support a coupled plant hydroponic system.
RAS biological filters oxidize ammonia and nitrite, both toxic to fish, to nitrate. Nitrate can become toxic, particularly to salmonids, as nitrate levels elevate above an NO3-N concentration of 80 to 100 mg/L [6]. Thus, using a hydroponic component to remove nitrate from the RAS water would be beneficial to fish grown in RAS.
Aquaponics combines hydroponics and aquaculture. The National Organics Standards Board defines aquaponics as follows [7]:
[a] recirculating hydroponic system in which plants are grown in nutrients originating from aquatic animal waste water, which may include the use of bacteria to improve availability of these nutrients to the plants. The plants improve the water quality by using the nutrients, and the water is then recirculated back to the aquatic animals.
Such systems make multiple uses of resources such as water and nutrients, and share infrastructure, management, and labor costs [4,8,9,10]. Coupling the hydroponic and RAS together can remove excess nitrogenous waste through uptake and utilization within the food crop. Aquaponically grown crops are potentially one of the few ways to produce certified organic hydroponic products, dependent largely on individual state or country regulations on what is considered acceptable organic labeling. Love et al. [11] produced a market snapshot and economics paper in 2015 looking at the aquaponics industry.
Hydroponic systems are typically designed to operate around a pH of 5.8 to maximize nutrient availability in solution [12], while fish RAS operate best around a pH of 7.0 to balance issues of carbon dioxide toxicity (problematic at low pH) and ammonia toxicity (problematic at high pH). Water management issues arise when combining the plant and fish systems into an aquaponics system due to the different pH targets for the two systems. Operating the fish system at a pH of 5.8 is not feasible due to carbon dioxide toxicity, so the question of how the plant response is affected at the fish system pH of 7.0 has not been clearly evaluated at this point. It is well known that pH affects plant nutrient availability in soil-based cultures [13], and such could be a similar case for hydroponics and aquaponics.
The objective of this research was to compare lettuce performance under conventional hydroponic conditions (pH 5.8) and at elevated pH (pH 7.0) to lettuce performance produced using recirculated aquaponic water at pH 7.0. The research reported in this paper follows our previous study [14], where we investigated lettuce growth response to the impact of pH and alkalinity, but only for hydroponic conditions. The previous study established a baseline for comparison to the results from this experiment.

2. Materials and Methods

An experiment was conducted in a conventional glass greenhouse to investigate the effects of integrating RAS upon the growth and nutrient responses of butterhead lettuce. The experiment consisted of three trials run sequentially using six identical tubs each trial (fully described below). Trial 1 lasted for 43 days (seed to harvest) and Trials 2 and 3 lasted for 35 days to reach target harvest weights of ~150g. The treatments investigated included a conventional hydroponics nutrient solution with pH controlled at pH 5.8 (referred to as H5), the conventional hydroponics nutrient solution maintained at an elevated pH 7.0 (referred to as H7), and a continuously recirculating aquaponics system maintained at pH 7.0 (referred to as A7). A7 was provided nutrients solely and continuously from the RAS, with the exception of chelated iron and potassium carbonate (K2CO3) for pH control. The growing conditions mimicked industry norms for deep water hydroponics, including spacing and the target fresh weight at harvest. In depth details are provided below.

2.1. Greenhouse Description

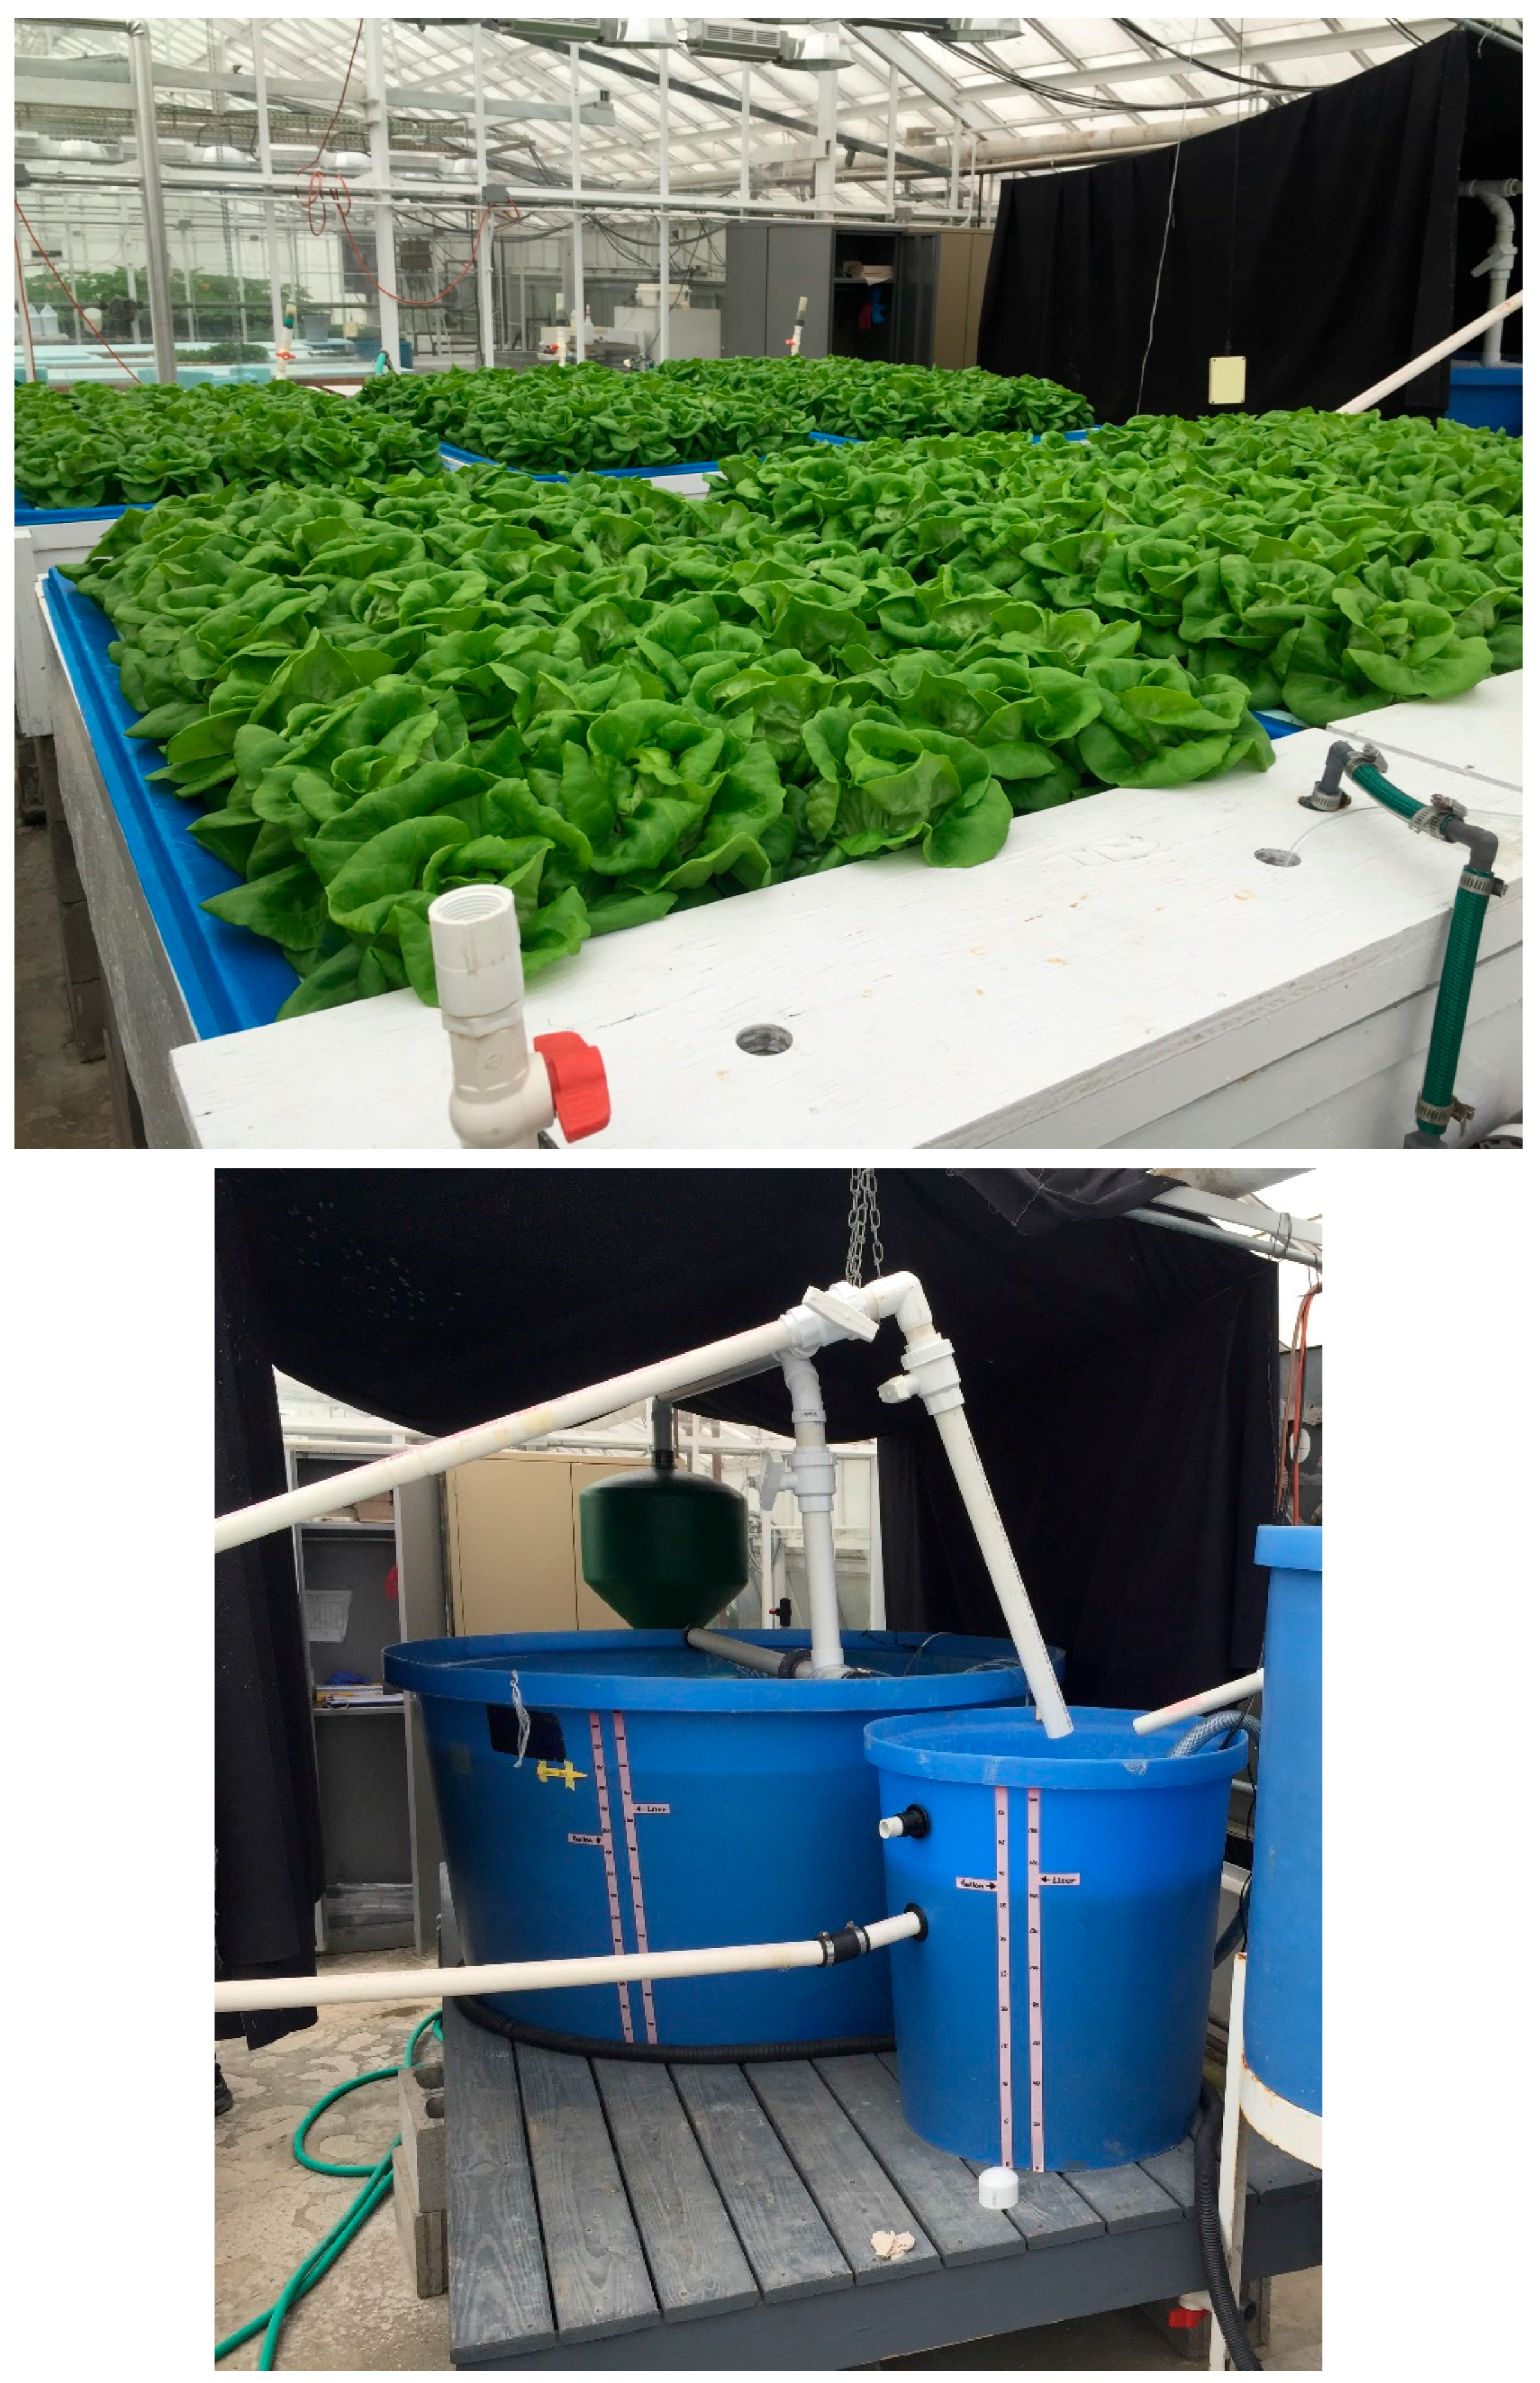
The experiments were conducted in Ithaca, NY (42°26′56.2″ N 76°28′08.3″ W), in a section of glass greenhouse range with dimensions 7m × 10m × 7m to the ridge. A scaled floor plan of the east west oriented greenhouse is shown in Figure 1, and photos of the experimental arrangement are provided in Figure 2. The carbon dioxide, humidity, aerial temperature, and light intensity were logged by an Argus monitoring and control system (Argus Control Systems Ltd., Surrey, BC, Canada) The Argus system controlled the aerial temperature and daily light integral (DLI: the amount of radiation received in the photosynthetically active area (PAR), in units of moles per meter squared per day). The environmental parameters were sampled every 2s, averaged every 2min, and logged.
Twenty high pressure sodium (HPS) lights (General Electric, 400 W clear S51/O, Mogul Base rated ED18HSP, LU 400/H/ECO, GE Headquarters Offices, Fairfield, CT, USA), arranged for the most consistent light provision at the crop level, were used in conjunction with a LiCor quantum sensor (LI-190R) (LI-COR Biosciences, Lincoln, NE, USA) for supplementing natural light to a consistent DLI. The greenhouse was equipped with evaporative pads on the north side and ventilation fans on the south side for use in cooling as necessary. Heating, when required, was provided by two water-to-air heat exchangers on opposite sides of the greenhouse, whose fans also served to rapidly mix air in the greenhouse to an even temperature. Overhead fans for vertical air flow to avoid tipburn were turned on at approximately day 20. The carbon dioxide was not calibrated, controlled, or investigated in any way in these experiments, and was assumed to be ambient.
The greenhouse air temperature settings were split between day/night settings. The day period was between 07:30 and 17:30 (military time) with a heating set point of 24°C and a cooling set point of 25°C. The night period was between 20:00 and 05:00 with a heating set point of 19°C and a cooling set point of 20°C. Two-and-a-half hour ramping periods were used to bridge the day and night period set points.

2.2. Tub Descriptions

Six high-density polyethylene (HDPE) growing tubs (1.82m × 0.91m × 0.3m, 0.425m3) were used for the experiment as seen in Figure 1 and Figure 2. An earlier preliminary trial had been conducted to verify the absence of any positional effect of tub location within the 6-tub array. The growing rafts floating in the tubs were 1.31m above the floors and 1.26m below the light fixtures. Fifty lettuce plants (5 rows of 10 plants per row) were grown at 30 plants per square meter in rigid Styrofoam rafts of 25mm thickness. Round 25mm diameter holes were spaced at 200mm on center for rockwool plant plugs, and the rows were staggered for optimal uniformity of light on all sides. Each tub continuously operated a recirculating pump and two coarse air stones (Sweetwater AS-2s rated at 0.1CFM/stone, 1.9cm × 1.9cm × 3.8cm, Pentair AES, Apopka, FL, USA) to ensure strong mixing and to maintain dissolved oxygen (DO). The diffusing air stones were confirmed to be flowing vigorously multiple times weekly. Recirculation pumps (24Lpm) mixed the water in each tub at a rate equal to a hydraulic retention time of 18 min. Water lost through evapotranspiration or evaporation from the hydroponic tubs was replaced with the tub’s appropriate treatment solution.
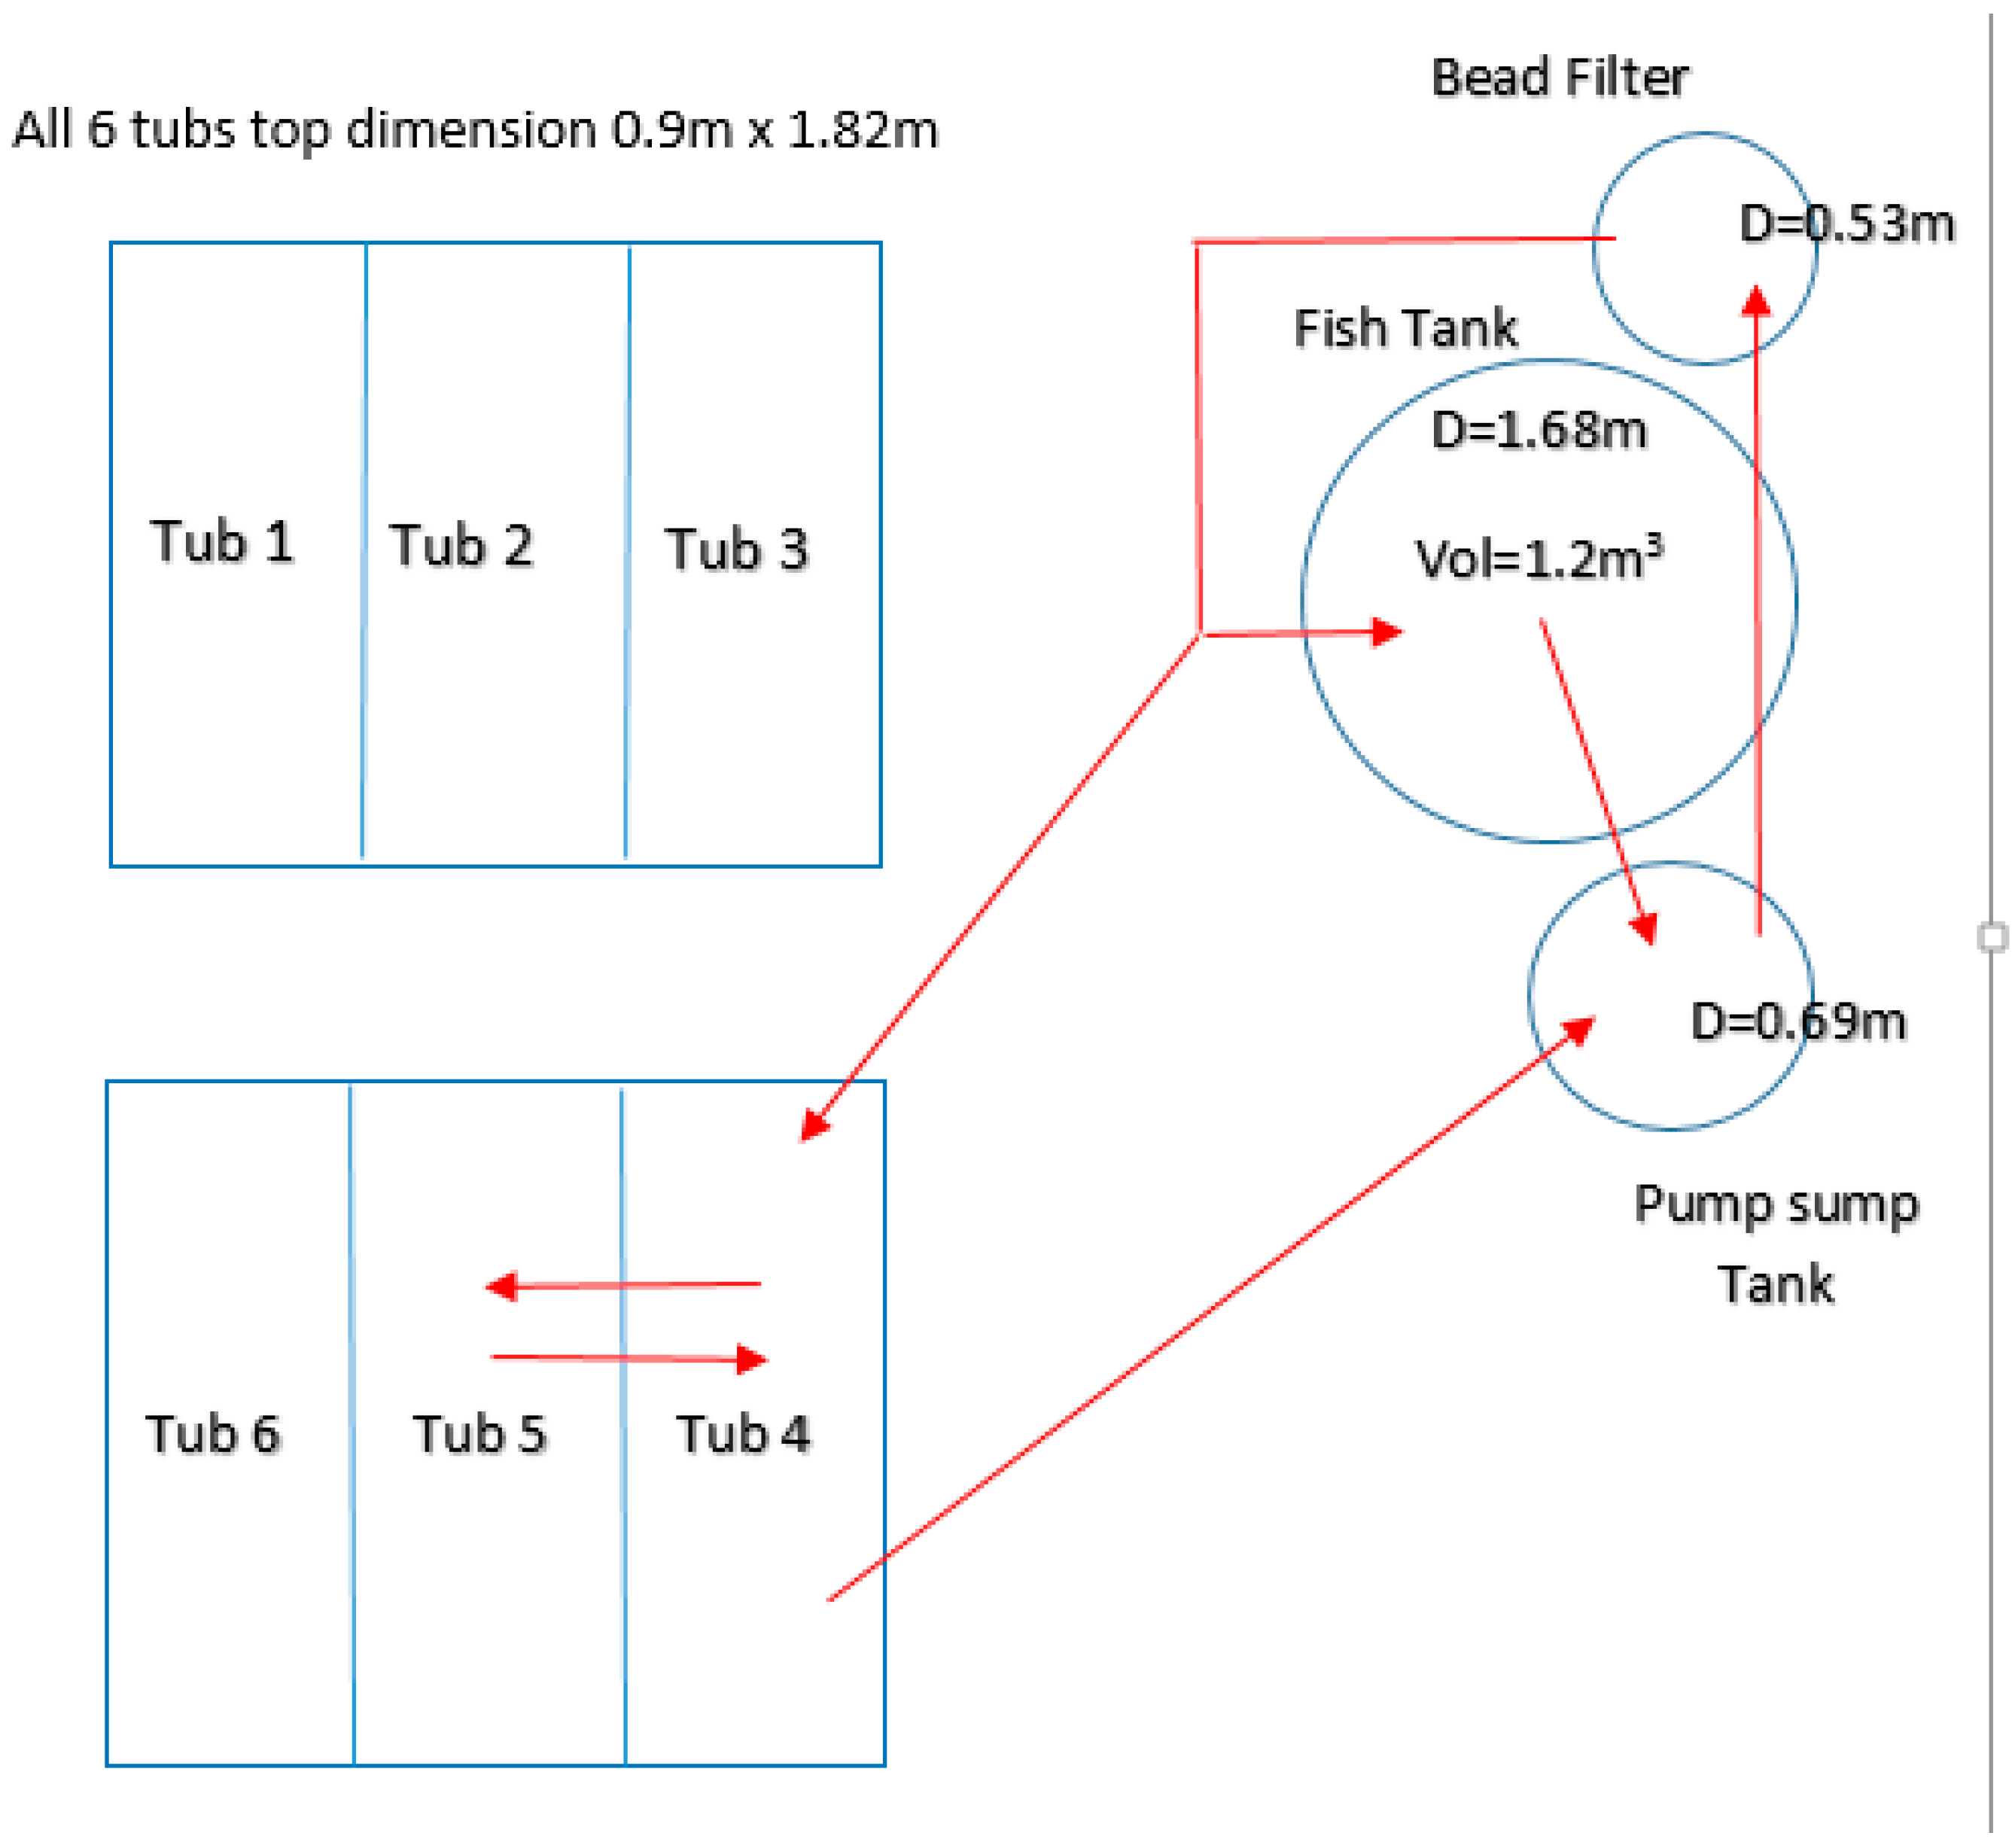
Tubs 4 and 5 were A7 tubs for all three trials. A continuous supply of water from the RAS was recirculated with the aquaponic tubs at approximately 10Lpm by diverting a portion of the return flow from the bead filter instead of the total flow being returned to the fish tank. No other water was supplied to the A7 tubs. The mixing of the two aquaponic plant tubs was modified such that water from tub 4 was transferred to and mixed with tub 5 and vice versa. These two tubs were connected (in addition to active pumping in each tub as the primary mixing) via a 38mm pipe between the bottoms of each tub for passive water equilibrating. A standpipe in Tub 4 returned water to the RAS and maintained the target water level height. Given the continuous mixing of water between Tub 4 and Tub 5, data from these two tubs are not completely independent replicates. The A7 tubs were not drained or cleaned between trials except for a surface cleaning of the floats. Blackout curtains were laid over the tubs (on top of the floats) between trials to minimize light and algae growth.
The root zone temperatures (RZT) and pH values in the tubs were recorded daily for all of the experiments using hand-held meters.

2.3. Fish Aquaculture System

The koi rearing tank was a 1.2 cubic meter (1.5m diameter, 0.76m depth) round tapered HDPE tank with the water depth maintained at 0.51m. The tank was operated in a manner consistent with current commercial practices, using air stones to maintain oxygen levels and an inlet spray bar to create tank water rotation that moved solids to a center drain. The fish rearing tank was curtained off by two layers of standard greenhouse blackout curtain hung at ~7m high from the east side of the rearing tank (Figure 1 and Figure 2) to the bead filter (Figure 3) to minimize algae production and heat load.
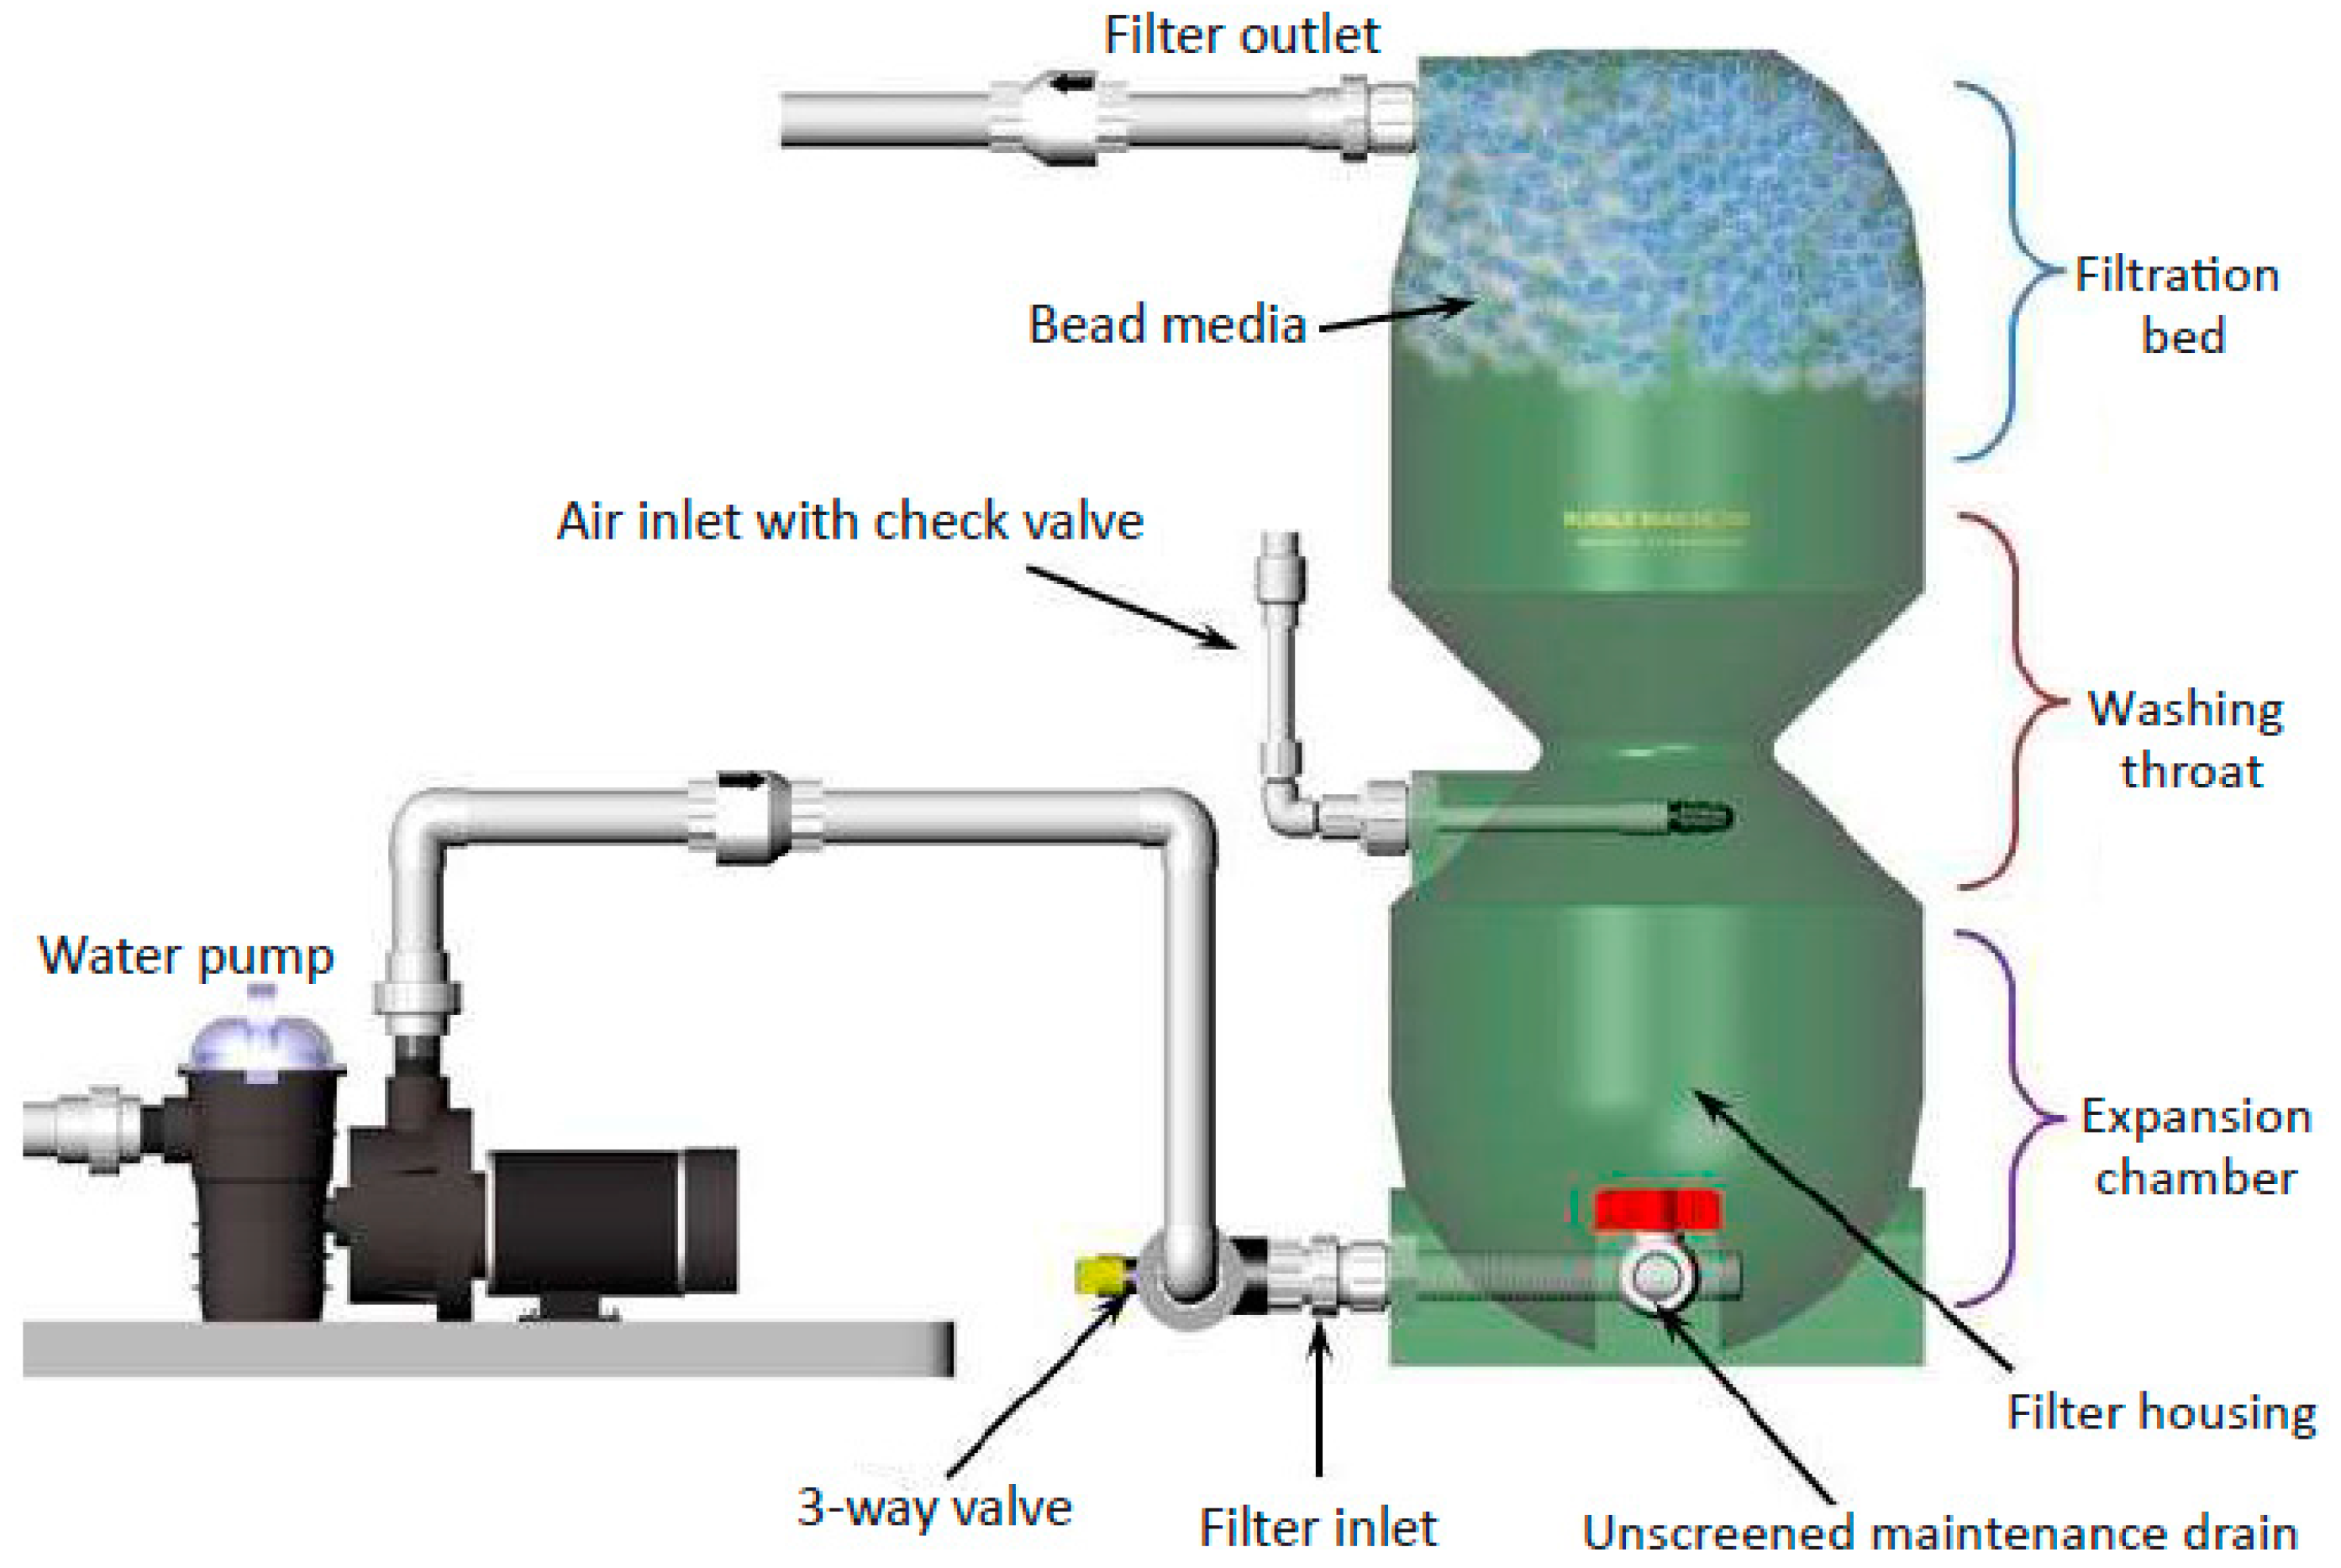
All recirculating water from the fish tank was continuously pumped through a commercial bead filter (Aquaculture Systems Technology, Inc., Baton Rouge, LA, USA; Figure 3). In the months prior to this experiment and during the experiment on a weekly basis, the bead filter was discharged by first collecting the discharge effluent (0.5 cubic meter) in a separate tank and allowing the solids to settle for one to two hours, and then returning 90% of the water back to the fish system. None of the waste discharge was ever used directly by the A7 tubs. The pumps used for recirculating water from the fish tank through the bead filter created a hydraulic retention time in the fish tank of 20 minutes.
Municipal water (tempered during winter and supplied as necessary) was added to the RAS to replace water lost through evaporation or from waste water discharge. This water was treated first by passing it through an activated charcoal filter using 50kg of activated carbon (Aquatic Ecosystems, ProLine® AC55s, Apopka, FL, USA).
Koi feed was purchased from Blackwater Creek Farms (Eustis, FL, USA, www.koisale.com), as a small floating extruded pellet, called Max Growth Diet. All food was used within 6 months of the mill date to ensure nutritional quality. The guaranteed analysis provided from Blackwater Creek Farms was min 38% crude protein, min 8% crude fat, max 4% crude fiber, min 1% phosphorus, and max 10% moisture. Our feed’s elemental analysis is shown in Table 1; the analysis was done using inductively coupled plasma atomic emission spectroscopy (ICP-AES).
The aquaculture tank carried 53 koi fish and a system biomass of 8–10kg of fish within the 2200L system that included the two A7 tubs. The fish were supplied as 1g fingerlings by Blackwater Creek Farms (Eustis, FL, USA) in February of 2014 and were continually culled to maintain a system biomass of ≤10kg (10kg/m3 density). The low fish density was maintained to minimize any problems due to power interruption or loss of supplemental aeration. Fish were fed 90g of feed a day on weekdays (~1% of the system mass/day) in two feedings, and 60g/day in one feeding on weekends.

2.4. Crop Seedling Preparation

Butterhead lettuce (Lactuca sativa, cv. Flandria, pelleted) was grown in individual rockwool plugs (Grodan AO25/40, 25 mm; Rockwool B.V., Grodan, Roermond, The Netherlands). Rockwool cubes were prepped with thorough soakings and rinses in reverse osmosis (RO) water and H5 nutrient solution (described below and given in Table 2) to remove any areas of excess lime, and then individually seeded. After germination, seedling trays were placed in an ebb and flood system (four flood cycles per day), where they were grown for 12 days. The ebb and flood stage supplied H5 nutrient solution for all seedlings. Plants were inspected for uniformity when the first true leaves were approximately 1 cm in length on day 7. Large, small, and abnormal plants were marked with toothpicks and left in place. On day 12, the seedlings were transplanted into the tubs to begin each trial. The toothpick-marked seedlings were first discarded, and then the remaining seedlings were placed randomly on the Styrofoam rafts inside the tubs. After transplanting, the plants were grown until an estimated 150g lettuce average head size was reached. All trials and treatments were seeded, transplanted, and grown the same except as required by treatment.

2.5. Experimental Design and Water Quality Treatments

The three treatments, H5, H7, and A7, were investigated in three trials conducted over the following dates: Trial 1 30 June to 12 August; Trial 2 14 August to 18 September; and Trial 3 20 October to 24 November.
Three tubs were assigned to H5, one tub to H7, and two tubs to A7 within each trial. We assigned the extra tub to H5, since our primary objective was to compare A7 to H5. H7 was included as a single tub primarily to compare to our previous research, where we compared the performance of H5 and H7 [14]. H7 was randomly selected from the four hydroponic tubs each trial while not repeating a previous trial position. H5 treatments filled the remaining positions.
Adjustments to pH for the H5 and H7 treatments were made as needed with 1M HNO3 and 1M KOH, while adjustments to the A7 treatment were made with 1M K2CO3 (no acid was required). Potassium carbonate was used for A7, because it gave more consistent control of the pH by contributing about half of its ions to raising the pH and the rest to increasing alkalinity. The increased alkalinity reduced fluctuations of pH from aqueous carbon dioxide shifts caused by feedings and nitrification. The addition of potassium carbonate was calculated via titration of a 3L sample, taken from the fish system.
Electroconductivity (EC) was monitored but not controlled within the experiments. EC measurements were taken using a pin style conductivity tester (EC Testr11+, Oakton Instruments, Vernon Hills, IL, USA) that was calibrated to 1413µS/cm and validated with de-ionized (DI) water and a reference thermometer. The aquaponic system was diluted several weeks prior to the start of the experiment to bring the EC closer to the 1300µS/cm starting concentration of the H5 and H7 treatments.

2.6. Nutrient Conditions

The starting and ending concentrations of primary and incidental elements are shown in Table 2 for all treatments. Water samples were analyzed using a fully automated inductively coupled plasma-atomic emission spectroscopy (ICP-AES) machine to determine the elemental values. For all trials, the four tubs associated with H5 and H7 were filled with 425L of modified half strength Sonneveld and Straver lettuce solution sans silicon [16]. Given the generally small percentage changes in elemental concentrations we had seen in our previous research, we did not collect water samples between the starting and ending conditions.
The nutrient solution for H5 and H7 was created by diluting prepared 100× concentrates that we refer to as Stock A and Stock B. Stock A contained calcium nitrate (Ca(NO3)2·3H2O), chelated iron (Sprint 330, Fe-DTPA), ammonium nitrate (NH4NO3), and 23% of the total required potassium nitrate (KNO3). Stock B contained the remaining required potassium nitrate (KNO3), potassium phosphate monobasic (KH2PO4), Epsom salts (MgSO4·7H2O), manganese sulfate (MnSO4·1H2O), boric acid (H3BO3), ammonium molybdate (NH4)6Mo7O24·4H2O), zinc sulfate (ZnSO4·7H2O), copper sulfate (CuSO4·5H2O), and potassium sulfate (K2SO4). The tubs were pre-filled with the majority of the required water, and the concentrates were added slowly and sequentially at a ratio of 1:1 with vigorous mixing. Additional nutrient solutions for replenishment of water lost through evapotranspiration or evaporation for these tubs were prepared in 200L HDPE barrels and covered from light penetration when not in use.
A week prior to transplanting during Trial 1, the two aquaponic tubs were filled with carbon-filtered water and the flow control valves were adjusted for continual recirculation at ~10L/min from the aquaculture fish tank system. This allowed the combined systems to come into equilibrium prior to the start of the experiment. On each trial’s transplant day, the aquaponic system was supplemented with chelated iron (Sprint 330, Fe-DTPA) at 2mg/L as equivalent elemental iron to ensure adequate available iron for each trial, since the degradation of chelated iron by ultraviolet light has been recorded [17]. This explains why the Fe value for A7 is higher than 2mg/L in Table 2 (a portion of the Fe is unbound to chelator and is in residual oxidized forms). All of the treatments received Fe-DTPA at the beginning of each trial. This protocol decision was made to ensure sufficient chelator for iron availability in a system that was constantly exposed to indirect and diffuse sunlight primarily on the fish tank side of the system.
The A7 treatment’s carbon-filtered water had average macro-elemental contents of 50mg/L Ca, 13mg/L Mg, 5.5mg/L S, and an EC of 450µS/cm. No adjustments or additions were made to the A7 water except for the addition of chelated iron and the daily adjustments of pH with potassium carbonate.
Note that while molybdenum (Mo) was not detectable at the end of each trial from the samples taken from the A7 tubs, the seedling phase did include the standard H5 nutrient solution with Mo at target values, and thus all plants had equally available Mo until transplant into their respective treatment tubs.

2.7. Data Collection and Analysis

The data collection included head fresh weight (FW) (24 samples/tub/trial) and dry weight (DW) (12 samples/tub/trial), root FW (24 samples/tub/trial) and DW (12 samples/tub/trial), root FW and DW contained within the rockwool plug (Trial 1: 5/tub, Trial 3: 4/tub, henceforth referred to as “rootball”), and leaf count and leaf surface area (Trial 3 only, 5/tub). Rootballs, which consisted mostly of the main taproot, were carefully extracted from the rockwool plug using tweezers. No rootball data are reported from Trial 2 due to loss of data. Tissue elemental analyses were done (shoots and roots) using three samples per tub per trial, where each sample consisted of 3 heads.
The fresh weights for the head and root data were collected immediately in the greenhouse on a scale accurate to 0.1g. Heads were removed by slicing the hypocotyl at the level of the rockwool plug. Root data were collected from individual plugs by slicing roots off across the bottom of the rockwool cube, and then separately removing and weighing the root material contained in the cube. Heads pre-selected randomly for dry weight and tissue analysis were rinsed around the hypocotyl interface with running RO water and a gentle tactile brush to remove any rockwool fiber, aged algae, and salts that may have transferred during growth and harvest. The head and root portions were placed in individual paper bags. At the end of the harvest day, bagged samples were transferred to 70°C drying ovens for 6–8 days. The dry weights were taken on a scale accurate to 0.001g. In Trial 3, some missing data points occurred due to either failed plants or root tangling. Plants randomly selected for leaf count and leaf surface area were immediately prepared for analysis upon removal from the root. Preparation consisted of dissecting heads to separate leaves, and counting any leaves that were greater than 1cm. “Dissected” heads were then passed through a cumulative leaf surface area machine (LI-3100C area meter, LI-COR, Lincoln, NE, USA) that was carefully cleaned and calibrated immediately prior to running the samples. The heads were bagged for DW analysis.
The elemental analysis used dry tissue from three combined samples per tub, per trial. Each sample represented three randomly chosen heads, such that each tissue analysis was an averaged sample from the corresponding tub (nine heads per each trials’ tub). For the dry tissue analysis, a hot plate-assisted acid digestion process was first performed (EPA Method No. 3050, 3051, 3052, and ELAP Method No. 4084) using high purity nitric and perchloric acid in Teflon containers. A combustion analysis was used to identify the percentage carbon and nitrogen contents. Dry ash extraction was used in Trial 3 to determine the values for B. The hot plate-assisted acid digestion method under predicts concentrations for boron due to volatization. All of the samples were analyzed using ICP-AES using an automated Vulcan 84 digestion unit. Corrections to all element values for variations in volume and instrument drift were performed using the intensity of the Yttrium 224 nm line.
A precipitate was found in the H7 tubs between trial cleanings. The precipitate samples were collected and analyzed with hot plate acid digestion plus ICP-AES. These particular results are presented in the discussion section.

2.8 Statistical Analysis

Mixed effect models using least squares analyses were conducted using JMP Pro software (version JMP PRO 11; JMP a Division of SAS, Cary, NC, USA). In the final model, shoot (FW, DW, and DW/FW), root (FW, DW, and DW/FW), elemental content, and leaf count and surface area (trial 3 only) data were treated as response variables. Treatment and trial were treated as fixed effects, and the tub nested within a trial was treated as a random effect. No adjustments in the analysis were made for the rapid mixing of water between Tub 4 and Tub 5 used for the aquaponic treatment (A7). The data were analyzed as one data set with three trials. For the leaf count, leaf surface area, and dry ash extraction, the trial effect was dropped from the mixed model and tub was entered as a random effect due to these response variables only being run in Trial 3. Residuals were thoroughly checked for normality and constant variance, not only versus the predicted value, but across trials. Treatment was also addressed as a fixed effect. Different sample sizes were accounted for by the JMP analysis software. So, conclusions regarding the treatments were made after controlling or removing any trial to trial variability. A Tukey HSD (honest significant difference) test was utilized to determine the significance of pairwise differences among trials. Blocking effects were analyzed, and an F test was used to determine the validity of removing blocking from all of the models.

3. Results

3.1. Greenhouse Environmental and Water Conditions

The root zone temperatures (RZT) and pH values by treatment are shown in Table 3. Minimal variation between trials was observed. The greenhouse aerial conditions by trial are presented in Table 4. The trends in decreased natural light matched the expected increase in supplemental light. However, the mean daily light integral (DLI) was consistent between trials as intended. The daily mean relative humidity (RH) showed a drop in relative humidity during the last trial, which was expected from the observed condensation on the inside of the cold greenhouse glass and the lower absolute humidity of the outside air. Since the aerial conditions and the RZT’s were sufficiently close to their target conditions or experienced minimal variation between treatments, differences in the treatment response could be attributed to pH difference or the source of the nutrients.
The starting, ending, mean, and standard error of the EC values by trial and tub are shown in Table 5. Most of the nutrients and subsequently the EC did not change significantly during the experiment (1300–1500µS/cm). Tub 4 and 5 and the fish tank returned very similar EC readings, as intended, since water was constantly recirculated between these two tubs and the fish tank. A ~50–100µS/cm decrease in EC occurred during the last week in the two hydroponic treatments (H5 and H7), and was attributed to rapid plant growth and usage of nutrient elements during that period.

3.2. Biomass

The shoot (head) data, including mean and standard errors for shoot FW, DW, DW/FW ratios, are presented in Table 6. The equivalent information for roots and rootballs is presented in Table 7 and Table 8, respectively. The leaf surface response data is provided in Table 9. The aquaponic treatment (A7) was not different (p = 0.05) from the hydroponic pH 5.8 treatment (H5) in all biomass responses (FW, DW, and DW/FW ratio for shoot, root, rootball, leaf count, leaf surface area (SA), and leaf SA/FW).
For the two hydroponic treatments, the plants grown at pH 7.0 (H7) were different from those grown at pH 5.8 (H5) for shoot FW, DW, and DW/FW and for root FW and DW. The hydroponic plants at pH 5.8 (H5) had 23% greater shoot FW than the hydroponic plants at pH 7.0 (H7), while H7 had 22% and 33% more root FW and DW, respectively, than H5. The hydroponic plants grown at pH 7.0 (H7) were 33% larger in root DWs on average than the aquaponically grown plants at pH 7.0 (A7).
The rootball responses did not differ among all treatments for all response variables (Table 8). The DW/FW of the roots contained within the rockwool, primarily the lettuce taproot, were 67% larger than those of the shoots or roots.
There were no differences between treatments for leaf count, leaf surface area, or the ratio of leaf surface area to head fresh weight. The average FWs for the randomly selected heads used for leaf SA were 188 g (hydroponic pH 5.8 plants, H5), 161g (hydroponic pH 7.0 plants, H7), and 168g (aquaponic pH 7.0 plants, A7) compared to 178, 137, and 169g for the larger FW data set, respectively.

3.3. Tissue Elemental Response

The elemental analysis for lettuce shoots is given in Table 10. The nutrient solution analyses for the starting, ending, and target conditions were given in Table 2. Means in rows with differing letters differ statistically at alpha = 0.05.
Among the macroelements in the tissue analysis (K, Ca, N, P, Mg, S), Ca only differed between the hydroponic pH 5.8 treatment (H5) and the aquaponic pH 7.0 treatment (A7). Differences in microelements were found between H5 and A7 for Ba, Mn, Mo, Sr, and Zn. No differences in microelements were found between H5 and A7 for Al, As, B, Cd, Co, Cu, Cr, Fe, Ni, Pb, and Si. There were no elemental tissue differences (macro or micro) between the two hydroponic treatments (H5 and H7) except for Cu. For the other elements, there was a difference for Na between A7 and both of the hydroponic treatments (H5 and H7).

4. Discussion

4.1. Biomass

Our previous research [14] showed shoot FW was reduced by 26% when using an inorganic nutrient solution at pH 7.0 (H7) instead of the recommended lower pH 5.8 for hydroponic solutions (H5). The present study also showed a similar reduction in FW of 23%. However, in this experiment, some aspects of the aquaponic solution (not quantified in this study) nullified the negative effects of the elevated pH (7.0), as the hydroponic pH 5.8 plant (H5) and the aquaponic pH 7.0 plant (A7) responses did not differ. A possible explanation for the equivalence in production performance of the H5 and A7 treatments was the cumulative effect in the A7 treatment of the biological filter and mineralization of nutrients that would produce a variety of organic molecules, such as natural chelators, enzymes, hormones, and microflora. Humic acids, a byproduct of organic decomposition, increase root size, branching, and the uptake of micronutrients [18], and have been shown to increase cell membrane permeability and stimulate growth beyond that of mineral-only nutrients [19].
The root response for the two hydroponic treatments, H7 compared to H5, showed an increase of 22% and 33% FW and DW for H7, respectively. This data is consistent with our earlier study that showed 18% and 32% increased root FW and DW, respectively, in comparing the hydroponic pH 5.8 (H5) treatments to the elevated pH 7.0 (H7) treatment s [14]. Additional root mass is an indicator of a plant’s response to combating nutrient deficiencies by increasing root transfer capacity [20], which may suggest that the hydroponic pH 7.0 plants (H7) spent a larger portion of their energy acquiring the necessary elements for growth.

4.2. Tissue Elements

The differences found in microelements between the treatments were generally proportional to the differences in the nutrient solutions. A proportional uptake of micronutrients has been reported by others, e.g., data from Liedl et al. [21] showing a proportional response of Mo tissue content to nutrient solution concentrations.
The tissue elemental comparisons generally did not differ, which is a significant positive result for the aquaponics treatment (A7). We hypothesized that the aquaponic plants would suffer biomass and tissue elemental effects from deviations from an ‘ideal’ nutrient solution formulated specifically for lettuce. For example, the elemental concentrations of B, Ca, Cu, P, Mn, Mo, and Sr were all much higher in the hydroponic pH 5.8 treatment (H5) at the end of each trial than in the aquaponic treatment at pH 7.0 (A7).
Most of the differences in elemental tissue concentrations were unlikely to have been causal or meaningful to biomass response. Very significant and large differences such as those found with Zn, Mo, Cu, and Mn were all within the normal bounds of lettuce tissue content, and may be explained by significantly elevated or diminished concentrations or ratios in the nutrient solutions.
Among the macroelements included in the Sonneveld nutrient solution (K, Ca, N, P, Mg, S), a tissue difference in Ca between the hydroponic pH 5.8 treatment (H5) and the aquaponic pH 7.0 treatment (A7) was the only difference, and this difference was proportional to the difference in Ca levels in the nutrient solutions. The A7 Ca tissue content was ~11% lower than H5, and there was no difference between the two hydroponic treatments (H5 and H7) or H7 and A7. The Ca nutrient solution in both H7 and A7 was below the nutrient solution targets, A7 much more so. However, the pH alone did not appear to influence the availability of Ca to the lettuce, since the H7 value was not different from H5, where the only difference was pH. It is also possible that lettuce has a critical level for Ca, above which there are no deficiencies observed in plant tissue.
The mean nitrogen (N) tissue content was 5.82%, 5.68%, and 5.84% for hydroponic pH 5.8 (H5), hydroponic pH 7.0 (H7), and aquaponic pH 7.0 (A7), respectively; there were no significant differences among these pairwise comparisons. Our previous experiment found N contents of 5.42% and 4.95% for H5 and H7, respectively [14]. Our values from both experiments were slightly higher than the 4.5% N reported by Resh [1] and Seawright et al. [22], and much higher than the 2.9% reported by Pantanella et al. [23]. These comparisons indicate that a system’s design, its management, and the N bioavailability of the nutrient solution may affect N assimilation by the plant, and the values reported from one study have to be carefully evaluated before assuming applicability to another growing and management system.
The mean copper (Cu) tissue concentrations were different for hydroponic pH 5.8 (H5) compared to both hydroponic pH 7.0 (H7) and aquaponic pH 7.0 (A7); H7 and A7 were not different. The Cu nutrient solution concentrations were close to equivalent or slightly smaller in H7 and A7 than in H5. Despite the less than or equivalent Cu in solution, the tissue Cu concentrations in H7 and A7 suggest that pH may have some effect on the uptake of Cu in hydroponic solutions. However, others have shown that lower pH values should increase lettuce tissue Cu content [24], which suggests that our measurements of higher Cu in tissues at higher pH may have resulted from other complex molecular substances containing Cu, such as slightly more DTPA chelator transport of Cu at pH 7.
The mean sodium (Na) tissue concentrations were 720, 717, and 2027mg/kg for hydroponic pH 5.8 (H5), hydroponic pH 7.0 (H7), and aquaponic pH 7.0 (A7), respectively. The difference in A7 can be attributed to the 10-times higher concentration of Na in the nutrient solution for A7 than for either H5 or H7. Na is not included in the Sonneveld nutrient solution. The lack of difference between H5 and H7 in Na nutrient solution and tissue concentrations suggest no pH effect. The increased Na concentration in the A7 nutrient solution correlated with the increased A7 tissue concentration. Caution may be needed in RAS to guard against elevated tissue Na, since Na in the nutrient solution can become elevated due to the constant recycling of water, concentration due to evaporation, and the difficulty of eliminating Na from the fish feed source. Minimizing Na in the fish diet may need to be considered in aquaponics, especially where the grower is attempting to minimize Na tissue levels in the lettuce product.
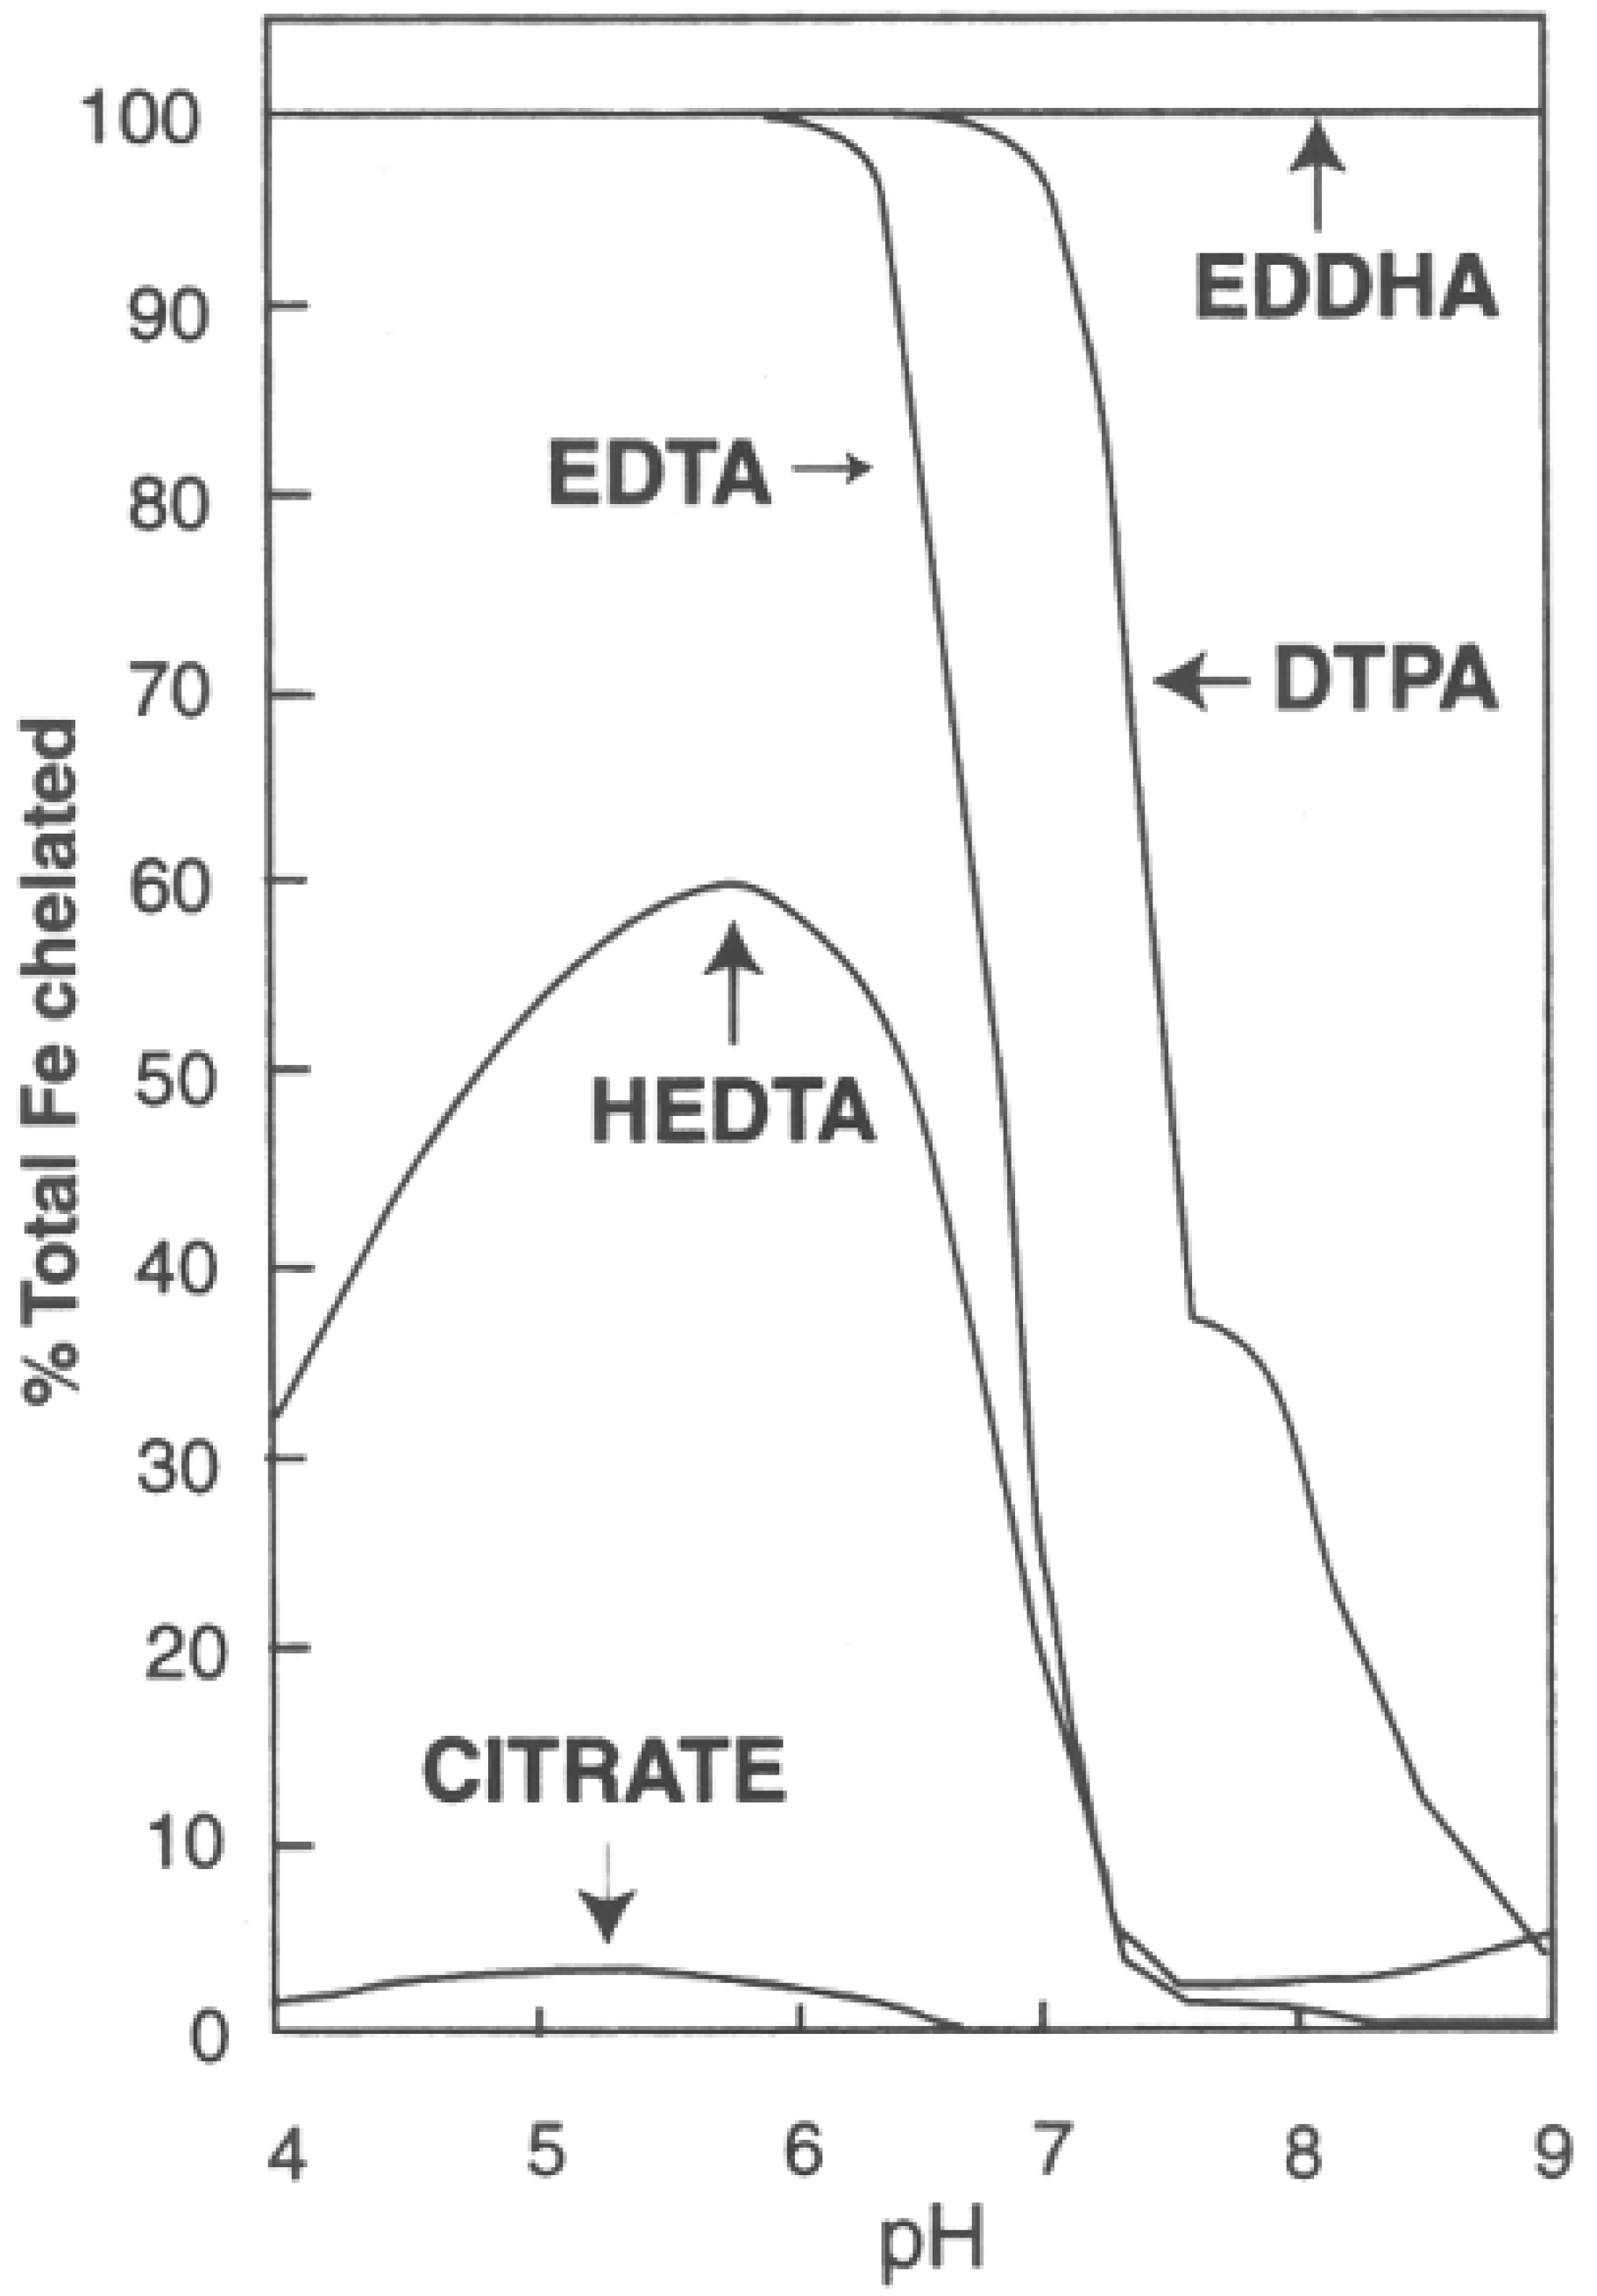
The Fe tissue concentrations were very consistent among all treatments. The percentage of bound Fe for common chelators between pH 4 and 9 is shown in Figure 4. Within the typical pH range used in conventional hydroponics, the DTPA chelator, as used in this experiment for all treatments, is at or very nearly 100% selective for Fe. As the solution approaches pH 7.0, as is the case for aquaponic pH 7.0 (A7) or hydroponic pH 7.0 (H7), the DTPA chelator is still very effective at ≥97% selective for Fe. However, given that a chelator may bind to other elements, the ~3% of chelator not bound to iron may aid in the transport of other elements into the plant for the two higher pH treatments. For example, Blaylock et al. [25] has reported that EDTA additions increased the transport into plants of five metals including Pb. Thus, while elevated pH values generally result in less nutrient availability, the free chelator may counterbalance a portion of this negative pH effect.
The mean boron (B) tissue concentrations were not different among treatments, even though the aquaponic treatment (A7) nutrient solution concentrations of B were an order of magnitude smaller than either of the hydroponic treatments (H5 and H7). If B is passively acquired, as suggested by Brown et al. [27], then our hypothesis is that B usage is low enough and B is sufficient in the nutrient solutions such that equilibrium is reached between the plants and solution. This would explain the order of magnitude lower nutrient solution concentrations resulting in the same plant tissue concentrations.
The mean silicon (Si) tissue concentrations were not different among the treatments. Even though Si was not in our Sonneveld nutrient solution, Si was present in the three treatment solutions. The starting Si nutrient solution concentrations were 0.05, 0.10, and 1.27mg/L for hydroponic pH 5.8 (H5), hydroponic pH 7.0 (H7), and aquaponic pH 7.0 (A7), respectively, while the ending nutrient solution concentrations were 0.12, 0.30, and 1.55mg/L for H5, H7, and A7 respectively, showing an accumulation over the growing cycle in all three treatments. The very low concentrations in the nutrient solution appear to still accumulate significant quantities in the shoots, yet they had no measured effect on the biomass shoot yield between H5 and A7. One explanation may be that Si was acquired from the rockwool cube fibers, which are silicate-based. A larger discussion on a rockwool cube elemental analysis can be found in our previous paper [14], where we included a hot plate acid digestion and ICP-AES analysis of the rockwool cube stock used in our experiments.
The order of magnitude larger nutrient solution concentration in Si for the aquaponic pH 7.0 treatment (A7) did not increase the tissue concentration between treatments. This is potentially important, since a grower could choose to add Si to the nutrient solution as a preventative measure against reduced production to combat potential stress that the crop may experience. There are several reports of silicon reducing stress in hydroponically grown plants [28,29], including the alleviation of abiotic and biotic stresses [30,31].

4.3. Precipitation from System

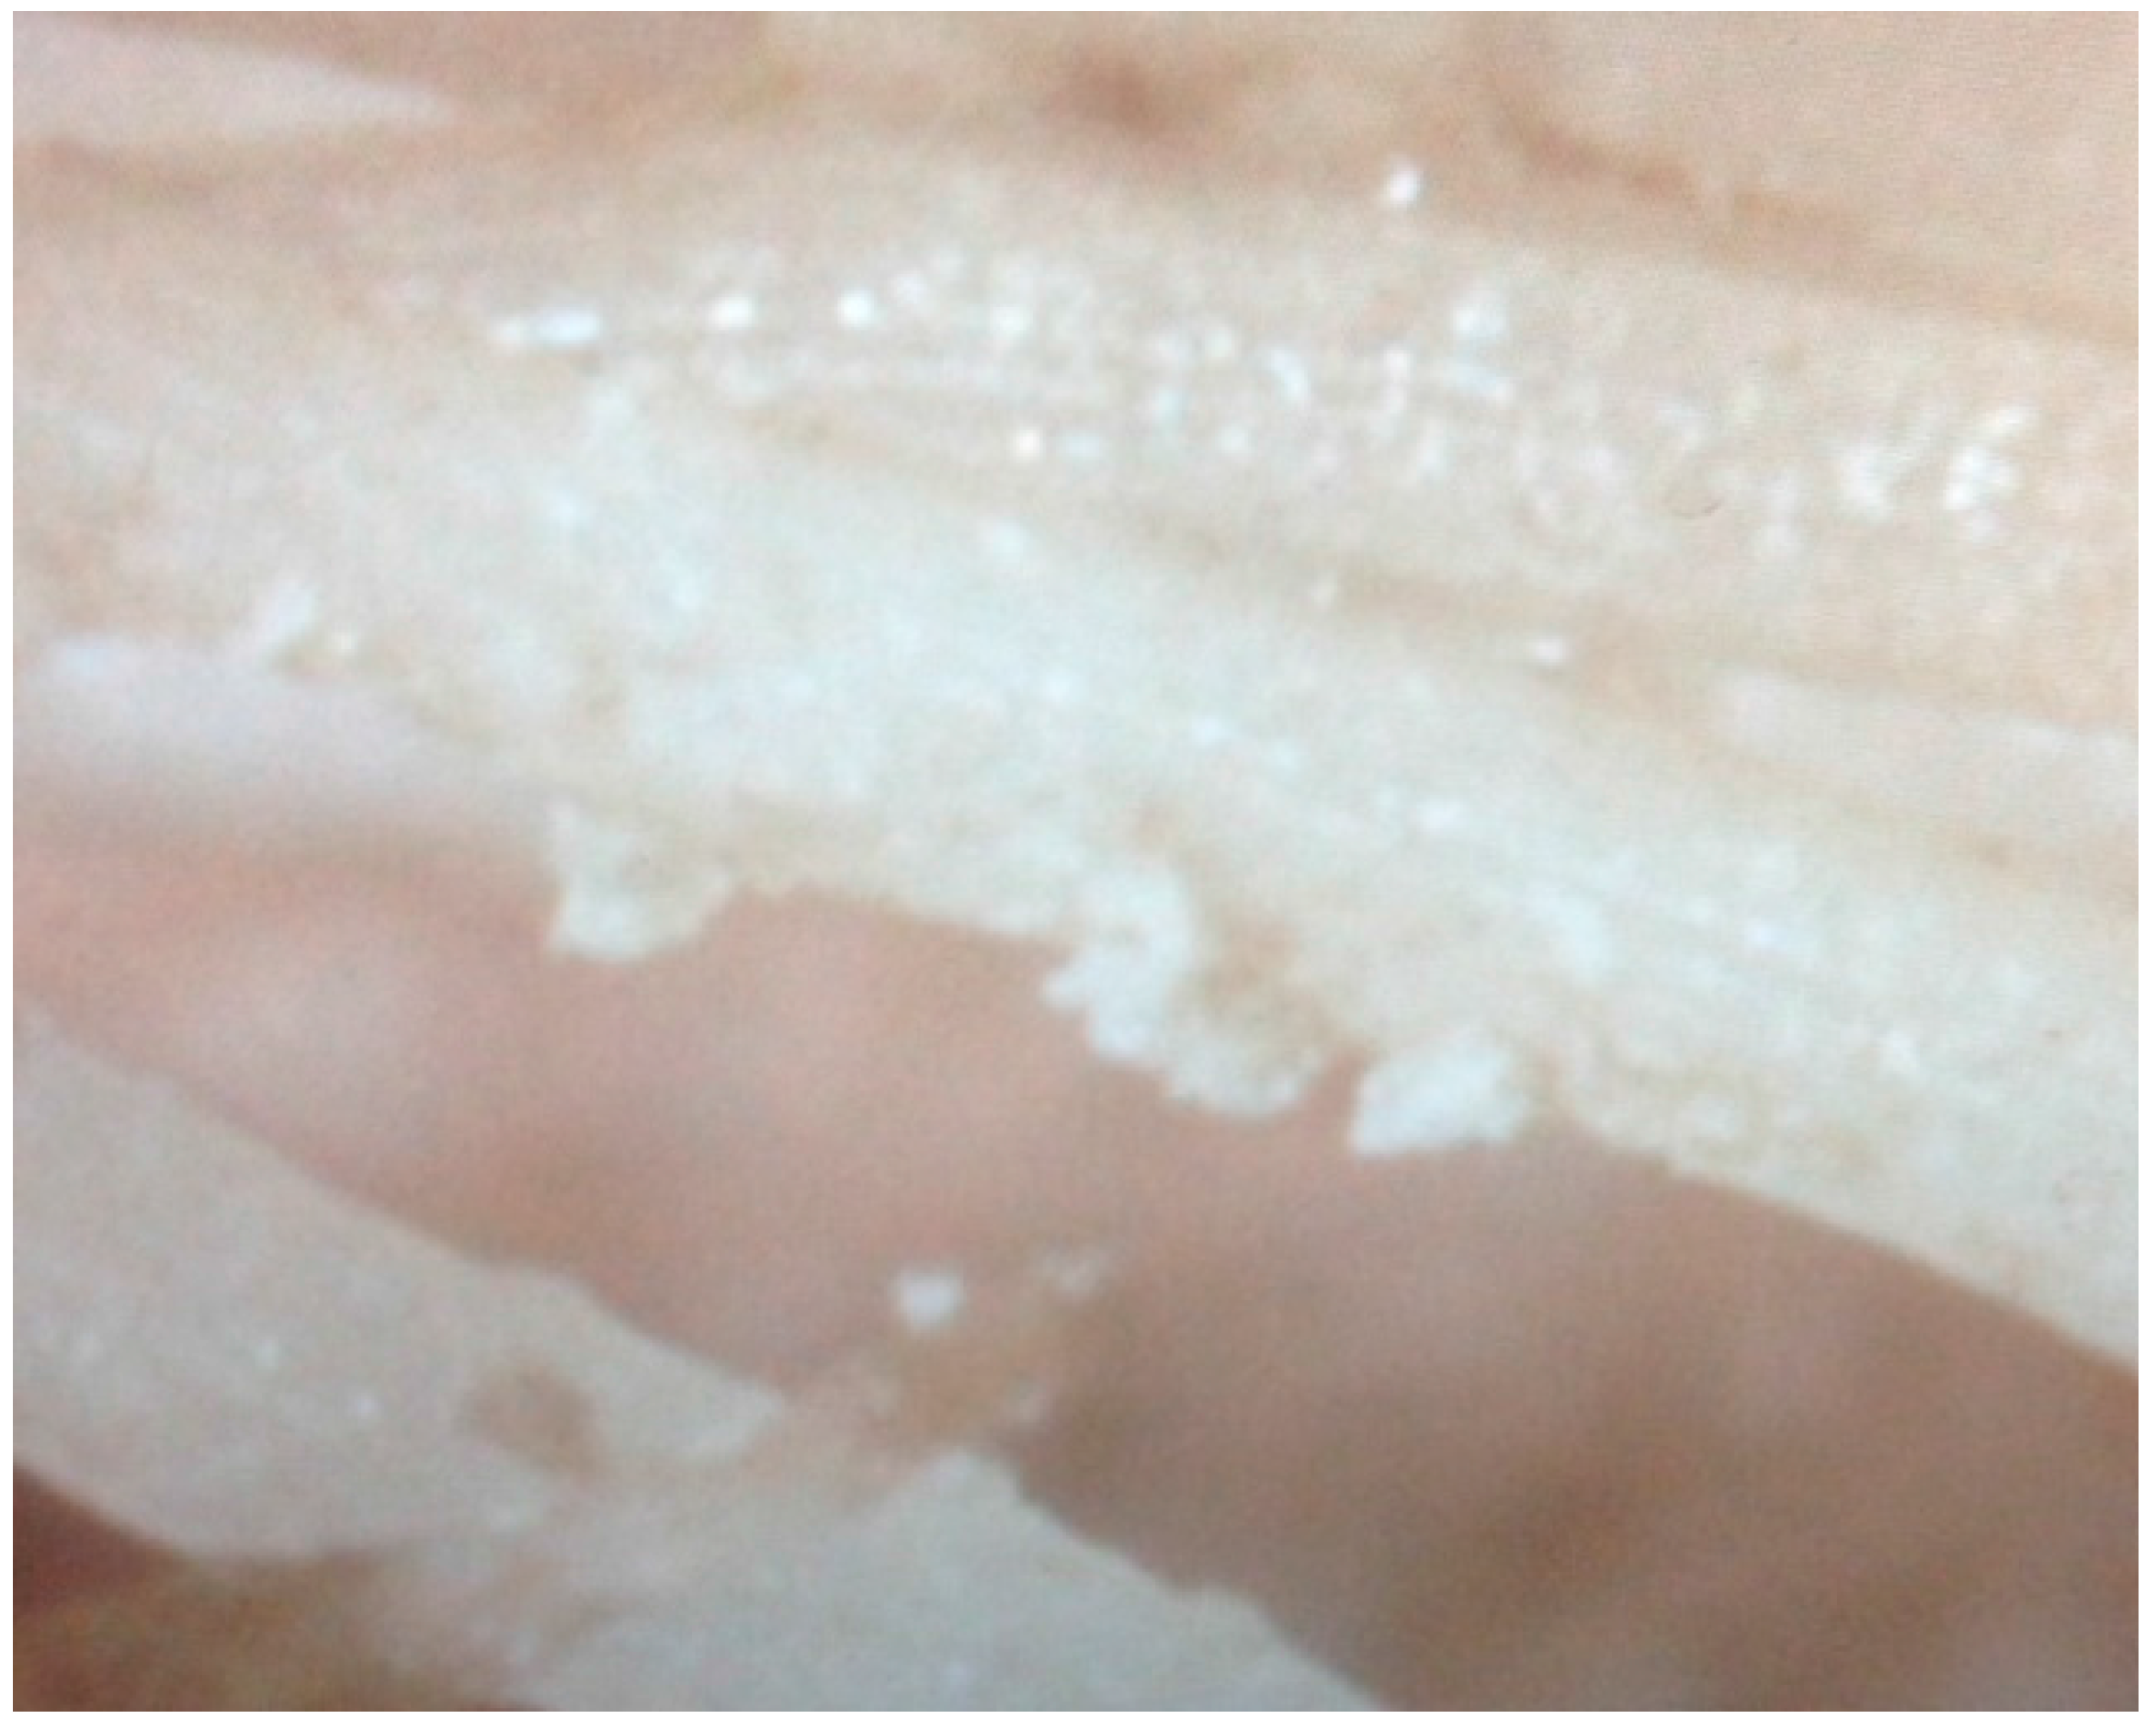
There was significant precipitate as granular “sand” in the hydroponic pH 7.0 (H7) HDPE tubs, and the formation of a precipitate “skin” on the tub sides. White precipitate was also observed on the roots of the H7 treatment (Figure 5). Despite the slow addition of acid and base with vigorous mixing, localized white precipitate plumes did occasionally appear in the H7 treatment. The H7 treatment required daily pH adjustment, including during the first week, when the plants were proportionally having very little influence on the nutrient solution. The hydroponic pH 5.8 treatment (H5) required little to no adjustments the first week, and typically much smaller adjustments compared to H7 as each trial proceeded. Seawright et al. [22] also reported on the continual precipitation of calcium phosphate from solution in an integrated aquaponic system with the fish systems maintained at pH 7.5.
The precipitate’s digestion results ranged between 97–98% as Ca and P (as PO43−), and the average Ca to P molar ratio of the precipitate was 1.39:1 (standard deviation (SD) = 0.06). Since the precipitation was unique to the hydroponic pH 7.0 treatment (H7) and correlated to a daily requirement to raise the pH with KOH, this indicates that the form(s) of precipitating calcium phosphate resulted in donated hydrogen ion(s) to the solution.
The precipitation of P in the hydroponic pH 7.0 treatment (H7) and the resulting decreased nutrient solution concentration caused no differences in P tissue contents among treatments. This lack of difference in P was surprising considering the 3-times higher concentration of P in the nutrient solution of the hydroponic pH 5.8 treatment (H5) compared to either H7 or the aquaponic pH 7.0 treatment (A7). H7 started at the target concentration, but dropped in availability to a third of the starting concentration, while A7 remained fairly constant at a third of the target nutrient solution concentration.

4.4. Summary

This experiment demonstrated that aquaponics can produce high quality lettuce in both size and elemental nutrient content while not suffering any significant decrease in biomass in comparison to a best practices conventional inorganic hydroponics at pH 5.8. We hope this research expands the discussion on using targeted inorganic nutrient solutions that provide a repeatable process versus nutrient solutions provided primarily from organic sources, e.g., aquaponics. The next question to consider is whether the byproducts of the aquaponic system, the direct secretions and waste from the fish, and the decomposition and mineralization of complex nutrients, hormones, enzymes, and compounds are a causal factor in the results, or whether some direct or short lived aspects of the flora, fauna, and their byproducts are causal to these results.
Prior to this research, we believed aquaponic systems to be more complicated and more risky because two complex systems were being joined (hydroponics plus RAS). However, the aquaponics system proved to be surprisingly simple to manage in daily operations. Our data suggested that the aquaponics system (A7), which was operated at a higher pH 7.0, was able to offset any negative biomass and elemental effects that occurred in the inorganic hydroponic pH 7.0 condition (H7) from its increased pH and less optimized nutrient solution elemental concentrations. This study shows that caution should be taken when raising the standard hydroponic solution pH from 5.8 to pH 7.0, which can slow plant growth, negatively affecting product yields.
Acknowledgments

This research was supported entirely by the Cornell University Agricultural Experiment Station federal formula funds, Project No. 1237650 and NYC-123421 received from Cooperative State Research, Education, and Extension Service, U.S. Department of Agriculture. Any opinions, findings, conclusions, or recommendations expressed in this publication are those of the author(s) and do not necessarily reflect the view of the U.S. Department of Agriculture. We would like to thank Pamela Schwartz, Erica Cartusciello, Zach Wielgosz, and Haydn Lenz for their assistance in data collection and daily maintenance of the production systems. We would like to thank Francoise Vermeylen from the Cornell Statistical Consulting Unit for her assistance and guidance in the statistical models and analysis.

Author Contributions

Tyler S. Anderson and Michael B. Timmons conceived and designed the experiment; Tyler S. Anderson performed the experiment; Tyler S. Anderson analyzed the data; David de Villiers wrote much of the text related to plant physiology and response; Tyler S. Anderson and Michael B. Timmons contributed reagents/materials/analysis; all of the authors contributed significantly to writing the paper.

Conflicts of Interest

The authors declare no conflict of interest. The founding sponsors had no role in the design of the study; in the collection, analyses, or interpretation of data; in the writing of the manuscript, and in the decision to publish the results.

References

  1. Resh, H.M. Hydroponic Food Production; CRC Press Taylor & Francis Group: Boca Raton, FL, USA, 2013. [Google Scholar]
  2. Jensen, M.H.; Collins, W.L. Hydroponic vegetable production. Horticultural 1985, 7, 483–558. [Google Scholar]
  3. Treftz, C.; Omaye, S.T. Hydroponics: Potential for augmenting sustainable food production in non-arable regions. Nutr. Food Sci. 2016, 46, 672–684. [Google Scholar] [CrossRef]
  4. Timmons, M.B.; Ebeling, J.M. Chapter 19: Aquaponics. In Recirculating Aquaculture, 3rd ed.; Ithaca Publishing Company: Ithaca, NY, USA, 2013. [Google Scholar]
  5. D’Orbcastel, R.E.; Blancheton, J.P. Wastes from marine fish production systems: Characterization, minimization, treatment and valorization. World Aquac. 2006, 37, 30–35. [Google Scholar]
  6. Davidson, J.; Good, C.; Welsh, C.; Summerfelt, S.T. Comparing the effects of high vs. low nitrate on the health, performance, and welfare of juvenile rainbow trout Oncorhynchus mykiss within water recirculating aquaculture systems. Aquac. Eng. 2014, 59, 30–40. [Google Scholar] [CrossRef]
  7. National Organic Standards Board. Crops Subcommittee Discussion Document Aeroponics/Hydroponics/Aquaponics. Available online: https://www.ams.usda.gov/sites/default/files/media/CSHydroponics.pdf (accessed on 24 July 2017).
  8. Rakocy, J.E. Aquaculture engineering: The status of aquaponics, Part 1. Aquac. Mag. 1999, 25, 83–88. [Google Scholar]
  9. Diver, S.; Rinehart, L. Aquaponics: Integration of Hydroponics and Aquaculture. Appropriate Technology Transfer for Rural Areas: Horticulture Systems Guide. Available online: http://attra.ncat.org/attra-pub/aquaponic.html (accessed on 24 July 2017).
  10. Tyson, R.V.; Treadwell, D.D.; Simonne, E.H. Opportunities and challenges to sustainability in aquaponic systems. HortTechnology 2011, 21, 6–13. [Google Scholar]
  11. Love, D.C.; Jillian, P.; Fry, J.P.; Li, X.; Hill, E.S.; Genello, L.; Semmens, K.; Thompson, R.E. Commercial aquaponics production and profitability: Findings from an international survey. Aquaculture 2015, 435, 67–74. [Google Scholar] [CrossRef]
  12. Bugbee, B. Nutrient management in recirculating hydroponic culture. South Pac. Soil. Cult. Conf.-SPSCC 2004, 648, 99–112. [Google Scholar] [CrossRef]
  13. Mengel, K.; Kirby, E.A. Principles of Plant Nutrition, 4th ed.; International Potash Institute: Horgen, Switzerland, 1987; p. 537. [Google Scholar]
  14. Anderson, T.S.; Martini, M.; de Villiers, D.; Timmons, M.B. Growth and tissue elemental composition response of Butterhead lettuce (Lactuca sativa, cv. Flandria) to hydroponic conditions at different pH and alkalinity. Horticulturae 2017, 3, 41. [Google Scholar] [CrossRef]
  15. Aquaculture Systems Technologies, LLC. New Orleans, LA, USA. Available online: www.beadfilters.com (accessed on 25 July 2017).
  16. Sonneveld, C.; Straver, N. Nutrient Solutions for Vegetables and Flowers Grown in Water of Substrates; Series: Voedingsoplossingen Glastuinbouw; Proefstation voor Tuinbouw onder Glas te Naaldwijk: Kruisbroekweg, Naaldwijk, The Netherlands, 1994; p. 45. [Google Scholar]
  17. Hangarter, R.P.; Stasinopoulos, T.C. Effect of Fe-catalyzed photooxidation of EDTA on root growth in plant culture media. Plant Phys. 1991, 96, 843–847. [Google Scholar] [CrossRef]
  18. Canellas, L.P.; Olivares, F.L. Physiological responses to humic substances as plant growth promoter. Chem. Biol. Technol. Agric. 2014, 1, 3. [Google Scholar] [CrossRef]
  19. Chen, Y.; Aviad, T. Effects of humic substances on plant growth 1. In Humic Substances in Soil and Crop Sciences; MacCarthy, P., Clapp, C.E., Malcolm, R.L., Bloom, P.R., Eds.; Selected Readings, SSSA: Madison, WI, USA, 1990; pp. 161–186. [Google Scholar] [CrossRef]
  20. Marschner, H.; Kirkby, E.; Cakmak, I. Effect of mineral nutritional status on shoot-root partitioning of photoassimilates and cycling of mineral nutrients. J. Exp. Bot. 1996, 47, 1255. [Google Scholar] [CrossRef] [PubMed]
  21. Liedl, B.E.; Cummins, M.; Young, A.; Williams, M.L.; Chatfield, J.M. Hydroponic lettuce production using liquid effluent from poultry waste bioremediation as a nutrient source. Acta Hortic. 2004, 659, 721–728. [Google Scholar] [CrossRef]
  22. Seawright, D.E.; Stickney, R.R.; Walker, R.B. Nutrient dynamics in integrated aquaculture-hydroponics systems. Aquaculture 1998, 160, 215–237. [Google Scholar] [CrossRef]
  23. Pantanella, E.; Cardarelli, M.; Colla, G.; Rea, E.; Marcucci, A. Aquaponics vs. hydroponics: Production and quality of lettuce crop. In Proceedings of the ISHS Acta Horticulturae 927: XXVIII International Horticultural Congress on Science and Horticulture for People (IHC2010): International Symposium on Greenhouse 2010 and Soilless Cultivation, University of Lisbon, Lisbon, Portugal, 28 February 2012. [Google Scholar]
  24. Cheng, T.; Allen, H.E. Prediction of uptake of copper from solution by lettuce (Lactuca sativa Romance). Environ. Toxicol. Chem. 2001, 20, 2544–2551. [Google Scholar] [CrossRef] [PubMed]
  25. Blaylock, M.J.; Salt, D.E.; Dushenkov, S.; Zakharova, O.; Gussman, C.; Kapulnik, Y.; Ensley, B.D.; Raskin, I. Enhanced accumulation of Pb in Indian mustard by soil-applied chelating agents. Environ. Sci. Technol. 1997, 31, 860–865. [Google Scholar] [CrossRef]
  26. Reed, D.W. A Grower’s Guide to Water, Media, and Nutrition for Greenhouse Crops; Ball Pub: Batavia, IL, USA, 1996. [Google Scholar]
  27. Brown, P.H.; Bellaloui, N.; Wimmer, M.A.; Bassil, E.S.; Ruiz, J.; Hu, H.; Pfeffer, H.; Dannel, F.; Römheld, V. Boron in plant biology. Plant Biol. 2002, 4, 205–223. [Google Scholar] [CrossRef]
  28. Sawas, D.; Giotis, D.; Chatzieustratiou, E.; Bakea, M.; Patakioutas, G. Silicon supply in soilless cultivations of zucchini alleviates stress induced by salinity and powdery mildew infections. Environ. Exp. Bot. 2009, 65, 11–17. [Google Scholar]
  29. Yaghubi, K.; Ghaderi, N.; Vafaee, Y.; Javadi, T. Potassium silicate alleviates deleterious effects of salinity on two strawberry cultivars grown under soilless pot culture. Sci. Hortic. 2016, 213, 87–95. [Google Scholar] [CrossRef]
  30. Datnoff, L.E.; Elmer, W.H.; Huber, D.M. Mineral Nutrition and Plant Disease; APS Press: St. Paul, MN, USA, 2007. [Google Scholar]
  31. Williams, D.E.; Vlamis, J. The effect of silicon on yield and manganese-54 uptake and distribution in the leaves of barley plants grown in culture solutions. Plant Physiol. 1957, 32, 404–409. [Google Scholar] [CrossRef] [PubMed]
Figure 1. Greenhouse experiment floor plan (to scale); ebb and flow table not shown (was immediately north of Tub 4). Red arrows between the fish tank, Tub 4, and the pump tank illustrate the water recirculation path and continuous gravity equilibration of water between tub 4 and 5. Flow from the bead filter is partially diverted to tubs 4 and 5, and the balance directly returned to the fish tank. Top of the figure is the due west wall. D, diameter.
Horticulturae 03 00043 g001
Figure 2. Photos of the operating system. (Top) The fish tank and bead filter are mostly hidden by the black curtains; the tubs are numbered 1–6 starting from top left and going clockwise; tubs 4 and 5 were dedicated to the fish system for treatment A7; the H5 and H7 treatments were rotated through the remaining tubs over the three trials. (Bottom) The activated charcoal water purification system (left side partially showing), settling/pumping tank, aquaculture tank, and bead filter (foreground to background) with piping to tub 4 and a return pipe to the settling/pumping tank.
Horticulturae 03 00043 g002
Figure 3. Cut away view of the bubble bead filter. Here you can see the shape, setup, and bead orientation during normal operation [15].
Horticulturae 03 00043 g003
Figure 4. A pH comparison of chelators and their proportion of Fe chelated [26]; Ethylenediaminediaminedi-o-hydroxyphenylacetic acid (EDDHA; C18H20O6N2), Ethylenediamintetraacetic acid (EDTA, C10H16O6N2), Diethylenetriaminepentaacetic acid (DTPA; C14H23O10N3), Hydroxyethylenediaminetriacetic acid (HEDTA; C10H18O7N2), CITRATE (C6H5O73−).
Horticulturae 03 00043 g004
Figure 5. White precipitate observed on the roots of the H7 treatment from a dissecting scope inspection; root diameters are ~0.5mm.
Horticulturae 03 00043 g005
Table 1. Blackwater Creek Farm Max Growth formula elemental contents via hot plate acid digestion.
ElementContentUnits
Total C40%
Total N6.3%
Total H6.3%
Ca4.1%
P2.2%
K1.2%
S5623mg/kg
Na4137mg/kg
Mg3545mg/kg
Fe789mg/kg
Al283mg/kg
Sr269mg/kg
Zn226mg/kg
Mn88mg/kg
B28mg/kg
Cu16mg/kg
Ba15mg/kg
As4.2mg/kg
Cr1.7mg/kg
V1.2mg/kg
Pb1.1mg/kg
Ni1.0mg/kg
Cd0.7mg/kg
Mo0.5mg/kg
Co0.5mg/kg
Ti0.0mg/kg
Table 2. Nutrient solutions’ starting, ending, and target concentrations, averaged by treatment.
Element (mg/L)H5 1H7 1A7 1Nutrient Solution
MacronutrientsStartEndStartEndStartEndTarget
K233210253273217222215
Ca1011159075738090
N: NO3-N153128141129112122133
N: TAN 28.60.18.30.00.60.38.8
P353429129931
Mg14151414192012
S21262126172118
Micronutrients
Fe 31.11.00.90.92.72.01.1
Mn0.1480.0250.0990.0060.0460.0040.140
B0.200.240.200.230.020.020.16
Cu0.0360.0400.0320.0370.0280.0290.024
Zn0.130.150.140.170.320.360.13
Mo0.030.030.030.03000.02
Other elements
Si0.050.120.100.301.271.55-
Pb0.00050.00050.00080.00090.01090.0006-
Na67676161-
Al0.0250.0380.0220.0380.0260.044-
St0.75450.83890.69060.62440.48680.5296-
Ba0.01140.00610.00740.00350.01930.0098-
1 H5 is the average of three tubs; H7 is a single tub-single sample; and A7 is a single sample from the rapidly exchanging tubs; 2 TAN = Total Ammonia Nitrogen; 3 A7 had 2mg/L chelated iron added for each new trial;
Table 3. Tub means and standard deviation (SD) of pH and root zone temperature (RZT, °C) by treatment.
TreatmentpH (SD)RZT (SD)
H55.79 (0.16)25.6 (1.49)
H76.96 (0.22)25.6 (1.44)
A76.95 (0.40)24.8 (1.18)
Table 4. Greenhouse conditions (mean and standard deviation (SD)) by trial for supplemental light (SL, moles/m2/day), natural light (NL, moles/m2/day), daily light integral (DLI, moles/m2/day), relative humidity (RH, %), day air temperature (AT-Day, °C), and night air temperature (AT-Night, °C).
TrialSLNLDLIRHAT-DayAT-Night
13.3 (3.1)10.9 (3.7)14.2 (3.3)75 (10.4)28.8 (2.7)26.7 (2.4)
25.6 (2.2)8.5 (3.8)14.2 (2.9)75 (9.0)23.9 (2.8)23.9 (1.0)
310.6 (2.2)3.8 (2.4)14.4 (0.6)52 (7.4)22.4 (2.2)21.0 (2.2)
Table 5. Electroconductivity (EC, µS/cm) starting, ending, mean, and standard error (SE) for each trial and tub with treatment imposed on each tub; summary of treatments by tubs by trial is also shown for reference.
Tub 1Tub 2Tub 3Tub 4Tub 5Tub 6Fish
Trial 1 H7H5H5A7A7H5
Start1370137013501070106013801080
End1380130012601200120012601200
Mean1430136313311161116613491164
s.e.6.66.27.18.48.58.97.8
Trial 2 H5H7H5A7A7H5
Start1450145014501370138014401390
End1330144013601470147013301460
Mean1418148514291466146914181462
s.e.9.35.16.710.210.68.710.6
Trial 3 H5H5H5A7A7H7
Start1340135013601390139013901390
End1310132013001540153013201540
Mean1355136013591490149013821482
SE4.83.95.910.39.96.110.2
Table 6. Shoot mean, standard error (SE), and percentage comparison to H5 response for fresh weight (FW, g), dry weight (DW, g), and dry weight to fresh weight ratio (DW/FW, g/g) by trial and treatment with multi-model significance. Differing letters within response variables (columns) denote significance at alpha = 0.05.
FWDWDW/FW
NMean ± SE%NMean ± SE%NMean ± SE%
H5215178 ± 2 A100%1086.9 ± 0.08 A100%1080.039 ± 0.0003 A100%
H772137 ± 3 B77%366.3 ± 0.11 B90%360.044 ± 0.0006 B114%
A7144169 ± 2 A95%726.9 ± 0.16 A,B99%720.040 ± 0.0008 A102%
All average responses are in grams except %, and DW/FW which is g/g or dimensionless; % = Percentage comparison to H5 control; N = sample size.
Table 7. Root mean, standard error (SE), and percentage comparison to H5 response for fresh weight (FW, g), dry weight (DW, g), and dry weight to fresh weight ratio (DW/FW, g/g) by trial and treatment with multi-model significance. Differing letters within response variables (columns) denote significance at alpha = 0.05.
FWDWDW/FW
NMean ± SE%NMean ± SE%NMean ± SE%
H52147.8 ± 0.11 A100%1060.32 ± 0.006 A100%1060.041 ± 0.0006 A100%
H7729.6 ± 0.30 B122%340.42 ± 0.016 B131%340.045 ± 0.0006 A111%
A71438.2 ± 0.16 A,B105%720.32 ± 0.011 A98%720.039 ± 0.0014 A97%
All average responses are in grams except %, and DW/FW which is g/g or dimensionless; % = Percentage comparison to H5 control; N = sample size.
Table 8. Rootball mean response1 to the treatments for fresh weight (FW, g), dry weight (DW, g), and dry weight to fresh weight ratio (DW/FW, g/g or dimensionless). Differing letters within response variables (columns) denote significance at alpha = 0.05.
FW%DW%DW/FW%
H53.0 A100%0.21 A100%0.068 A100%
H73.2 A105%0.21 A103%0.067 A99%
A72.7 A89%0.18 A90%0.070 A103%
1 Trials 1 and 3 only.
Table 9. Leaf count, leaf surface area (SA, cm2), and leaf surface area/head fresh weight (cm2/g) response by treatment. Differing letters within response variables (columns) denote significance at alpha = 0.05.
Leaf Count 1,2%Leaf SA 2%Leaf SA/Head FW%
H539.5 A100%2721 A100%14.5 A100%
H738.4 A97%2731 A100%17.0 A117%
A737.2 A94%2363 A87%14.1 A97%
1 Leaf count defined as leaves >1 cm; 2 Leaf count and leaf surface area were run in Trial 3 only with five samples per tub.
Table 10. Shoot elemental analysis using ICP-AES by treatment for mean, standard error (SE), and significance1 among treatments; all data is on dry weight basis and in mg/kg unless otherwise noted.
H5H7A7
ParameterMean(SE)Mean(SE)Mean(SE)
Carbon Content (%)33.5 A(0.27)33.5 A(0.46)33.7 A(0.32)
Macronutrients (%)
N5.82 A(0.05)5.68 A(0.09)5.84 A(0.06)
P1.03 A(0.02)1.11 A(0.04)1.04 A(0.02)
K3.79 A(0.06)3.87 A(0.10)3.90 A(0.07)
Ca1.37 A(0.03)1.33 A,B(0.05)1.22 B(0.04)
Mg0.32 A(0.001)0.36 A(0.002)0.36 A(0.001)
S0.25 A(0.003)0.24 A(0.004)0.25 A(0.003)
Micronutrients(mg/kg)
Fe61 A(1)60 A(2)60 A(1)
Mn77 A(3.2)65 A(5.6)45 B(3.9)
B 128.0 A(1.7)38.3 A(2.9)30.6 A(2.1)
Cu7.0 A(0.6)9.9 B(1.0)10.7 B(0.7)
Zn34 A(2.2)31 A(3.9)64 B(2.7)
Mo0.86 A(0.09)0.83 A(0.16)0.20 B(0.12)
Other elements (mg/kg unless stated otherwise)
Na720 A(128)717 A(222)2027 B(157)
Al15 A(1)13 A(1)14 A(1)
Ni0.06 A(0.03)0.03 A(0.05)0.09 A(0.04)
Si28.3 A(0.4)27.3 A(0.7)28.2 A(0.5)
Pb1.4 A(0.5)0.7 A(0.9)0.8 A(0.6)
St94 A(2)98 A(3)75 B(2)
As0.36 A(0.02)0.35 A(0.03)0.35 A(0.02)
Ba1.2 A(0.1)1.0 A(0.2)3.0 B(0.2)
Cd0.13 A(0.00)0.12 A(0.01)0.13 A(0.00)
Co (µg/kg)11 A(1)10 A(2)12 A(1)
Cr0.26 A(0.03)0.31 A(0.05)0.31 A(0.04)
1 Boron analysis data from ash extraction on Trial 3 samples only.