Article

Economic Cost-Analysis of the Impact of Container Size on Transplanted Tree Value

by
Lauren M. Garcia Chance
*,
Michael A. Arnold
,
Charles R. Hall
and
Sean T. Carver
Department of Horticultural Sciences, Texas A&M University, College Station, Texas 77843-2133, TX, USA
*
Author to whom correspondence should be addressed.
Horticulturae 2017, 3(2), 29; https://doi.org/10.3390/horticulturae3020029
Submission received: 26 October 2016 / Revised: 18 April 2017 / Accepted: 21 April 2017 / Published: 27 April 2017
(This article belongs to the Special Issue Marketing Strategies of the Horticultural Production Chain)

Abstract

:
The benefits and costs of varying container sizes have yet to be fully evaluated to determine which container size affords the most advantageous opportunity for consumers. To determine value of the tree following transplant, clonal replicates of Vitex agnus-castus L. [Chaste Tree], Acer rubrum L. var. drummondii (Hook. & Arn. ex Nutt.) Sarg. [Drummond Red Maple], and Taxodium distichum (L.) Rich. [Baldcypress] were grown under common conditions in each of five container sizes 3.5, 11.7, 23.3, 97.8 or 175.0 L, respectively (#1, 3, 7, 25 or 45). In June 2013, six trees of each container size and species were transplanted to a sandy clay loam field in College Station, Texas. To determine the increase in value over a two-year post-transplant period, height and caliper measurements were taken at the end of nursery production and again at the end of the second growing season in the field, October 2014. Utilizing industry standards, initial costs of materials and labor were then compared with the size of trees after two years. Replacement cost analysis after two growing seasons indicated a greater increase in value for 11.7 and 23.3 L trees compared to losses in value for some 175.0 L trees. In comparison with trees from larger containers, trees from smaller size containers experienced shorter establishment times and increased growth rates, thus creating a quicker return on investment for trees transplanted from the smaller container sizes.

1. Introduction

Nurseries over the years have produced trees in increasingly larger container sizes [1,2]. Retail garden centers and even large box stores, such as Walmart®, Lowe’s®, and Home Depot®, now sell trees in up to 378.5 L (#100) containers. While debate continues over the relative merits of different container sizes [2], this could in part be due to the appreciation that commercial and residential customers have for the instant impact large trees can provide, such as greater aesthetic value of larger trees [3,4], greater biomass present to withstand environmental anomalies [5], less potential for accidental or malicious mechanical damage [6], instant shade [3,4], and increase in property value [7]. However, these larger trees cost more to grow and occupy a greater amount of nursery space per tree over longer time frames than smaller trees resulting in higher costs of production for growers and higher prices for consumers [6]. Smaller container sizes are ultimately less expensive for consumers as nurseries expend less materials, maintenance costs, and allocate less square footage to produce smaller trees. Also, smaller container sizes, once transplanted to the field, have been reported to experience reduced transplant shock [2], are in a phase of growth more closely aligned with the exponential growth rate of young seedlings [8], have been in containers for shorter times and transplanted to larger container sizes fewer times potentially reducing the chances of circling root development [9], and their smaller size makes for easier handling and staking [6]. The economic benefits and costs of varying container sizes have yet to be fully evaluated to determine which container size affords the most advantageous opportunity for consumers.
The value of a tree, defined as its monetary worth, is based on people’s perception of the tree [10]. Arborists use several methods to develop a fair and reasonable estimate of the value of individual trees [11,12]. The cost approach is widely used today and assumes that value equals the cost of production [13]. It assumes that benefits inherent in a tree can be reproduced by replacing the tree and, therefore, replacement cost is an indication of value [10]. Replacement cost is depreciated to reflect differences in the benefits that flow from an “idealized” replacement compared with an older and imperfectly appraised tree. The depreciated replacement cost method uses tree size, species, condition, and location factors to determine tree value [14].
The income approach measures value as the future use of a tree such as in fruit or nut production [15]. In the absence of such products, the income approach could be based on the monetary benefits of the future economic, environmental, and health well-being value of the tree [11]. For example, benefits have been shown to improve the value of the tree, including energy savings [16], atmospheric carbon dioxide reductions [17], storm water runoff reductions [18], and aesthetics [19]. Quantifying and totaling these benefits (ecosystems services) over time can provide an idea of a tree’s projected value, but require data outside the scope of this project, thus a derivation of the replacement cost method was utilized within this study.
The objective of the current research was to determine the initial cost and replacement cost value of five different container sizes in three tree species at transplant and after two growing seasons in the landscape.

2. Materials and Methods

In analyzing the impact container size has on the value of the tree, the establishment cost of the tree was calculated and then compared to the replacement price of the tree after two growing seasons. Using the difference, it was then possible to see the net change in value for each container size tree over time. For the purposes of this study, price is the selling price paid by the customer buying the product, cost is the cost of care incurred by the homeowner in maintaining the product, and value is the bundle of attributes important to a homeowner in determining the product’s overall worth. The three taxa utilized were selected to represent different niches of the landscape industry. Selections of Vitex agnus-castus L. (Chaste Tree), Acer rubrum L. var. drummondii (Hook. & Arn. ex Nutt.) Sarg. (Drummond Red Maple), and Taxodium distichum (L.) Rich. (Baldcypress) were chosen due to their widespread use in the southern USA nursery trade and their representation of a variety of classes of landscape trees. Additionally, five container sizes, 3.5 L (#1), 11.7 L (#3), 23.3 L (#7), 97.8 L (#25), and 175.0 L (#45), were selected as demonstrative of a range of typical container sizes purchased in the landscape trade. Clonal selections of these trees grown using as similar inputs as possible [20,21] were transplanted and monitored over the course of two growing seasons in a sandy clay loam (66% sand, 8% silt, 26% clay, 6.0 pH) field in College Station, TX (lat. 30°37’45” N, long. 96°20’3” W) beginning June 2013. All replicates of the 3.5 L Acer rubrum var. drummondii died within the first season due to deer grazing and pathogens and, therefore, are excluded from the cost analysis. Trunk diameters of all three species were within ANSI (American National Standards Institute) Z60.1-2004 specifications [22] for their respective container sizes [20].

2.1. Initial Costs

In order to analyze the value of the various sizes of the containerized trees, data were collected from 185 different nurseries located across 21 states. Nurseries were contacted and requested to provide wholesale prices of all container sizes available in Acer rubrum ”Summer Red” or ”Red Sunset”, Taxodium distichum, and Vitex agnus-castus ”Shoals Creek”. Although not all nurseries carried all sizes of each species, data from a minimum of twelve nurseries were acquired for each species and container size combination.
Labor and installation costs are included in analyzing the initial value of a tree. RSMeans is the industry standard source for accurate and expert information on materials, labor, and construction costs [23]. Thus, labor and materials costs were determined utilizing this information. Labor and installation costs, both by hand and using machinery, were compiled for each container size from the RSMeans data. Additionally, twelve companies that produced each container size were contacted and asked to contribute their installation costs to corroborate the data from RSMeans benchmarks.
Finally, maintenance costs were determined by using maintenance records during the two growing seasons for each container size and species. These records were then compared to RSMeans for projected maintenance costs per container size over time. Maintenance included such practices as fertilizing, weeding, pest control, pruning and watering.

2.2. Equivalent Costs

To determine the equivalent value for replacement of the planted trees at the end of two growing seasons, data were collected from the locally-grown trees. Final height and trunk diameter of the trees in the field in October 2014 were utilized to determine ANSIZ60.1 [22] container size approximations. Utilizing these ending container size equivalents, prices were designated according to the mean prices obtained from wholesale growers. Additionally, costs of installation and maintenance were derived for the ending container size of each tree. By subtracting the ending container size costs from the beginning container size costs, the net gain or loss in value over the two post-transplant growing seasons were calculated for each tree.
Data were analyzed using analysis of variance (ANOVA) with JMP 2009 and SAS 9.3 (SAS Institute Inc., Cary, NC, USA) to determine the significance of interactions and main effects for each variable. The overall model was 3 species × 5 sizes with 6 replicates (observations) per treatment combination (Table 1). Means for container size, wholesale cost, installation, maintenance, and total value for each tree were analyzed as the change between the beginning and end of the experiment. Where interactions were significant, Student’s t-test (Fisher’s Least Significant Difference) was used to compare means among the treatment combinations. When significant main effects were found, a paired t-test comparison was used to indicate values that are significantly different (p ≤ 0.05).

3. Results and Discussion

3.1. Initial Costs

Prices for a range of sizes of commercial container stock were obtained. Similar price trends existed for all three species (Figure 1). They were lowest for the 3.5 L trees and then slowly increased in price until the 56.8 L trees. Trees greater than 56.8 L tree stage were increasingly expensive compared to the smaller trees. While V. agnus-castus was slightly less expensive in the smaller container-grown trees, it became much more expensive in the larger container-grown trees than with the other two species. Higher prices associated with trees greater than 56.8 L would indicate the price point at which nursery growers must increase the prices to a higher rate to offset extra supplies, labor, and inventory carrying costs required to maintain larger container sizes.
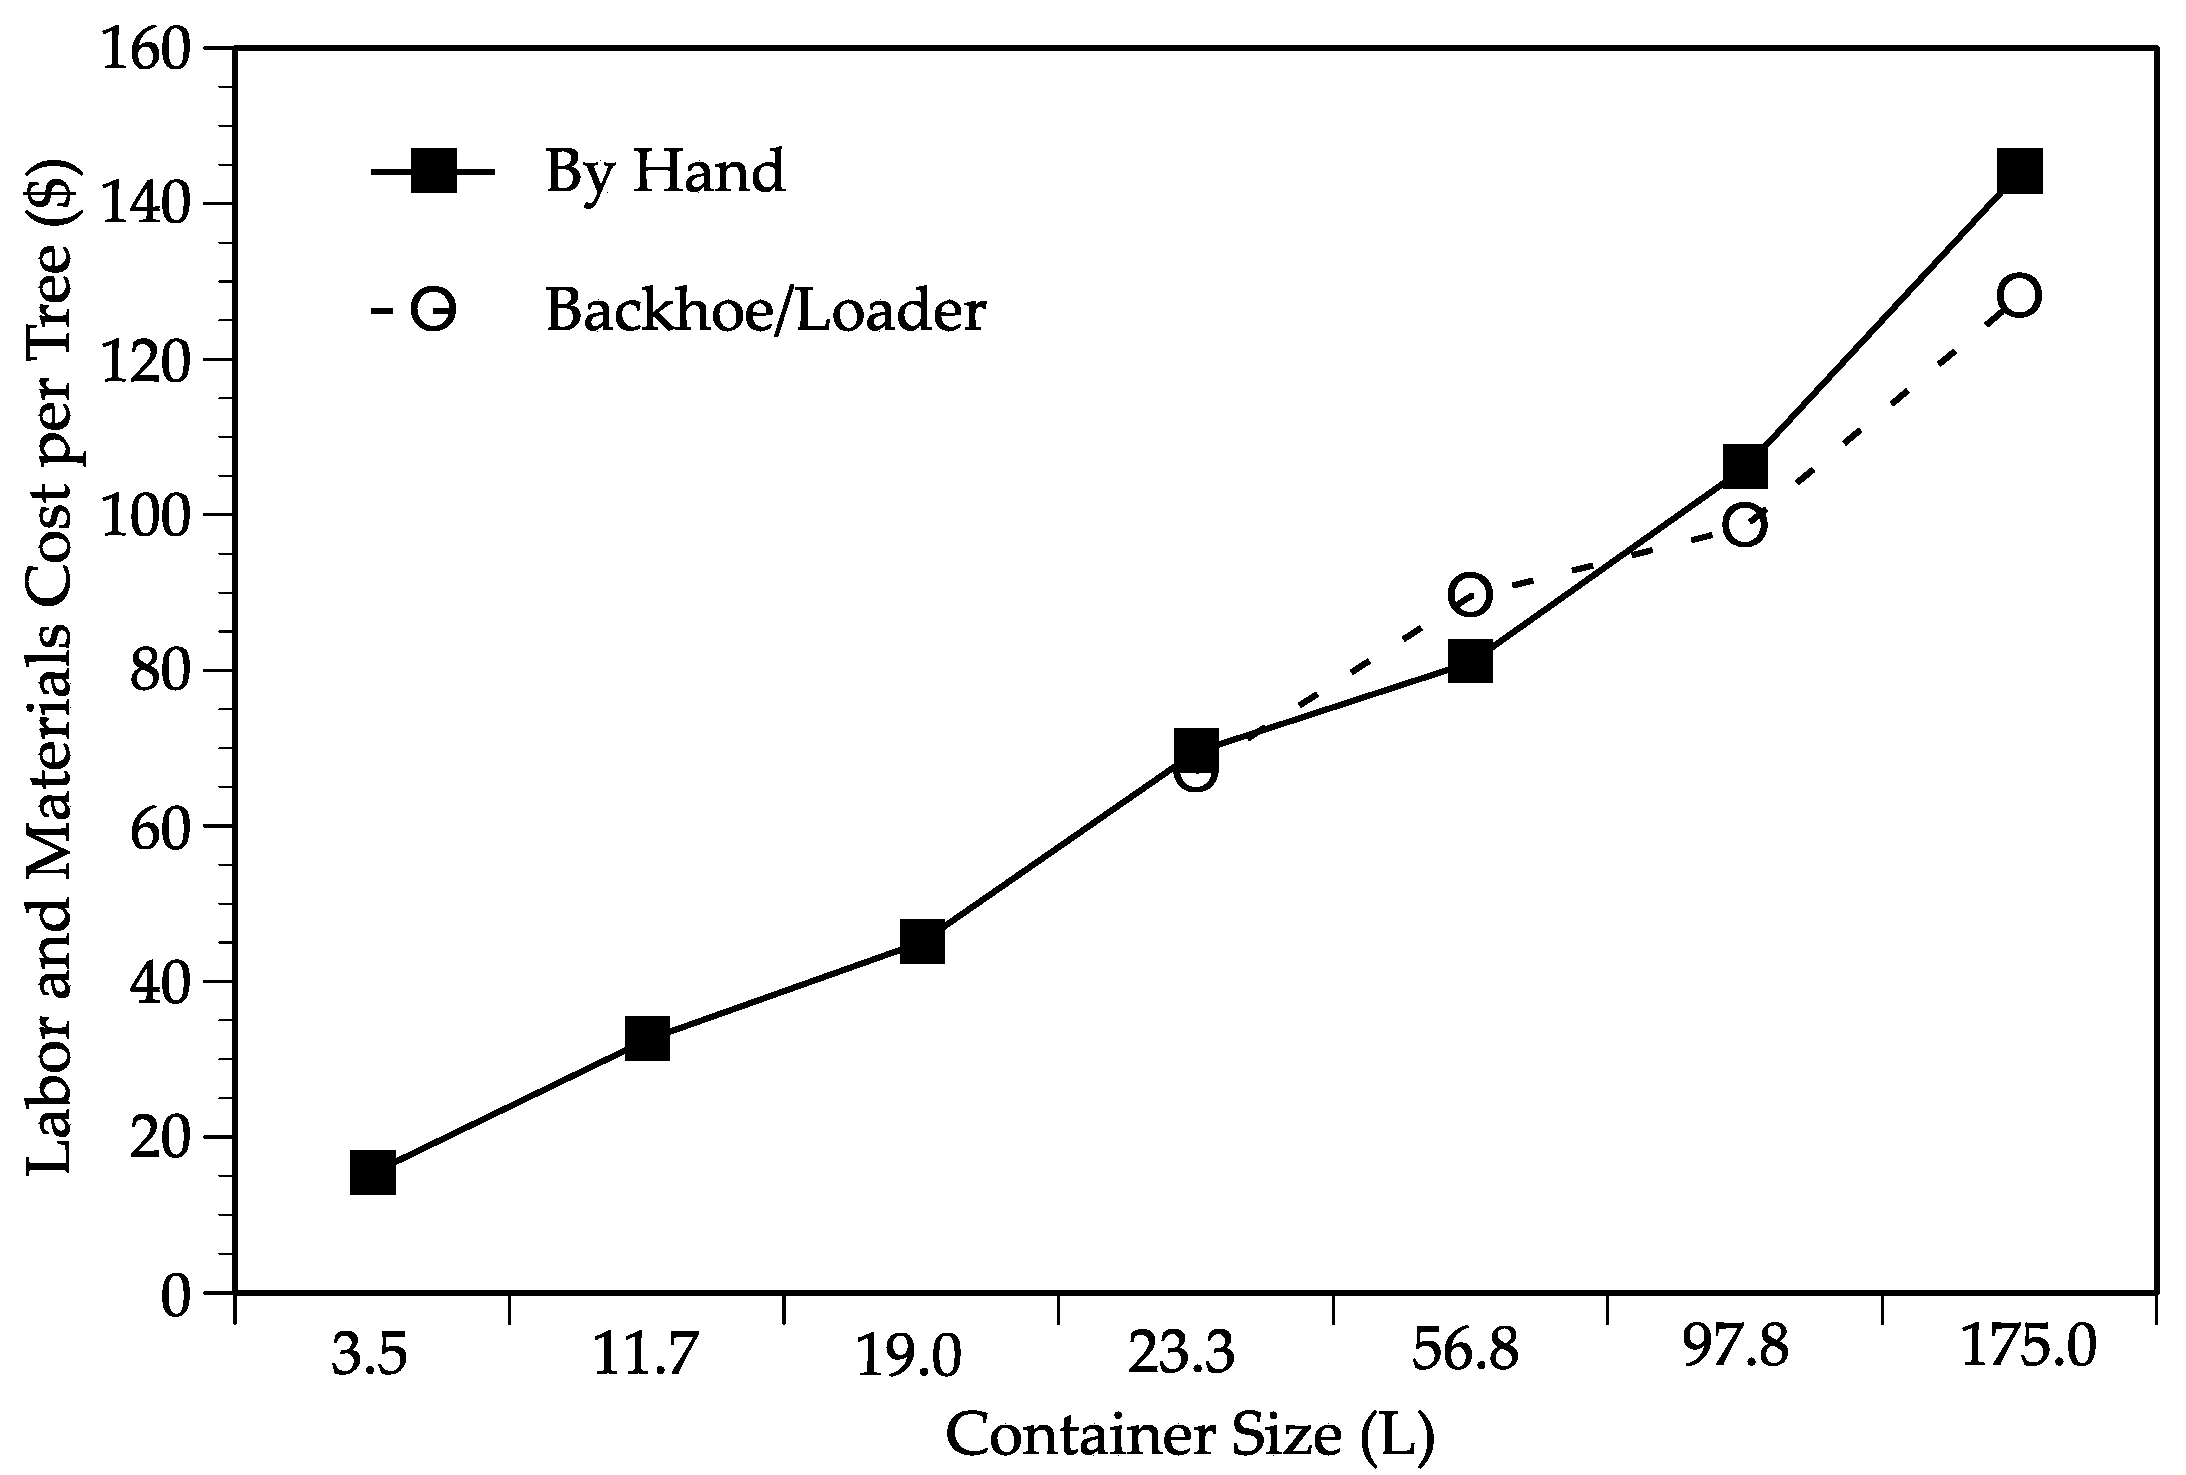
Similar trends were observed with the costs to transplant each container-grown tree (Figure 2). The cost to transplant increased gradually with each container size. The 56.8 L container size trees indicated another break point as the cost to transplant by hand was more cost-efficient than by machinery until this point. With 97.8 L and 175.0 L trees, machinery would be necessary to efficiently transplant these trees. Additionally, the 175.0 L trees were eight times more expensive to transplant than 3.5 L trees.
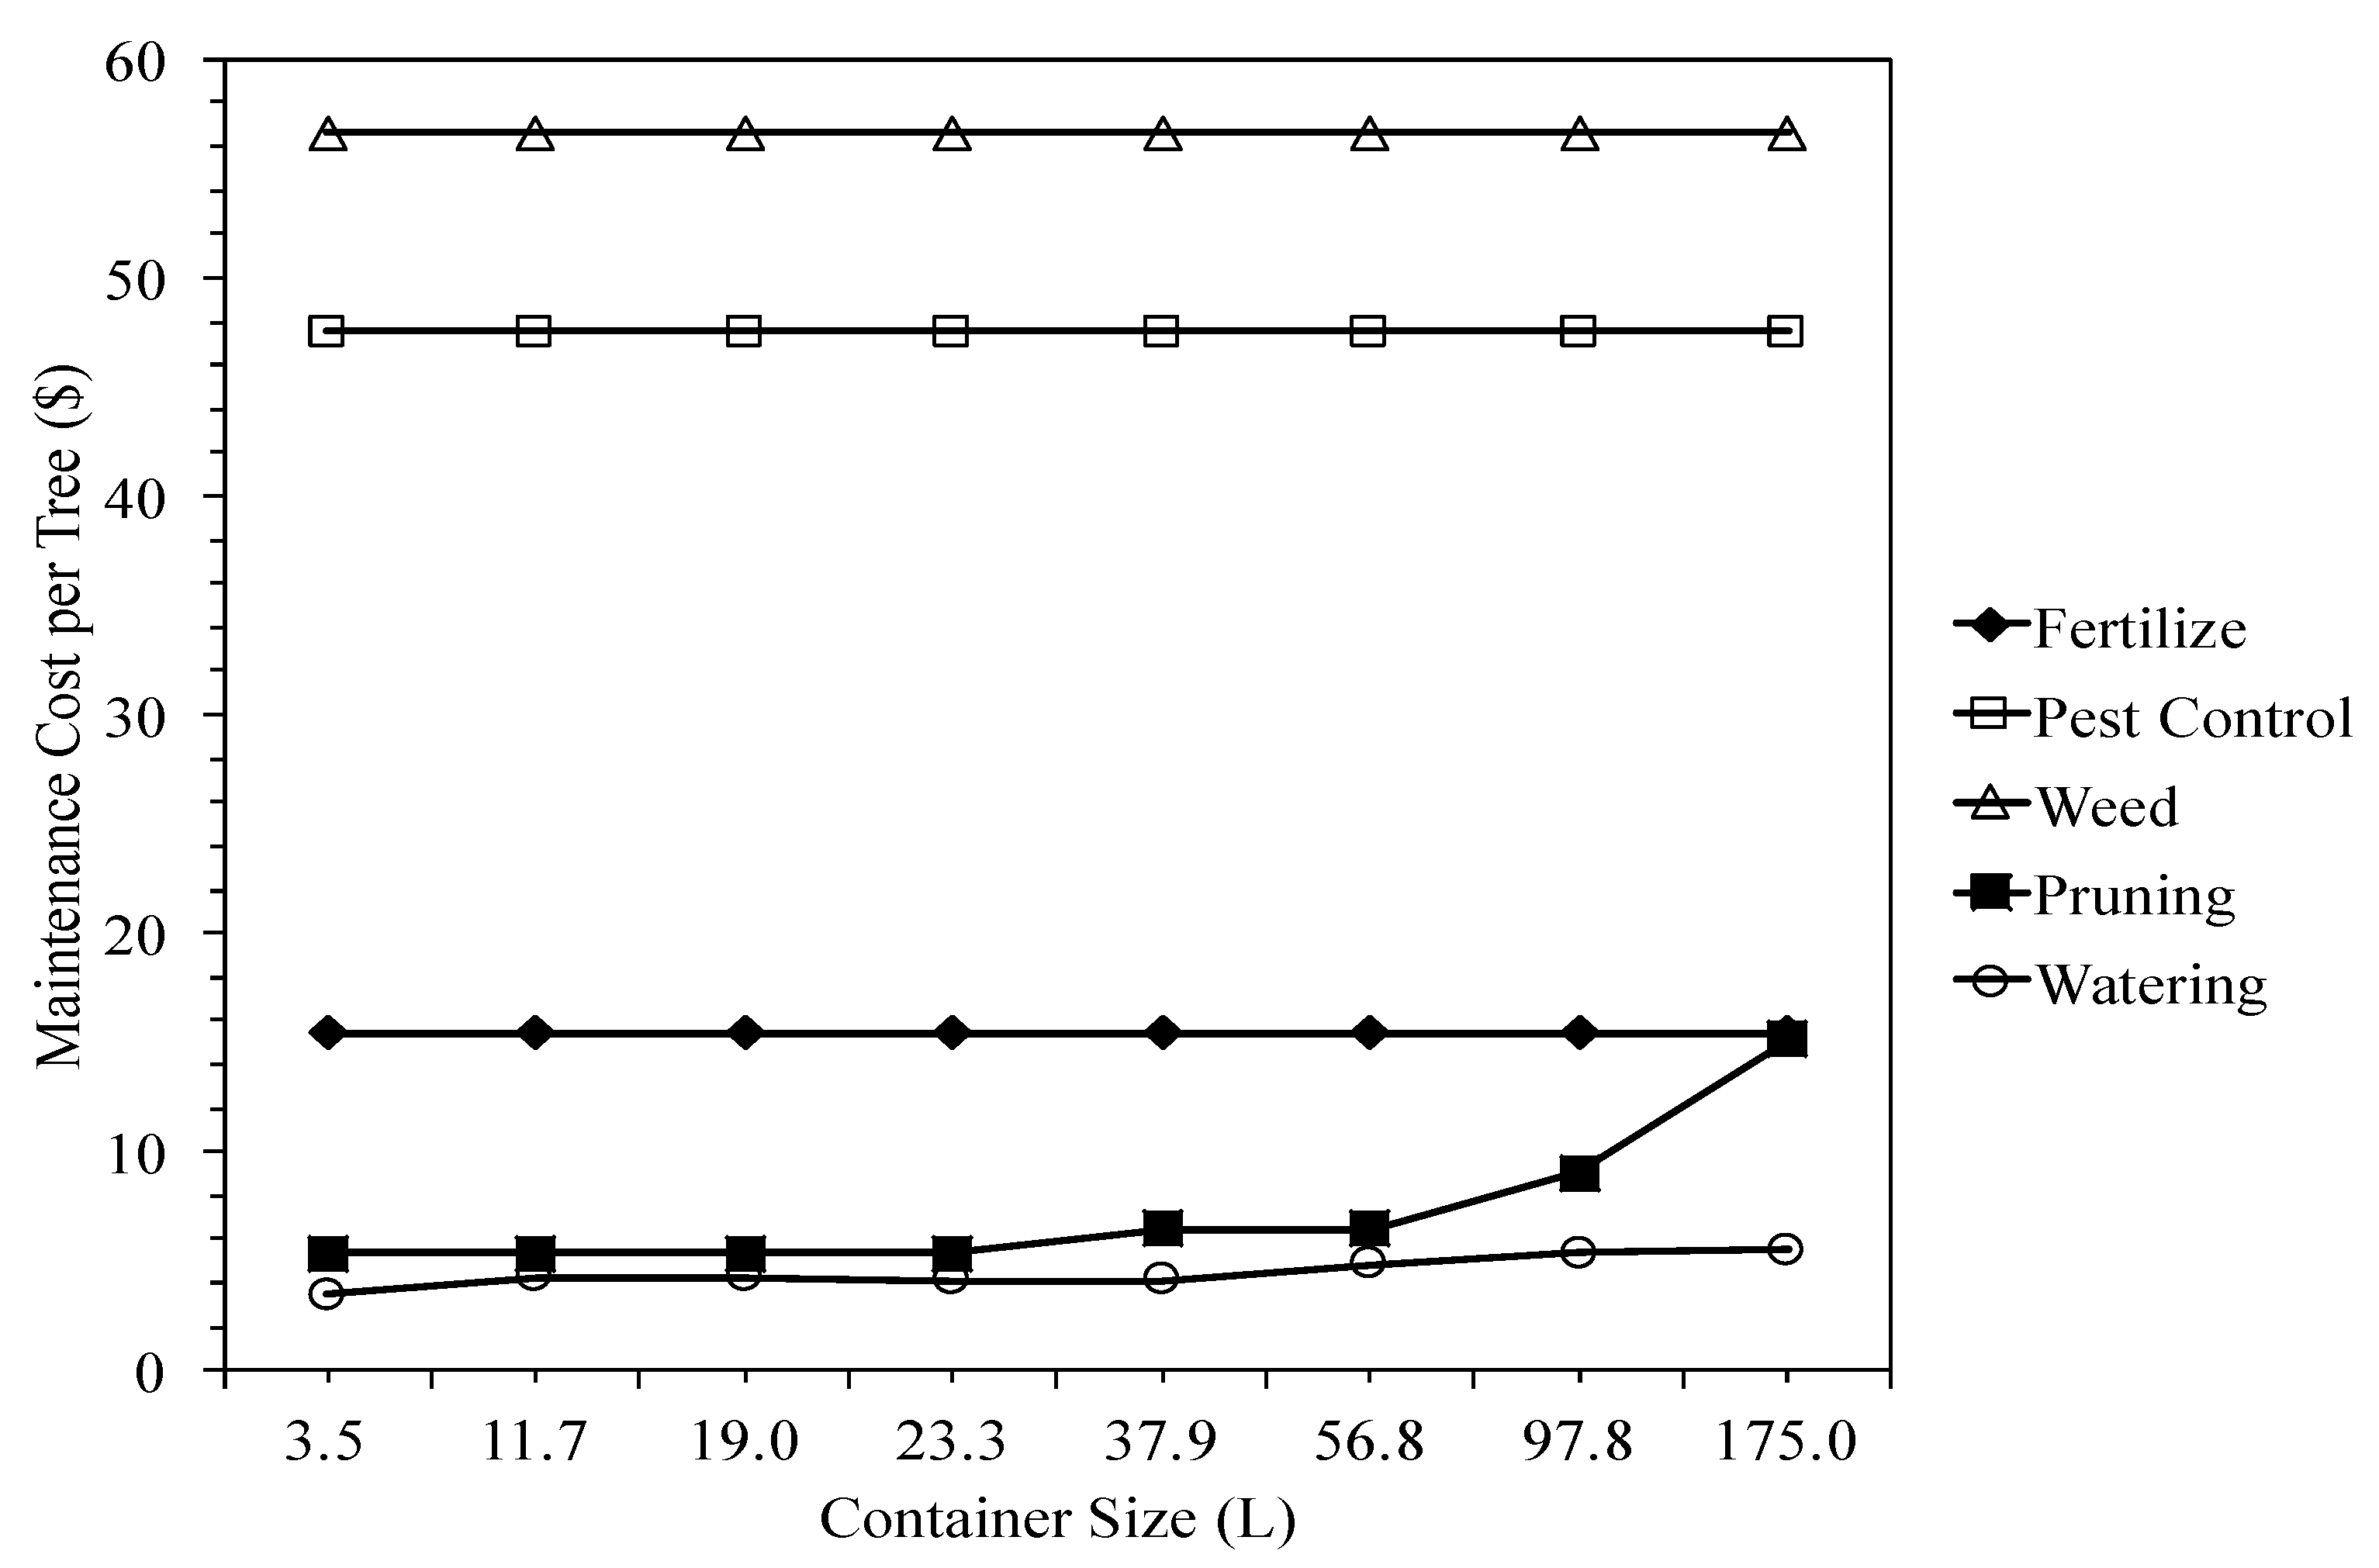
The maintenance costs for each container size were determined using general practices tree owners would implement during a typical year. This included fertilization, pest control, weeding, pruning, and watering. Cost of fertilization, pest control, and weeding remained nearly constant across all container size trees (Figure 3). However, the cost of pruning increased beginning at container sizes greater than 56.8 L with trees from 175.0 L containers requiring the most pruning labor. Finally, watering costs were relatively similar across all container sizes; however, a slight increase was found for the watering costs of larger container sizes. Despite more water being applied to larger container-grown trees, the current low cost of water mitigates the impact of this differential input. If in future years the cost of water increases, more substantial differences in cost of watering different container-grown trees could become apparent. Regional variation in water costs may also impact this estimate.

3.2. Equivalent Costs

In order to predict the future value of each tree, height and trunk diameter at the end of the second growing season were compared to ANSIZ60.1 [22] to determine equivalent size container-grown trees. Given the different growth rates of the three species of tested trees, the value varies depending on species [20]. Growth and value may also differ among planting sites; however, data from first-year establishment of these species in contrasting environments in Texas and Mississippi indicated similar growth trends [21].
The main effects of species and container size were highly significant for all variables and the interaction between species and container size was significant for changes in installation costs, changes in container sizes, and net gain/loss (Table 1). Therefore, results are presented by species.
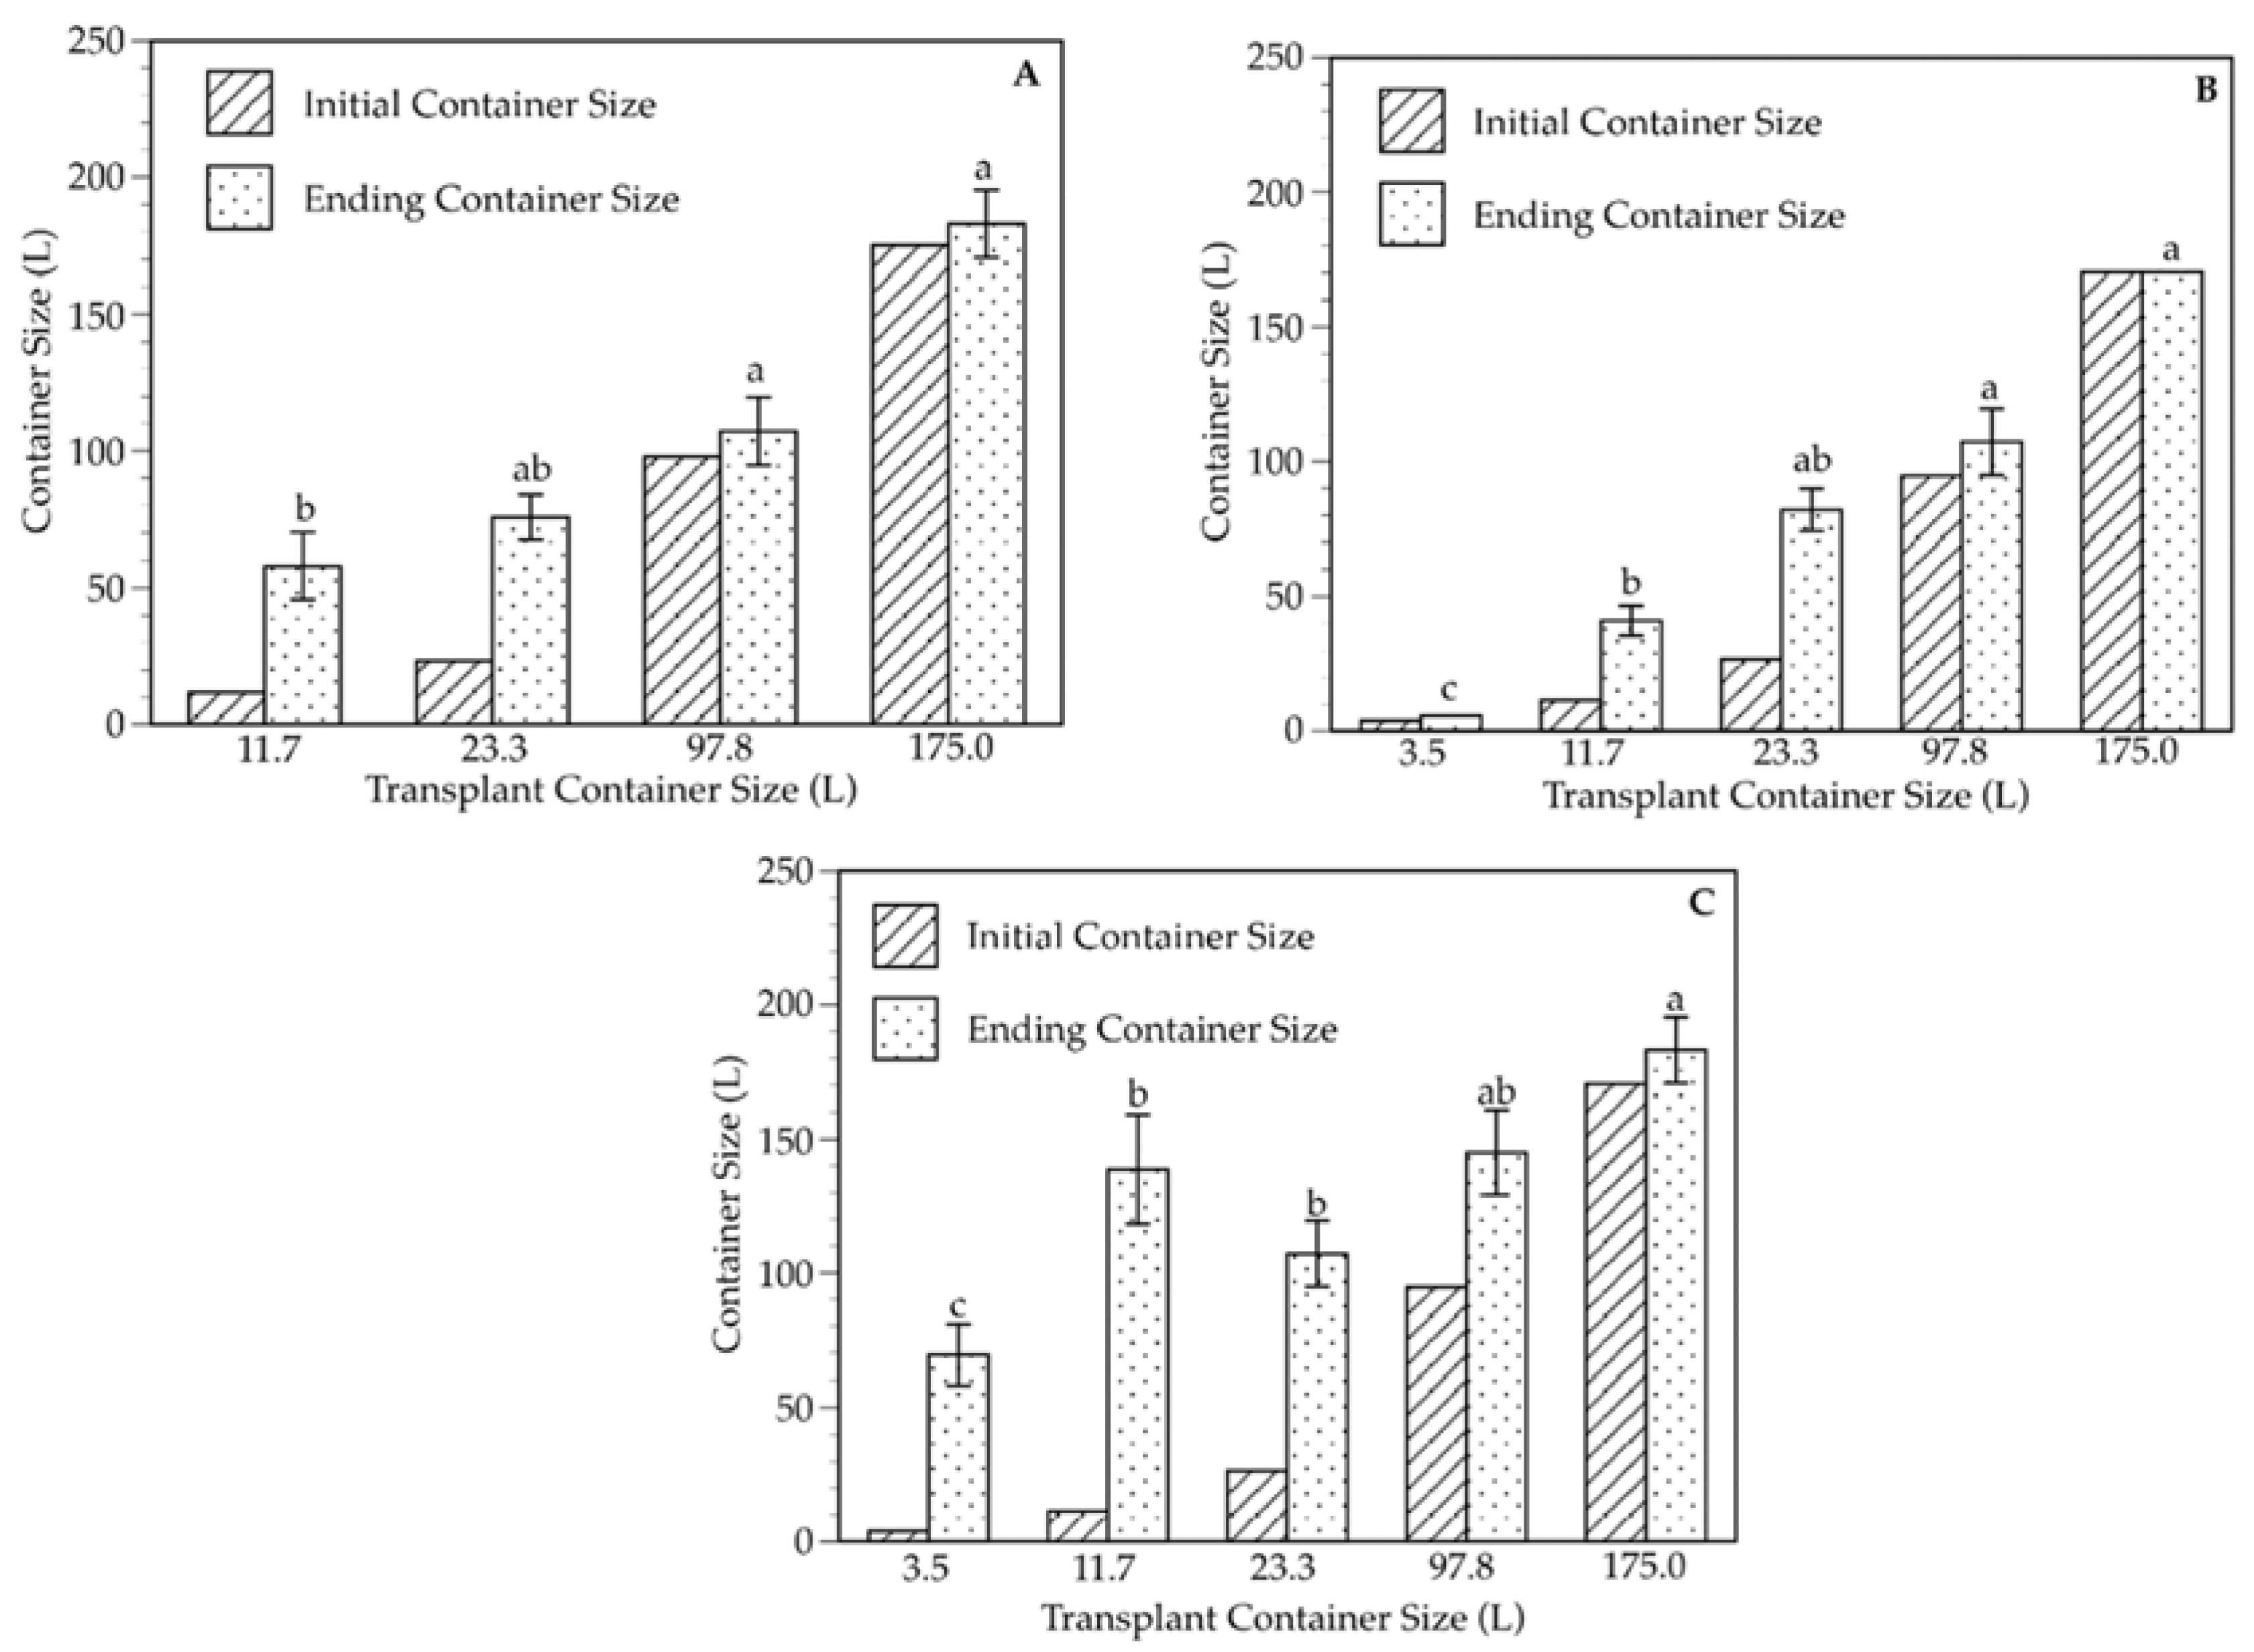
The greatest container size changes for A. rubrum occurred with the 11.7 L and 23.3 L trees which ended the second growing season at mean sizes of 56.8 L and 75.7 L, respectively (Figure 4A; Table 1). In contrast, 97.8 L and 175.0 L trees ended with very little change from their initial container sizes. Both 97.8 L and 175.0 L A. rubrum ended the second season with only one of the six replications increasing their equivalent container size (data not shown).
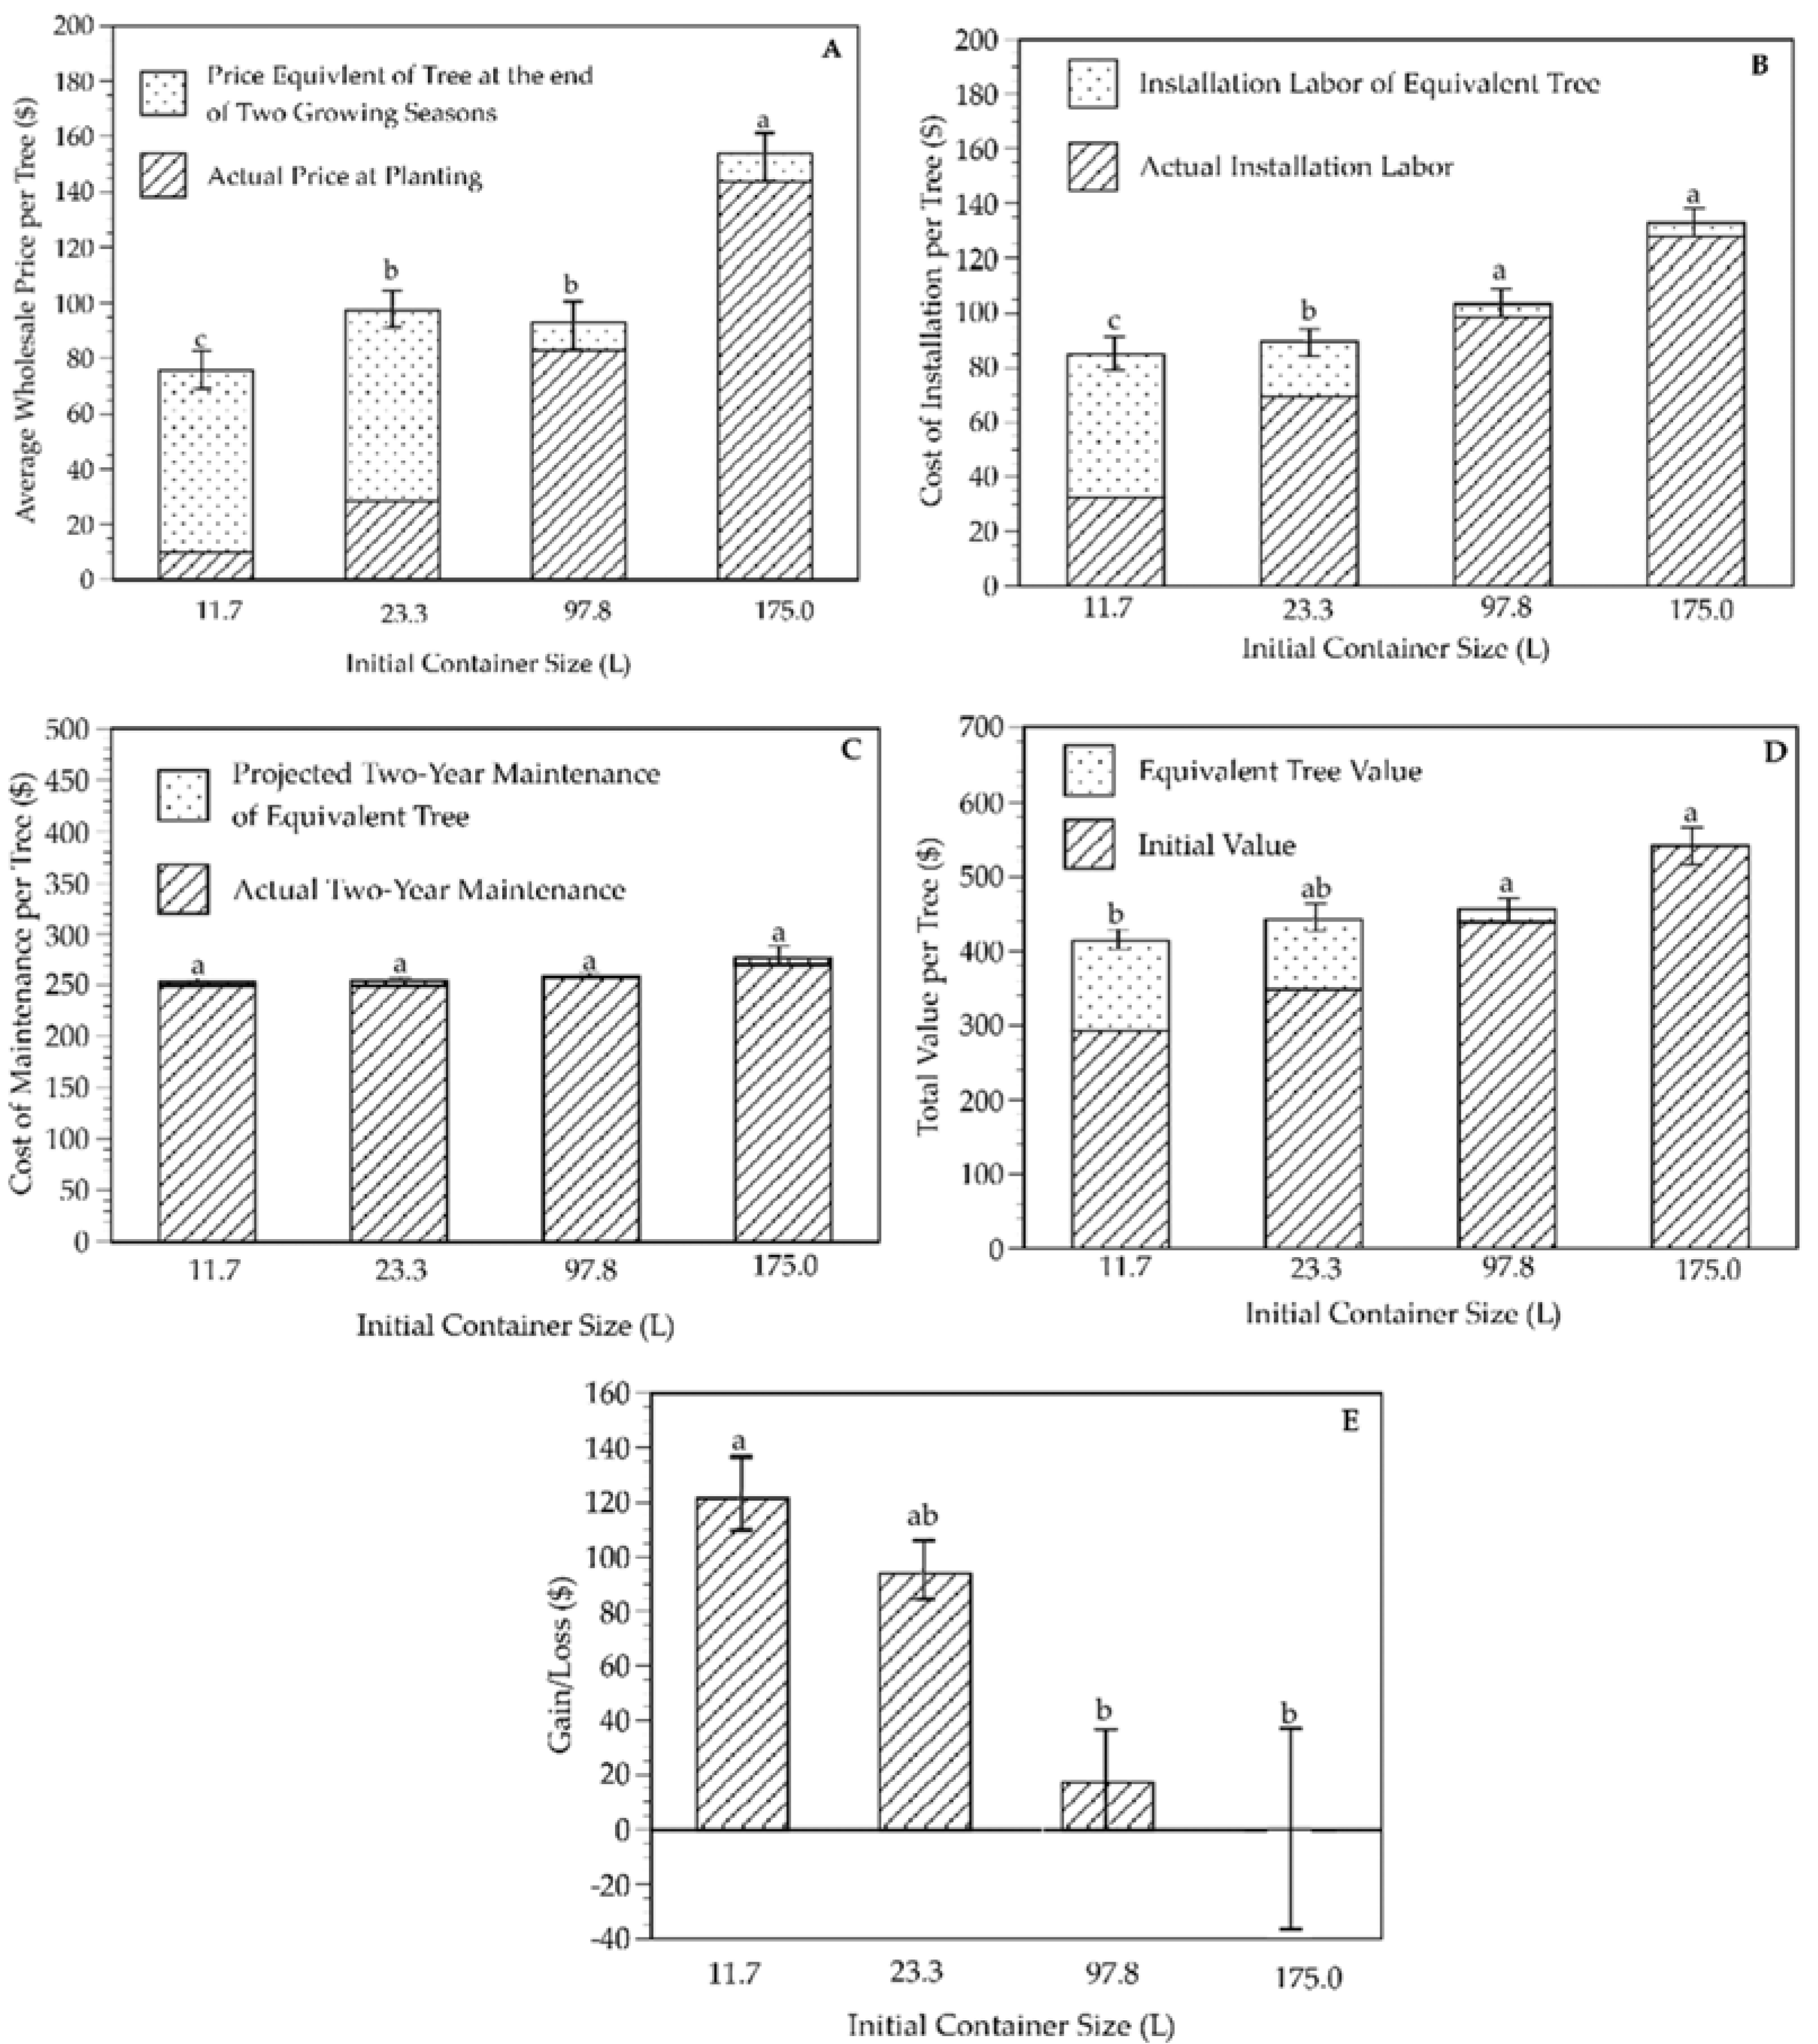
To predict the gain or loss in value over two growing seasons, the wholesale price of the tree at planting is shown with the wholesale price equivalent of the tree at the end of the second growing season (Figure 5A). The 11.7 L and 23.3 L trees had the greatest increase in replacement price, while the 97.8 L and 175.0 L barely increased (Table 1). Analyzing the cost to install the initial container size versus the cost to install the ending container size after two growing seasons also indicated that costs were lower for 11.7 L and 23.3 L container sizes, but with the greatest increase in installation costs of equivalent trees after two seasons (Figure 5B). Finally, maintenance costs remained steady for the two growing seasons with no differences between container size trees (Figure 5C).
This information allowed analysis of the overall value of the tree. The value of the tree increased the most for the 11.7 L trees of A. rubrum, yet the ending value was still not equal to the value of the 175.0 L trees (Figure 5D; Table 1). Therefore, while overall gains were largest for 11.7 L and 23.3 L trees (Figure 5E), 175.0 L trees still maintained the greatest overall value after two growing seasons (Figure 5D). Trends over longer time frames are unknown but suggest trees from smaller sizes may catch up to those from larger size containers if the same growth trends continue.
The stress and initial growth rates of A. rubrum greatly influenced final container sizes at the end of the two growing seasons of this study. The increased container sizes ultimately increased the wholesale cost of the equivalent tree, the cost of labor, and the cost of maintenance. Therefore, overall value of the tree was increased, although the final value of the smaller container sizes did not catch up to or surpass that of the larger container sizes for A. rubrum during the first two growing seasons. However, the gain or loss estimates for trees from each container size helps to present the overall trends. Smaller container-grown A. rubrum produced a greater gain for homeowners over the two growing seasons after transplanting to the landscape than did trees from larger container sizes (Figure 5E; Table 1).
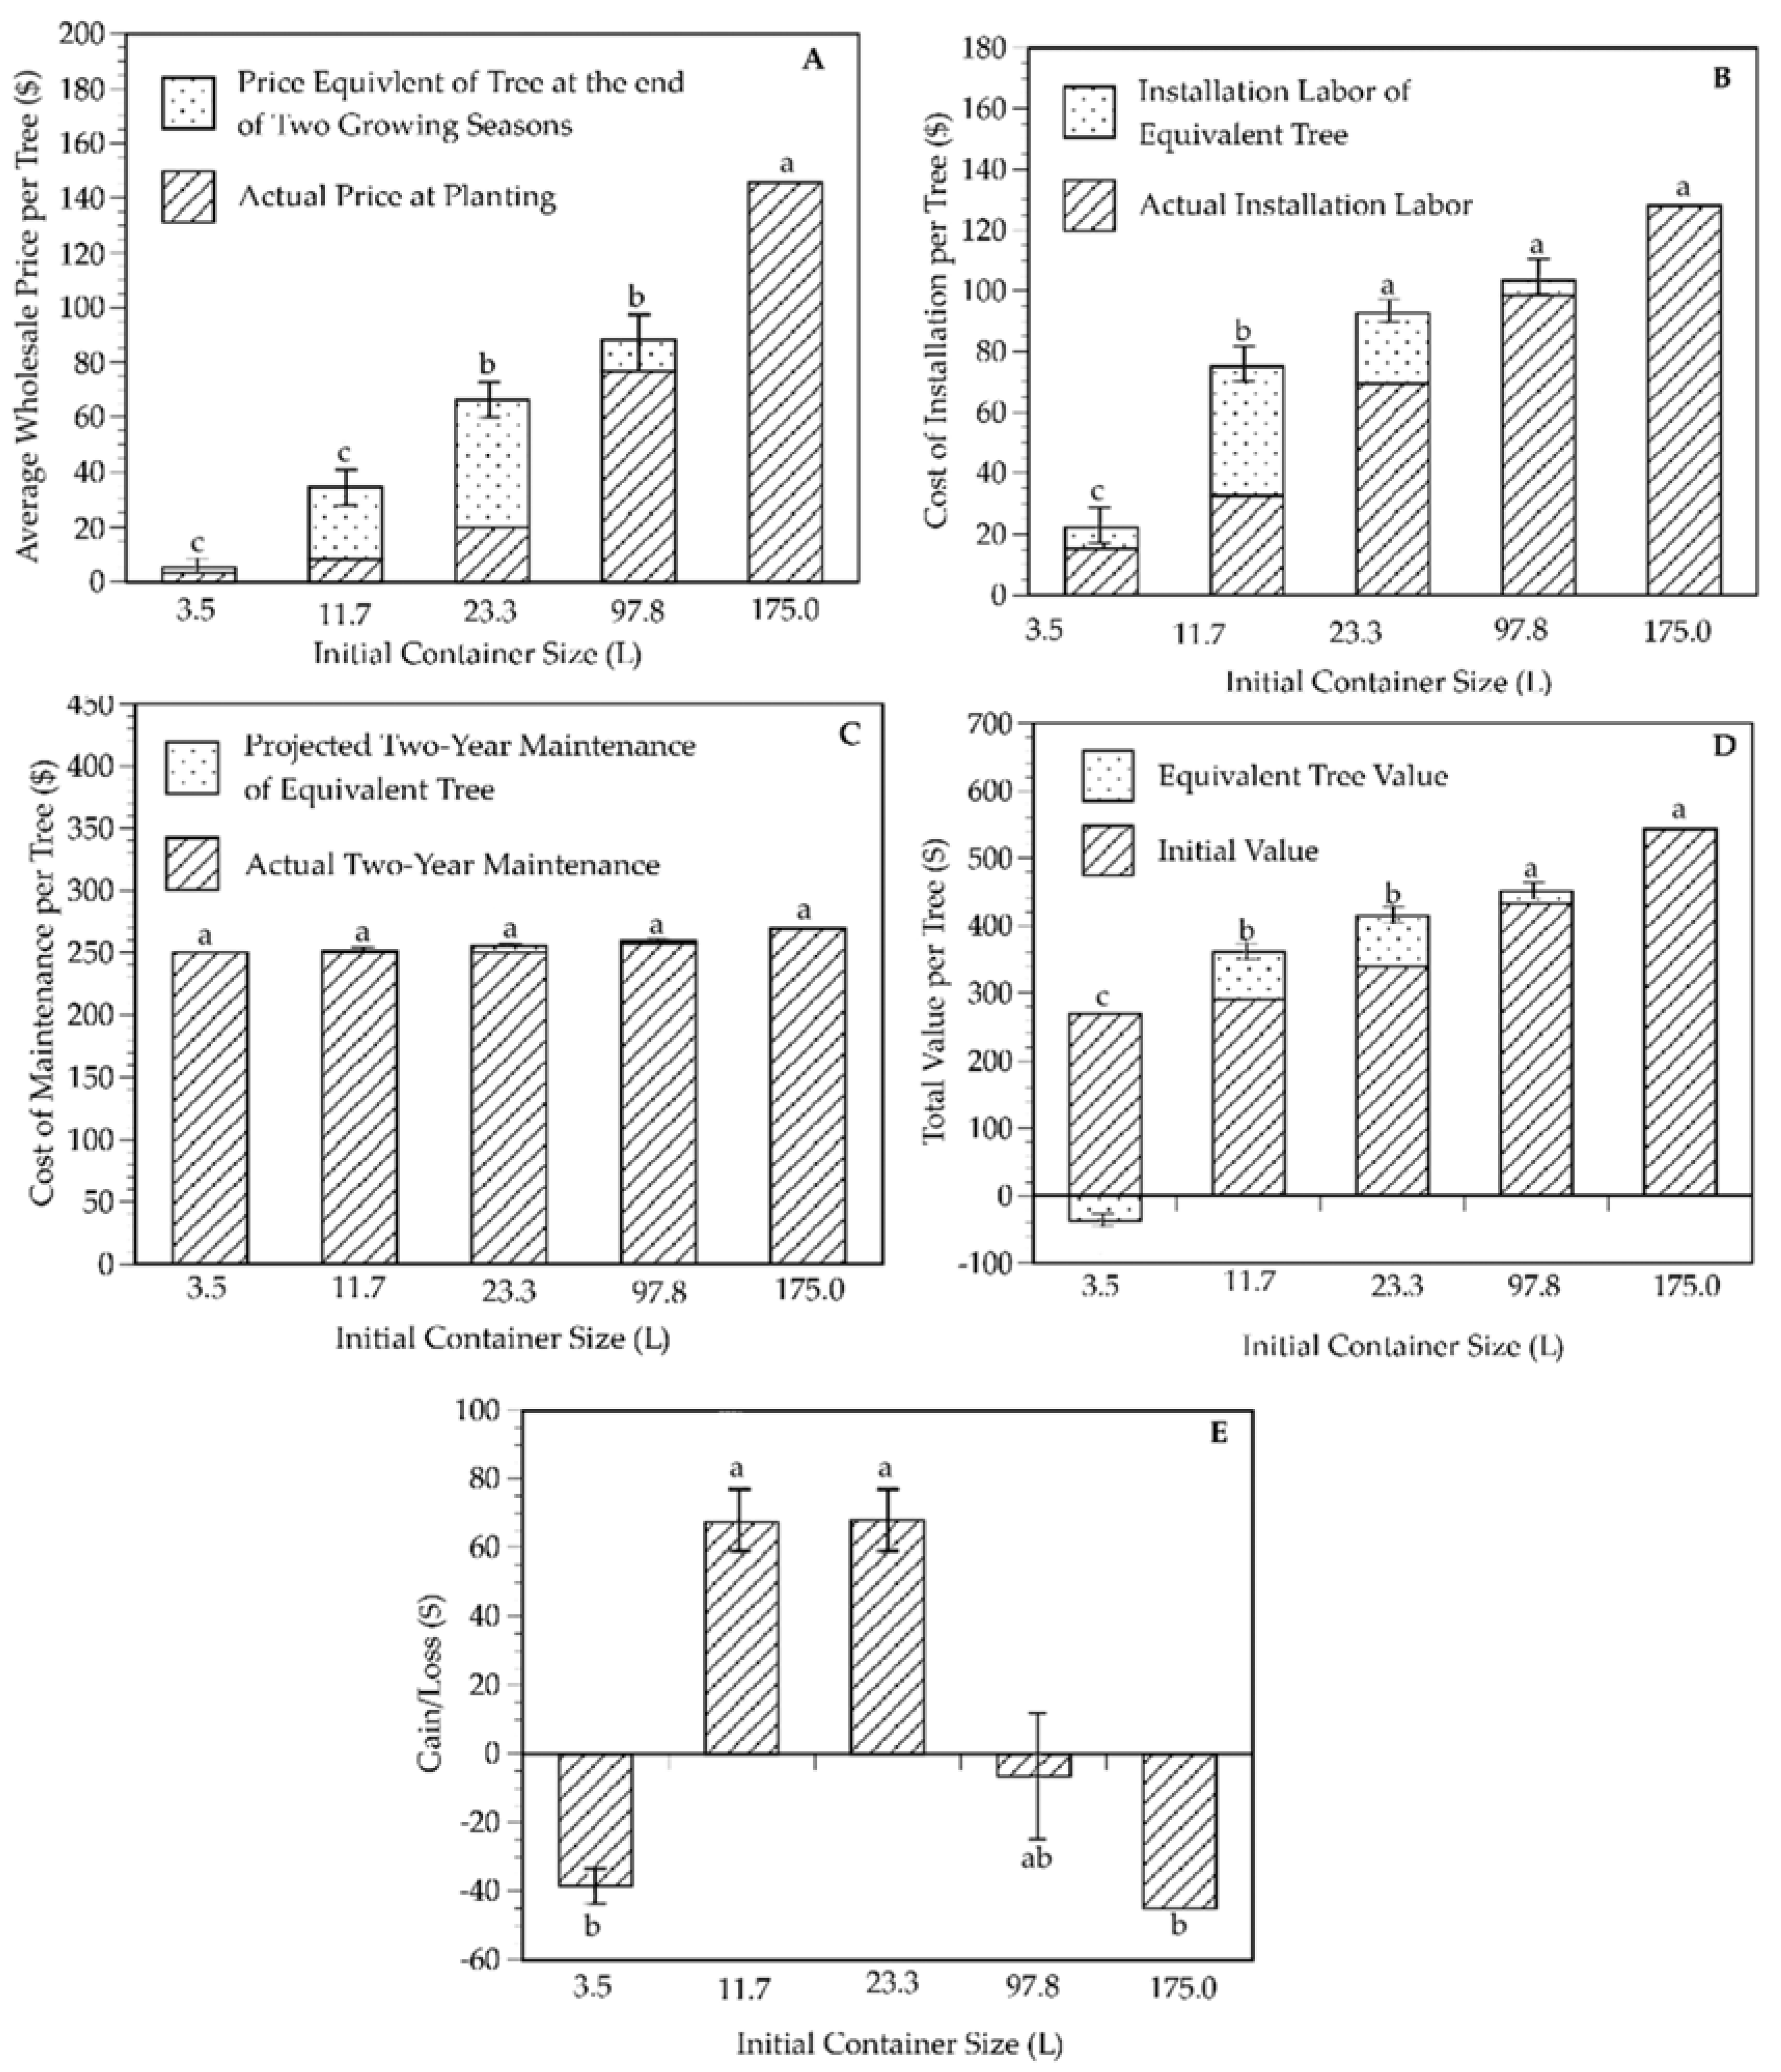
For T. distichum, the greatest container size change occurred with the 23.3 L trees which ended the second growing season at a mean equivalent size of 83.3 L (Figure 4B). In contrast, the 11.7 L and 97.8 L trees changed less and the 3.5 L and 175.0 L T. distichum trees ended with very little change from their initial container sizes. The 97.8 L T. distichum trees ended the second season with only one of the six replicates increasing its equivalent container size and 175.0 L trees did not have any increase in container size equivalents (data not shown). One of the six 3.5 L trees died during the two years, which was calculated as a 0.0 L container tree, thus decreasing the mean equivalent of the remaining container sizes. Mortality was greater in the 3.5 L trees most likely due to their small size, which exposed them to more drift of salinity in the irrigation water from the mini-spray-stakes used during irrigation, greater predation by white-tailed deer (Odocoileus virginianus) and provided a small biomass with which to withstand environmental variation.
The wholesale price of the tree at planting was compared to the wholesale price equivalent of the tree at the end of the second growing season. The 23.3 L trees had the greatest increase in wholesale price, followed by the 11.7 L and 97.8 L trees, while the 3.5 L trees barely increased and 175.0 L trees had no increase above the actual price at planting (Figure 6A; Table 1). The 175.0 L trees were the costliest to purchase initially, but retained the greatest wholesale price equivalent at the end of the two growing seasons despite no increase in size equivalent. Analyzing the cost to install the initial container size versus the cost to install the ending container size after two growing seasons also indicated that while the costs were low for the smaller container sizes, it was also more cost-efficient to plant the smaller container sizes as greatest savings on transplant costs occurred with the 11.7 L and 23.3 L trees (Figure 6B; Table 1). Maintenance costs remained steady for the two growing seasons with no differences between container size trees (Figure 6C).
The summation of this information allowed analysis of the overall value of the tree. The value of the tree increased the most for 11.7 L and 23.3 L container sizes for T. distichum (Figure 6D,E). However, the ending value of both sizes was still not equal to the value of the larger trees transplanted from 175.0 L containers. Therefore, while overall gains were largest in T. distichum from 11.7 L and 23.3 L containers (Table 1; Figure 6E), initially transplanted 175.0 L trees still maintained the greatest overall value after two growing seasons (Figure 6D). However, because the 175.0 L trees did not increase in size, money put into maintenance over the two years was considered a loss, as it did not generate an output in increased growth (Figure 6E). Losses were also seen with the 3.5 L and 97.8 L trees (Table 1; Figure 6E).
Slow growth ultimately impacted the economic cost analysis for T. distichum. Ending container size equivalents of T. distichum were similar to initial size for all container sizes, except 11.7 L and 23.3 L containers (Figure 4B). While the greatest changes occurred with 11.7 L and 23.3 L trees, only the 23.3 L trees increased enough in size so as to not statistically differ from the 97.8 L or 175.0 L trees after two growing seasons (Figure 4B). As a result, the total value and the gain in value were the greatest for 11.7 L and 23.3 L trees, and losses in net value occurred for the remaining container sizes (Figure 6D,E; Table 1).
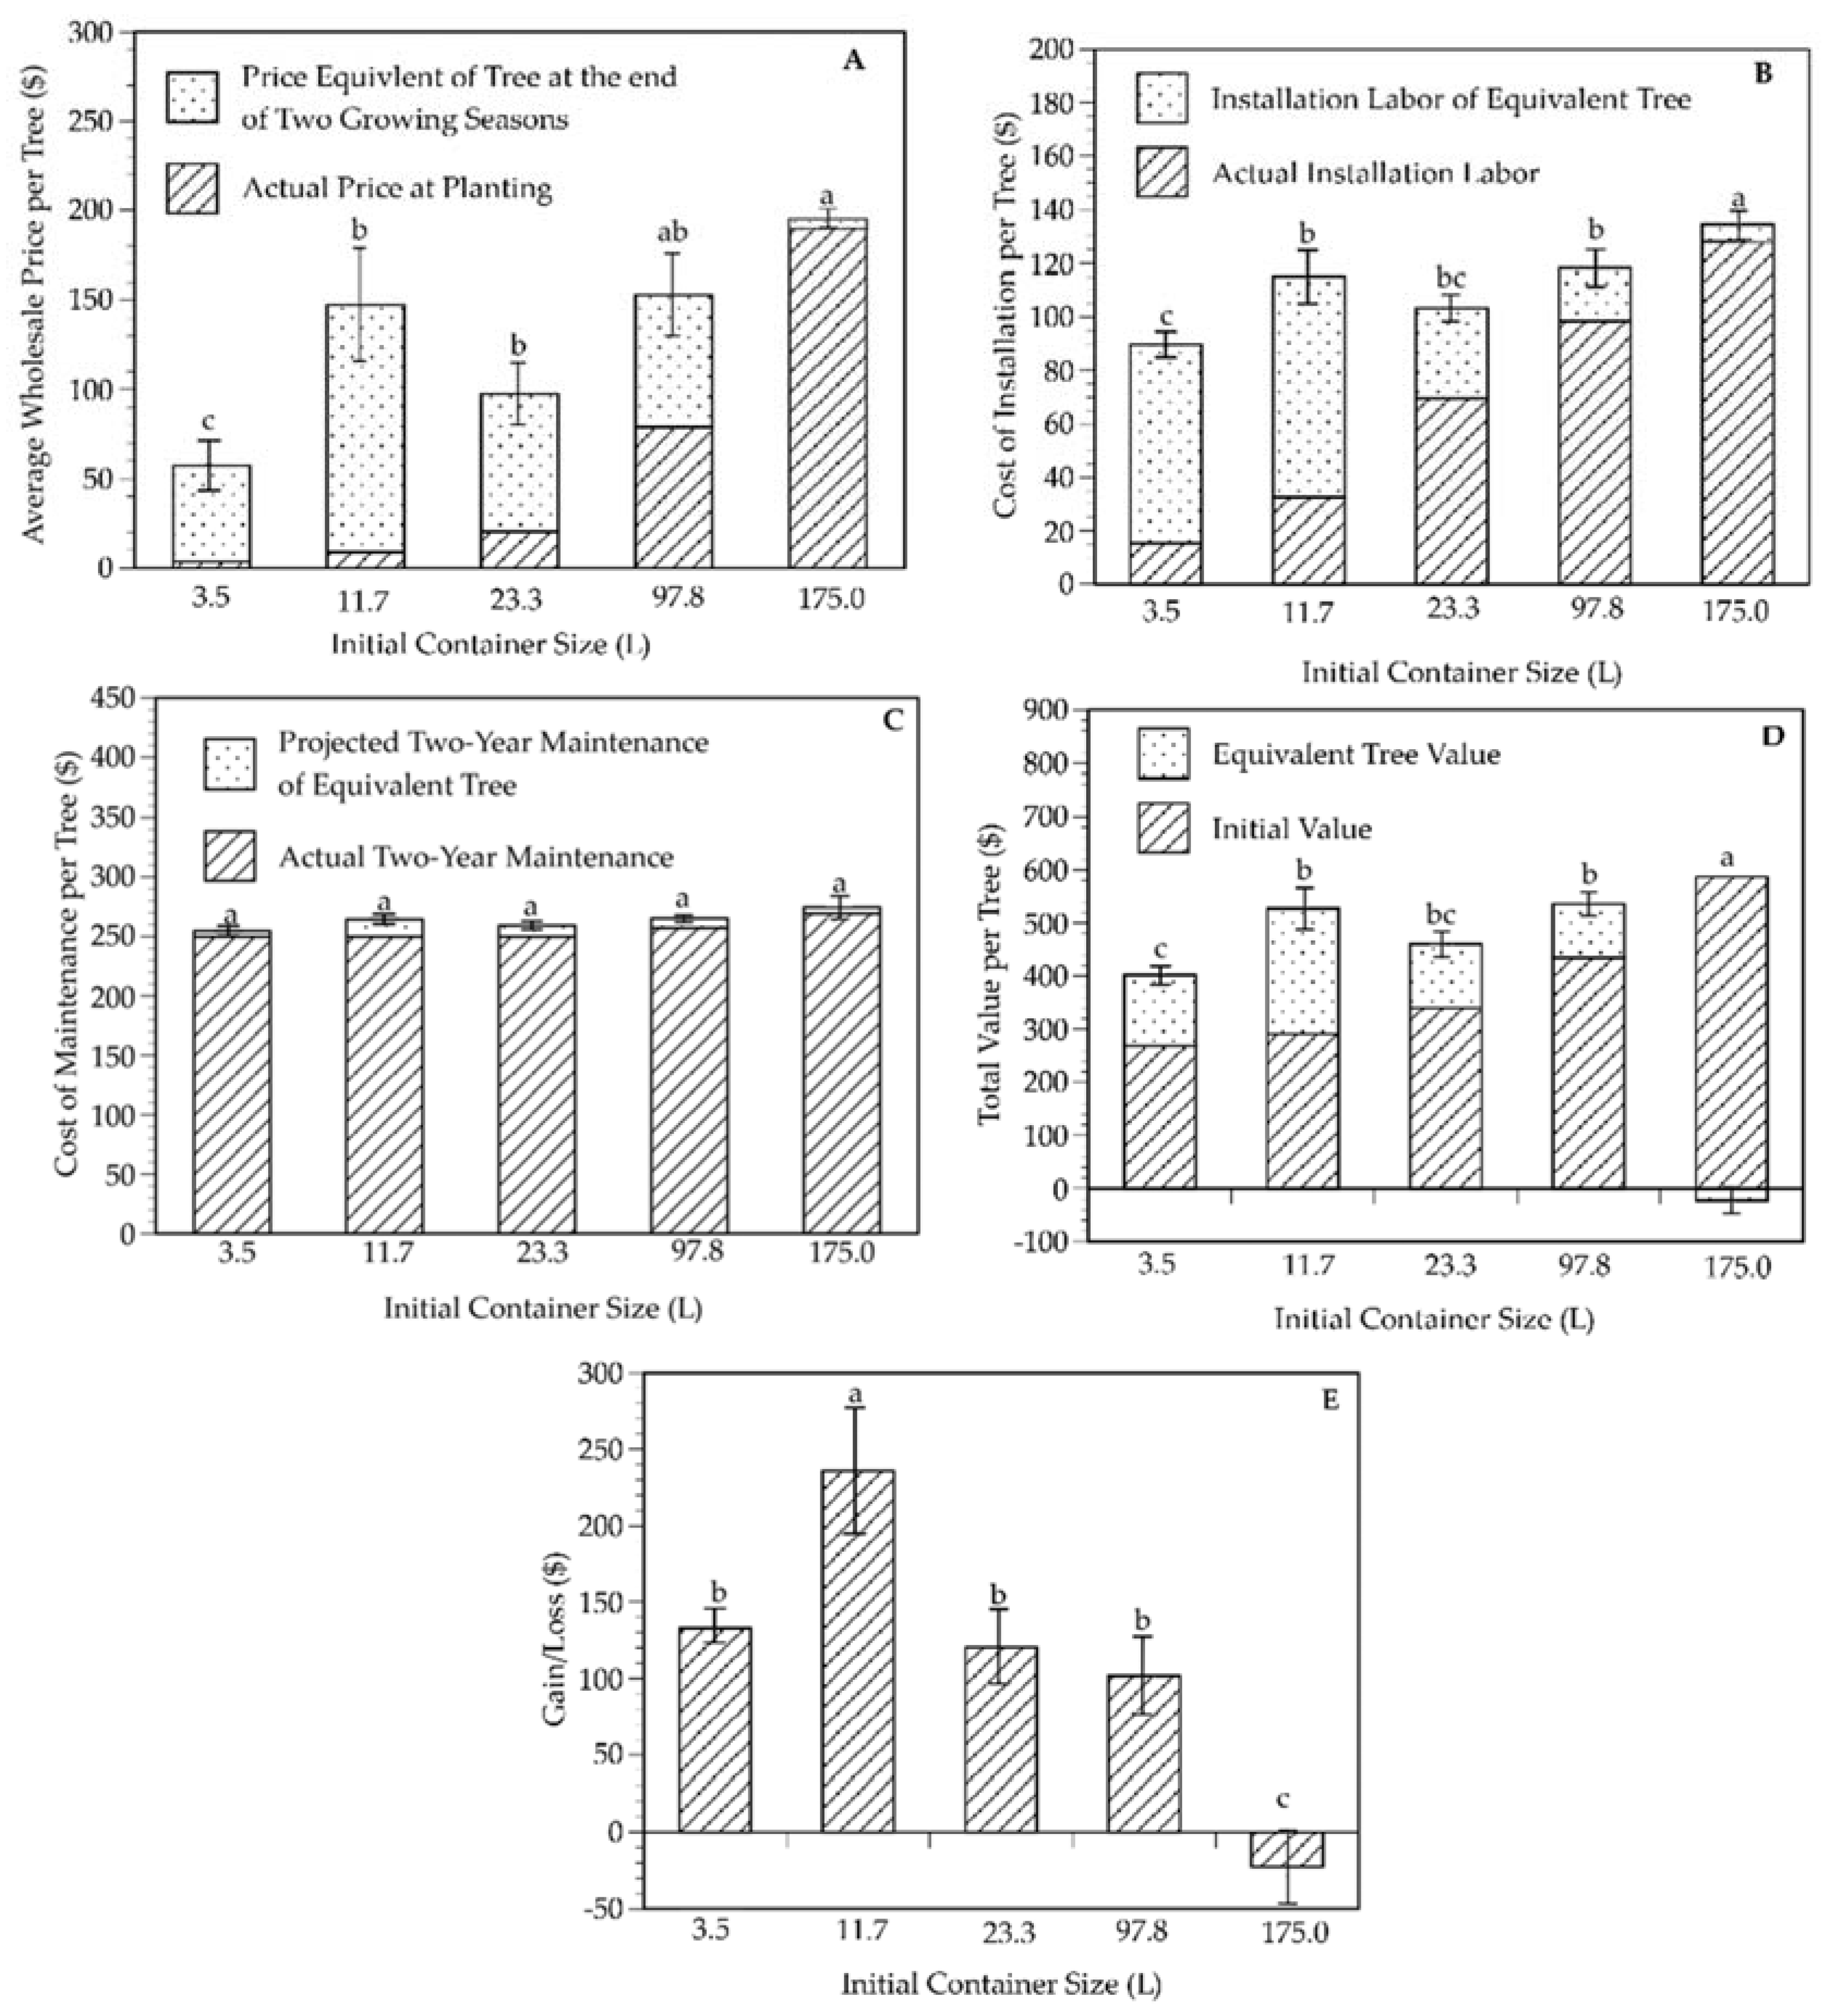
The greatest container size changes for V. agnus-castus occurred with the 11.7 L and 23.3 L trees (Figure 4C; Table 1). The initial 11.7 L and 23.3 L trees ended as 136.3 L and 106.0 L container size trees, respectively. The 3.5 L and 97.8 L container-grown trees ended with similar increases from their initial sizes, and 175.0 L trees increased the least. Ending container sizes were not significantly different among the 11.7, 23.3 and 97.8 L trees, and the 97.8 L trees did not differ from 175.0 L trees (Figure 4C).
The V. agnus-castus trees from 11.7 L containers had the greatest increase in wholesale price, while the 3.5, 23.3 and 97.8 L trees had similar increases to one another (Figure 7A; Table 1). The 11.7 L trees would save homeowners the most money after transplant given the higher initial purchasing and planting costs of the 97.8 L container trees. The 175.0 L trees had no increase in value. Analyzing the cost to install the initial container size versus the cost to install the ending container size after two growing seasons also indicated that while the initial installation costs of trees were low for 3.5 and 11.7 L container-grown trees, it was also more cost-efficient to plant the smaller container sizes in relation to installation costs after two seasons (Figure 7B, Table 1). Maintenance costs did not differ across container sizes for the two growing years (Figure 7C).
The overall value of the trees increased the most for the 11.7 L container sizes of V. agnus-castus, with an ending value equal to that of 97.8 L trees. (Figure 7D; Table 1). The total value of the 23.3 L trees exceeded that of the initial value of the 97.8 L trees. A slight decrease in total value of the 175.0 L trees occurred after two growing seasons. Gains in total value were greatest for the 11.7 L trees, were similar among the 3.5, 23.3 and 97.8 L trees, and showed a slight loss for 175.0 L trees after two growing seasons in the landscape (Table 1; Figure 7E).

4. Conclusions

Previous research has looked at assigning trees a value for real estate, insurance, production, and other uses [10,14]. However, a lack of research in the value of transplanted trees of various sizes persists. While research can be used to demonstrate that smaller or larger container-grown trees perform better in the landscape [24,25,26], oftentimes finances are of greater concern to the consumer. By corroborating evidence that smaller container sizes establish quicker in the landscape [8,21,24,25,26,27] with results indicating that 11.7 L and 23.3 L trees generally produce a greater profit (net value increase) than larger container-grown trees, steps are being taken to create a complete picture to present to consumers. Continued research should look at cost analysis after a 5-year, 10-year, etc. period or develop projection curves to determine if current findings persist over time. The present results were based on selected species and location (Table 1). However, experiments conducted simultaneously in a different growing environment produced similar results [21]. Additional determination of value trends across growing environments and the time value of money during longer growing periods should be considered. Furthermore, research should analyze the impacts on growers if a shift back toward smaller container-grown trees occurred. Finally, as water shortages become a very real problem [28], future studies should monitor the impacts of irrigation costs on the overall cost of transplanting and growing trees. The current study also does not address the aesthetic value of the “instant landscape” provided by larger size stock immediately after installation, nor the potentially greater ecosystem services of larger stock sizes, which may still be justification for planting larger-sized container plants.

Acknowledgments

This work was supported in part by hatch funds from Texas A&M AgriLife Research provided by the National Institute of Food and Agriculture (NIFA) and funding from the Tree Research and Education Endowment (TREE) Fund. Mention of a trademark, proprietary product, or vendor does not constitute a guarantee or warranty of the product by the authors, Texas A&M University, or Texas A&M AgriLife Research and does not imply its approval to the exclusion of other products or vendors that also may be suitable. Special thanks to Leo Lombardini, Todd Watson, and Andrew King for their assistance during the nursery production and field transplant portions of this experiment which permitted this economic analysis to be conducted.
Horticulturae 03 00029 i001

Author Contributions

Michael A. Arnold and Lauren M. Garcia Chance conceived and designed the experiments; Lauren M. Garcia Chance performed the experiments; Lauren M. Garcia Chance and Sean T. Carver analyzed the data; Charles R. Hall contributed economic assistance and references; Lauren M. Garcia Chance wrote the initial paper with edits from the coauthors.

Conflicts of Interest

The authors declare no conflict of interest.

References

  1. Arnold, M.A. Challenges and benefits of transplanting large trees: An introduction to the workshop. HortTechnology 2004, 15, 115–117. [Google Scholar]
  2. Watson, W.T. Influence of tree size on transplant establishment and growth. HortTechnology 2004, 15, 118–122. [Google Scholar]
  3. Kalmbach, K.L.; Kielbaso, J.J. Residents’ attitudes toward selected characteristics of street tree plantings. J. Arboric. 1979, 5, 124–129. [Google Scholar]
  4. Schroeder, H.; Flannigan, J.; Coles, R. Residents’ attitudes toward street trees in the UK and U.S. communities. Arboric. Urban For. 2006, 32, 236–246. [Google Scholar]
  5. Nowak, D.J.; Hoehn, R.; Crane, D. Oxygen production by urban trees in the United States. Arboric. Urban For. 2007, 33, 220–226. [Google Scholar]
  6. Watson, G.W.; Himelick, E.B. The Practical Science of Planting Trees; International Society of Arboriculture: Champaign, IL, USA, 2013. [Google Scholar]
  7. Maco, S.E.; McPherson, E.G. A practical approach to assessing structure, function, and value of street tree populations in small communities. J. Arboric. 2003, 29, 84–97. [Google Scholar]
  8. Gilman, E.F.; Black, R.J.; Dehgan, B. Irrigation volume and frequency and tree size affect establishment rate. J. Arboric. 1998, 24, 1–9. [Google Scholar]
  9. Gilman, E.F.; Kane, M.E. Root growth of red maple following planting from containers. HortScience 1990, 25, 527–528. [Google Scholar]
  10. Cullen, S. Tree appraisal: What is the trunk formula method. Arboric. Consul. 2000, 30, 3. [Google Scholar]
  11. Council of Landscape & Tree Appraisers. Guide for Plant Appraisal, 9th ed.; International Society of Arboriculture: Champaign, IL, USA, 2000. [Google Scholar]
  12. Cullen, S. Tree appraisal: Chronology of North American industry guidance. J. Arboric. 2005, 31, 157–162. [Google Scholar]
  13. Cullen, S. Tree appraisal: Can depreciation factors be rated greater than 100%? J. Arboric. 2002, 28, 153–158. [Google Scholar]
  14. McPherson, E.G. Benefit-based tree valuation. Arboric. Urban For. 2007, 33, 1–11. [Google Scholar]
  15. The Appraisal Institute. The appraisal of rural property. Apprais. J. 2000, 68, 20. [Google Scholar]
  16. Mcpherson, E.G.; Kendall, A.; Albers, S. Life cycle assessment of carbon dioxide for different arboricultural practices in Los Angeles, CA. Urban For. Urban Green. 2015, 14, 388–397. [Google Scholar] [CrossRef]
  17. McPherson, E.G. Northern Mountain and Prairie Community Tree Guide: Benefits, Costs and Strategic Planting; Center for Urban Forest Research, USDA Forest Service, Pacific Southwest Research Station: Davis, CA, USA, 2003. [Google Scholar]
  18. Xiao, Q.; McPherson, E.G.; Ustin, S.L.; Grismer, M.E. A new approach to modeling tree rainfall interception. J. Geophys. Res. 2000, 105, 29173–29188. [Google Scholar] [CrossRef]
  19. Anderson, L.M.; Cordell, H.K. Residential property values improve by landscaping with trees. South. J. Appl. For. 1988, 9, 162–166. [Google Scholar]
  20. Garcia, L.M. Post-Transplant Establishment and Economic Value of Three Tree Species from Five Container Sizes. Master’s Thesis, Texas A&M University, College Station, TX, USA, 2015. [Google Scholar]
  21. Garcia, L.M.; Arnold, M.A.; Denny, G.C.; Carver, S.T.; King, A.R. Differential environments influence initial transplant establishment among tree species produced in five container sizes. Arboric. Urban For. 2016, 42, 170–180. [Google Scholar]
  22. American Association of Nurserymen. ANSI Z60.1-2004. In American Standards for Nursery Stock; American Association of Nurserymen: Washington, DC, USA, 2004. [Google Scholar]
  23. Mewis, B. RSMeans Residential Cost Data 2014, 33rd ed.; RSMeans Company: Norcross, GA, USA, 2014. [Google Scholar]
  24. Gilman, E.F.; Masters, F. Effect of tree size, root pruning and production method on root growth and lateral stability of Quercus virginiana. Arboric. Urban For. 2010, 36, 281–291. [Google Scholar]
  25. Lambert, B.B.; Harper, S.J.; Robinson, S.D. Effect of container size at time of planting on tree growth rates for baldcypress (Taxodium distichum (L.) Rich), red maple (Acer rubrum L.) and longleaf pine (Pinus palustris Mill.). Arboric. Urban For. 2010, 36, 93–99. [Google Scholar]
  26. Struve, D.K. Tree establishment: A review of some of the factors affecting transplant survival and establishment. Arboric. Urban For. 2009, 35, 10–13. [Google Scholar]
  27. Gilman, E.F.; Harchick, C.; Paz, M. Effect of tree size, root pruning, and production method on establishment of Quercus virginiana. Arboric. Urban For. 2010, 36, 183–190. [Google Scholar]
  28. USGS. Estimated Use of Water in the United States County-Level Data for 2005. Available online: http://water.usgs.gov/watuse/data/2005 (accessed on 6 November 2013).
Figure 1. Mean (±standard error) wholesale price [US$] by container size for three tree species (A. rubrum, T. distichum, and V. agnus-castus) in 2013 where n ≥ 12.
Horticulturae 03 00029 g001
Figure 2. Labor and materials cost [US$] per tree for transplant by hand or machinery of various container size trees in 2013 (excluding wholesale cost of tree) as determined from RSMeans [23].
Horticulturae 03 00029 g002
Figure 3. Maintenance costs [US$] per tree for fertilization, pest control, weeding, pruning, and watering of various container sizes summed over a two-year period of growth as determined by RSMeans [23].
Horticulturae 03 00029 g003
Figure 4. Mean (±standard error) of initial and ending container size of Acer rubrum (A); Taxodium distichum (B); or Vitex agnus-castus (C) trees from transplant (diagonal hatching) to the end of the second growing season (stippled hatching). Initial sizes were 3.6, 11.7, 23.3, 97.8 and 175.0 L; n = 6 or T. distichum and V. agnus-castus and 11.7, 23.3, 97.8 and 175.0 L; n = 6 for A. rubrum. Means of ending container sizes with the same letter are not significantly different at p ≤ 0.05 using Student’s t-test.
Horticulturae 03 00029 g004
Figure 5. Mean (±standard error) wholesale cost (A), installation (B), maintenance cost (C), value (D), and gain or loss in dollars [US$] (E) of Acer rubrum trees from transplant (diagonal hatching) to the end of the second growing season (stippled hatching) for initial container sizes of 11.7, 23.3, 97.8 and 175.0 L trees. Means of final values after two growing seasons for initial container sizes with the same letter are not significantly different at p ≤ 0.05 using Student’s t-test.
Horticulturae 03 00029 g005
Figure 6. Mean (±standard error) wholesale cost (A), installation (B), maintenance cost (C), value (D), and gain or loss in dollars [US$] (E) of Taxodium distichum trees from transplant (diagonal hatching) to the end of the second growing season (stippled hatching) for initial container sizes of 3.5, 11.7, 23.3, 97.8 and 175.0 L trees. Means of final values after two growing seasons for initial container sizes with the same letter are not significantly different at p ≤ 0.05 using Student’s t-test.
Horticulturae 03 00029 g006
Figure 7. Mean (±standard error) wholesale cost (A), installation (B), maintenance cost (C), value (D), and gain or loss in dollars [US$] (E) of Vitex agnus-castus trees from transplant (diagonal hatching) to the end of the second growing season (stippled hatching) for initial container sizes of 3.5, 11.7, 23.3, 97.8 and 175.0 L trees. Means of container sizes topped by the same letter are not significantly different at p ≤ 0.05 using Student’s t-test.
Horticulturae 03 00029 g007
Table 1. Means and Analysis of Variance of the effects of tree species and initial container size on changes in size, price, costs, and value of trees after transplanting to the landscape and growing for two seasons.
SpeciesInitial Container Size (L)Change in Container Size (L)Change in Wholesale Price ($)Change in Installation Cost ($)Change in Maintenance Cost ($)Gain/Loss in Value ($)
Acer rubrum11.746.5 ± 12.1 a,b45.2 ± 9.2 a,x,y52.4 ± 4.6 a3.8 ± 1.4 a121.4 ± 15.3 a
23.349.2 ± 8.3 a38.5 ± 7.2 a20.2 ± 3.9 b5.6 ± 1.2 a94.0 ± 12.4 a,b
97.812.4 ± 12.4 b10.1 ± 10.1 b4.9 ± 4.9 c2.0 ± 2.0 a17.1 ± 17.1 b
17512.4 ± 12.4 b18.0 ± 18.0 a,b4.8 ± 4.8 c9.7 ± 9.7 a0.0 ± 32.5 b
Taxodium distichum3.51.8 ± 1.8 c2.0 ± 1.3 c6.9 ± 5.0 c0.2 ± 0.1 b−38.4 ± 6.5 b
11.729.5 ± 5.6 b26.0 ± 4.9 b42.5 ± 6.0 a1.8 ± 0.3 b67.3 ± 11.0 a
23.355.2 ± 7.9 a46.2 ± 6.6 a23.1 ± 3.6 b6.6 ± 1.2 a68.0 ± 11.5 a
97.812.4 ± 12.4 b,c11.5 ± 11.5 b,c4.9 ± 4.9 c2.0 ± 2.0 b−6.6 ± 18.4 a,b
1750.0 ± 0.0 c0.0 ± 0.0 c0.0 ± 0.0 c0.0 ± 0.0 b−45.0 ± 0.0 b
Vitex agnus-castus3.565.4 ± 11.3 b53.8 ± 10.0 b74.4 ± 3.9 a6.1 ± 1.3 a132.9 ± 15.2 b
11.7127.1 ± 20.4 a138.5 ± 27.0 a82.7 ± 8.3 a15.5 ± 3.2 a235.8 ± 38.6 a
23.380.6 ± 12.4 a,b77.1 ± 18.4 a,b33.9 ± 4.9 b10.5 ± 2.0 a120.3 ± 25.4 b
97.850.3 ± 15.8 b73.8 ± 23.3 a,b19.6 ± 6.2 b8.1 ± 2.5 a101.6 ± 32.1 b
17514.0 ± 14.0 c12.4 ± 12.4 c4.8 ± 4.8 c9.7 ± 9.7 a−22.6 ± 28.5 c
Species****** z*********
Container Size***************
Species * Container Size*n.s.*n.s.*
x Standard errors, with different letters (a,b,c) indicate significant differences using Students t-test at p ≤ 0.05 within each species; y Values within a column represent the mean of six observations ± standard errors; z *,*** Indicate significance of the main effect or interaction at p ≤ 0.05, 0.001, respectively, or not significant (n.s.).