Article

Evaluation and Refinement of Chinese DUS Test Guidelines Based on Comprehensive Phenotypic Traits: A Case Study of Hawthorn (Crataegus spp.)


1
School of Architecture, Inner Mongolia University of Technology, No.49 Ai Min Road, Hohhot 010051, China
2
Inner Mongolia Key Laboratory of Grassland Human Settlement System and Low-Carbon Construction Technology, No.49 Ai Min Road, Hohhot 010051, China
3
National Field Genebank for Hawthorn, Shenyang 110866, China
4
College of Horticulture, Shenyang Agricultural University, Shenyang 110866, China
*
Authors to whom correspondence should be addressed.
Horticulturae 2026, 12(9), 1132; https://doi.org/10.3390/horticulturae12091132
Submission received: 21 July 2026 / Revised: 1 September 2026 / Accepted: 2 September 2026 / Published: 7 September 2026

Highlights

What are the main findings?
  • Example varieties and test traits in the Chinese Hawthorn DUS Test Guidelines exhibit high stability.
  • Phenotypic analysis of 197 hawthorn accessions identified rich genetic diversity across 33 traits.
  • A quantitative trait grading framework was established to optimize hawthorn DUS testing guidelines.
What are the implications of the main findings?
  • This optimization strategy provides a methodological template for revising DUS guidelines across other plant taxa.
  • These findings refine the descriptor system for hawthorn variety identification, and the research outcomes strengthen the protection, development, and breeding of new hawthorn varieties.

Abstract

Hawthorn (Crataegus spp.), a horticultural crop with significant edible, medicinal, and ornamental values, has garnered increasing attention from breeders to markets, leading to continuous emergence of new varieties. Accurate phenotypic characterization and robust Distinctness, Uniformity, and Stability (DUS) testing are fundamental for plant variety protection and breeding innovation. Employing the Chinese DUS Test Guidelines for Hawthorn (LY/T 3208-2020) as an analytical framework, this study systematically evaluated 197 germplasm accessions from the Chinese National Field Genebank. Results demonstrated: (1) Coefficients of Coincidence (COC) for example varieties and test traits ranged between 0.980 and 1.000, fully meeting the testing requirements; (2) the 22 qualitative (QL) and pseudo-qualitative traits (PQ) were categorized into 2–5 classes with Shannon-Wiener indices of 0.032–1.174, indicating high polymorphism; (3) correlation analysis of 11 quantitative traits (QN) revealed coefficients from 0.006 to 0.922, with 23 trait pairs showing statistical significance, while principal component analysis identified fruit and leaf traits as primary drivers of phenotypic variation; (4) grading schemes were established by using Least Significant Difference (LSD) for eight normally or near-normally distributed traits (5–7 classes) and range-based grading approach for three non-normal traits (5 classes). Based on the above results, this study evaluated China’s current DUS testing guidelines for hawthorn. Subsequently, 197 hawthorn accessions were used to evaluate the QL, PQ, and QN traits, based on which corresponding optimization recommendations were proposed. Ultimately, an optimized testing framework for hawthorn DUS testing was established. The resulting analytical insights and phenotypic grading system will enrich the current descriptor framework and provide a foundational dataset for trait-DNA association and marker-assisted breeding. Notably, this optimization strategy serves as a methodological template for updating DUS guidelines in other taxa. Overall, these insights strengthen the protection, development, and breeding of new hawthorn varieties while advancing the standardization of DUS testing.

1. Introduction

New plant varieties are the cornerstone of agricultural genetic advancement and the critical driver for industrial innovation. Revitalizing the seed sector necessitates a robust protection system that upholds breeders’ rights through rigorous authorization standards. To this end, the International Union for the Protection of New Varieties of Plants (UPOV) provides an international framework to incentivize breeding innovation for societal benefit (https://www.upov.int/en/about-upov/overview (accessed on 30 December 2025)) [1]. The UPOV Convention has evolved through three major revisions, specifically the widely adopted 1978 and 1991 Acts [2]. China formally established its plant variety protection regime by acceding to the 1978 Act in 1999. Despite this relatively recent start, the nation has made significant progress; for eight consecutive years, China has ranked first globally in the number of plant variety rights applications.
A major milestone was reached in 2025 by the substantial revision of China’s Regulations on the Protection of New Plant Varieties, significantly aligning the domestic legal framework with UPOV 1991 standards. The continued refinement of the 2021 Seed Law, alongside these revised Regulations, establishes a robust institutional foundation for China’s potential accession to both the UPOV 1991 Act and the Comprehensive and Progressive Agreement for Trans-Pacific Partnership (CPTPP).
Under the UPOV framework for plant variety protection, breeders are granted intellectual property rights to new varieties that meet three fundamental criteria: distinctness (D), uniformity (U), and stability (S) [3]. The evaluation of these criteria is conducted through DUS testing, with DUS Test Guidelines serving as the statutory technical basis for variety examination and authorization [4]. As of December 2025, UPOV had published 342 DUS Test Guidelines (https://www.upov.int/test_guidelines/en/ (accessed on 30 December 2025)), while China has established 357 such guidelines, comprising 45 national standards and industry standards categorized into forestry (84) and agriculture (228) sectors (https://std.samr.gov.cn/). These testing guidelines have been widely applied in practical testing.
Despite the rapid advancement in our understanding of plant biology over the past decades, and the significant increase in the number of authorizations, many attempts to improve the DUS system over the years have achieved little success [5,6,7]. The DUS system has changed little and is still largely dependent upon a set of precise morphological traits for testing candidate varieties. As the demand for more plant varieties increases, an urgent and elaborate review of the phenotypic system is thus required. While numerous reports have addressed the genetic diversity of qualitative (QL) and pseudo-qualitative traits (PQ) traits [8,9,10] and proposed methods for grading quantitative traits (QN) [11,12,13], practical implementation of DUS guidelines remains problematic. Specifically, QN are highly susceptible to environmental fluctuations [14,15], whereas phenotypic criteria for QL and PQ often remain ambiguous [16]. Consequently, there is still a lack of systematic and comprehensive optimization schemes for DUS testing protocols.
Using the Chinese Hawthorn DUS test guidelines as a test case, we evaluated the current DUS test guidelines and refined them based on a comprehensive analysis of 197 accessions from the National Field Genebank, 44 DUS traits, and 35 example varieties. This study proposes a systematic framework for optimizing DUS testing protocols, using the Chinese hawthorn guidelines as a case study.
Due to the uniqueness of resources in China, it is not appropriate to directly apply the UPOV hawthorn DUS test guideline or standardized phenotyping protocols for the accurate description of phenotypic data in Chinese hawthorn. Against this backdrop, the drafting of hawthorn testing guidelines was initiated by the National Forestry and Grassland Administration after the genus was included in the fifth batch of the Forestry Protection List in 2013. The guidelines were formally promulgated and implemented in 2020 [17]. Crataegus spp., belonging to the Crataegus L. within the Rosaceae family, is widely distributed across Eurasia and North America [18]. In China, hawthorn fruits are consumed fresh but more commonly processed and are highly valued for their medicinal functions, including digestive, cardiovascular, and neurological benefits [19,20,21,22]. Recognized as a traditional medicinal and food plant [23], it is officially listed in the Medicinal Food Catalogue by the National Health Commission of China. Currently, hawthorn is also increasingly used in landscape design and ecological construction [24], solidifying its role as an important horticultural plant. China serves as both a major center of origin and principal cultivation region for hawthorn, exhibiting substantial genetic diversity that comprises 18 species and 6 varieties. Notably, the endemic C. pinnatifida var. major [25] is the dominant cultivated taxon in northern China and exhibits pronounced regional differentiation, with hundreds of documented varieties in provinces such as Shandong, Hebei and Liaoning provinces [26].
Such extensive genetic and phenotypic diversity poses considerable challenges for the accurate characterization of hawthorn accessions under existing DUS testing frameworks. To address these challenges, phenotypic analysis—a direct, rapid, and efficient method [8,27]—has been widely applied in hawthorn [28,29,30], during the development and implementation of its testing standards. Consequently, hawthorn serves as an ideal model for optimizing DUS testing guidelines.
The objectives of this study are: (1) to evaluate the current DUS test guidelines (LY/T 3208-2020) using the COC and propose targeted improvements to relevant qualitative and quantitative characteristics; (2) to assess the phenotypic diversity of hawthorn resources through statistical analysis and rigorously evaluate key phenotypic traits; (3) to analyze QN and establish a corresponding grading framework. The research outcomes will support the standardization of descriptor systems and data, facilitate the refinement of DUS testing guidelines for Chinese hawthorn, and thereby assist in variety identification, resource utilization, and breeding programs for hawthorn germplasm resources. Furthermore, the proposed optimization framework is transferable to other taxa, providing a reliable case for the protection and characterization of new plant varieties.

2. Materials and Methods

2.1. Plant Materials

The experimental materials consisted of 197 hawthorn germplasm accessions (Supplementary Information Table S1) preserved at the National Field Genebank for Hawthorn (Crataegus spp.) (NFGH-SY) in Shenyang, China. This national-level genebank conserves over 400 domestic and foreign germplasm resources, representing the largest and most comprehensive specialized repository in China. Our extensive sampling covers more than half of the domestic resources, ensuring the representation of China’s native hawthorn biodiversity.

2.2. Investigation of Phenotypic Traits

In compliance with the DUS test Guidelines (LY/T 3208-2020) (specifically referring to China’s testing guidelines; see Supplementary Information Tables S2–S4 for details), phenotypic trait data were collected over a three-year period (2023–2025), and all trait observations were conducted in accordance with the prescribed DUS testing procedures. The investigation encompasses 22 QL and PQ alongside 11 QN (Table 1). Select healthy, mature plants free of pests and diseases for observation and data sampling.
Twenty-two qualitative and pseudo-qualitative traits were observed and recorded using visual assessment.
For the 11 quantitative traits, measurements were performed using either a digital caliper (precision: 0.01 cm) or a caliper (precision: 0.1 cm), depending on trait type. Leaf sampling was conducted at the leaf expansion stage. Three plants were selected, and multiple leaves were collected from the east, west, south, and north sides of each plant. The leaves were pooled, and 10 were randomly selected for measurement using a caliper. The leaf length-to-width ratio was calculated as leaf length divided by leaf width. Inflorescence measurements were conducted at full bloom. Three plants were selected, and inflorescences were collected from the middle sections of sun-exposed branches in the outer canopy. The diameter of small flowers was measured using a caliper. Fruit and endocarp traits were measured at fruit maturity. Three plants were selected, and multiple fruits were randomly collected from each plant, The fruits were pooled, finally, 15 fruits were randomly selected. Measurements were performed using an electronic vernier caliper. The fruit length-to-width ratio was calculated as fruit length divided by fruit width. Subsequently, one intact endocarp was randomly selected from each measured fruit. Endocarp length and width were measured, and the endocarp length-to-width ratio was calculated as endocarp length divided by endocarp width.

2.3. Statistical Analysis

Data pre-processing: Data validity was evaluated in Origin using the Box-Plot and 3σ methods [31,32]. Outliers identified by both methods required manual verification of original records or field samples. Data entry errors were corrected directly. If the outlier reflected true variation and numbered no more than two, the value was corrected using the average of adjacent measurements. If more than two outliers were present, no adjustment was made; instead, consistency was subsequently checked using the relative variance method or COYU (Combined-Over-Years Uniformity).
After completing the data validity check, the Coefficient of Coincidence (COC) for example varieties and tested traits was calculated in Excel 2019 using the formula: i = 1 − Σ(ab)2/(X × 100), in the formula: “i” denotes the COC for an example variety (or trait), “a” represents the guide code value for an example variety (or trait), “b” denotes the measured code value for an example variety (or trait), and “X” denotes the mean value of the guide code for an example variety (or trait) [33].
Phenotypic traits were statistically analyzed using Excel 2019. Frequency distributions were calculated for 22 QL and PQ. For all quantitative traits, the maximum, minimum, range, mean value, median, standard deviation (SD), coefficient of variation within varieties, and coefficient of variation among varieties were calculated. Genetic diversity indices were calculated as H′ = −Σ Pi ln Pi, where “Pi” represents the frequency of a specific trait level [34]. Pielou’s evenness (J) was calculated using the index J = H′/lnS, where H′ represents the Shannon–Wiener diversity index and S denotes the number of trait code categories [35]. Correlation analysis and principal component analysis (PCA) were performed on quantitative traits by using Origin 2022, and corresponding visualization charts were generated.
QN were analyzed in Origin 2022 using the Kolmogorov–Smirnov (K–S) normality test, one-way ANOVA, and calculation of kurtosis and skewness; frequency distribution histograms were also plotted. For traits with normal or approximately normal distributions, grading was performed according to UPOV guidelines [36] using the LSD method [12]. The grading framework was centered on the mean value, with intervals symmetrically extended by at least twice the LSD0.05. Results were validated using H′ and ANOVA.
For data that did not follow a normal distribution, a range method was applied for grading. The number of classes was determined by calculating Class 1 = Range/(SD × 2). This value was then rounded down to the nearest smaller odd integer (1, 3, 5, 7, or 9) to obtain Class 2 [37]. The class interval (x) was defined while Range/Class 2. Grading was performed using the median (G) as the midpoint, with class boundaries derived from the formula: y = G ± (1/2 + n) x, where “y” is the numerical boundary of each class and n = 0, 1, 2, 3, 4 [13]. The resulting grading was validated using H′ and the K-M test, with the K-M test performed using Origin.
Based on the statistical results, the total range coverage was assessed to determine whether it falls between three and nine grades. If it spans fewer than three grades, the characteristic is considered unsuitable for DUS testing and should be excluded. If it exceeds nine grades, the scale interval should be increased to adjust the grading, thereby maintaining the range within nine grades [36,38]. For characteristics with a grading range between three and nine grades, one to two grades may be reserved at each end to accommodate future new varieties, enabling a more reasonable grade. If the minimum value of the smallest grading interval is less than zero, it should be set to zero; subsequently, grading should be performed in ascending order based on the predetermined multiples of the grade interval.

3. Results

3.1. Example Varieties Survey in DUS Testing Guideline

A comparative analysis was conducted between the performance of example varieties at the observation site and their descriptions in the Guidelines, with results shown in Table 2 and Supplementary Table S2. Analysis of 35 example varieties from the Hawthorn DUS Guidelines showed an average COC of 0.998. Of these, 27 varieties (77.14%) achieved a COC of 1.000, with tested codes fully matching guideline descriptions, indicating excellent regional adaptability and suitability as DUS testing standards. 8 accessions scored below 1.000, with 3 (8.57%) falling below 0.990: C. pinnatifida var. major ‘Liaohong’, C. pinnatifida ‘Kaiyuanruanzi’, and C. pinnatifida var. major ‘Xiaohuangmianzha’. Among these, ‘Xiaohuangmianzha’ showed the lowest COC (0.980). Nevertheless, no accession fell below 0.950, indicating generally stable performance across the accessions.

3.2. Test Traits Survey in DUS Testing Guideline

As shown in Table 3, 43 of the 44 tested traits exhibited a COC greater than 0.990, representing 97.73% of the total. Among these, 37 traits reached a perfect COC of 1.000. QL demonstrated the highest COC, with an average COC of 1.000, reflecting complete agreement between observed and guideline codes. The 15 PQ averaged 0.998, including 11 traits that also achieved 1.000. Notably, fruit shape, fruit colour, flesh colour, and sepal shape scored below this category’s average. QN showed an average COC of 0.998, with fruit spot density—a QN—recording the lowest individual COC (0.980) (Supplementary Information Table S2 for detailed data).
Based on Table 2 and Table 3, along with three-year observational data and the principles of strong inter-annual stability, multi-trait applicability, and high COC, the 8 traits with COC at or below the average should be considered for optimization.
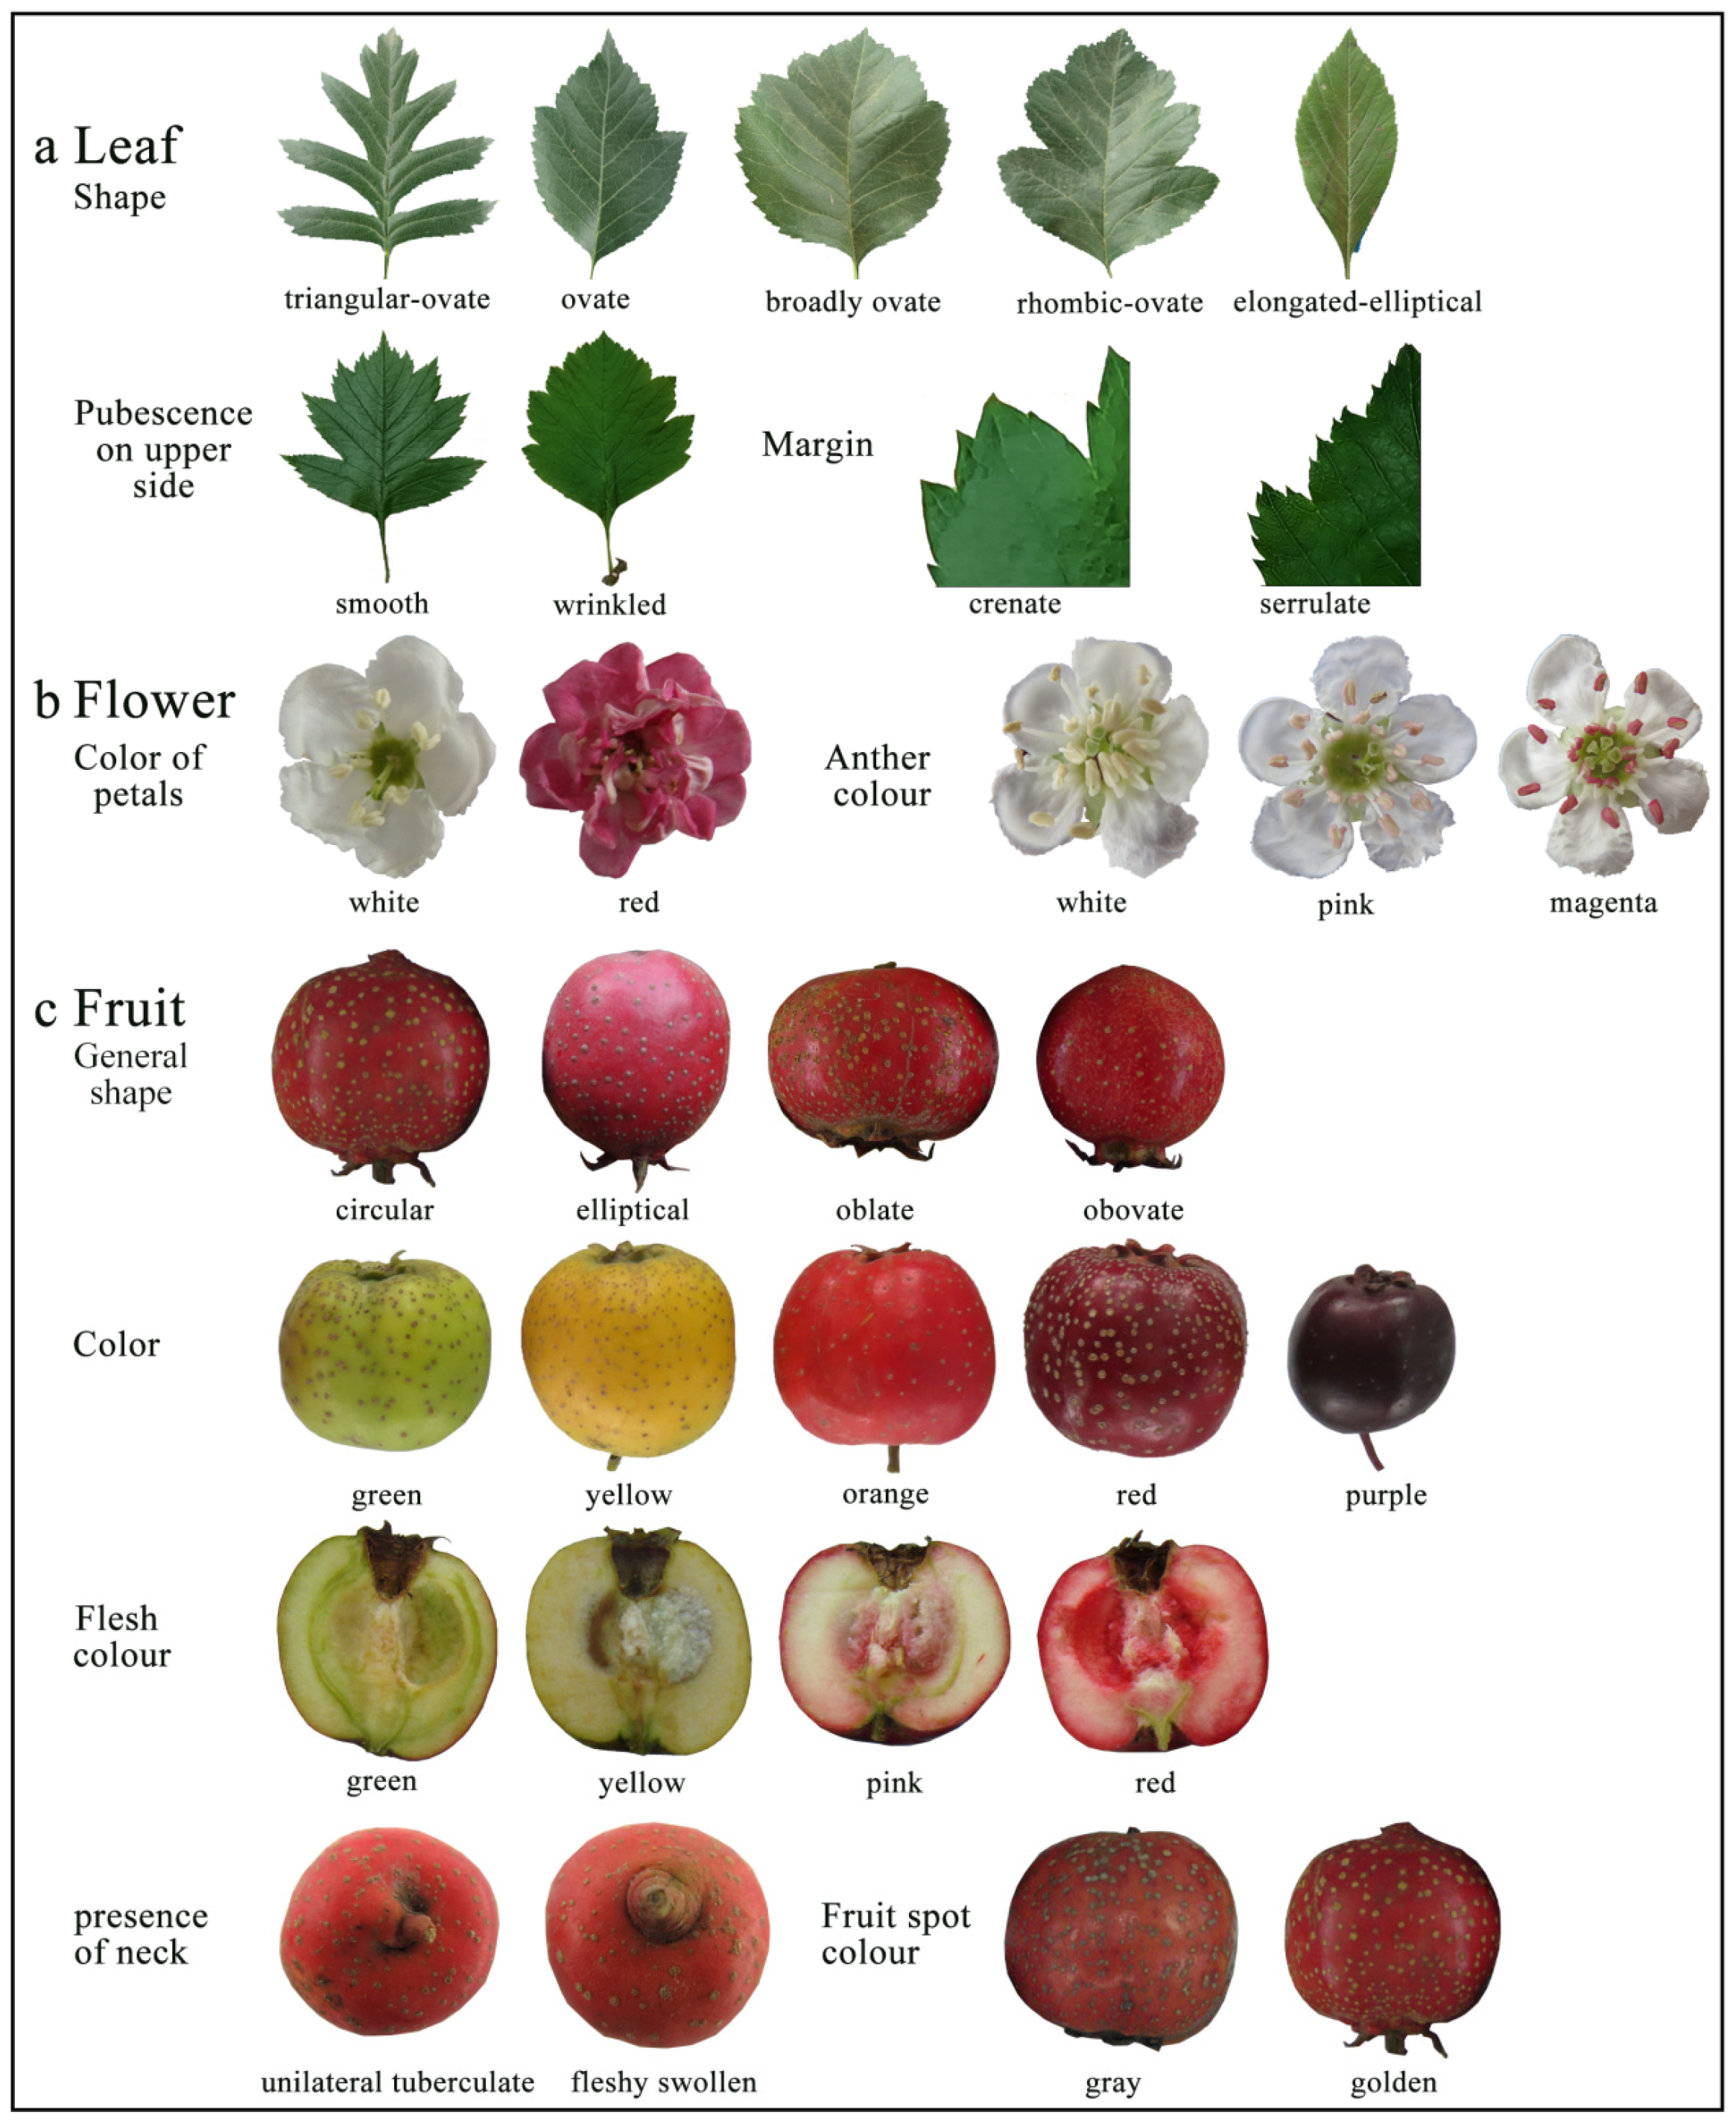
For PQ and QL, which exhibit low COC values, supplementary illustrated guidelines should be developed to refine current schematic representations, as certain existing expressions lack sufficient clarity. Meanwhile, for QN, the application of trait grading is recommended to provide a more standardized basis for DUS testing (Figure 1).

3.3. Diversity of Qualitative Traits

3.3.1. Plant and Shoot

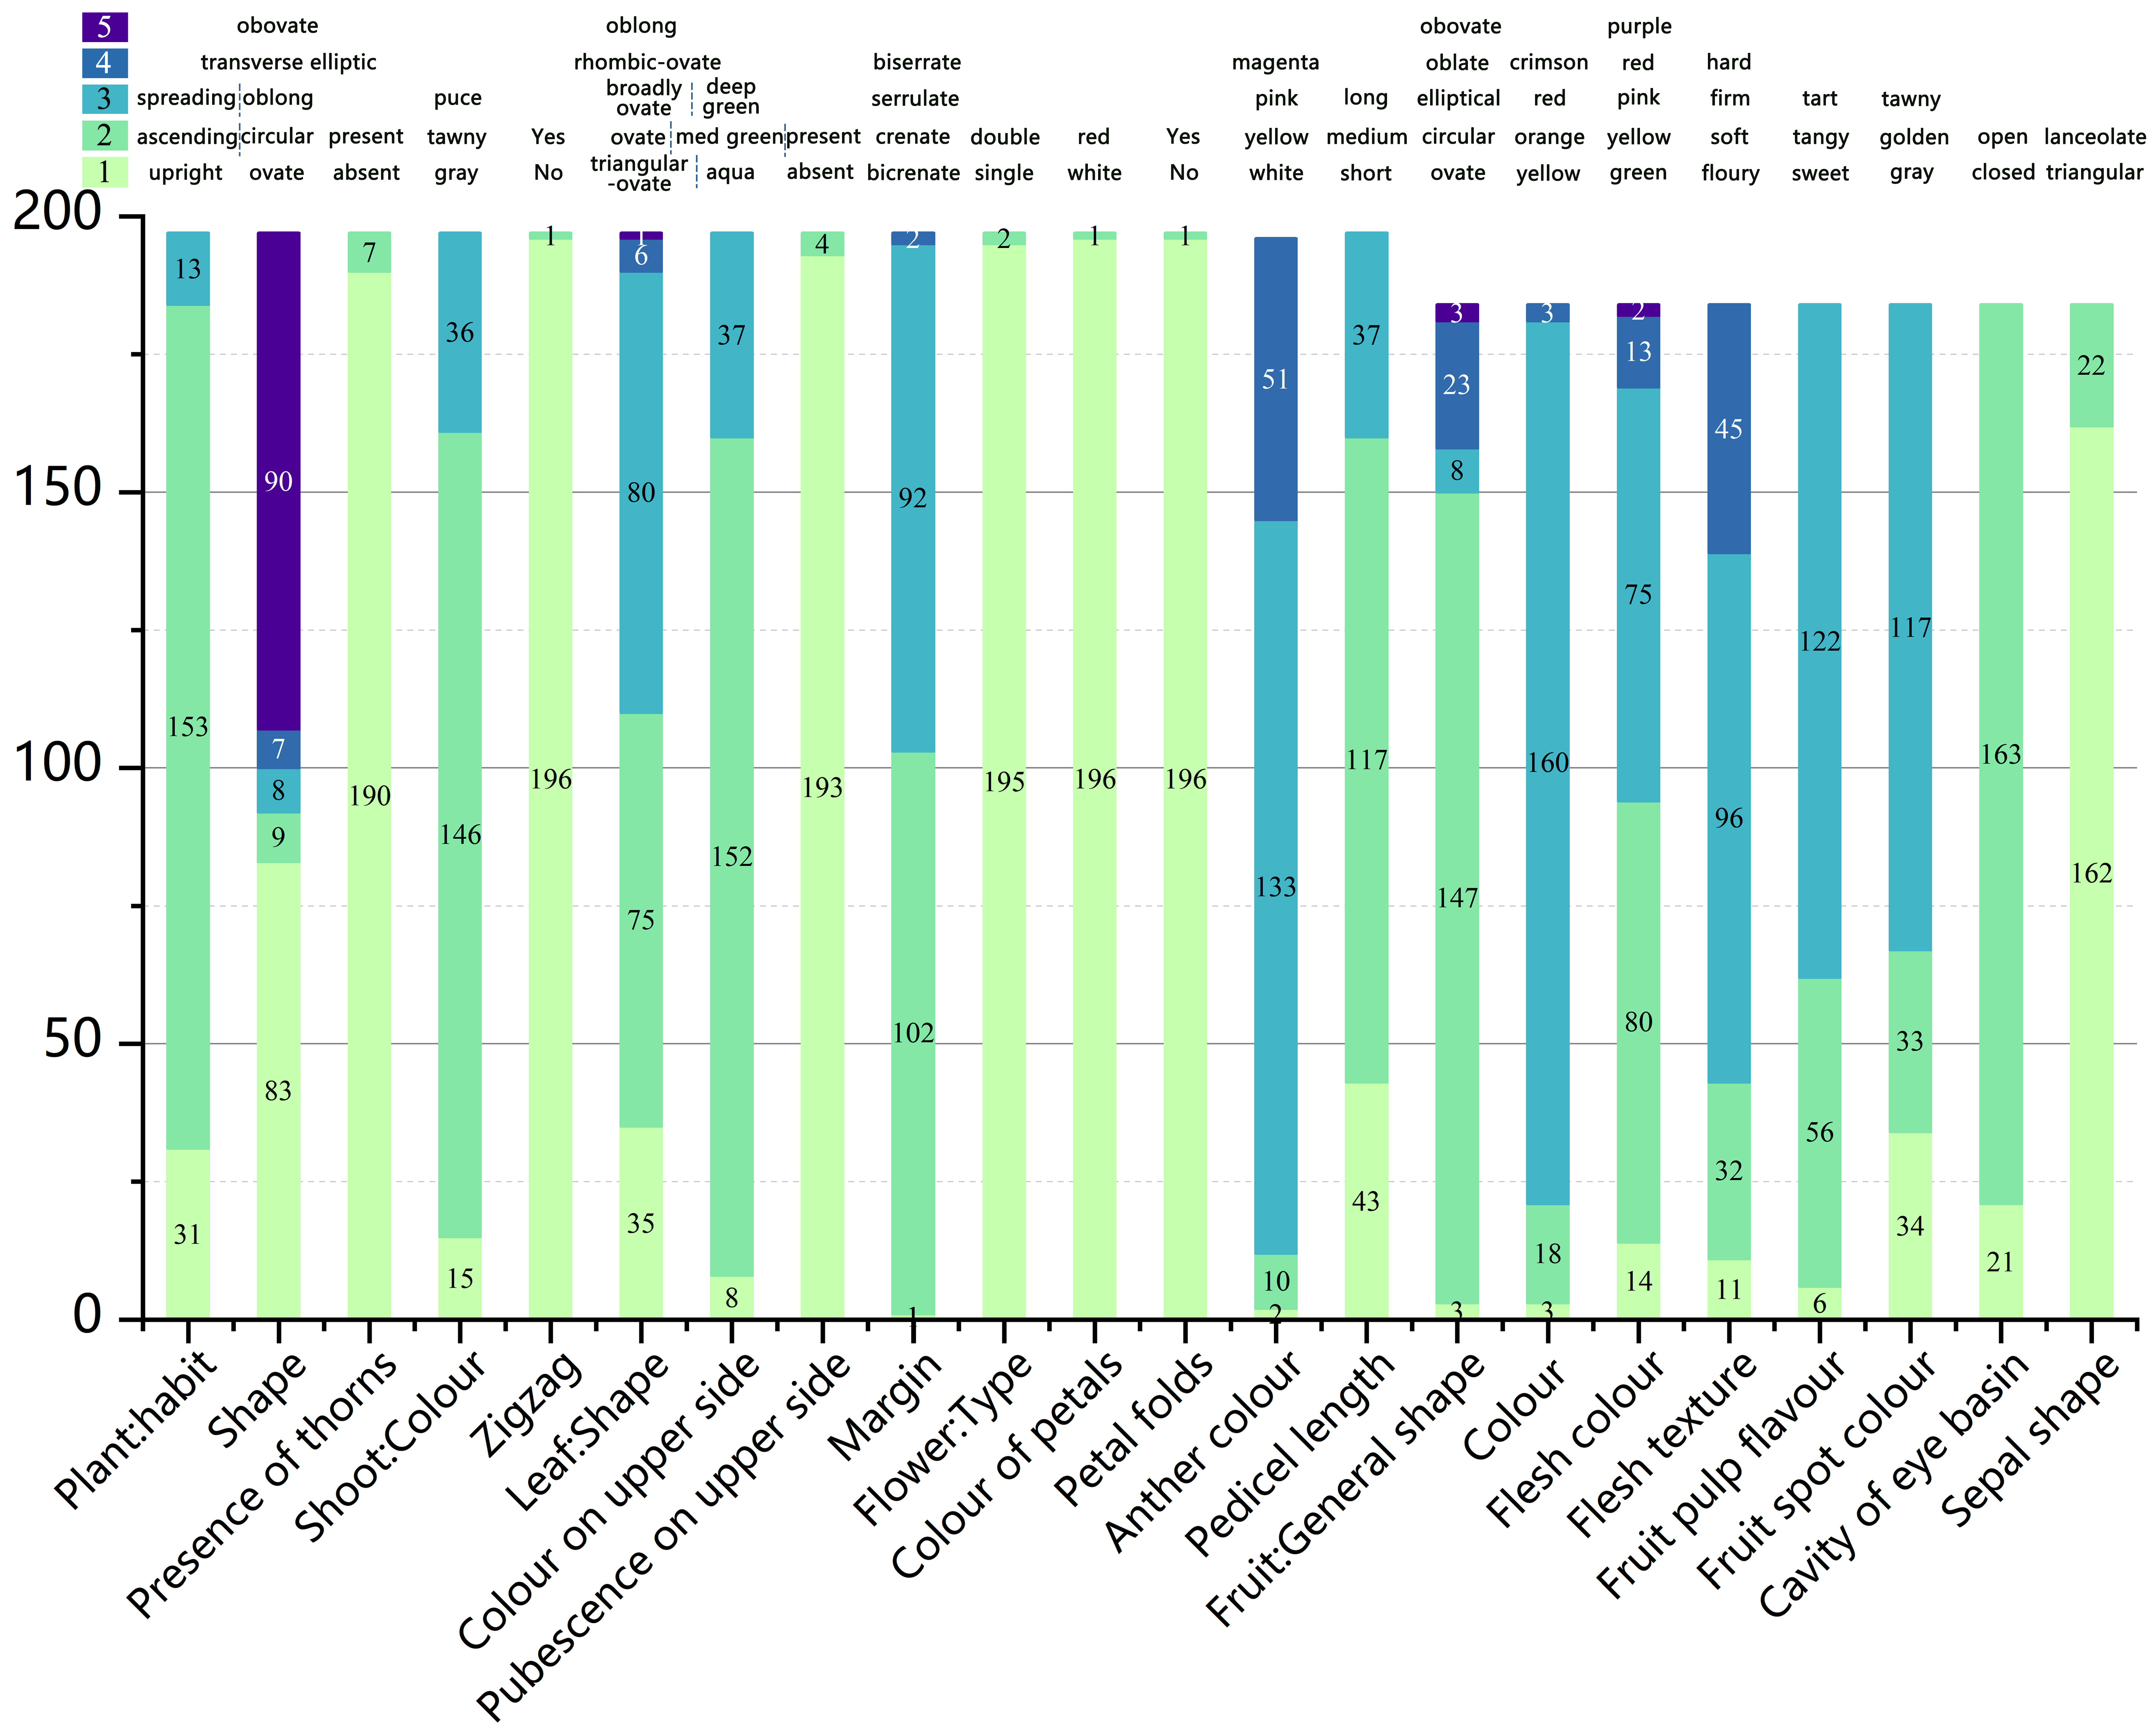
In the analysis of phenotypic diversity in hawthorn plant and shoot traits, plant shape emerged as the most prominent source of variation. (Table 4 and Figure 2). Crown shape exhibited considerable diversity, with ovate and obovate forms being predominant, while circular, oblong, and transverse elliptic forms were less frequent. The relatively high Shannon–Wiener diversity index (H′ = 1.112) and Pielou’s evenness (0.691) further indicated substantial phenotypic differentiation. Hawthorn resources were classified into thorny and thornless types, with thornless plants clearly predominating and thorn-bearing plants occurring only occasionally. This distribution may be associated with differences between cultivated and wild resources, as cultivated varieties generally tend to have fewer thorns than wild species. In contrast, annual shoots were highly uniform, being predominantly non-zigzag, whereas zigzag shoots were rare. Accordingly, this trait showed low diversity (H′ = 0.032) and evenness, with zigzag shoots observed only in C. pinnatifida ‘Zhangwushanlihong’.

3.3.2. Leaf Phenotypes

In the phenotypic diversity analysis of hawthorn leaf traits, leaf shape exhibited relatively high diversity, whereas upper leaf surface smoothness showed the lowest level of diversity (Figure 1 and Figure 2, Table 4). The morphology of hawthorn leaves was highly diverse and could be classified into five types. Ovate and broadly oval leaves predominated, followed by triangular-ovate leaves, whereas rhombic-ovate and oblong forms were relatively rare. The relatively high Shannon–Wiener diversity index (H′ = 1.174) and Pielou’s evenness (J = 0.729) further indicated substantial diversity in leaf shape. In contrast, the upper leaf surface was largely smooth, with wrinkled surfaces occurring only sporadically, resulting in low diversity and evenness (H′ = 0.079; J = 0.114). Among the surveyed resources, villous or pubescent surfaces on the leaves and pedicels were observed only in C. maximowiczii, C. maximowiczii var. ninganensis, and C. chlorosarca. Leaf margins were predominantly crenate or serrulate, while bicrenate and biserrate margins were uncommon, resulting in moderate diversity and evenness (H′ = 0.770; J = 0.555). Interestingly, bicrenate margins were found only in the foreign resource C. laevigata ‘Paul’s Scarlet’, whereas biserrate margins were restricted to C. hupehensis (‘Hubei-1’ and ‘Hubei-2’).

3.3.3. Flower Phenotypes

The overall phenotypic diversity of flower traits was relatively low, with petal type, petal colour, and petal folds each comprising only two categories. Notably, double-petaled, non-white, and petal-folded were observed exclusively in foreign germplasm (Figure 1 and Figure 2, Table 4). Anther colour exhibited four categories, with pink predominating and white being relatively rare, resulting in moderate phenotypic diversity (H′ = 0.789). Pedicel length comprised three categories, among which the medium type was predominant. Notably, this trait exhibited relatively high diversity (H′ = 0.956) and the highest Pielou’s evenness (J = 0.870).

3.3.4. Fruit Phenotypes

The fruit phenotype demonstrates considerable diversity (Figure 1 and Figure 2, Table 4). Fruit-related traits generally exhibited considerable phenotypic diversity, with flesh colour and flesh texture showing the highest diversity (H′ = 1.160 and 1.156, respectively). Fruit shape was predominantly circular, whereas ovate and obovate forms were relatively rare. Flesh colour was mainly yellow or pink, while purple was uncommon. Fruit skin colour was dominated by red, and firm flesh was the most common texture. Flesh flavor and fruit spot colour showed moderate diversity, with tart flavor and yellowish-brown spots predominating. In contrast, the cavity of the eye basin and sepal shape exhibited relatively low diversity, with open eye basins and triangular sepals being the predominant types.

3.4. Diversity and Rating of Quantitative Traits

3.4.1. Variation Analysis of Quantitative Traits

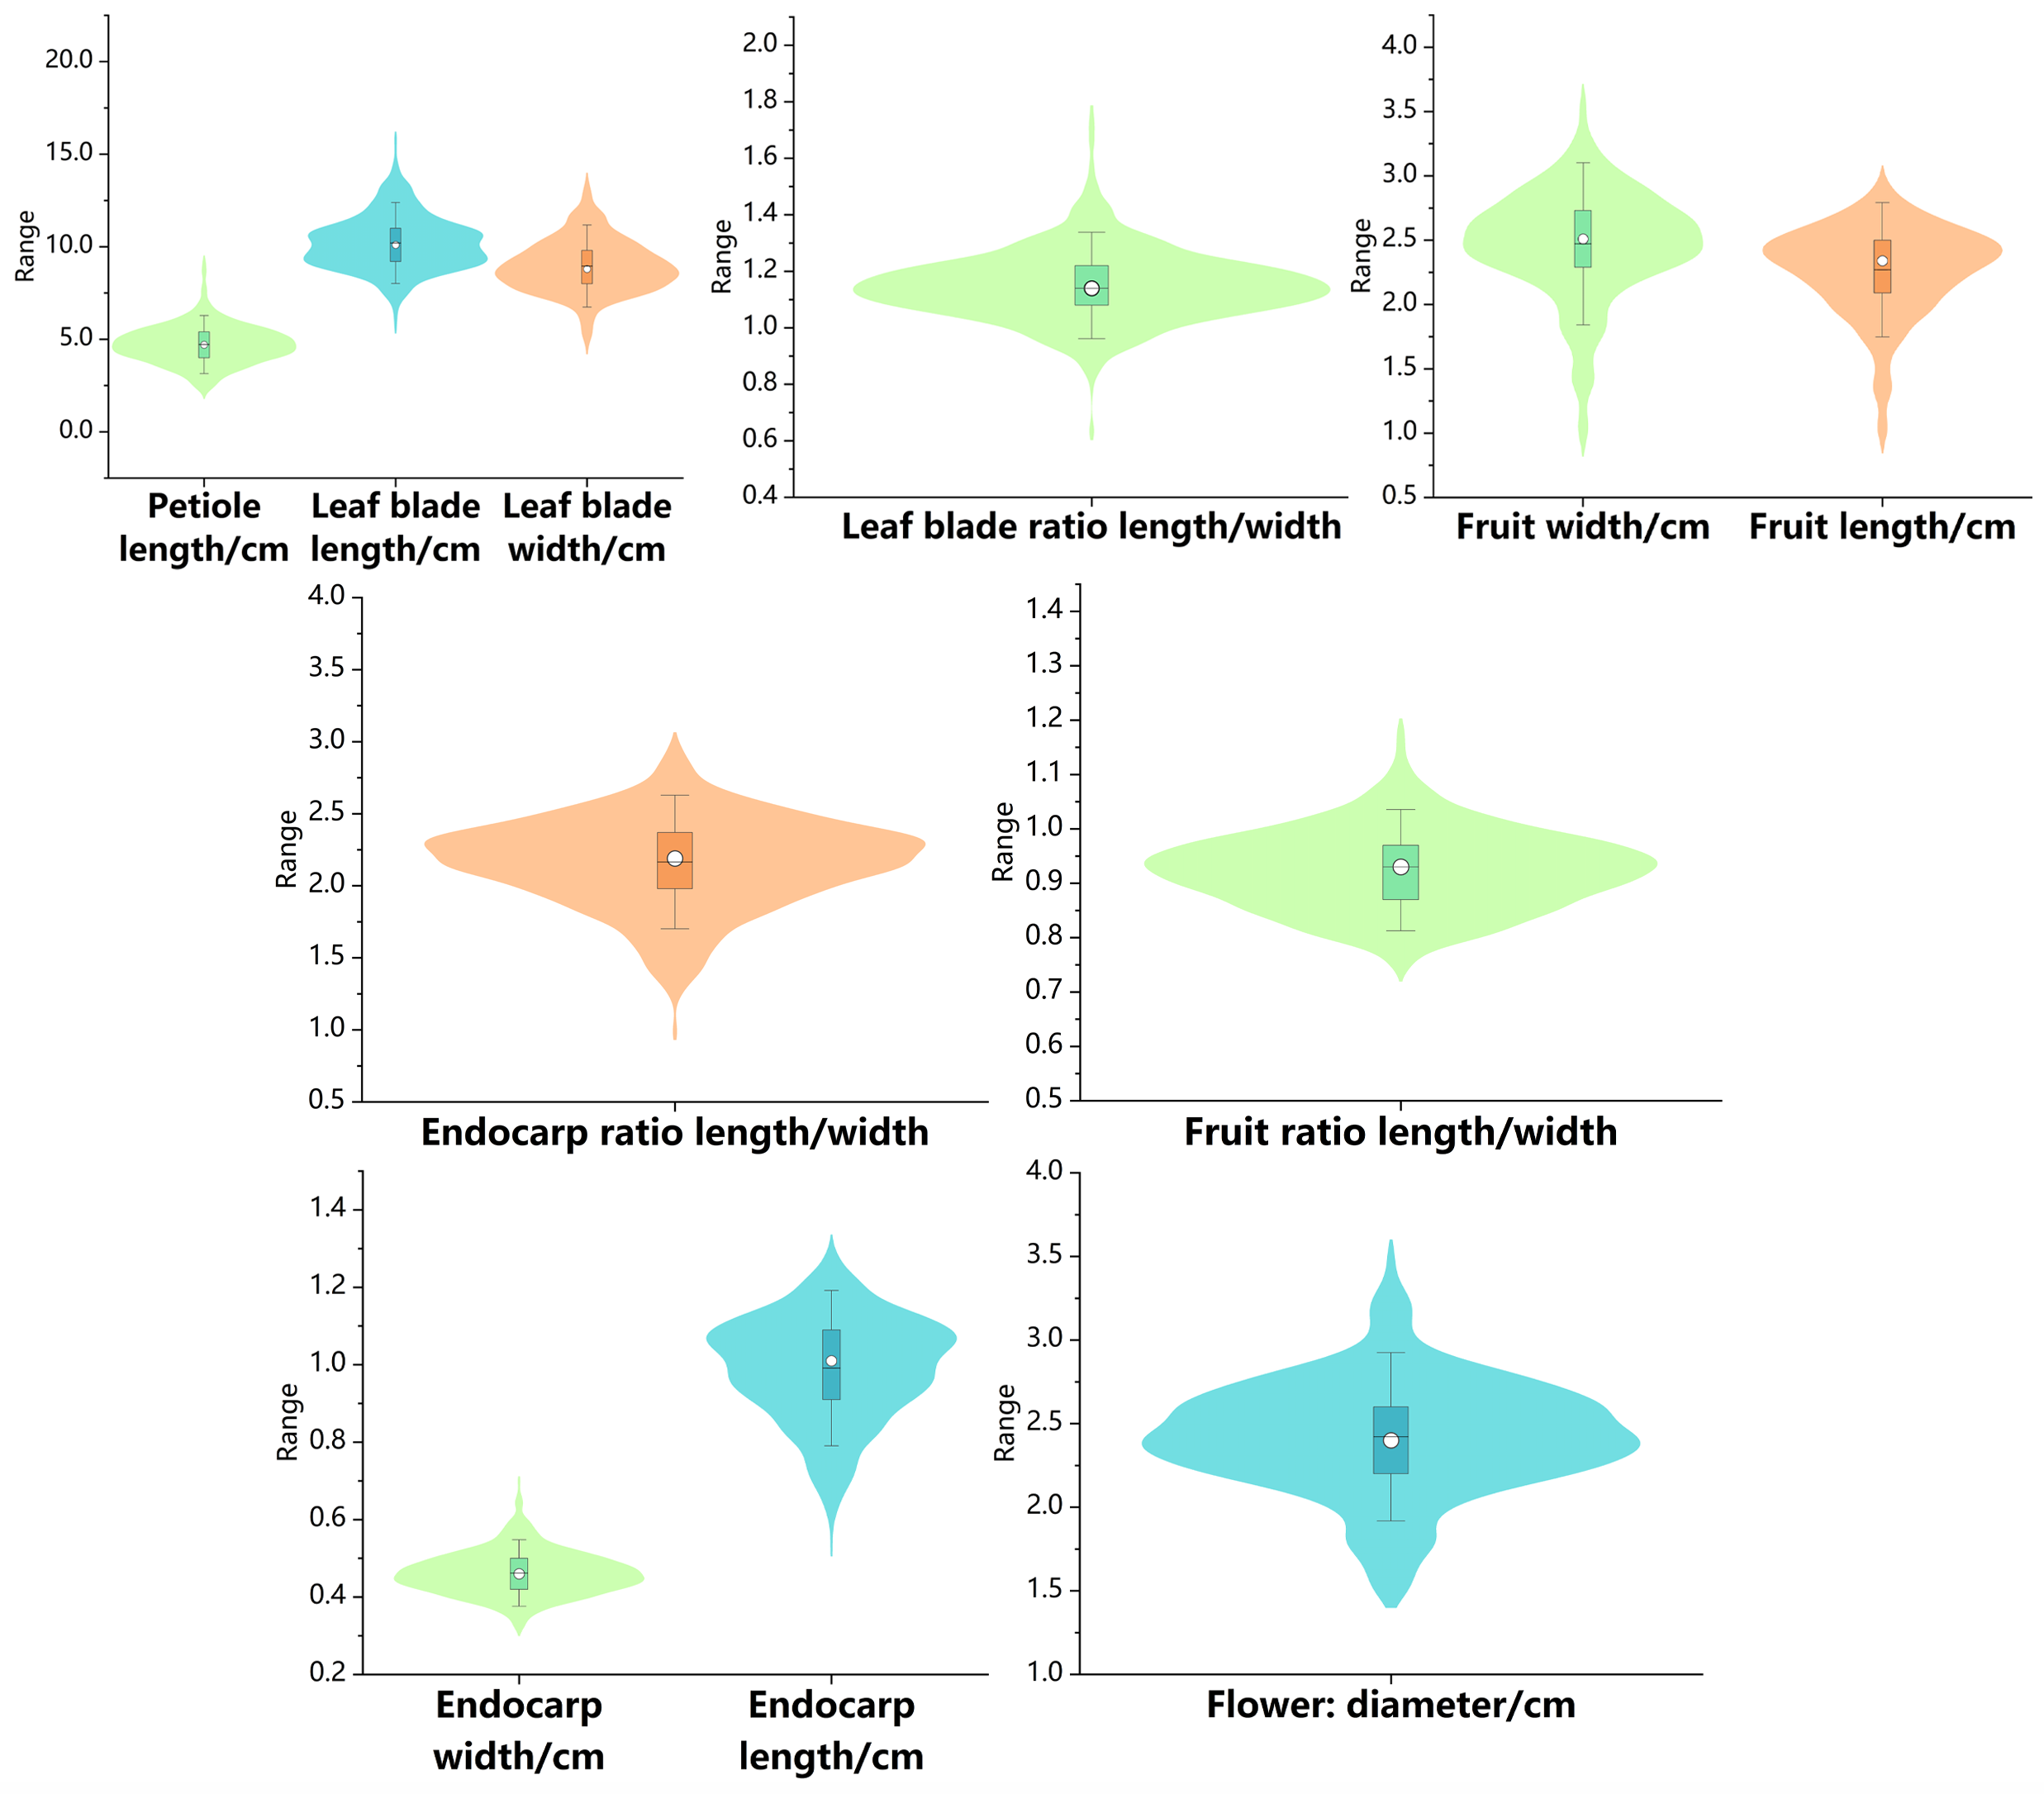
As shown in Table 5 and Figure 3, the median values of the 11 QN are close to their respective means, suggesting a relatively regular distribution and high-accuracy, representative data collection. The coefficients of variation for 11 QN within varieties ranged from 4.77% to 14.58%. Among these traits, petiole length exhibited the highest variability (14.58%), followed by leaf width (9.49%) and endocarp width (9.30%). Notably, petiole length was the only trait with an intra-varietal coefficient of variation exceeding 10%, which collectively indicate that plants within the same variety maintain strong phenotypic consistency and relative stability for the majority of these quantitative traits. The coefficients of variation among varieties ranged from 8.04% to 22.03%, with petiole length exceeding 20%, indicating pronounced inter-varietal divergence. Moreover, the coefficients of variation among varieties consistently surpassed those observed within varieties across all 11 quantitative traits, demonstrating substantial inter-varietal diversity in hawthorn and supporting effective differentiation between accessions.

3.4.2. Pearson Correlation Analysis and Principal Component Analysis (PCA)

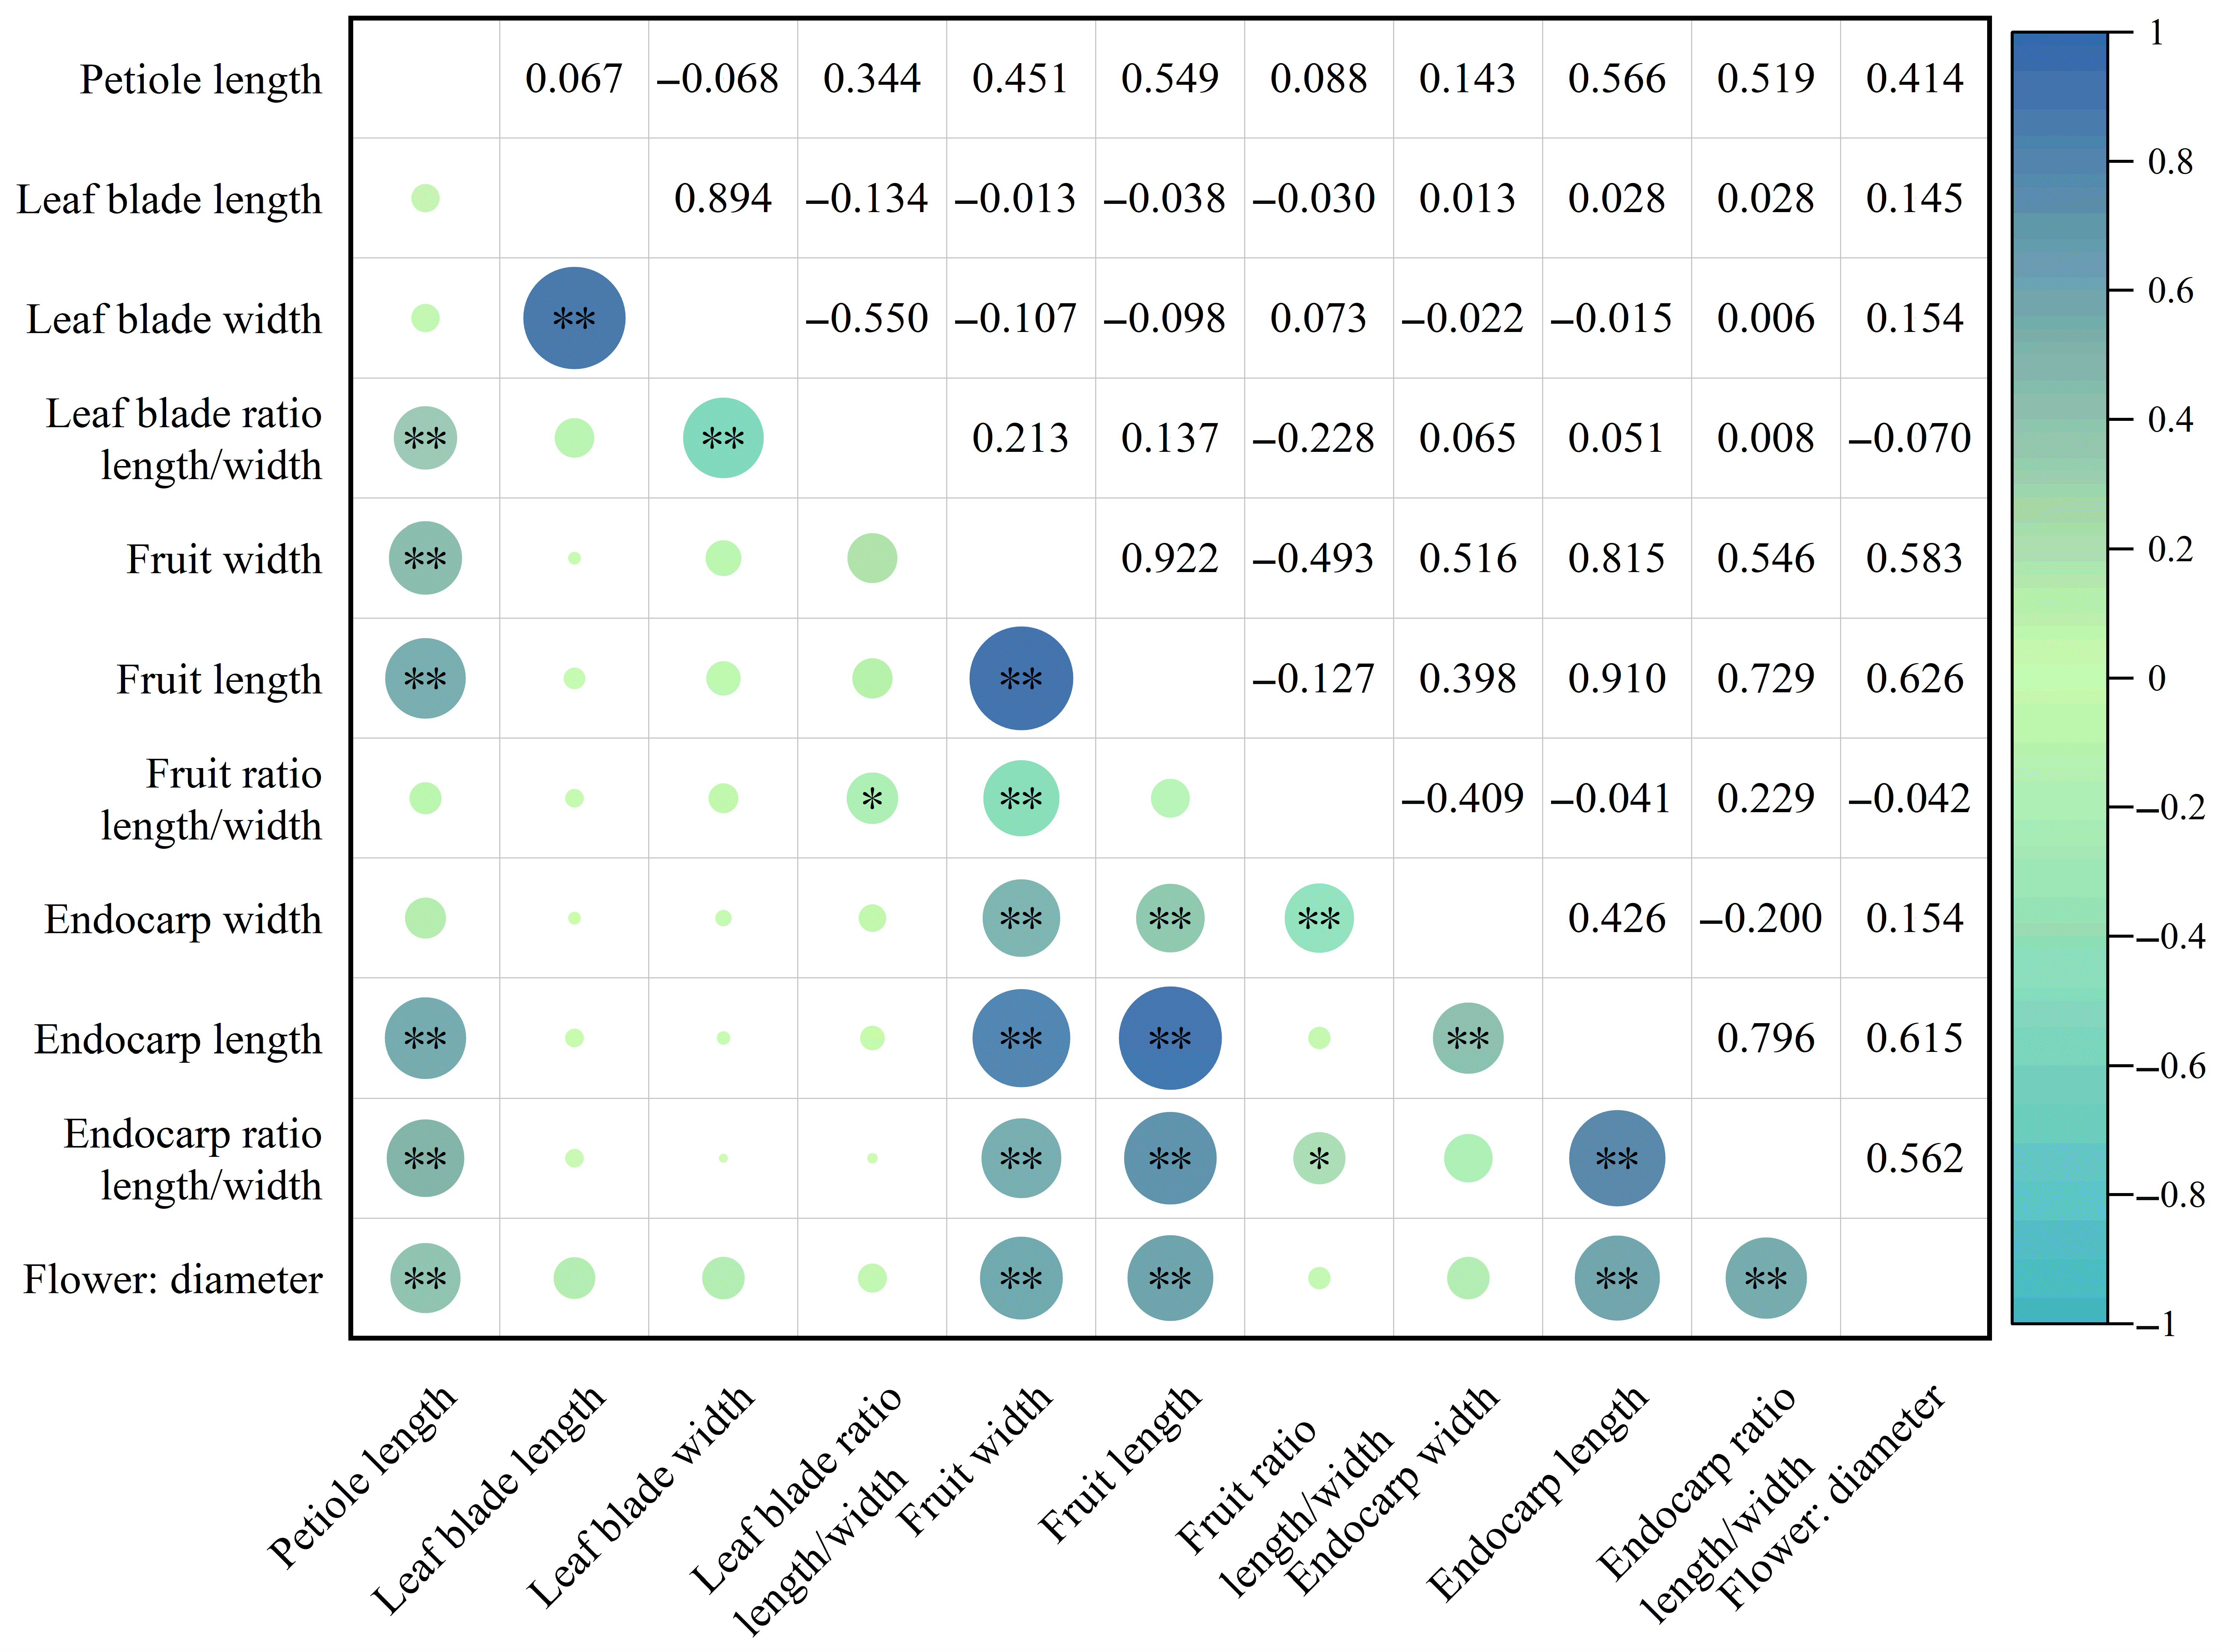
The correlation heatmap in Figure 4 displays the relationships among the 11 QN, revealing associations of varying strength with absolute correlation coefficients ranging from 0.006 to 0.922. The correlation analysis revealed multiple significant relationships among the QN. Petiole length showed highly significant positive correlations with leaf blade aspect ratio, fruit width, fruit length, endocarp length, endocarp aspect ratio, and flower diameter (r = 0.344–0.566), indicating that selection for longer petioles is indirectly associated with the selection of larger fruit size. Leaf blade length was strongly positively correlated with leaf blade width (r = 0.894). Fruit width showed strong positive correlations with fruit length, endocarp width, endocarp length, endocarp aspect ratio, and flower diameter (r = 0.516–0.922). Furthermore, the significant correlations of fruit width and length with corresponding endocarp width and length indicate that larger fruits are generally associated with larger endocarp. Fruit aspect ratio was negatively correlated with endocarp width (r = −0.409) and positively correlated with endocarp aspect ratio (r = 0.229). The highly significant correlations among flower diameter, petiole length, fruit width and length, and endocarp width and length further suggest that flower size is positively associated with fruit size, implying that larger flowers tend to produce larger fruits.
Employing the Kaiser criterion, which retains factors with eigenvalues greater than 1, we condensed the dimensionality derived from the 11 QN into four significant principal components. Collectively, these components accounted for 85.18% of the total variance, as summarized in Table 6.
The first principal component (PC1), explaining 40.22% of total variance, was strongly correlated with fruit width, fruit length, endocarp aspect ratio, and flower diameter. The PC2 explained 20.10% of variance and was defined primarily by leaf length and width. PC3 contributed 15.55% of variation, representing fruit aspect ratio, endocarp width, and endocarp length, while PC4 accounted for 9.31% and was associated with petiole length and leaf aspect ratio (Table 6). In the two-dimensional loadings plot (Figure S1), leaf dimensions clustered together, fruit width, fruit length, and endocarp length formed a second group, and flower diameter with endocarp aspect ratio constituted a third distinct cluster, visually confirming these associations.

3.4.3. Normality Test

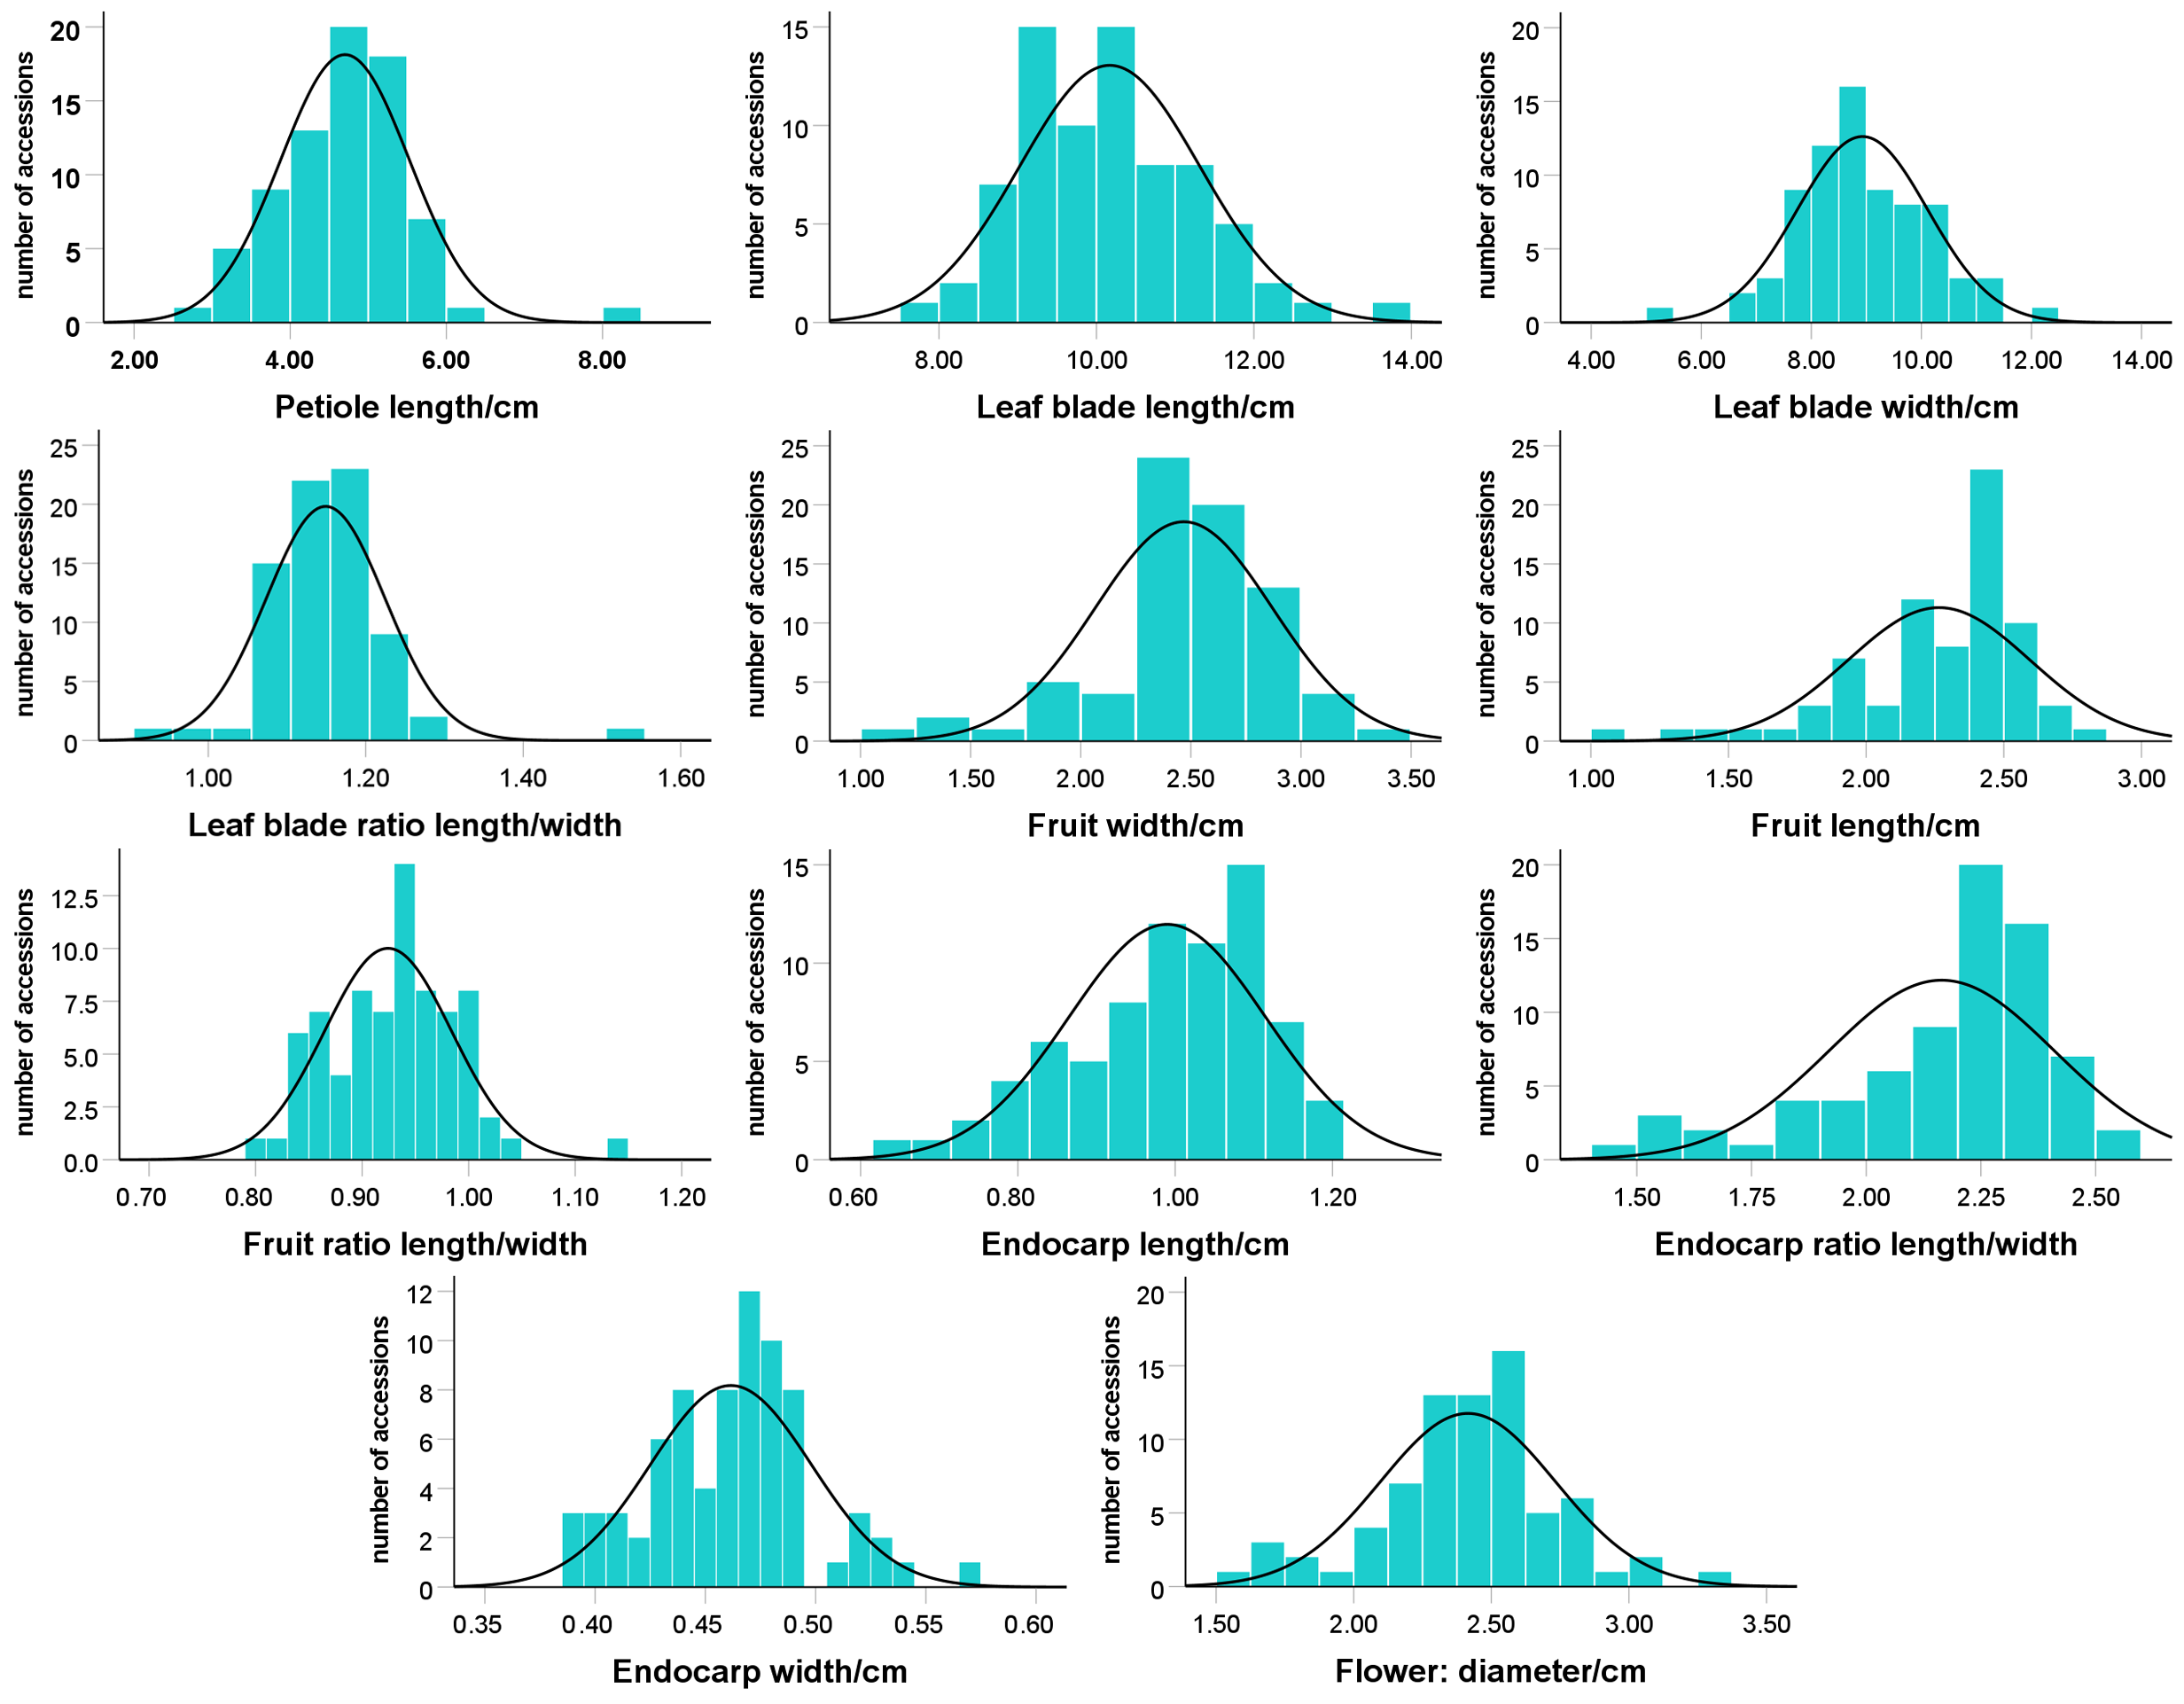
The grading of QN is fundamentally linked to their adherence to a normal distribution. To evaluate this, a K-S normality test was performed on all 11 QN, complemented by the construction of frequency distribution histograms presented in Figure 5. The results revealed three distinct distribution patterns: First, 6 traits—including petiole length, leaf blade length, leaf blade width, leaf blade aspect ratio, fruit aspect ratio, and flower diameter—showed p-values greater than 0.05, indicating conformity to a normal distribution. Second, two traits, namely endocarp width and endocarp aspect ratio, exhibited p-values below 0.05; however, their absolute values of kurtosis and skewness absolute values were both less than 1, suggesting an approximately normal distribution. Finally, the remaining three traits—fruit width, fruit length, and endocarp length—had p-values below 0.05, with kurtosis and skewness absolute values exceeding 1, confirming their non-normal distribution (Table 7).

3.4.4. Rating Ranges Determination

The grading of QN was conducted based on the phenotypic states described in the Guidelines, with appropriate adjustments informed by actual measurement data. For traits that followed a normal or approximately normal distribution, the LSD method was applied. In contrast, the Range method was used for those traits that deviated from a normal distribution. The resulting grading outcomes are summarized in Table 8 and Table 9.
According to the UPOV grading method, 8 normally distributed traits were graded into either 5 or 7 levels: petiole length and endocarp width were graded into 5 levels, whereas the remaining traits were graded into 7. In contrast, the 3 traits not conforming to normal distribution—fruit length, fruit width, and endocarp length—were all graded into 5 levels. Based on these grading criteria, genetic diversity analysis of the 11 QN yielded diversity indices ranging from 1.018 to 1.530, with a mean of 1.294; notably, the fruit length-to-width ratio exhibited the highest index, indicating the greatest genetic diversity.

3.4.5. Rating Range Validation

The two grading results were validated using genetic diversity indices (Table 10). All traits exhibited highly significant differences between groups (p < 0.001). Furthermore, for traits analyzed using LSD grading, this extreme significance was consistently maintained (p < 0.001). The fact that F-values were significantly greater than 1 (p < 0.001) confirms that inter-group variation outweighed random error, thus validating the proposed grading scheme. Among the evaluated traits, flower diameter (F = 195.473) and fruit aspect ratio (F = 185.137) yielded the highest F-values, demonstrating their superior discriminatory power.
The validation of the range-based grading method showed that, for traits with highly significant results (p < 0.001), a greater H-value reflects stronger differentiation among the defined grades, thereby confirming the robustness of the grading scheme. Notably, the endocarp length yielded the highest H-value (H = 62.622), confirming that this trait possesses the relatively strong discriminatory power for grading.

4. Discussion

4.1. Scientifically and Effectively Established Example Varieties and Test Traits

The COC, commonly termed the concurrent coefficient, quantifies the degree of mutual influence between two linked events and is consequently widely utilized in breeding programme for conducting differential analysis of breeding materials [39,40]. A higher COC, which ranges from 0 to 1, indicates a smaller degree of difference [41].
The low COC value observed in C. pinnatifida var. major ‘Xiaohuangmianzha’ suggests inconsistency in flesh color evaluation, likely due to subjective visual assessment. To improve accuracy, we recommend using a colourimeter together with a standard colour chart. This approach provides objective Lab measurements for quantitative calibration, thereby supporting more reliable determination of the closest color grade. Additionally, color changes occur due to the oxidation of the flesh [42]. As hawthorn fruits are rich in polyphenols [43,44], their exposure to air triggers enzymatic browning, leading to further color alterations.
Among the 44 test traits, 84.09% achieved a COC of 1.000. Overall, QL exhibits the highest COC, followed by PQ, whereas QN shows the lowest. This indicates that QN are more susceptible to human misinterpretation, uneven sampling and environmental changes [38] requiring further screening and optimization of example varieties for these traits.
While China’s current hawthorn DUS guidelines demonstrate substantial stability, the differential analysis conducted in this study identifies specific shortcomings that necessitate the optimization of example varieties for qualitative traits testing. Furthermore, progress in hawthorn breeding has yielded new cultivars that expand the selection of example varieties; for example, the yellow fruit of C. pinnatifida var. major ‘Jinruyi’ provides an ideal reference for the yellow phenotype [45]. To refine existing guidelines, future work should explore mechanisms for dynamic updates, such as employing multiple exemplars per trait. Regarding testing methodologies, guidelines could be optimized by providing diagrams for QL and PQ traits, converting color-described traits into Lab quantitative assessments, and implementing grading for all QN. Collectively, these strategies would enhance the precision of DUS guidelines by optimizing both example varieties and trait evaluation.

4.2. Substantial Phenotypic Variation in Chinese Hawthorn Germplasm

Phenotypic diversity, which manifests as the external morphology of plants under gene-environment interactions, directly reflects the extent of genetic diversity within a species [46]. As a fundamental and practical approach to assessing variation, it plays an essential role in breeding improved varieties and enhancing agronomic performance, thereby providing a critical basis for the conservation, research, and selection of new accessions [47,48].
Adhering to DUS testing principles for Crataegus L., this study conducted a systematic investigation of phenotypic traits across whole plants, branches, leaves, flowers, fruits, and endocarps. Analysis of 33 traits among 197 germplasm accessions revealed rich phenotypic variation, with diversity indices of QN surpassing those of QL. Among the 22 QL and PQ examined, plant shape, leaf shape, flesh colour, and flesh texture displayed considerable variation, whereas the remaining traits stayed relatively stable. Pielou’s evenness (J) quantifies the evenness of trait distribution across varieties [49]. A J value approaching 1 indicates a more even distribution across categories and a stronger capacity to discriminate among varieties. Conversely, a J value closer to 0 reflects a more concentrated distribution within a particular category and a weaker discriminatory ability [50]. To optimize QL and PQ, those with a Pielou’s evenness value below 0.05 may be considered for exclusion. Nevertheless, zigzag shoot, petal colour, and petal fold meet this threshold, they were retained in this study due to their significant potential for future breeding programs. The coefficient of variation provides a key statistical measure for evaluating dispersion in QN and serves as an important indicator of population stability [51,52]. Among the evaluated traits, petiole length demonstrated the highest coefficient of variation across cultivars, aligning with observations reported by Ma [29], which highlights its substantial inter-cultivar variability. Nevertheless, this trait concurrently exhibited the highest intra-varietal variation among all QN, implying significant sensitivity to environmental conditions. Petiole length holds significant importance in DUS testing, serving as a key grouping characteristic within UPOV standards, although it is not designated as such in domestic criteria. Under current national guidelines, both flower type and petal color are classified as grouping characteristics. Consideration may be given to removing flower type and adding petiole length as a grouping characteristic.
Correlation analysis revealed a high correlation between fruit width and length, which aligns with previous studies on hawthorn QTL mapping [53] and the findings of Yin et al. [54], confirming the consistency of these relationships. Concurrently, correlation analysis revealed a highly significant relationship between petiole length and fruit size, further substantiating the pivotal role of petiole length within the guidelines. Accordingly, designating it as a grouping characteristic is recommended to optimize the DUS test guidelines.

4.3. Accurate and Effective Grading of Quantitative Traits

Phenotypic traits are easily influenced by environmental conditions [55], which directly affect their morphological expression, while QN exhibit greater numerical variability under such environmental influences. Current DUS testing guidelines utilize example varieties to minimize environmental effects on QN; therefore, establishing scientifically rigorous grading criteria is essential for enhancing the precision and applicability of DUS testing protocols. Under natural conditions, most QN in plants—be it continuous or discrete—generally follow a normal distribution [56]. Various grading methods are available, including probability grading [11,57], standard deviation grading [58], LSD grading, and the range method [12,13,59]. LSD method is appropriate for grading such normally distributed traits and aligns with the UPOV guideline requiring that the LSD value at the 0.05 significance level be no less than twice the grade interval. Consequently, this study applied the LSD method to establish QN grades in hawthorn. In total, 8 of the 11 QN followed or approximated a normal distribution and were graded into 5–7 classes using the LSD method, while the three non-normally distributed traits were classified into 5 classes using the range method. The K–S test indicated skewness in three traits, which may be attributable to sampling limitations. Specifically, 10–15 samples per trait were collected for each germplasm, which may be insufficient. In addition, the sampling included C. pinnatifida var. major, C. pinnatifida, and C. brettschneideri, with collections conducted over a three-year period; thus, environmental variation among years may have further contributed to the observed skewed distributions.
Example varieties are established to account for environmental influences, and their importance is undisputed. The QN grading framework developed in this study facilitates more direct and efficient assessments through numerical values, providing essential evaluation support for regions lacking example varieties. Ultimately, the establishment of this framework is instrumental in optimizing the DUS testing guidelines.

4.4. DUS Testing Guidelines Comparison

The current Chinese “Guidelines for the conduct of tests for distinctness, uniformity and stability (DUS)—Hawthorn (Crataegus L.)” (LY/T 3208-2020) issued in 2020 was formulated under the UPOV framework with reference to the UPOV DUS test guidelines for Hawthorn (TG/239/1) released in 2008 [60]. While both guidelines for new hawthorn varieties share comparable requirements for test materials, methods, and characteristic assessment, they differ in characteristic testing, technical questionnaires, and notable distinctions in example variety selection. It can be attributed to the distinctive phenotypic features of Chinese hawthorn germplasm resources relative to their foreign counterparts.
Specifically, China’s guidelines include 55 testing traits—five more than UPOV’s—with 11 traits removed, 16 added, and 9 having modified grading criteria. Regarding example varieties, Chinese version employs 44 example varieties, 4 of which (C. monogyana ‘Compacta’, C. monogyana ‘Pendula’, Crataegus × mordenensis ‘Toba’, C. laevigata ‘Paul’s Scarlet’) overlaps with UPOV’s recommended standards (Supplementary Information Tables S2 and S3). Among these, ‘Paul’s Scarlet’ was introduced to China in 2003 as a prominent double-flowered hawthorn germplasm; its red blooms enrich the diversity of early-summer flowering trees and enhance regional landscape aesthetics [61]. Grouping characteristics serve as fundamental criteria for screening similar varieties. In this regard, both the UPOV and Chinese standards stipulate 6 grouping traits. Among these, 4 traits are identical: growth type, plant habit, leaf blade lobes, and fruit color. However, the remaining two characteristics differ between the systems; specifically, UPOV designates the presence of shoot thorns and petiole length as grouping traits, whereas the Chinese guidelines utilize flower type and petal colour for this purpose (Supplementary Information Table S4). Our analysis identified petiole length as a highly variable phenotypic trait. Consequently, we recommend its inclusion as a grouping characteristic in China’s DUS guidelines.
The UPOV Guidelines (TG/239/1) have remained in effect for over a decade since their publication in 2008. However, the emergence of new cultivars and advancements in modern testing techniques now necessitate a comprehensive update. In particular, Chinese hawthorn—especially the large-fruited varieties that constitute a significant genetic resource—should be considered for integration into international standards. As a later entrant to plant variety protection, this study proposes a tiered framework to contribute to the optimization and revision of the Chinese guidelines.

4.5. Limitations of the Study

Despite establishing a comprehensive DUS optimization framework and characterizing hawthorn phenotypes, several limitations should be acknowledged. First, all hawthorn germplasm resources used in this study were obtained from China’s National Field Genebank. Although the collection encompasses extensive germplasm diversity, it does not sufficiently represent a broad range of environmental conditions. In addition, example varieties from different regions should also be considered to further improve the representativeness and applicability of the DUS testing framework. Furthermore, although data were collected over three years, quantitative traits remain sensitive to environmental conditions and genotype by environment interactions. Thus, trials conducted at multiple locations across broader ecological regions are needed to validate the long-term stability and regional applicability of the proposed grading thresholds. Finally, although this study provides a robust morphological basis for trait and DNA association analysis, the current framework relies on conventional phenotypic evaluation and has yet to incorporate genomic markers or automated digital phenotyping into routine DUS testing. Addressing these limitations will create new opportunities for future DUS testing.

4.6. New Possibilities for Future Testing

Variety identification plays a crucial role in protecting plant variety intellectual property rights, ensuring seed quality, and promoting breeding innovation [62]. As the technical foundation of new variety identification, DUS testing guidelines have been established for numerous plant species; however, the rapid advancement of emerging technologies has increasingly highlighted the need for their optimization.
Simple sequence repeat (SSR) markers are widely used in DUS testing due to their high polymorphism and reproducibility [6,63,64,65,66], while SNPs offer high genotyping success rates [67,68]. Accordingly, the UPOV explicitly recommends both for variety fingerprinting [69]. Genome-wide association studies based on dense SNP datasets further enable the identification of trait-associated loci, supporting the emerging Genomic DUS paradigm.
Secondly, AI-based image recognition also offers significant opportunities. Tan et al. [70] achieved 90.96% accuracy in hawthorn variety recognition using a multi-scale hybrid attention network, demonstrating the feasibility of integrating digital technologies into DUS testing.
Integrating these approaches could accelerate DUS testing while addressing current limitations in guideline adaptability. Future research should prioritize validating these technologies in field trials to ensure robustness across diverse conditions.

5. Conclusions

This study is the first to systematically optimize the DUS testing guidelines for Chinese hawthorn based on 197 germplasm resources, while revealing substantial phenotypic polymorphism. In addition, a reliable classification system for quantitative traits was established, providing an important basis for further optimization of the DUS testing guidelines. These findings not only refine the descriptor framework for hawthorn but also provide a methodological reference for updating DUS standards in other plant taxa. Looking ahead, integrating molecular markers into routine DUS workflows to facilitate the transition toward genomic DUS, together with field validation of artificial intelligence-based image recognition technologies, will be important for modernizing plant variety protection and promoting breeding innovation.

Supplementary Materials

The following supporting information can be downloaded at: https://www.mdpi.com/article/10.3390/horticulturae12091132/s1, Table S1: 197 hawthorn accessions; Table S2: Table of Characteristics for in Crataegus in China’s DUS Test Guidelines; Table S3: Functional classification and number of characteristics in different DUS test guidelines for hawthorn; Table S4: Grouped characteristics; Figure S1: Two-dimensional loading plots of principal components.

Author Contributions

S.M. and Y.L. conceived of the research endeavor. S.M. and Y.Z. collected samples. Y.Z. processed the data and wrote the manuscript. The manuscript was critically reviewed by X.Z., W.D., S.M. and Y.L. All authors have read and agreed to the published version of the manuscript.

Funding

This research was supported by Natural Science Foundation of Inner Mongolia Autonomous Region of China (2023QN03045), the team project “Grassland Human Settlements Construction System and Key Technologies” (YLXKZX-NGD-004), the Conservation and Utilization of Crop Germplasm Resource—Hawthorn (22250318), and the Scientific Research Foundation for Doctors of Inner Mongolia University of Technology (BS2021037).

Data Availability Statement

The original contributions presented in this study are included in the article/Supplementary Material. Further inquiries can be directed to the corresponding authors.

Acknowledgments

We are grateful to all the collaborators and contributors to this research. We appreciated for Mingze Wang in the Inner Mongolia University of Technology and Chao Sun in Shenyang Agricultural University for his contributions in collecting the data.

Conflicts of Interest

The authors declare no conflicts of interest.

References

  1. Yang, C.J.; Russell, J.; Ramsay, L.; Thomas, W.; Powell, W.; Mackay, I. Overcoming barriers to the registration of new plant varieties under the DUS system. Commun. Biol. 2021, 4, 302. [Google Scholar] [CrossRef] [Scilit] [PubMed]
  2. Ebert, A.W.; Engels, J.M.M.; Schafleitner, R.; van Hintum, T.; Mwila, G. Critical Review of the Increasing Complexity of Access and Benefit-Sharing Policies of Genetic Resources for Genebank Curators and Plant Breeders-A Public and Private Sector Perspective. Plants 2023, 12, 2992. [Google Scholar] [CrossRef] [Scilit] [PubMed]
  3. Yu, J.K.; Chung, Y.S. Plant Variety Protection: Current Practices and Insights. Genes 2021, 12, 1127. [Google Scholar] [CrossRef] [Scilit] [PubMed]
  4. Wu, Q.C.; Zhang, D.J.; Zhang, Q.; Zang, D.K. Development of DUS Test Guidelines for new varieties of Viburnum L. J. For. Res. 2019, 30, 2313–2320. [Google Scholar] [CrossRef] [Scilit]
  5. Arens, P.; Mansilla, C.; Deinum, D.; Cavellini, L.; Moretti, A.; Rolland, S.; van der Schoot, H.; Calvache, D.; Ponz, F.; Collonnier, C.; et al. Development and evaluation of robust molecular markers linked to disease resistance in tomato for distinctness, uniformity and stability testing. Theor. Appl. Genet. 2010, 120, 655–664. [Google Scholar] [CrossRef] [Scilit] [PubMed]
  6. Kwon, Y.S.; Lee, J.M.; Yi, G.B.; Yi, S.I.; Kim, K.M.; Soh, E.H.; Bae, K.M.; Park, E.K.; Song, I.H.; Kim, B.D. Use of SSR markers to complement tests of distinctiveness, uniformity, and stability (DUS) of pepper (Capsicum annuum L.) varieties. Mol. Cells 2005, 19, 428–435. [Google Scholar] [CrossRef] [Scilit]
  7. Chen, T.; Liu, L.; Zhou, Y.L.; Zheng, Q.; Luo, S.Y.; Xiang, T.T.; Zhou, L.J.; Feng, S.L.; Yang, H.Y.; Ding, C.B. Characterization and comprehensive evaluation of phenotypic characters in wild Camellia oleifera germplasm for conservation and breeding. Front. Plant Sci. 2023, 14, 1052890. [Google Scholar] [CrossRef] [Scilit] [PubMed]
  8. Xue, X.W.; Yu, Z.K.; Mu, A.K.; Yang, F.; Liu, D.; Zhang, S.; Zhang, J.L.; Cheng, Y.; Zhao, Y.S.; Zhang, Y.P.; et al. Identification and evaluation of phenotypic characters and genetic diversity analysis of 1,558 foxtail millet germplasm resources for conservation and breeding. Front. Plant Sci. 2025, 16, 1624252. [Google Scholar] [CrossRef] [Scilit] [PubMed]
  9. Kouam, E.B.; Ngouana, C.T.; Dountio, I.L. Exploring genetic diversity of local avocado (Persea americana Mill.) germplasm from the bamboutos highlands diversity centre in western cameroon: A comprehensive multivariate and phylogenetic analyses based on phenotypic descriptors. BMC Plant Biol. 2025, 25, 494. [Google Scholar] [CrossRef] [Scilit] [PubMed]
  10. Duan, X.Q.; Hayat, F.; Lei, Z.Q.; Ruan, H.C.; Lin, W.Z.; Tu, P.F.; Li, C.Q.; Song, W.P.; Li, Y.Q.; Li, J.; et al. Genetic diversity analysis of pomelo germplasm resources based on leaf phenotype and SCoT markers. Sci. Hortic. 2025, 346, 114174. [Google Scholar] [CrossRef] [Scilit]
  11. Xie, Q.; Jiang, L.; Zhao, Q.Q.; Zheng, Y.J.; Yang, Y.F.; Chen, Q.X. Structure Characteristics, Variation of Main Quantitative Traits, and Probability Grading of Chinese Olive (Canarium album) Seeds. Horticulturae 2024, 10, 736. [Google Scholar] [CrossRef] [Scilit]
  12. Wang, Y.; Hu, G.P.; Liu, Z.S.; Zhang, J.; Ma, L.; Tian, T.; Wang, H.; Chen, T.; Chen, Q.; He, W.; et al. Phenotyping in flower and main fruit traits of Chinese cherry Cerasus pseudocerasus (Lindl.) G.Don. Sci. Hortic. 2022, 296, 110920. [Google Scholar] [CrossRef] [Scilit]
  13. Zheng, S.H.; Kong, Q.B.; Yan, H.R.; Liu, J.J.; Tang, R.K.; Zhou, L.J.; Yang, H.Y.; Jiang, X.Y.; Feng, S.L.; Ding, C.B.; et al. Phenotypic Diversity Analysis and Integrative Evaluation of Camellia oleifera Germplasm Resources in Ya’an, Sichuan Province. Plants 2025, 14, 2249. [Google Scholar] [CrossRef] [Scilit] [PubMed]
  14. Li, S.; Ding, Y.; Yu, H.Y.; Ning, N.; Wu, H.L.; Liu, C.T.; Lv, R.Y.; Li, Z.Q.; Liu, W.D. Molecular mechanism of ZmWRKY36 mediated maize resistance to Bipolaris maydis. BMC Plant Biol. 2026, 26, 207. [Google Scholar] [CrossRef] [Scilit] [PubMed]
  15. Devi, J.; Sagar, V.; Dubey, R.K.; Kumar, R.; Bahadur, A.; Verma, R.K.; Rai, N.; Behera, T.K. Phenotypic, stability and adaptation analysis of vegetable pea (Pisum sativum var hortense L.) genotypes for high-temperature stress tolerance. Sci. Hortic. 2025, 340, 113915. [Google Scholar] [CrossRef] [Scilit]
  16. Victorino, J.; Gómez, F. Contour analysis for interpretable leaf shape category discovery. Plant Methods 2019, 15, 104. [Google Scholar] [CrossRef] [Scilit] [PubMed]
  17. Lyu, Y.M.; Ma, S.L.Y.; Dong, W.X.; Zhao, Y.H.; Zhang, R.; Huang, S.S. Guidelines for the Conduct of Tests for Distinctness, Uniformity and Stability (DUS)—Hawthorn (Crataegus L.): LY/T 3208-2020; China Standard Press: Beijing, China, 2020; (In Chinese with English Abstract). [Google Scholar]
  18. Christensen, K.I. Revision of Crataegus Sect. Crataegus and Nothosect. Crataeguineae (Rosaceae-Maloideae) in the Old World; American Society of Plant Taxonomists: Ann Arbor, MI, USA, 1992; Volume 35, pp. 1–199. [Google Scholar]
  19. Edwards, J.E.; Brown, P.N.; Talent, N.; Dickinson, T.A.; Shipley, P.R. A review of the chemistry of the genus Crataegus. Phytochemistry 2012, 79, 5–26. [Google Scholar] [CrossRef] [Scilit] [PubMed]
  20. Zhang, T.C.; Qiao, Q.; Du, X.; Zhang, X.; Hou, Y.L.; Wei, X.; Sun, C.; Zhang, R.G.; Yun, Q.Z.; Crabbe, M.J.C.; et al. Cultivated hawthorn (Crataegus pinnatifida var. major) genome sheds light on the evolution of Maleae (apple tribe). J. Integr. Plant Biol. 2022, 64, 1487–1501. [Google Scholar] [CrossRef] [Scilit] [PubMed]
  21. Li, L.; Gao, X.L.; Liu, J.G.; Chitrakar, B.; Wang, B.; Wang, Y.C. Hawthorn pectin: Extraction, function and utilization. Curr. Res. Food Sci. 2021, 4, 429–435. [Google Scholar] [CrossRef] [Scilit] [PubMed]
  22. Wang, J.; Li, N.F.; Jin, K.; Liu, S.M.; Hou, Y.L.; Liu, Y.X. Acetic acid treatment delays the quality deterioration of hawthorn fruit via regulation of ascorbate biosynthesis and regeneration. Sci. Hortic. 2026, 355, 114561. [Google Scholar] [CrossRef] [Scilit]
  23. Nazhand, A.; Lucarini, M.; Durazzo, A.; Zaccardelli, M.; Cristarella, S.; Souto, S.B.; Silva, A.M.; Severino, P.; Souto, E.B.; Santini, A. Hawthorn (Crataegus spp.): An Updated Overview on Its Beneficial Properties. Forests 2020, 11, 564. [Google Scholar] [CrossRef] [Scilit]
  24. Rahman, M.A.; Armson, D.; Ennos, A.R. A comparison of the growth and cooling effectiveness of five commonly planted urban tree species. Urban Ecosyst. 2015, 18, 371–389. [Google Scholar] [CrossRef] [Scilit]
  25. Zhao, H.C.; Feng, B.T. China Fruit-Plant Monograph of Hawthorn (Crataegus) Flora; China Forest Press: Beijing, China, 1996; p. 160. [Google Scholar]
  26. Dong, N.G.; Wang, Y.; Zheng, S.Q.; Wang, S.D. Current Status and Development Suggestions for the Hawthorn Industry in China. China Fruits 2022, 10, 87–91. [Google Scholar] [CrossRef]
  27. Zhou, C.Y.; Wu, H.Y.; Sheng, Q.Q.; Cao, F.L.; Zhu, Z.L. Study on the Phenotypic Diversity of 33 Ornamental Xanthoceras sorbifolium Cultivars. Plants 2023, 12, 2448. [Google Scholar] [CrossRef] [Scilit] [PubMed]
  28. Zhao, Y.H.; Qi, S.N.; Li, A.X.; Zhao, Y.X.; Ma, X.R.; Liu, Y.X. Genetic Diversity Analysis of Hawthorn Germplasm Resources Basedon Fruit Phenotypic Traits. J. Shenyang Agric. Univ. 2024, 55, 395–404. [Google Scholar]
  29. Ma, S.L.Y. Study on Genetic Diversity and New Variety Protection for Hawthorn Varieties in China. Doctoral Dissertation, Beijing Forestry University, Beijing, China, 2019. [Google Scholar]
  30. Zhang, X.; Sun, X.; Wang, J.; Xue, M.; Sun, C.; Dong, W. Evaluation of molecular and phenotypic diversity of Crataegus bretschneideri C. K. Schneid. and related species in China. Genet. Resour. Crop Evol. 2023, 70, 221–234. [Google Scholar] [CrossRef] [Scilit]
  31. Rahman, N.M.F.; Asadullah, M.; Hossain, M.S.; Uddin, M.J.; Haque, N.; Rashid, M.B.; Hossain, A.M.Z.; Islam, M.R.; Baten, M.A. Spatiotemporal trends and machine learning-based prediction of temperature variability during the T. Aman rice-growing season in Bangladesh. Sci. Rep. 2025, 15, 26312. [Google Scholar] [CrossRef] [Scilit] [PubMed]
  32. Liang, M.; Wang, Z.Q.; Lin, Y.; Li, C.X.; Zhang, L.; Liu, Y.X. Study on detection of pesticide residues in tobacco based on hyperspectral imaging technology. Front. Plant Sci. 2024, 15, 1459886. [Google Scholar] [CrossRef] [Scilit] [PubMed]
  33. Zhang, J.H.; Wang, J.J.; Mi, Y.H.; Zhang, J.Y. Analysis on difference of character of maize standard variety for DUS testing in Yunnan. Southwest China J. Agric. Sci. 2004, 17, 224–227. [Google Scholar] [CrossRef]
  34. Wu, X.H.; Yang, K.X.; Zheng, F.P.; Xu, G.F.; Fan, Z.W.; Clements, D.R.; Yang, Y.H.; Yang, S.S.; Jin, G.M.; Zhang, F.D.; et al. Effects of Acmella radicans Invasion on Soil Seed Bank Community Characteristics in Different Habitats. Plants 2024, 13, 2644. [Google Scholar] [CrossRef] [Scilit] [PubMed]
  35. Ru, H.J.; Wu, X.X.; Xu, B.; Zhang, Y.; Wu, F.; Ma, B.S. Spatial Organization of Fish Assemblages and Its Relation to Environmental Factors in the Lower Yalong River, China. Ecol. Evol. 2025, 15, e71922. [Google Scholar] [CrossRef] [Scilit] [PubMed]
  36. UPOV. Document TGP/8/1: Use of Statistical Procedures in Distinctness, Uniformity and Stability Testing; UPOV: Geneva, Switzerland, 2005. [Google Scholar]
  37. Chu, Y.X.; Deng, S.; Huang, Z.C.; Gu, X.J.; Li, S.G.; Gu, K.F.; Chen, H.R. Classification for Gerbera DUS Testing Quantitative Traits and Diversity Analysis of Morphological Characteristic. J. Plant Genet. Resour. 2015, 16, 920–926. [Google Scholar] [CrossRef]
  38. Chu, Y.X.; Ren, L.; Deng, S.; Li, S.G.; Zhang, Y.Y.; Chen, H.R. Grading Criteria of Anthurium DUS Quantitative Characteristics by Multiple Comparison. Plants 2023, 12, 2417. [Google Scholar] [CrossRef] [Scilit] [PubMed]
  39. Pazhayam, N.M.; Turcotte, C.A.; Sekelsky, J. Meiotic Crossover Patterning. Front. Cell Dev. Biol. 2021, 9, 681123. [Google Scholar] [CrossRef] [Scilit] [PubMed]
  40. Xie, Y.H. Difference Analysis on Dus Traits of Soybean Standard Varieties. Soybean Sci. 2007, 26, 284–286. [Google Scholar]
  41. Ren, L.; Huang, Z.C.; Yao, D.Q.; Chu, Y.X.; Deng, S.; Li, S.G.; Zhang, J.L.; Chen, H.R. Trait Expression Differences of Rice DUS Testing Standard Varieties in Shanghai Area. Chin. Agric. Sci. Bull. 2019, 35, 1–7. [Google Scholar]
  42. Yang, C.J.; Wang, X.; Zhang, J.; Li, N.; Wu, R.X.; Wang, T.; Ding, W. Comparative metabolomic analysis of different-colored hawthorn berries (Crataegus pinnatifida) provides a new interpretation of color trait and antioxidant activity. LWT-Food Sci. Technol. 2022, 163, 113623. [Google Scholar] [CrossRef] [Scilit]
  43. Liu, Y.L.; You, W.W.; Wang, R.Q.; Zeng, T.; Zhao, X.Y.; Cao, Y.L.; Zhang, W.N.; Nie, Z.X.; Yang, X.C.; Li, X. Comparative metabolomics analysis of unique yellow hawthorn (Crataegus pinnatifida) and red-skinned cultivars reveals a different polyphenol biosynthesis flux and antioxidative and antidiabetic potential. Food Qual. Saf. 2024, 8, fyae006. [Google Scholar] [CrossRef] [Scilit]
  44. Zhang, X.; Sun, X.Y.; Cui, M.Q.; Zhao, B.P.; Liu, Y.X.; Qi, H.Y. Integrative metabolome and transcriptome analyses reveal the effects of plant growth regulator diethylaminoethyl hexanoate on flavonoid biosynthesis in hawthorn fruits. Food Qual. Saf. 2025, 9, fyaf048. [Google Scholar] [CrossRef] [Scilit]
  45. Meng, J.; Wang, Y.; Guo, R.; Liu, J.; Jing, K.; Zuo, J.; Yuan, Y.; Jiang, F.; Dong, N. Integrated genomic and transcriptomic analyses reveal the genetic and molecular mechanisms underlying hawthorn peel color and seed hardness diversity. J. Genet. Genom. 2025, 52, 1612–1626. [Google Scholar] [CrossRef] [Scilit] [PubMed]
  46. He, W.; Ye, Z.H.; Li, M.S.; Yan, Y.L.; Lu, W.; Xing, G.N. Extraction of soybean plant trait parameters based on SfM-MVS algorithm combined with GRNN. Front. Plant Sci. 2023, 14, 1181322. [Google Scholar] [CrossRef] [Scilit] [PubMed]
  47. Azam, M.G.; Hossain, M.A.; Sarker, U.; Alam, A.; Nair, R.M.; Roychowdhury, R.; Ercisli, S.; Golokhvast, K.S. Genetic Analyses of Mungbean Vigna radiata (L.) Wilczek Breeding Traits for Selecting Superior Genotype(s) Using Multivariate and Multi-Traits Indexing Approaches. Plants 2023, 12, 1984. [Google Scholar] [CrossRef] [Scilit] [PubMed]
  48. Yang, R.; Li, J.P.; Huang, H.G.; Wu, X.H.; Wu, R.H.; Bai, Y.E. Analysis of Phenotypic Trait Variation in Germplasm Resources of Lycium ruthenicum Murr. Agronomy 2024, 14, 1930. [Google Scholar] [CrossRef] [Scilit]
  49. Ashford, O.S.; Guan, S.Z.; Capone, D.; Rigney, K.; Rowley, K.; Cordes, E.E.; Cortés, J.; Rouse, G.W.; Mendoza, G.F.; Sweetman, A.K.; et al. Relationships between biodiversity and ecosystem functioning proxies strengthen when approaching chemosynthetic deep-sea methane seeps. Proc. R. Soc. B-Biol. Sci. 2021, 288, 20210950. [Google Scholar] [CrossRef] [Scilit] [PubMed]
  50. Simokat, C.; Ferguson, E.L.; Keatly, J.; Smith, T.; Lorence, M.; O’Hara, J. Multi-method approach to assessing the floral-visiting insect assemblage of rare, abophilous plant Baccharis vanessae in Southern California. Ecol. Evol. 2024, 14, e70327. [Google Scholar] [CrossRef] [Scilit] [PubMed]
  51. He, Z.L.; Liu, C.X.; Wang, X.N.; Wang, R.; Chen, Y.Z.; Tian, Y. Assessment of genetic diversity in Camellia oleifera Abel. accessions using morphological traits and simple sequence repeat (SSR) markers. Breed. Sci. 2020, 70, 586–593. [Google Scholar] [CrossRef] [Scilit] [PubMed]
  52. Zhao, L.; Chen, J.C.; Zhang, Z.H.; Wu, W.Y.; Lin, X.L.; Gao, M.X.; Yang, Y.M.; Zhao, P.; Xu, S.B.; Yang, C.F.; et al. Deciphering the Transcriptional Regulatory Network Governing Starch and Storage Protein Biosynthesis in Wheat for Breeding Improvement. Adv. Sci. 2024, 11, 2401383. [Google Scholar] [CrossRef] [Scilit] [PubMed]
  53. Zhao, Y.H.; Zhao, Y.D.; Guo, Y.S.; Su, K.; Shi, X.C.; Liu, D.; Zhang, J.J. High-density genetic linkage-map construction of hawthorn and QTL mapping for important fruit traits. PLoS ONE 2020, 15, e0229020. [Google Scholar] [CrossRef] [Scilit] [PubMed]
  54. Yin, M.Q.; Yuan, X.L.; Gao, D.G.; Cao, J.Q.; Cai, J.W.; Xu, L.P. Analysis of fruit quality traits of 21 hawthorn fruits in the wild fruitforest of Tianshan Mountains. Non-Wood For. Res. 2025, 43, 242–254. [Google Scholar] [CrossRef]
  55. Wang, Z.Y.; Hao, J.Y.; Shi, X.F.; Wang, Q.Q.; Zhang, W.P.; Li, F.Z.; Mur, L.A.J.; Han, Y.H.; Hou, S.Y.; Han, J.W.; et al. Integrating dynamic high-throughput phenotyping and genetic analysis to monitor growth variation in foxtail millet. Plant Methods 2024, 20, 177. [Google Scholar] [CrossRef] [Scilit] [PubMed]
  56. Sitoe, H.M.; Zhang, Y.Q.; Chen, S.Q.; Li, Y.L.; Ali, M.; Sowadan, O.; Karikari, B.; Liu, E.B.; Dang, X.J.; Qian, H.J.; et al. Detection of QTLs for Plant Height Architecture Traits in Rice (Oryza sativa L.) by Association Mapping and the RSTEP-LRT Method. Plants 2022, 11, 999. [Google Scholar] [CrossRef] [Scilit] [PubMed]
  57. Deng, P.; Xie, X.C.; Long, F.Y.; Zhang, L.; Li, Y.H.; Zhao, Z.X.; Yang, S.Y.; Wang, Y.R.; Fan, R.S.; Li, Z.Q. Trait Variations and Probability Grading Index System on Leaf-Related Traits of Eucommia ulmoides Oliver Germplasm. Plants 2021, 10, 2280. [Google Scholar] [CrossRef] [Scilit] [PubMed]
  58. Deng, S.; Chen, H.R.; Ren, L.; Zhang, Y.Y.; Chu, Y.X. Measurement Method for the Quantitative Traits Used in DUS Testing of Hosta (Hosta Tratt.). J. Plant Genet. Resour. 2020, 21, 347–358. [Google Scholar] [CrossRef]
  59. Sood, T.; Sood, S.; Sood, V.K.; Badiyal, A.; Anuradha; Kapoor, S.; Sood, V.; Kumar, N. Characterisation of bell pepper (Capsicum annuum L. var. grossum Sendt.) accessions for genetic diversity and population structure based on agro-morphological and microsatellite markers. Sci. Hortic. 2023, 321, 112308. [Google Scholar] [CrossRef] [Scilit]
  60. UPOV. Guidelines for the Conduct of Tests for Distinctness, Uniformity and Stability—Crataegus L.; UPOV: Geneva, Switzerland, 2008. [Google Scholar]
  61. Cao, Z.W.; Xu, J.; Liu, Y. Effect of Rootstocks on the Cold Resistance of Grafted Crataegus laevigata ‘Paul’s Scarlet’. J. Northwest For. Coll. 2015, 30, 116–119. [Google Scholar]
  62. Bi, X.H.; Xie, H.; Song, Z.Y.; Li, J.E.; Liu, C.; Zhou, X.Z.; Yu, H.L.; Bi, C.G.; Zhao, M. DualCMNet: A lightweight dual-branch network for maize variety identification based on multi-modal feature fusion. Front. Plant Sci. 2025, 16, 1588901. [Google Scholar] [CrossRef] [Scilit] [PubMed]
  63. Khan, A.S.; Ali, S.; Khan, I.A. Morphological and molecular characterization and evaluation of mango germplasm: An overview. Sci. Hortic. 2015, 194, 353–366. [Google Scholar] [CrossRef] [Scilit]
  64. He, B.B.; Geng, R.M.; Cheng, L.R.; Yang, X.B.; Ge, H.M.; Ren, M. Genetic diversity and fingerprinting of 33 standard flue-cured tobacco varieties for use in distinctness, uniformity, and stability testing. BMC Plant Biol. 2020, 20, 420. [Google Scholar] [CrossRef] [Scilit] [PubMed]
  65. Tiwari, J.K.; Ali, N.; Devi, S.; Kumar, V.; Zinta, R.; Chakrabarti, S.K. Development of microsatellite markers set for identification of Indian potato varieties. Sci. Hortic. 2018, 231, 22–30. [Google Scholar] [CrossRef] [Scilit]
  66. Zhao, Y.Y.; Ma, S.L.Y.; Sun, C.; Zhang, X.; Dong, W.X.; Liu, Y.X. Genetic diversity and DNA fingerprinting of Chinese hawthorn (Crataegus L.) resources using simple sequence repeat (SSR) markers. Genet. Resour. Crop Evol. 2026, 73, 86. [Google Scholar] [CrossRef] [Scilit]
  67. Du, H.S.; Yang, J.J.; Chen, B.; Zhang, X.F.; Zhang, J.; Yang, K.; Geng, S.S.; Wen, C.L. Target sequencing reveals genetic diversity, population structure, core-SNP markers, and fruit shape-associated loci in pepper varieties. BMC Plant Biol. 2019, 19, 578. [Google Scholar] [CrossRef] [Scilit] [PubMed]
  68. Yang, J.J.; Zhang, J.; Du, H.S.; Zhao, H.; Mao, A.J.; Zhang, X.F.; Jiang, L.; Zhang, H.Y.; Wen, C.L.; Xu, Y. Genetic relationship and pedigree of Chinese watermelon varieties based on diversity of perfect SNPs. Hortic. Plant J. 2022, 8, 489–498. [Google Scholar] [CrossRef] [Scilit]
  69. UPOV. Guidelines for DNA Profiling: Molecular Marker Selection and Database Construction (“BMT Guidelines”); UPOV: Geneva, Switzerland, 2010. [Google Scholar]
  70. Tan, C.Q.; Deng, J.L.; Wu, C.J.; Wang, M.J.; Ke, L. Visual feature-based multi-scale hybrid attention network for fine-grained Hawthorn varieties identification. Sci. Rep. 2025, 15, 20875. [Google Scholar] [CrossRef] [Scilit] [PubMed]
Figure 1. Hawthorn leaf, flower, and fruit phenotypes.
Horticulturae 12 01132 g001
Figure 2. Distribution of phenotypic traits among 22 hawthorn accessions based on the DUS guidelines. Note: The horizontal axis represents qualitative traits, the vertical axis represents the number of accessions, the numbers 1–5 at the top of the table indicate trait grade levels, and the text provides the descriptive name for each grade.
Horticulturae 12 01132 g002
Figure 3. Violinogram distribution of 11 quantitative traits in 75 hawthorn germplasm resources. Note: The horizontal axis represents the quantitative trait, and the vertical axis represents the distribution range of the quantitative trait values.
Horticulturae 12 01132 g003
Figure 4. Correlation Analysis of 11 Quantitative Traits. * indicates significant correlation, ** indicates extremely significant correlation.
Horticulturae 12 01132 g004
Figure 5. Frequency distribution of 11 QN for hawthorn. Note: The horizontal axis represents trait values, and the vertical axis represents the number of germplasm accessions with that value; the frequency plot includes a normal curve.
Horticulturae 12 01132 g005
Table 1. 33 traits. Note: For QN (quantitative traits) traits, multiple samples were collected and measured per germplasm accession, with replicate numbers detailed in the respective QN collection methods. Specifically, MG denotes a single measurement record from a group of plants or plant parts at one time; MS denotes multiple measurement records from individual plants or plant parts across a specified sample size; and VG denotes a single visual assessment record from a group of plants or plant parts at one time. QL refers to qualitative traits, and PQ refers to pseudo-qualitative traits.
Test TraitsTypeMethodTest TraitsTypeMethod
Plant: habitPQVGPlant: shapePQVG
Shoot: presence of thornsQLVGShoot: colourPQVG
Shoot: zigzagQLVGLeaf blade: shapePQVG
Leaf blade: colour on upper sidePQVGLeaf blade: pubescence on upper sideQLVG
Leaf blade: marginQLVGFlower: typeQLVG
Flower: colour of petalsPQVGFlower: petal foldsQLVG
Flower: anther colourPQVGFlower: pedicel lengthPQVG
Fruit: general shapePQMS/VGFruit: colorPQVG
Fruit: flesh colourPQVGFruit: flesh texturePQVG
Fruit: fruit spot colourPQVGFruit: sepal shapePQVG
Fruit: fruit pulp flavourPQVGFruit: cavity of eye basinQLVG
Petiole lengthQNVG/MS/10Leaf blade lengthQNVG/MS/10
Leaf blade widthQNVG/MS/10Leaf blade ratio length/widthQNVG/MS/10
Fruit widthQNVG/MS/15Fruit lengthQNVG/MS/15
Fruit ratio length/widthQNVG/MS/15Endocarp widthQNMS/MG/15
Endocarp lengthQNMS/MG/15Endocarp ratio length/widthQNMS/MG/15
Flower: diameterQNVG/MS/10
Table 2. COC for DUS test example varieties of hawthorn. Note: COC refers to Coefficients of Coincidence, DUS refers to Distinctness, Uniformity, and Stability.
No.Example VarietiesCOCNo.Example VarietiesCOC
1C. pinnatifida var. major ‘Liaohong’0.98519C. hupehensis ‘Hubei-1’1.000
2C. brettschnederi ‘Fuliong’1.00020C. pinnatifida var. major ‘Shanxitiansheng’1.000
3C. pinnatifida var. major ‘Feixiandamianqiu’1.00021C. hupehensis ‘Hubei-2’1.000
4C. pinnatifida ‘Kaiyuanruanzi’0.98522C. pinnatifida var. major ‘Yiduchangkou’1.000
5C. pinnatifida var. major ‘Jiangxianshanzha’1.00023C. pinnatifida ‘Fakushisheng’0.998
6C. brettschnederi ‘Zuofu-1’1.00024C. pinnatifida var. major ‘Jinxing’1.000
7C. pinnatifida var. major ‘Mopanshanzha’1.00025C. pinnatifida var. major ‘Hanluhong’1.000
8C. pinnatifida var. major ‘Yiduxiaohuang’1.00026C. pinnatifida var. major ‘Huangguo’0.995
9C. pinnatifida var. major ‘Fenli’1.00027C. pinnatifida var. major ‘Xiaohuangmianzha’0.980
10C. pinnatifida var. major ‘Hanfeng’1.00028C. pinnatifida var. major ‘Xinglongzirou’1.000
11C. pinnatifida ‘Zhangwushanlihong’1.00029C. pinnatifida var. major ‘Tianxiangyu’1.000
12C. laevigata ‘Paul’s Scarlet’1.00030C. pinnatifida var. major ‘Fengshuishanzha’1.000
13C. pinnatifida var. major ‘Mengyindajinxing’0.99131C. pinnatifida var. major ‘Waibahong’1.000
14C. pinnatifida var. major ‘Denglonghong’1.00032C. pinnatifida var. major ‘Pingyifuhongzi’1.000
15C. pinnatifida var. major ‘Dawang’0.99533C. pinnatifida var. major ‘Fense’1.000
16C. pinnatifida var. major ‘Wulinghong’1.00034C. pinnatifida var. major ‘Xuzhoudahuo’1.000
17C. pinnatifida var. major ‘Qiujinxing’0.99835C. pinnatifida var. major ‘Donglingqingkou’1.000
18C. pinnatifida var. major ‘Anzedaguo’1.000
Table 3. COC for DUS testing characteristics of hawthorn.
No.Test TraitsTrait TypeCOCNo.Test TraitsTrait TypeCOC
1Plant: trunk numberQL1.00023Flower: colour of petalsPQ1.000
2Plant: habitPQ1.00024Flower: petal foldsQL1.000
3Plant: heightQN1.00025Flower: anther colourPQ1.000
4Plant: shapePQ1.00026Flower: pedicel lengthPQ1.000
5Plant: presence of thornsQL1.00027Fruit: numberQN1.000
6Shoot: internode lengthQN1.00028Fruit: length/width ratioQN1.000
7Shoot: colourPQ1.00029Fruit: general shapePQ0.993
8Shoot: zigzagQL1.00030Fruit: colourPQ0.997
9Leaf blade: shapePQ1.00031Fruit: flesh colourPQ0.992
10Leaf blade: lobesQL1.00032Fruit: flesh texturePQ1.000
11Leaf blade: depth of lobesQN1.00033Fruit: fruit pulp flavourPQ1.000
12Leaf blade: glossinessQN1.00034Fruit: glossiness of skinQL1.000
13Leaf blade: variegationQL1.00035Fruit: fruit spot densityQN0.980
14Leaf blade: colour on upper sidePQ1.00036Fruit: fruit spot colourPQ1.000
15Leaf blade: Smoothness of the upper surfaceQL1.00037Fruit: presence of neckQN1.000
16Leaf blade: Pubescence on upper sideQL1.00038Fruit: cavity of eye basinQL1.000
17Leaf blade: marginQL1.00039Fruit: Sepal postureQN0.997
18Leaf blade: anthocyaninQN1.00040Fruit: Sepal shapePQ0.993
19Flower: numberQN0.99241Endocarp: numberQN1.000
20Flower: typeQL1.00042Endocarp: hardnessQN1.000
21Only varieties with flower type: single: Flower: arrangement of petalsQN1.00043Time of floweringQN1.000
22Flower: secondary colour(s) of the petalQL1.00044Time of harvestQN1.000
Table 4. Frequency distribution and grading evaluation of 22 QN and PQ in hawthorn.
TraitNumberFrequency Distribution/%H′J
12345
PlantHabit19715.7477.666.60 0.6670.607
Shape19742.134.574.063.5545.691.1120.691
ShootPresence of thorns19796.453.55 0.1530.221
Colour1977.6174.1118.27 0.7290.664
Zigzag19799.490.51 0.0320.046
Leaf bladeShape19717.7738.0740.613.050.511.1740.729
Colour on upper side1974.0677.1618.78 0.6440.586
Pubescence on upper side19798.481.52 0.0790.114
Margin1970.5151.7846.701.02 0.7700.555
FlowerType19798.981.02 0.0570.082
Colour of petals19799.490.51 0.0320.046
Petal folds19799.490.51 0.0320.046
Anther colour1961.025.1067.8626.02 0.7890.569
Pedicel length19721.8359.3918.78 0.9560.870
FruitGeneral shape1841.6379.894.3512.501.630.7100.441
Colour1841.639.7886.961.63 0.4830.348
Flesh colour1847.6143.4840.767.071.091.1600.721
Flesh texture1845.9817.3952.1724.46 1.1560.834
Fruit pulp flavour1843.2630.4366.30 0.7460.679
Fruit spot colour18418.4817.9363.59 0.9080.826
Cavity of eye basin18411.4188.59 0.3550.512
Sepal shape18488.0411.96 0.3660.528
Table 5. Analysis of variations of the quantitative traits.
TraitsNumberMax.Min.RangeMean ValueMedianSDCoefficient of Variation Within Varieties (CV)/%Coefficient of Variation Among Varieties (CV)/%
Petiole length/cm759.32.17.24.724.71.0414.5822.03
Leaf blade length/cm7515.85.610.210.2010.11.468.7914.31
Leaf blade width/cm7519.64.515.18.968.81.489.4916.52
Leaf blade ratio length/width751.780.631.151.151.140.138.7611.30
Fruit width/cm753.590.962.642.472.510.425.2817.00
Fruit length/cm752.960.912.052.272.340.354.9915.42
Fruit ratio length/width751.340.620.720.920.930.074.778.04
Endocarp width/cm750.840.320.520.460.460.069.3012.39
Endocarp length/cm751.300.510.790.991.000.134.7913.13
Endocarp ratio length/width753.210.982.232.162.190.318.6914.35
Flower: diameter/cm753.51.52.02.422.40.345.8214.05
Table 6. The eigenvalue, contribution rate and eigenvector of each principal component.
TraitEigenvector of the Principal Component
1234
Petiole length/cm0.316−0.0090.1920.463
Leaf blade length/cm0.0090.541−0.2500.462
Leaf blade width/cm−0.0340.639−0.2100.098
Leaf blade ratio length/width0.092−0.4210.0010.695
Fruit width/cm0.435−0.086−0.223−0.068
Fruit length/cm0.456−0.0160.012−0.113
Fruit ratio length/width−0.0870.1990.596−0.065
Endocarp width/cm0.195−0.118−0.533−0.174
Endocarp length/cm0.4490.0580.046−0.130
Endocarp ratio length/width0.3580.1450.403−0.025
Flower: diameter/cm0.3420.1920.050−0.103
Eigenvalue4.4202.2101.7101.020
Contribution rate/%40.2220.1015.559.31
Cumulative Contribution rate/%40.2260.3275.8785.18
Table 7. K-S normal test of QN of hawthorn.
TraitsRangep ValueSkewnessKurtosis
Absolute ValuePositiveNegative
Petiole length/cm0.0930.093−0.0470.1730.6723.736
Leaf blade length/cm0.0670.067−0.0540.2000.5110.238
Leaf blade width/cm0.0740.074−0.0580.2000.0410.418
Leaf blade ratio length/width0.0940.094−0.0790.0981.2637.437
Fruit width/cm0.1370.065−0.1370.001−1.0561.979
Fruit length/cm0.1450.095−0.145<0.001−1.3552.326
Fruit ratio length/width0.0840.067−0.0840.2000.2850.655
Endocarp width/cm0.1120.112−0.0970.021−0.709−0.105
Endocarp length/cm0.1100.064−0.1100.025−1.1430.831
Endocarp ratio length/width0.1730.083−0.173<0.0010.2060.342
Flower: diameter/cm0.0900.060−0.0900.200−0.2220.773
Table 8. Grading of normally distributed QN in hawthorn. Note: Leaf and flower measurements were obtained using vernier calipers with a precision of 0.1 cm, whereas fruit and endocarp measurements were obtained using vernier calipers with a precision of 0.01 cm. All grading range units are in centimetres (cm).
TraitsGrading RangeLSD0.05H′
1234567
Petiole length/cm≤2.72.8~4.04.1~5.35.4~6.6≥6.7 0.61.222
Leaf blade length/cm≤5.96.0~7.67.7~9.39.4~11.011.1~12.712.8~14.4≥14.50.81.318
Leaf blade width/cm≤4.74.8~6.46.5~8.18.2~9.89.9~11.511.6~13.2≥13.30.81.315
Leaf blade ratio length/width≤0.670.68~0.860.87~1.051.06~1.241.25~1.431.44~1.62≥1.630.091.018
Fruit ratio length/width≤0.740.75~0.810.82~0.880.89~0.950.96~1.021.03~1.09≥1.100.031.481
Endocarp width/cm≤0.350.36~0.420.43~0.490.50~0.56≥0.57 0.031.226
Endocarp ratio length/width≤1.431.44~1.721.73~2.012.02~2.302.31~2.592.60~2.88≥2.890.141.492
Flower: diameter/cm≤1.61.7~1.92.0~2.22.3~2.52.6~2.82.9~3.1≥3.20.11.530
Table 9. Grading of non-normally distributed quantitative traits in hawthorn. Note: All grading range units are in centimetres (cm).
Traits Grading RangeStepH′
12345
Fruit width/cm≤1.721.73~2.252.26~2.782.79~3.31≥3.320.531.145
Fruit length/cm≤1.321.33~1.731.74~2.142.15~2.55≥2.560.411.222
Endocarp length/cm≤0.760.77~0.920.93~1.081.09~1.24≥1.250.161.269
Table 10. Validation of trait grading.
TraitsFp
Petiole length/cm121.659<0.001
Leaf blade length/cm138.010<0.001
Leaf blade width/cm117.200<0.001
Leaf blade ratio length/width54.021<0.001
Fruit ratio length/width185.137<0.001
Endocarp width/cm149.784<0.001
Endocarp ratio length/width107.001<0.001
Flower: diameter/cm195.473<0.001
Kruskal–Wallis H
Fruit width/cm53.512<0.001
Fruit length/cm59.195<0.001
Endocarp length/cm62.622<0.001
Disclaimer/Publisher’s Note: The statements, opinions and data contained in all publications are solely those of the individual author(s) and contributor(s) and not of MDPI and/or the editor(s). MDPI and/or the editor(s) disclaim responsibility for any injury to people or property resulting from any ideas, methods, instructions or products referred to in the content.