Article

Integrated Transcriptomic and Metabolomic Analysis Reveals Metabolic Associations Underlying Oil Accumulation in Macadamia Cultivars


1
Guizhou Institute of Subtropical Crops, Guiyang 550025, China
2
Guangxi South Subtropical Agricultural Science Research Institute, Longzhou 532415, China
3
Yunnan Institute of Tropical Crops, Jinghong 666100, China
4
Shanghai Academy of Landscape Architecture Science and Planning, Shanghai 200232, China
5
Key Laboratory of Tropical Fruit Biology, Ministry of Agriculture & Rural Affairs, South Subtropical Crops Research Institute, Chinese Academy of Tropical Agricultural Sciences, Zhanjiang 524091, China
*
Authors to whom correspondence should be addressed.
Horticulturae 2026, 12(9), 1082; https://doi.org/10.3390/horticulturae12091082
Submission received: 21 July 2026 / Revised: 18 August 2026 / Accepted: 25 August 2026 / Published: 1 September 2026

Abstract

The kernel oil content of macadamia can reach up to 80%, yet the molecular basis underlying cultivar-dependent variation in lipid accumulation remains insufficiently understood. In this study, four macadamia cultivars with contrasting oil traits (O.C, QA1, QA2, and QA3) were investigated using integrated transcriptomic, metabolomic, and nutritional analyses to explore the metabolic pathways associated with kernel oil accumulation. Phenotypic evaluation revealed significant differences in fruit characteristics and nutritional composition among cultivars, with O.C exhibiting the highest crude fat content and QA1 showing the highest crude protein content. Transcriptomic analysis identified numerous differentially expressed genes (DEGs), which were mainly enriched in glycerolipid metabolism, α-linolenic acid metabolism, and amino acid biosynthesis pathways. Metabolomic profiling detected 778 metabolites, among which lipid-related compounds represented a major proportion. Integrated analysis revealed three major metabolic pathways associated with oil accumulation, including amino acid biosynthesis, glycerolipid metabolism, and linoleic acid metabolism. In the amino acid biosynthesis pathway, differential accumulation of amino acids and expression changes of genes including ASNS, GLUL, and MAT were observed among cultivars. In glycerolipid metabolism, differential expression of TAG biosynthesis-related genes (DGAT and PDAT) and variation in phospholipid-related metabolites, including LysoPC and LysoPE, were detected among cultivars. In linoleic acid metabolism, differential expression of fatty acid desaturation and elongation genes (SAD, FAD2, FAD3, and FAE1/KCS) was accompanied by cultivar-dependent differences in the abundance of several fatty acid-related metabolites. Overall, this study provides a comprehensive characterization of transcriptomic and metabolic variation associated with crude fat content and fatty acid-related metabolites in macadamia kernels and identifies candidate genes for further functional validation and molecular breeding studies.

1. Introduction

Nut quality is largely determined by kernel composition, particularly oil content and fatty acid profiles, which influence nutritional value, processing properties, and commercial acceptance [1,2]. Unlike fleshy fruits, nut crops accumulate large amounts of storage lipids in kernels, making lipid biosynthesis and fatty acid regulation key determinants of nut quality. Therefore, understanding the molecular basis of oil accumulation is essential for improving nutritional traits and breeding efficiency in oil-rich tree crops [3,4].
Macadamia (Macadamia integrifolia), a member of the ancient Proteaceae family native to subtropical eastern Australia, is one of the world’s most economically valuable tree nut crops [5,6]. Kernel oil content and composition are important quality attributes that influence the commercial value and processing potential of macadamia nuts. Therefore, identifying cultivar-associated molecular and metabolic features may facilitate quality-oriented cultivar selection and breeding. Macadamia kernels are exceptionally rich in oil, comprising up to 80% of kernel dry weight, with monounsaturated oleic acid (C18:1) representing the dominant fatty acid species. This unique lipid profile contributes to both high oxidative stability and significant cardiovascular health benefits [7,8]. In recent decades, global macadamia cultivation has expanded rapidly, particularly in Australia, South Africa, Kenya, China, and Hawaii [9,10]. However, substantial variation in kernel oil content and fatty acid composition among existing macadamia cultivars continues to pose a major challenge for quality-oriented breeding programs [5,6]. However, the molecular basis underlying cultivar-dependent differences in oil accumulation and fatty acid composition remains insufficiently understood, particularly regarding how variation in lipid biosynthetic pathways, fatty acid modification processes, and associated gene–metabolite relationships contributes to differences in kernel oil traits. Moreover, conventional breeding in macadamia relies predominantly on phenotypic selection, which is strongly influenced by environmental variation, labor-intensive, and constrained by the species’ prolonged juvenile phase of approximately 7–10 years [11]. Therefore, a better understanding of the molecular and metabolic factors associated with oil accumulation is required to identify candidate genes that may support future molecular breeding efforts [12].
Kernel oil biosynthesis in macadamia involves a highly coordinated metabolic network that integrates fatty acid synthesis in plastids, triacylglycerol (TAG) assembly in the endoplasmic reticulum, and oil body packaging, catalyzed by key enzymes including acetyl-CoA carboxylase (ACCase), fatty acid desaturases (FADs), and diacylglycerol acyltransferases (DGATs) [3,4]. These lipid biosynthetic processes are developmentally programmed and transcriptionally regulated through complex gene regulatory networks involving MYB, bHLH, WRKY, and AP2/ERF transcription factor families [13,14]. Importantly, lipid metabolism does not function independently but interacts extensively with antioxidant biosynthesis pathways, including tocopherol production through the shikimate, phenylpropanoid, and methylerythritol phosphate (MEP) pathways, as well as with volatile and flavor compound formation [15]. Together, these interconnected pathways establish a multilayered metabolic regulatory network that ultimately shapes kernel nutritional quality and sensory attributes. The complexity of these interactions, spanning gene expression, enzymatic regulation, and metabolite accumulation, cannot be fully elucidated through single-gene or single-pathway studies. To dissect such hierarchical and dynamic regulatory systems, integrated multi-omics approaches have emerged as powerful analytical frameworks [16,17]. Transcriptomics enables genome-wide characterization of gene expression patterns but cannot directly infer metabolic phenotypes, whereas metabolomics captures downstream biochemical outputs while lacking the capacity to identify upstream regulatory determinants [18,19]. By constructing gene–metabolite–phenotype association networks, integrative multi-omics analyses can help link transcriptional patterns with metabolic changes and facilitate the identification of candidate regulatory nodes and gene–metabolite associations [20,21]. Such approaches have been successfully applied to elucidate complex quality traits in fleshy fruits and oilseed crops [19,22]. However, despite the growing economic importance of macadamia, the application of integrated multi-omics strategies to investigate kernel oil biosynthesis and fatty acid regulation remains largely unexplored, representing a major knowledge gap in macadamia biology and breeding [6].
This study selected four cultivars of Macadamia integrifolia (O.C, QA1, QA2, and QA3) exhibiting contrasting kernel oil characteristics and integrated transcriptomic, metabolomic, and nutritional analyses to characterize the molecular and metabolic differences associated with oil accumulation. We hypothesized that cultivar-dependent variation in kernel oil accumulation is associated with distinct transcriptional and metabolic changes, including differences in lipid-related pathways, fatty acid metabolism, and gene–metabolite relationships. The objective of this study was to identify candidate metabolic pathways, genes, and metabolites associated with cultivar-dependent variation in kernel oil content and fatty acid composition. By integrating transcriptomic and metabolomic datasets, we aimed to provide insights into the molecular basis of oil accumulation variation in macadamia and identify candidate resources for future functional validation and molecular breeding studies.

2. Material and Methods

2.1. Plant Materials and Sample Collection

The macadamia materials used in this study were collected from the macadamia experimental plantation of the Guizhou Subtropical Crops Research Institute located in Wanfenglin, Xingyi City, Guizhou Province, China (104°54′23″ E, 24°58′30″ N; altitude 1250 m). In October 2025, during the fruit maturation stage, four macadamia cultivars with distinct oil characteristics (O.C, QA1, QA2, and QA3) were selected as experimental materials (Table 1).
The trees used in this study were approximately 10 years old and were grown in the same experimental plantation. Trees of all four cultivars were maintained under comparable field conditions and subjected to the same irrigation and fertilization management to minimize variation caused by differences in water availability, nutrient supply, and local environment. The sampled trees were distributed within the same experimental plantation and were selected from areas with comparable topography and light conditions. For each cultivar, three healthy trees with similar growth status and no obvious disease or pest damage were randomly selected, and each tree was treated as one biological replicate. Fruits were randomly collected from the outer middle–upper canopy in four directions (east, south, west, and north), with 10 mature fruits harvested from each direction. The fruits collected from each individual tree were pooled to generate one biological sample, resulting in 40 fruits per biological replicate.
After transportation to the laboratory, 10 fruits were randomly selected from each mixed sample for measurements of fruit diameter and fruit weight. The remaining fruits were manually dehusked to obtain kernels. Fresh kernels were immediately frozen in liquid nitrogen and subsequently stored at −80 °C until further analysis. For subsequent experiments, kernel samples were divided into two portions. One portion was used for nutritional quality analysis, including crude fat, crude protein, soluble sugar, and total amino acid contents, while the other portion was used for transcriptomic sequencing and targeted metabolomic analyses.

2.2. Determination of Fruit Traits and Nutritional Quality

Fruit diameter was measured at the equatorial plane using a digital Vernier caliper (precision 0.01 mm), and single-fruit weight (whole fruit with shell) was determined using an electronic balance (precision 0.01 g).
Crude fat content of macadamia kernels was determined using the Soxhlet extraction method according to the standard procedures of the Association of Official Analytical Chemists method 920.39. Briefly, 0.5 g kernel samples were ground into powder, placed in a cellulose thimble, and extracted with petroleum ether (boiling point 30–60 °C) for 6 h at 80 °C using a Soxhlet apparatus. The extract was dried at 105 °C to constant weight, and crude fat content was calculated as the percentage of residual oil weight to sample dry weight.
Crude protein content was measured using the Kjeldahl method 920.87. Then, 0.5 g samples were digested with concentrated sulfuric acid and a catalyst mixture (K2SO4:CuSO4·5H2O, 10:1, w/w) at 420 °C for 2 h until clear. After distillation and titration, protein content was calculated using a nitrogen-to-protein conversion factor of 5.46.
Soluble sugar content was determined using the anthrone–sulfuric acid colorimetric method. Kernel extracts were reacted with anthrone reagent (0.2% anthrone in concentrated H2SO4) at 100 °C for 10 min, and absorbance was measured at 620 nm using a spectrophotometer. Glucose was used as the standard for calibration.
Total amino acid content was measured using the ninhydrin colorimetric method. Kernel extracts were reacted with ninhydrin reagent at 100 °C for 15 min, and absorbance was measured at 570 nm. Leucine was used as the standard for calibration. All measurements were conducted with three biological replicates, and each mixed sample was considered one biological replicate.

2.3. RNA Extraction and Transcriptome Sequencing

Total RNA was extracted using the RNAprep Pure Plant Kit (Tiangen, Beijing, China) following the manufacturer’s instructions. RNA purity and concentration were evaluated using a NanoDrop 2000 spectrophotometer (Thermo Fisher Scientific, Waltham, MA, USA), while RNA integrity was assessed using an Agilent 2100 Bioanalyzer (Agilent Technologies, Santa Clara, CA, USA). After quality assessment, qualified RNA samples were used for cDNA library construction. Libraries were sequenced on the Illumina NovaSeq 6000 platform (Illumina, Inc., San Diego, CA, USA) using the paired-end sequencing mode. Raw sequencing reads were processed by removing adaptor sequences, low-quality reads, and reads containing excessive unknown nucleotides (N) to obtain clean reads. The clean reads were aligned to the chromosome-scale reference genome of Macadamia integrifolia cultivar HAES 741 (GCA_013358625.1). Gene expression levels were quantified based on read counts using featureCounts (v2.0.1). Differentially expressed genes (DEGs) were identified using the DESeq2 package with the criteria of |log2FoldChange| ≥ 1 and adjusted p-value (false discovery rate, FDR) < 0.05.

2.4. Targeted Metabolomic Analysis

Frozen kernel samples were freeze-dried and ground into fine powder under liquid nitrogen conditions. Approximately 50 mg of powdered sample was accurately weighed and extracted with 1.2 mL of precooled methanol/water solution containing internal standards. The extraction mixture was vortexed, ultrasonically extracted under low-temperature conditions, and centrifuged at 12,000 rpm for 10 min at 4 °C. The supernatant was collected and filtered through a 0.22 μm membrane filter before UPLC-MS/MS analysis. Targeted metabolomic analysis was performed using an ultra-performance liquid chromatography-tandem mass spectrometry (UPLC-MS/MS) system (ExionLCTM AD, SCIEX, USA coupled with QTRAP® 6500+ system, SCIEX, USA). Chromatographic separation was achieved using a C18 column, and the mobile phases consisted of water containing 0.1% formic acid and acetonitrile containing 0.1% formic acid. The mass spectrometer was operated with an electrospray ionization (ESI) source in both positive and negative ion modes, and metabolite detection was performed using the multiple reaction monitoring (MRM) mode. Metabolites were identified based on the comparison of retention time, precursor ions, product ions, and MS/MS spectral information with the MetWare database (MWDB) and public metabolite databases. Quantification was performed based on the MRM transitions and relative metabolite abundance. Quality control (QC) samples were prepared by mixing equal volumes of extracts from all samples and were analyzed periodically throughout the analytical sequence to evaluate the stability and reproducibility of the UPLC-MS/MS platform. Differentially accumulated metabolites (DAMs) were identified using the criteria of VIP ≥ 1, |log2FoldChange| ≥ 1, and p-value < 0.05.

2.5. Integrated Transcriptomic and Metabolomic Analysis

Differentially expressed genes (DEGs) and differentially accumulated metabolites (DAMs) were mapped onto the Kyoto Encyclopedia of Genes and Genomes (KEGG) pathways to identify significantly enriched metabolic routes shared by both omics layers. Pathways enriched in both the transcriptomic and metabolomic datasets were prioritized for further integrated analysis.
Pathways were prioritized for detailed integrated analysis based on three considerations: (i) their biological relevance to the primary objective of this study, namely kernel oil accumulation and fatty acid composition; (ii) the simultaneous presence of pathway-associated DEGs and DAMs that enabled gene–metabolite integration; and (iii) their representation of complementary metabolic processes related to precursor metabolism, TAG assembly/lipid remodeling, and fatty acid modification. Based on these criteria, biosynthesis of amino acids, glycerolipid metabolism, and linoleic acid metabolism were selected for in-depth analysis. Other enriched pathways were retained in the global enrichment analyses but were not subjected to detailed pathway-level integration because they were either more broadly involved in primary, signaling, or secondary metabolism or were less directly aligned with the specific focus of the present study.
Pearson correlation coefficients were calculated between the expression levels of DEGs and the relative abundances of DAMs across the biological samples within the selected pathways. To control for false-positive associations arising from multiple comparisons, the p values obtained from the correlation analyses were adjusted using the Benjamini–Hochberg false discovery rate (FDR) procedure. Gene–metabolite pairs with |r| ≥ 0.80 and an FDR-adjusted p value < 0.05 were considered significantly associated. Based on the pathway enrichment results and the corrected gene–metabolite correlations, three pathways relevant to the oil-related traits investigated in this study were selected for in-depth integrated analysis: biosynthesis of amino acids, glycerolipid metabolism, and linoleic acid metabolism. Within each pathway, the expression patterns of structural genes and the accumulation profiles of pathway-associated metabolites were jointly visualized using Z-score-normalized heatmaps.

2.6. Statistical Analysis

All experiments were conducted with three biological replicates, and data are presented as mean ± standard deviation (SD). Statistical analyses were performed using SPSS version 26.0 (IBM Corp., Armonk, NY, USA) and R version 4.2.1 (R Core Team, Vienna, Austria). Significant differences among cultivars were determined using one-way analysis of variance (ANOVA) followed by Tukey’s honestly significant difference (HSD) test. Differences were considered statistically significant at p < 0.05.

3. Results

3.1. Phenotypic and Nutritional Characterization Among Macadamia Cultivars

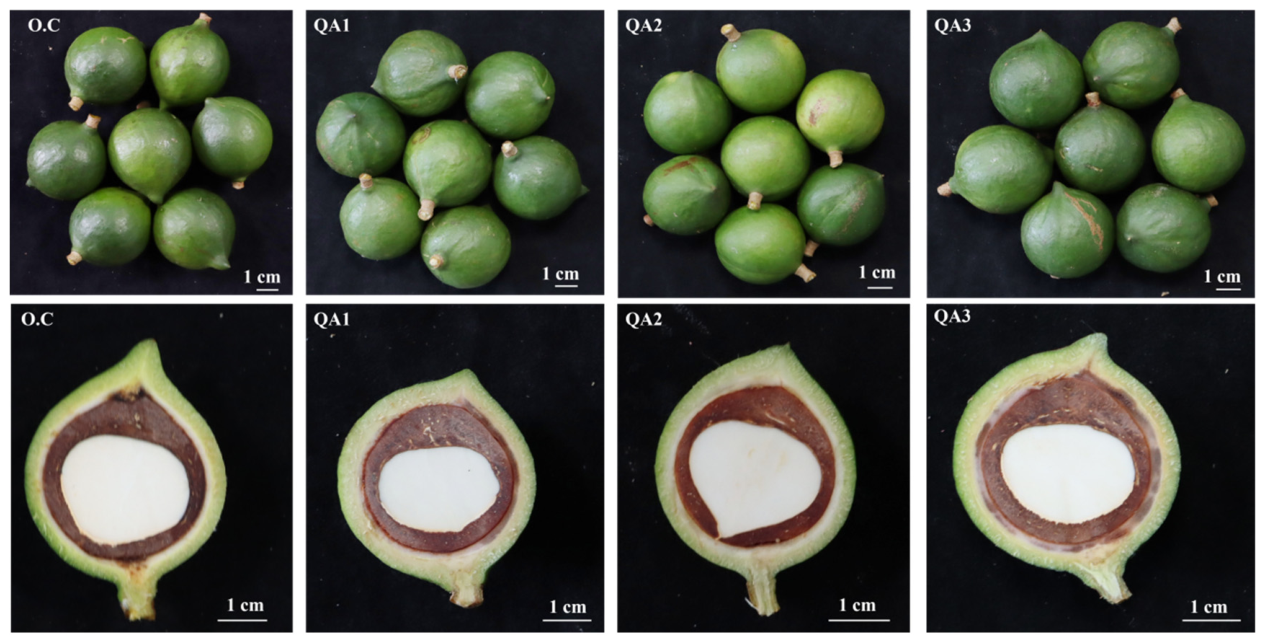
To compare phenotypic and nutritional variation among different macadamia cultivars, fruit characteristics and major kernel nutritional components were evaluated. As shown in Figure 1 and Table 2, significant differences in fruit morphology were observed among cultivars. QA1 and QA3 exhibited relatively larger fruit size and higher single-fruit weight, whereas QA2 produced smaller fruits. O.C displayed intermediate morphological traits.
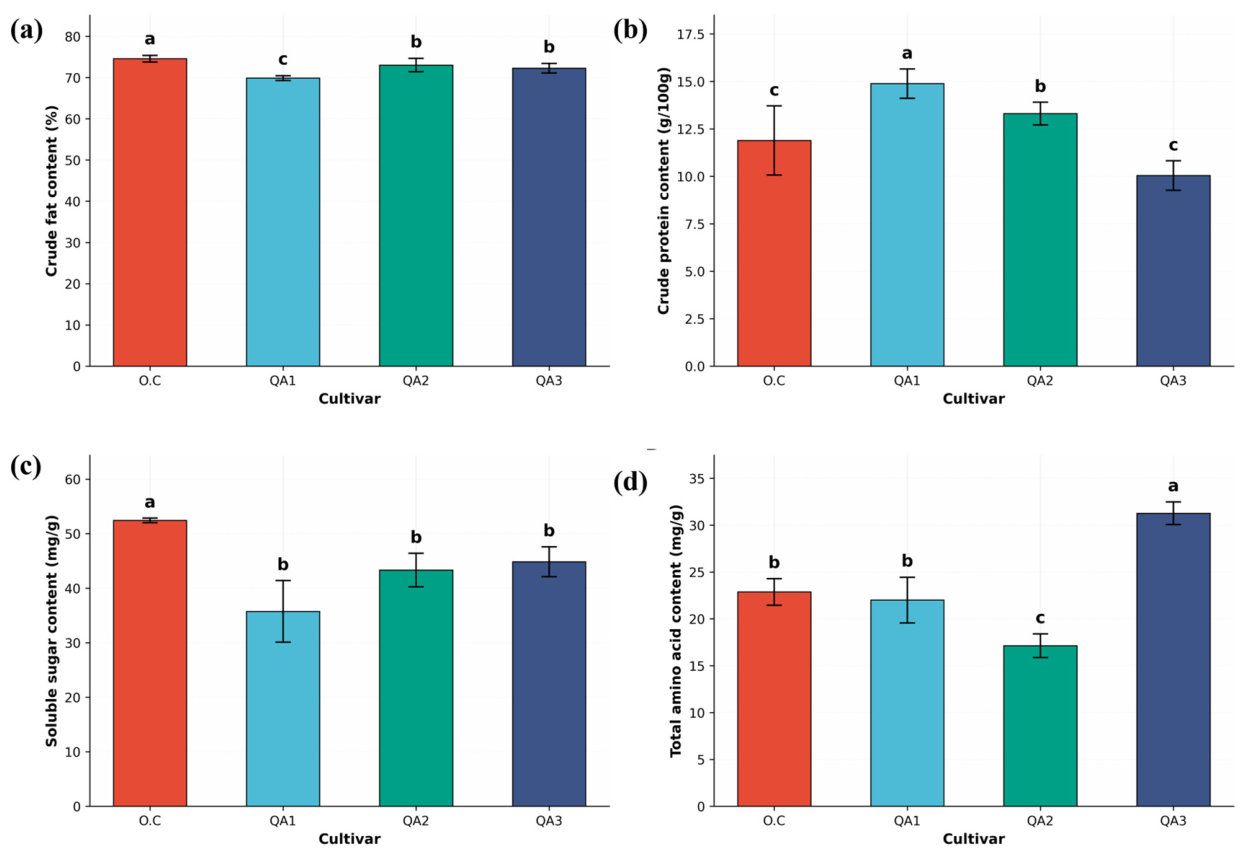
Substantial variation in kernel nutritional composition was also observed among cultivars (Figure 2). Among the four cultivars, O.C exhibited the highest crude fat content, indicating its superior oil accumulation capacity, whereas QA1 showed relatively lower crude fat content but higher crude protein content. QA3 exhibited relatively high total amino acid content. These cultivar-dependent differences in fruit traits and nutritional composition provided the basis for subsequent transcriptomic and metabolomic analyses.
Overall, substantial differences in fruit morphology and nutritional quality were observed among the four macadamia cultivars. In terms of fruit phenotypes, QA3 and QA1 were characterized as large-fruited cultivars, exhibiting higher single-fruit weight and larger transverse diameter, whereas QA2 displayed noticeably smaller fruits, with O.C showing intermediate characteristics. With respect to nutritional composition, O.C exhibited relatively high crude fat and soluble sugar contents but comparatively low crude protein and total amino acid levels. QA1 showed the lowest crude fat and soluble sugar contents but the highest crude protein content. In contrast, QA3 exhibited both high crude fat and high total amino acid contents. These phenotypic and nutritional differences provide an important basis for subsequent transcriptomic and metabolomic analyses.

3.2. Transcriptome Sequencing Quality and DEGs Identification

To evaluate the transcriptome sequencing quality, 12 cDNA libraries derived from four macadamia nut kernel samples were sequenced. A total of 42.01–50.72 million clean reads were obtained for each sample, corresponding to 6.09–7.35 Gb clean bases. The Q20 and Q30 values exceeded 99% and 98%, respectively, indicating high sequencing accuracy. In addition, the GC content ranged from 45.99% to 47.67%, while the overall mapping rate varied from 90.40% to 94.90% (Table 3). These results demonstrated that the sequencing data were of high quality and suitable for subsequent transcriptomic analyses.
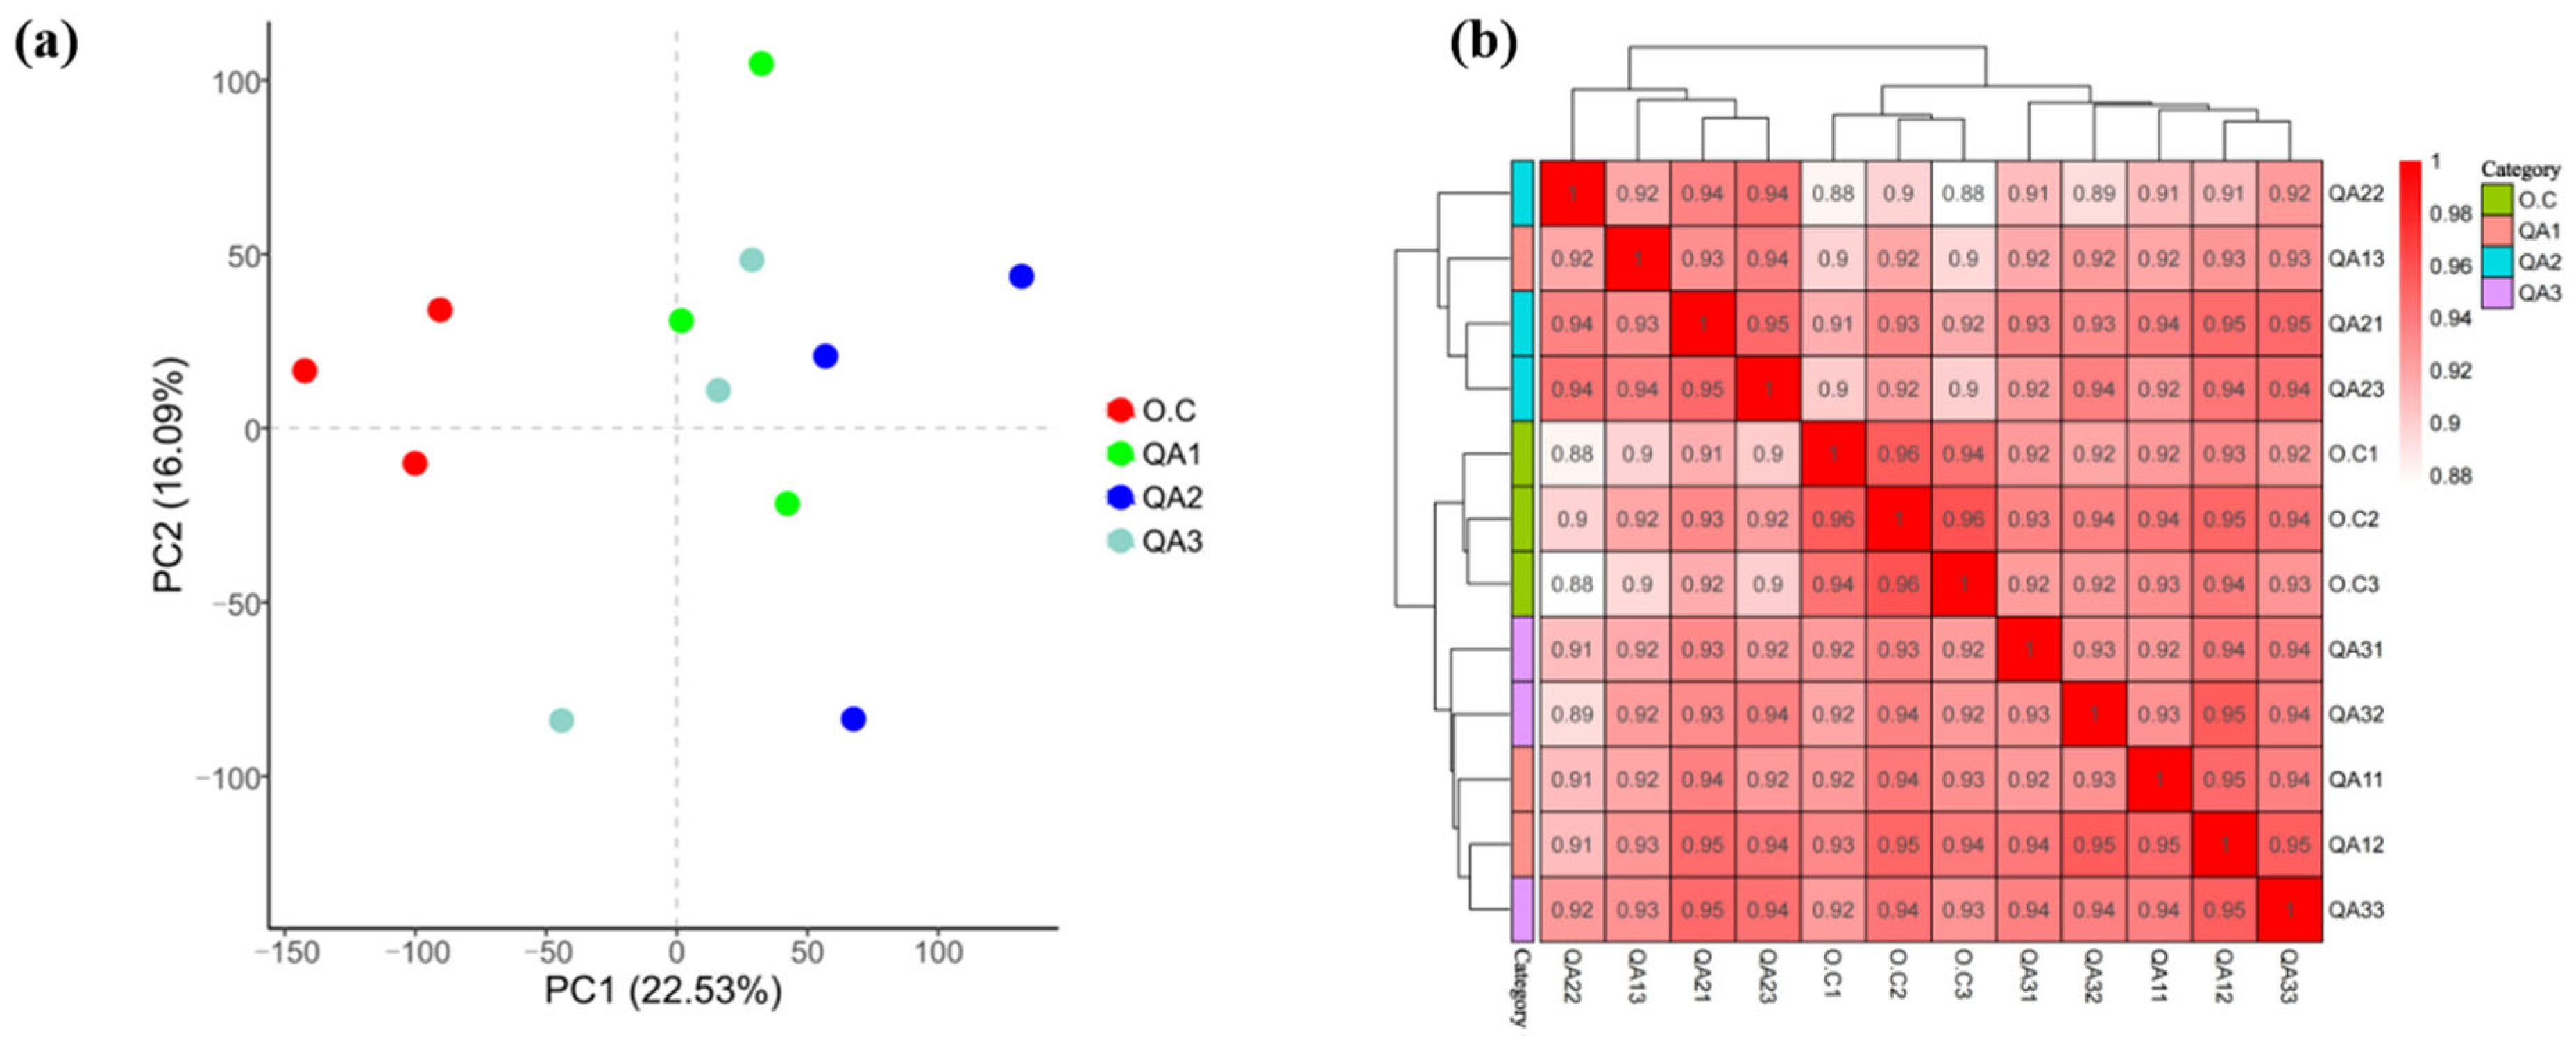
Principal component analysis (PCA) and Pearson correlation analysis were performed to evaluate sample repeatability and transcriptional differences among groups (Figure 3). The first two principal components explained 22.53% and 16.09% of the total variance, respectively. Biological replicates from the same group clustered closely together, indicating good reproducibility (Figure 3a). No individual biological replicate showed obvious deviation from its corresponding cultivar group based on PCA distribution. Furthermore, Pearson correlation coefficients among samples were generally higher than 0.90, further supporting the consistency and reliability of the transcriptome datasets (Figure 3b).
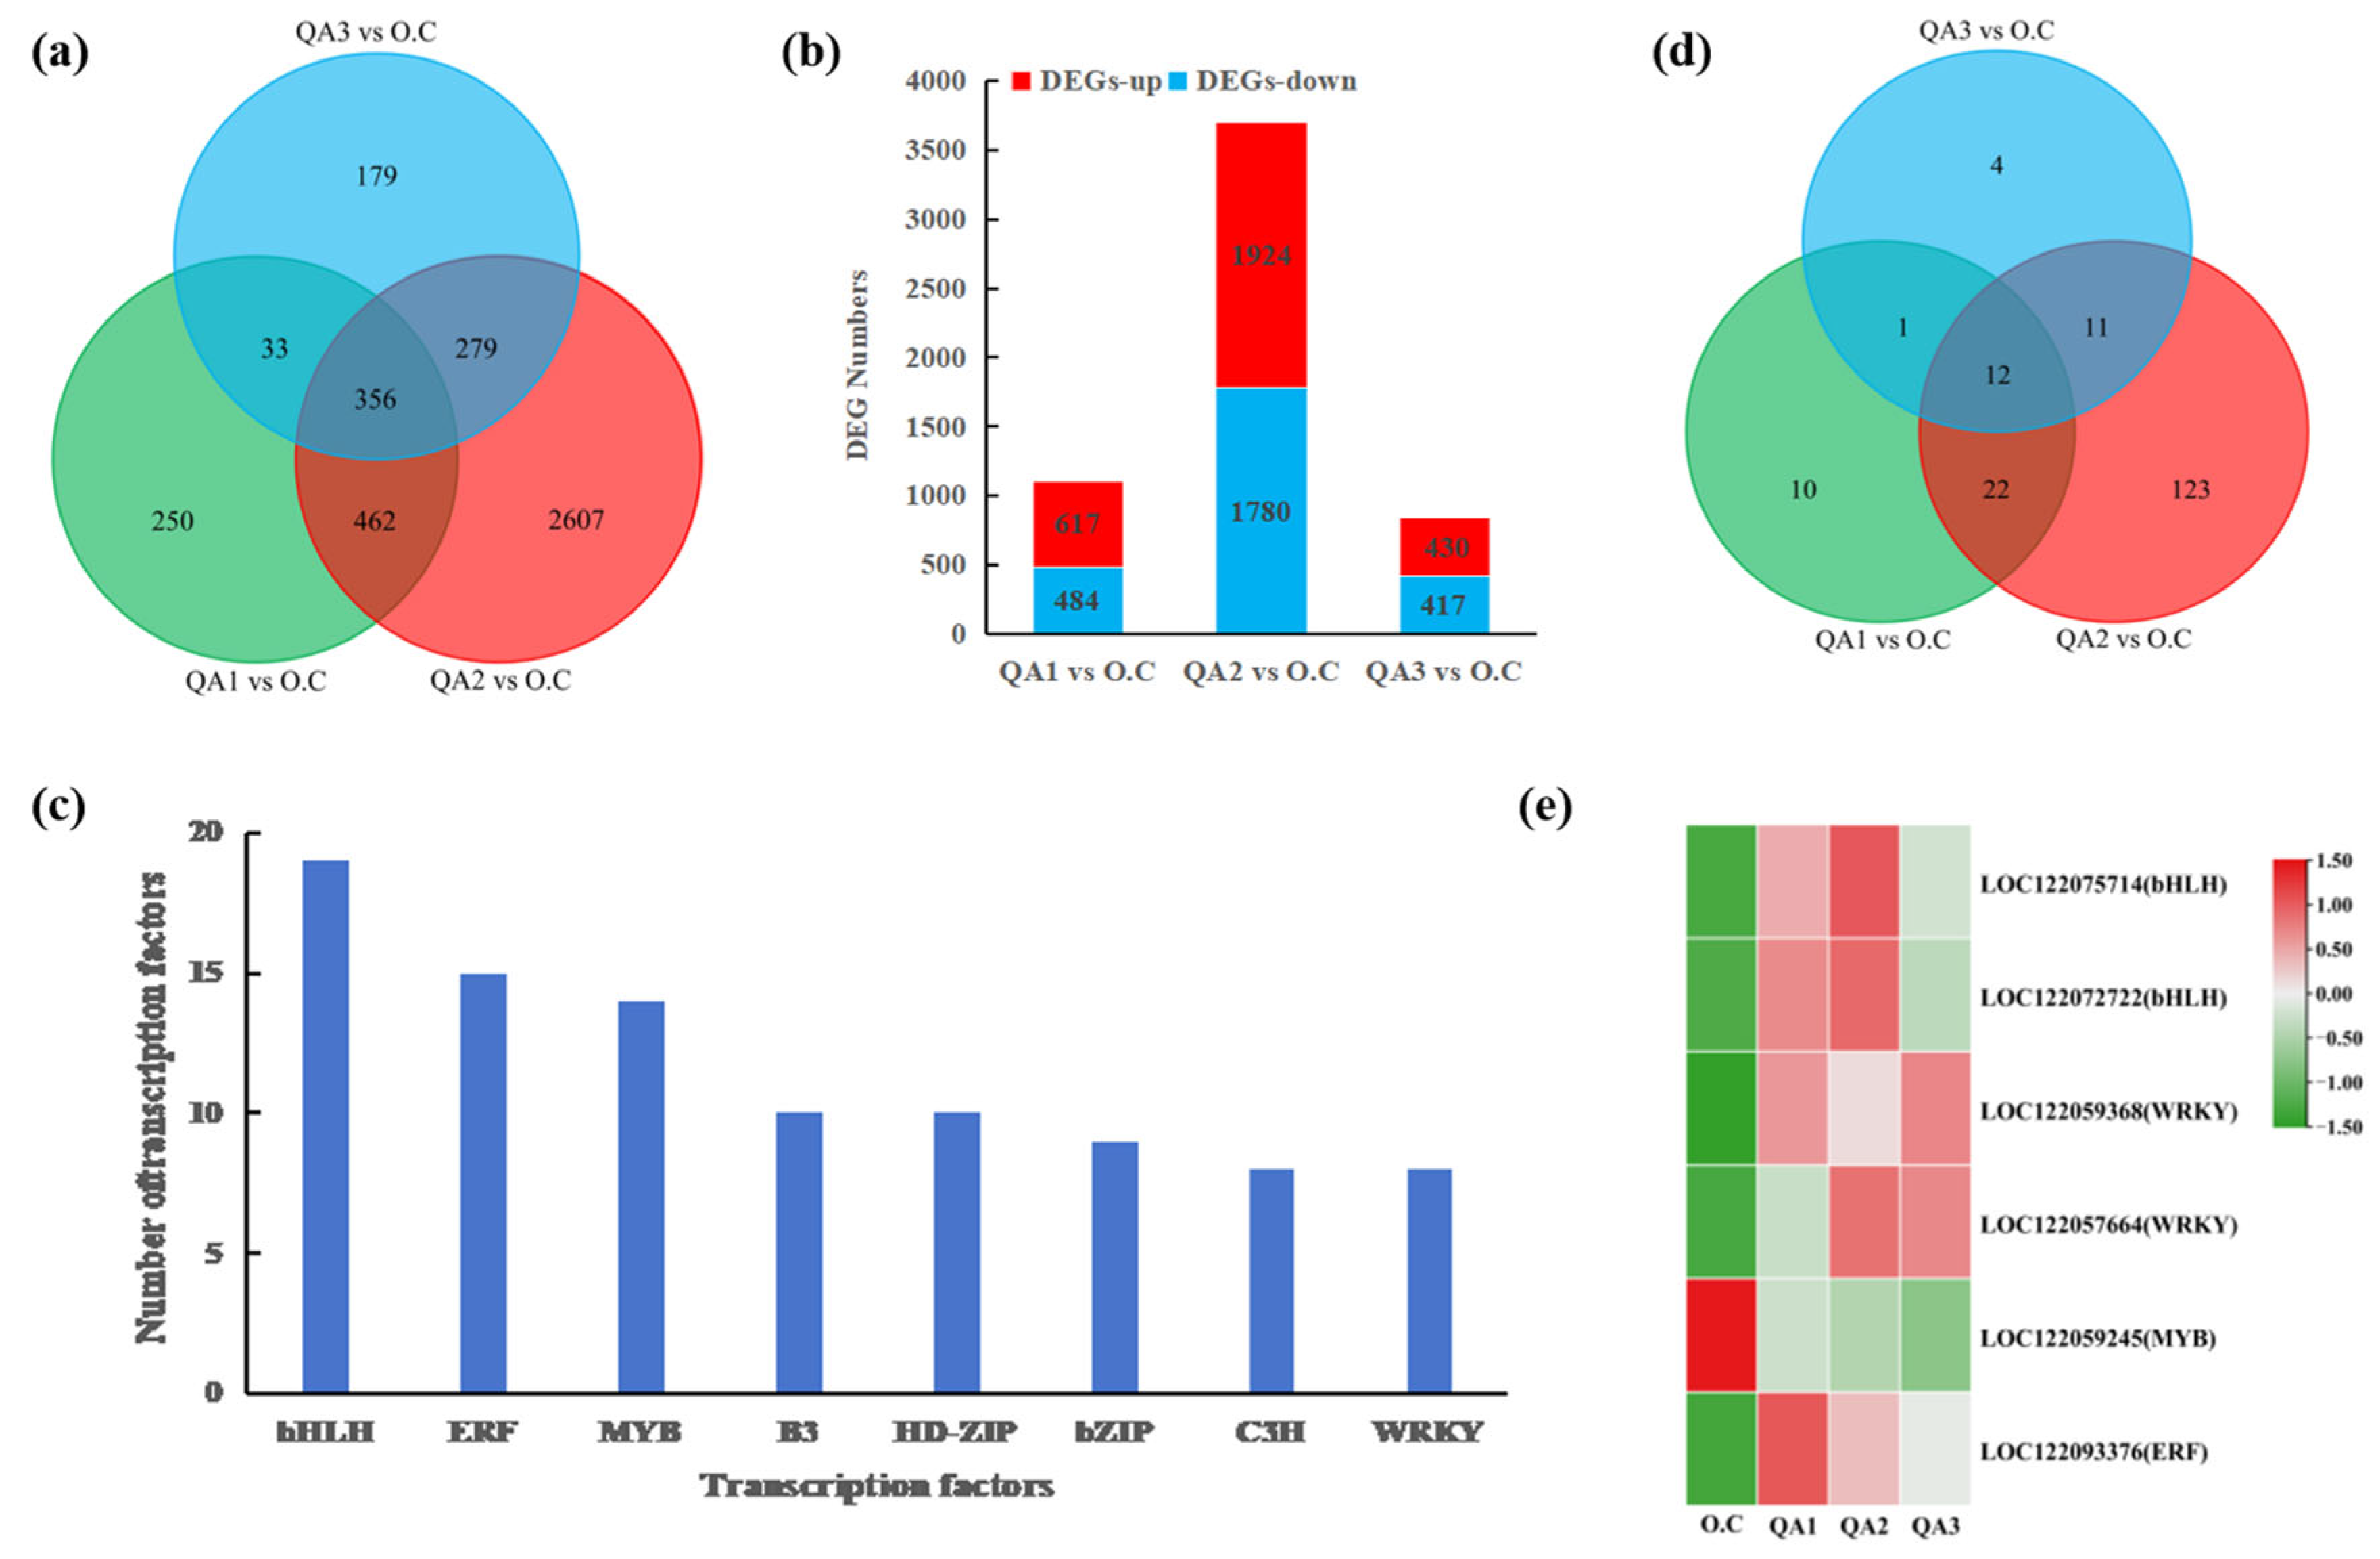
Differential expression analysis identified substantial transcriptional differences among the comparison groups (Figure 4). A total of 1101 DEGs were detected in QA1 vs. O.C, including 617 up-regulated and 484 down-regulated genes. In QA2 vs. O.C, 3704 DEGs were identified, comprising 1924 up-regulated and 1780 down-regulated genes, representing the largest number of DEGs among all comparisons. Meanwhile, 847 DEGs were identified in QA3 vs. O.C, including 430 up-regulated and 417 down-regulated genes (Figure 4a). Venn analysis revealed that 356 DEGs were commonly shared among the three comparison groups, whereas each group also contained unique DEGs, indicating both common and distinct transcriptional regulatory patterns (Figure 4b). In addition, a total of 186 differentially expressed transcription factors (TFs) were identified among the four mature macadamia nut kernel samples. Specifically, 45, 168, and 28 differentially expressed TFs were detected in the comparison groups QA1 vs. O.C, QA2 vs. O.C, and QA3 vs. O.C, respectively. Among them, the bHLH, ERF, MYB, bZIP, and WRKY families were the most abundant, comprising 19, 15, 14, 9, and 8 TFs, respectively, suggesting their potential involvement in regulating kernel development and metabolic processes in macadamia (Figure 4c–e).

3.3. Functional Enrichment Analysis of DEGs

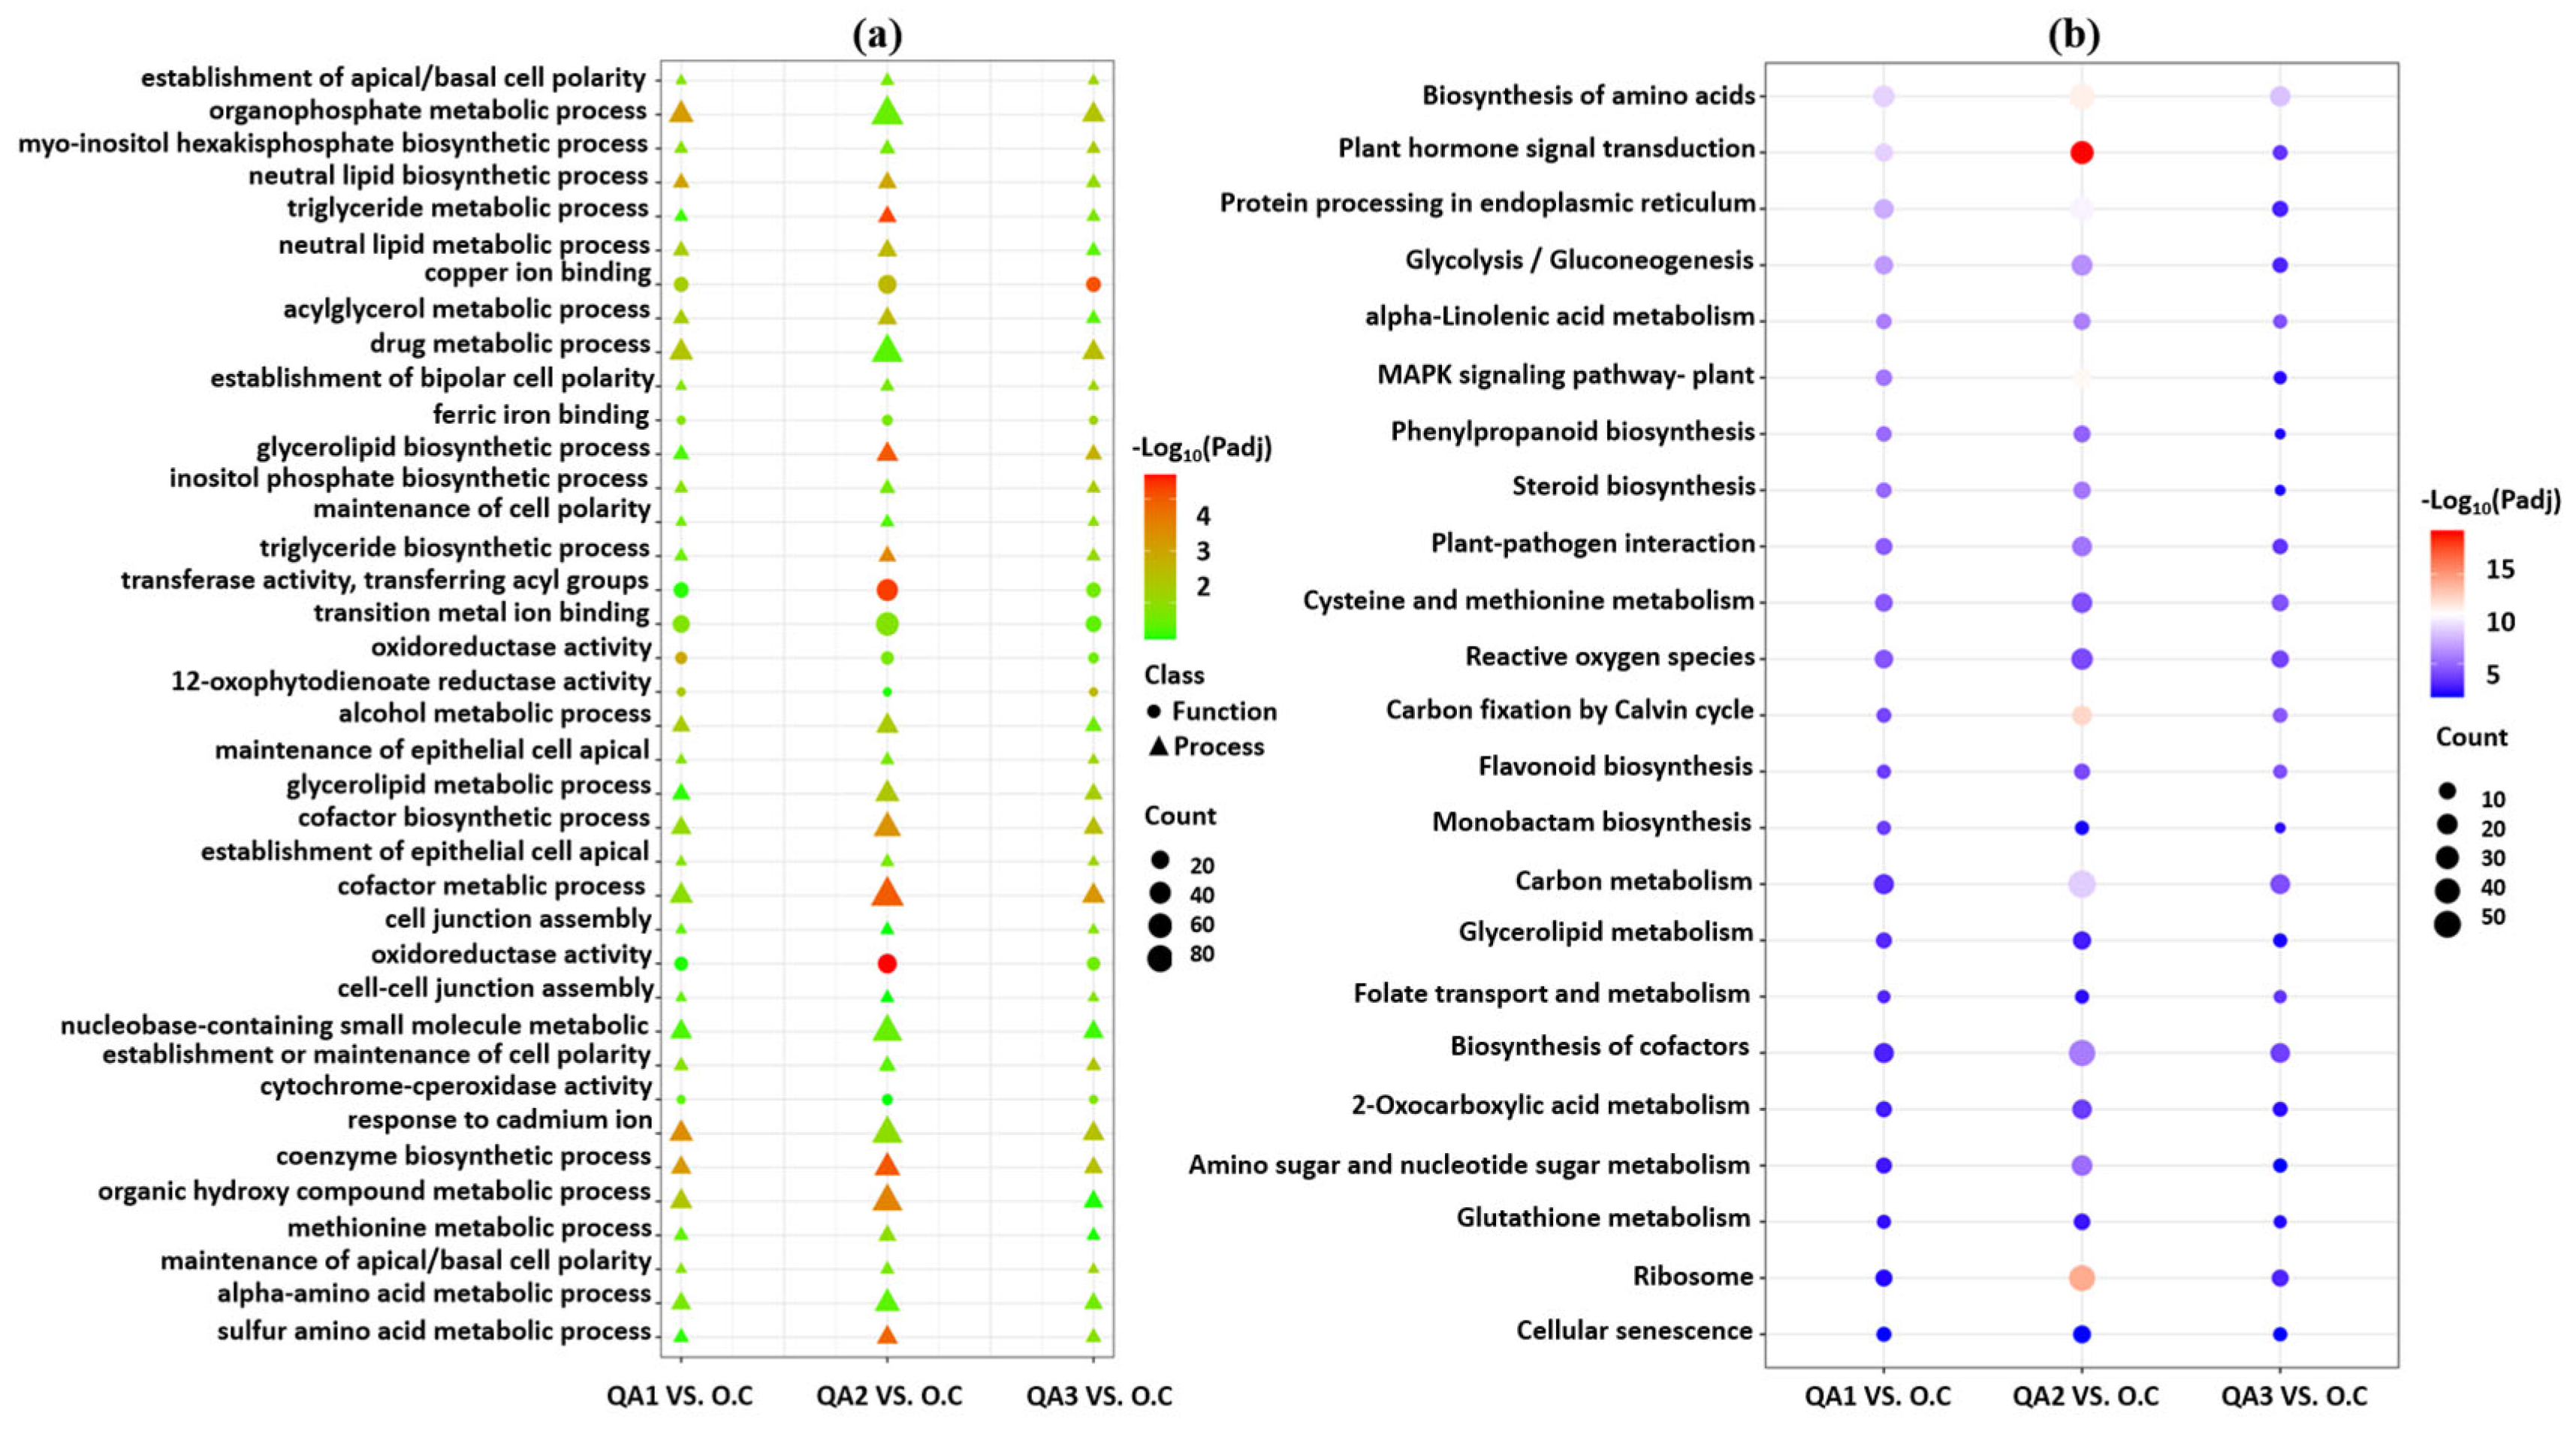
GO enrichment analysis was performed on the DEGs identified in the three comparison groups (QA1 vs. O.C, QA2 vs. O.C, and QA3 vs. O.C). The results showed that significantly enriched Biological Process (BP) categories were mainly associated with lipid metabolism, including triglyceride metabolic process, neutral lipid biosynthetic process, Glycerolipid metabolic process, acylglycerol metabolic process, and cofactor biosynthetic process. In the Molecular Function (MF) category, the DEGs were significantly enriched in acyltransferase activity, oxidoreductase activity, and transition metal ion binding (Figure 5a).
KEGG pathway enrichment analysis further identified several pathways that were significantly overrepresented among the DEGs in the three comparison groups, including Glycerolipid metabolism, alpha-Linolenic acid metabolism, Biosynthesis of amino acids, Glycolysis/Gluconeogenesis, Plant hormone signal transduction, Protein processing in endoplasmic reticulum, Phenylpropanoid biosynthesis, Steroid biosynthesis, and Carbon metabolism (Figure 5b). Among these, Glycerolipid metabolism and alpha-Linolenic acid metabolism are biochemically related to lipid synthesis and fatty acid modification, whereas Biosynthesis of amino acids, Glycolysis/Gluconeogenesis, and Carbon metabolism are associated with central metabolic processes that may influence the availability of metabolic precursors. These enrichment patterns indicate that genes assigned to these pathways were disproportionately represented among the DEGs; however, enrichment alone does not demonstrate their direct functional involvement in oil accumulation. Therefore, these pathways were considered candidates for subsequent integrated transcriptomic and metabolomic analyses.

3.4. Metabolomic Profiling and Differential Metabolite Analysis

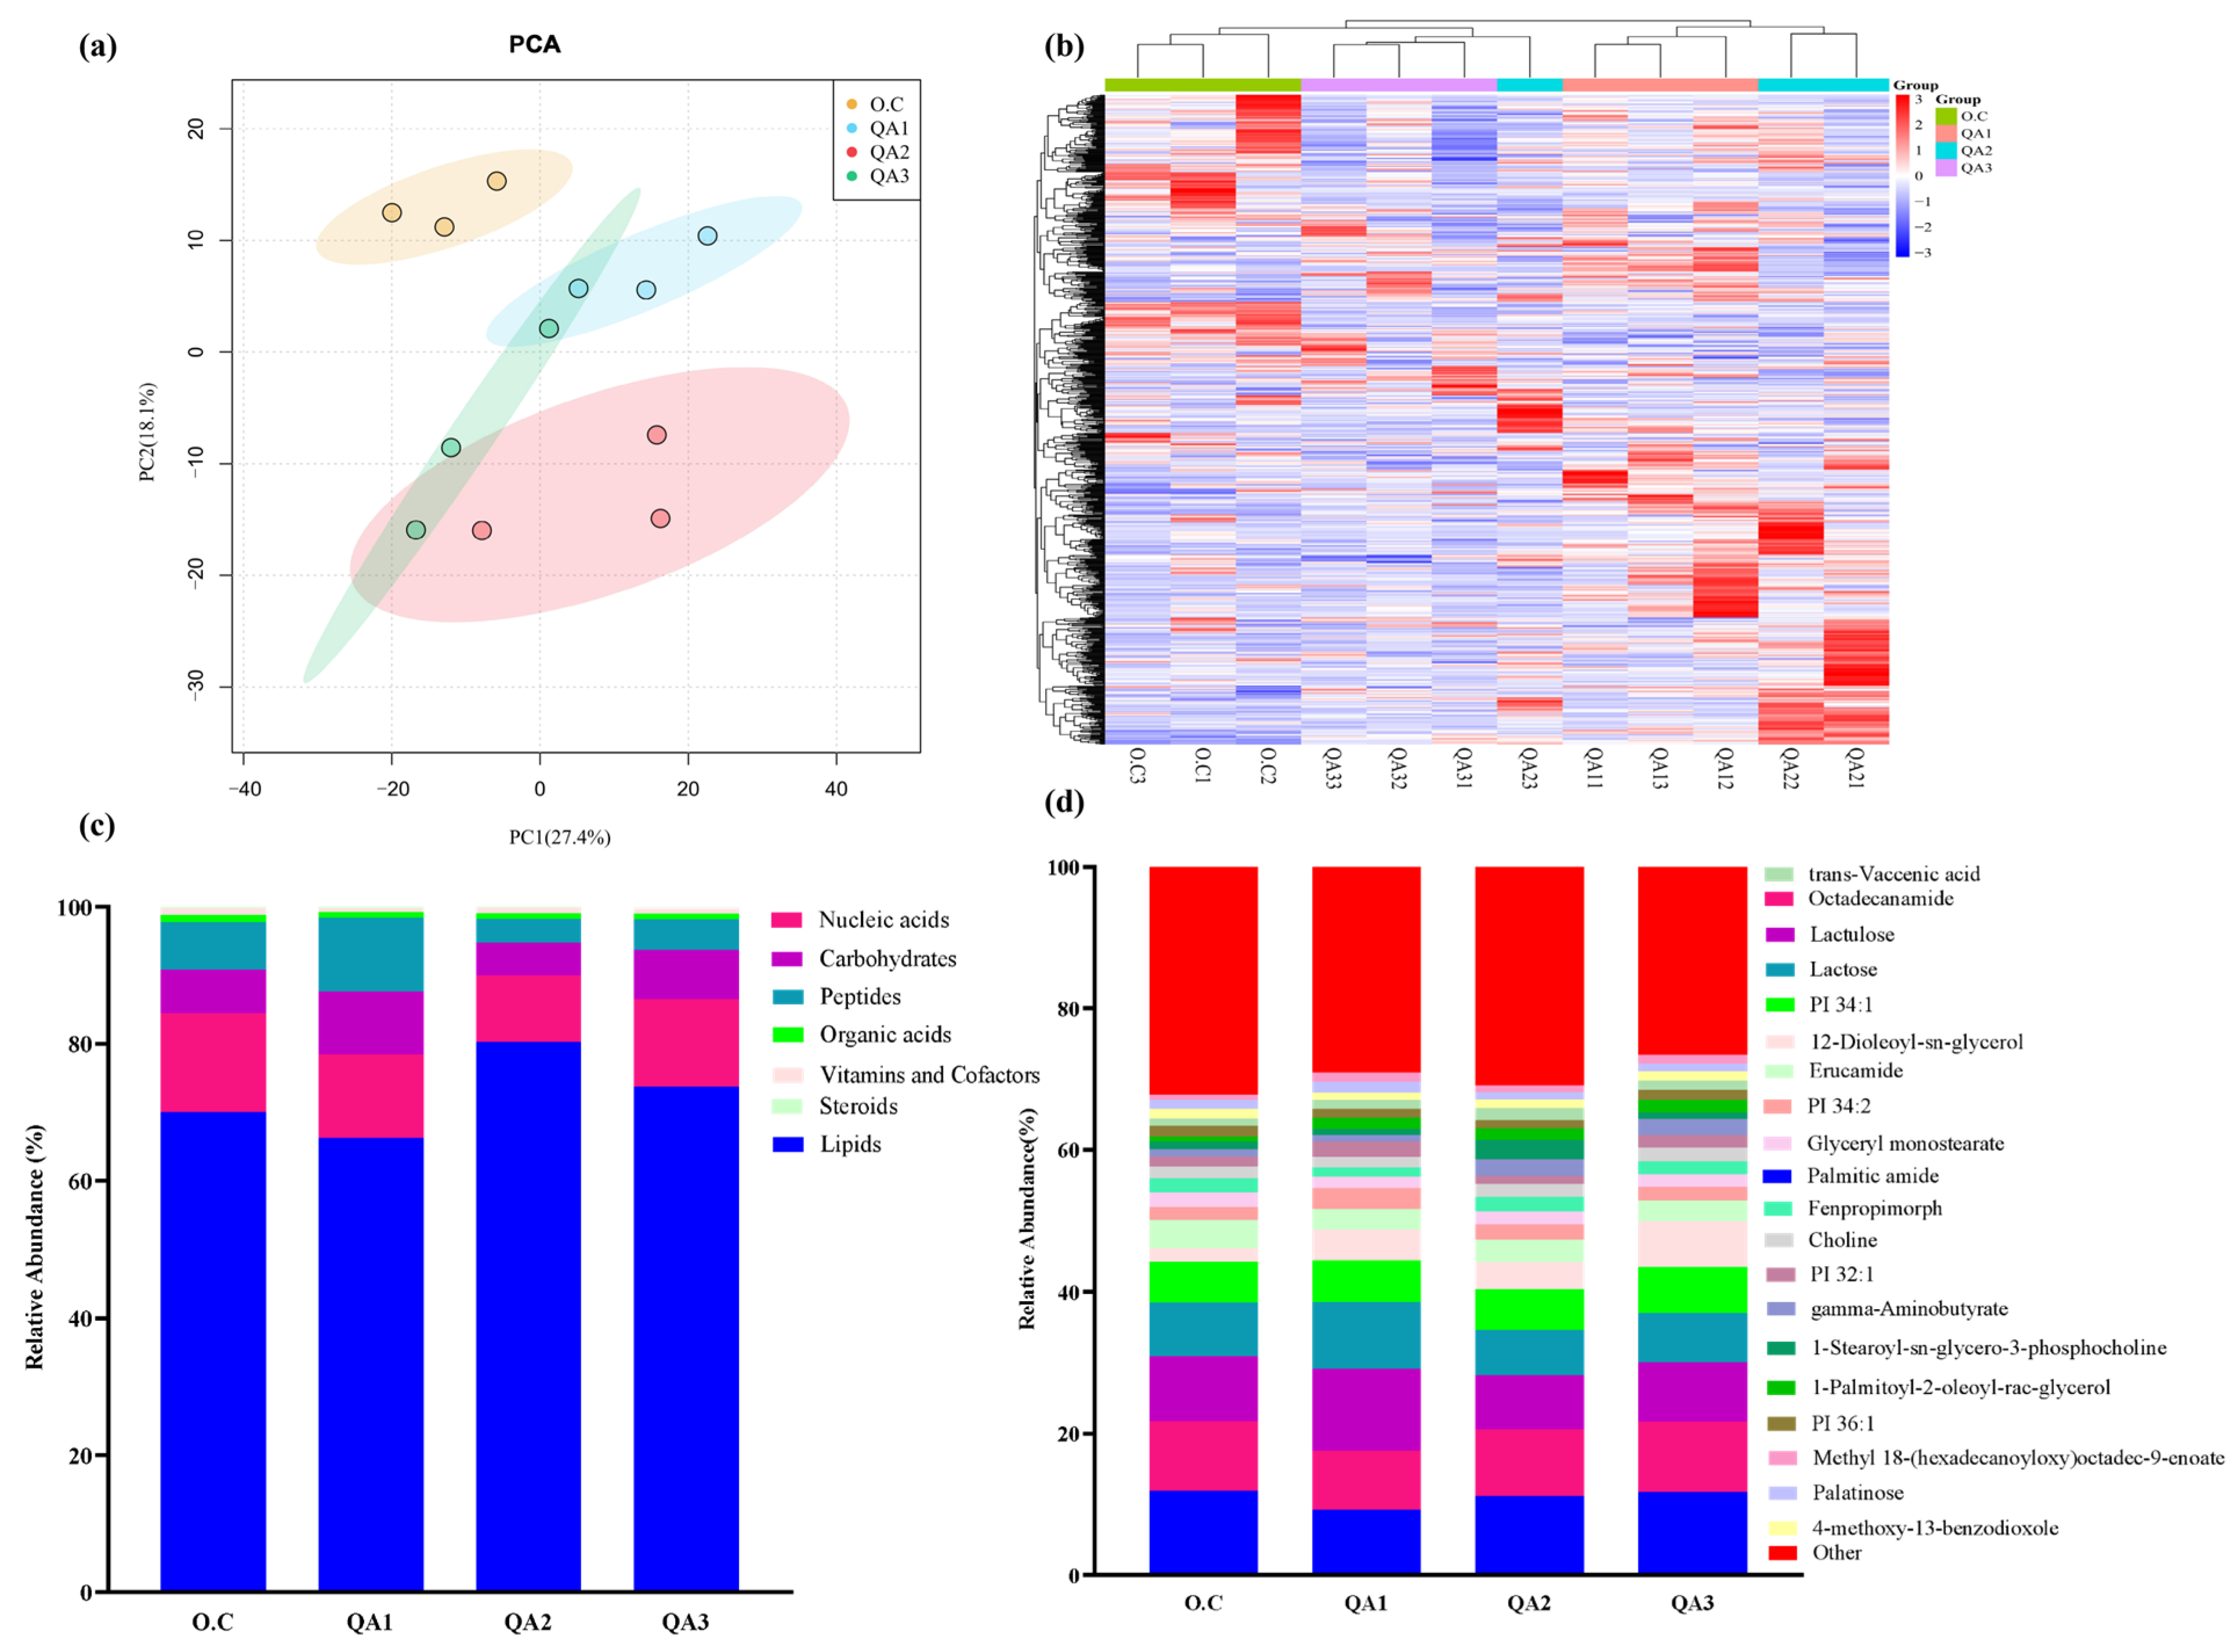
To comprehensively investigate metabolic differences associated with oil accumulation among macadamia cultivars, metabolomic analysis was performed on 12 mature kernel samples. PCA revealed that the first two principal components, PC1 and PC2, explained 27.4% and 18.1% of the total variance, respectively (Figure 6a). Hierarchical clustering analysis further revealed distinct metabolite accumulation patterns among O.C, QA1, QA2, and QA3 (Figure 6b).
Moreover, A total of 778 metabolites were detected across all samples. Of these, 49 metabolites were assigned to defined biological roles and categorized into seven major classes: lipids (14), peptides (14), nucleic acids (5), vitamins and cofactors (5), carbohydrates (4), organic acids (4), and steroids (2) (Figure 6c). The remaining 729 metabolites were classified as other substances. Ranking analysis of relative metabolite abundance showed that the top 20 most abundant metabolites included palmitic amide, octadecanamide, lactulose, and lactose, with all other metabolites grouped into the “Others” category (Figure 6d). Notably, lipid-class metabolites dominated the kernel metabolome, aligning with the high oil content characteristic of macadamia nuts.
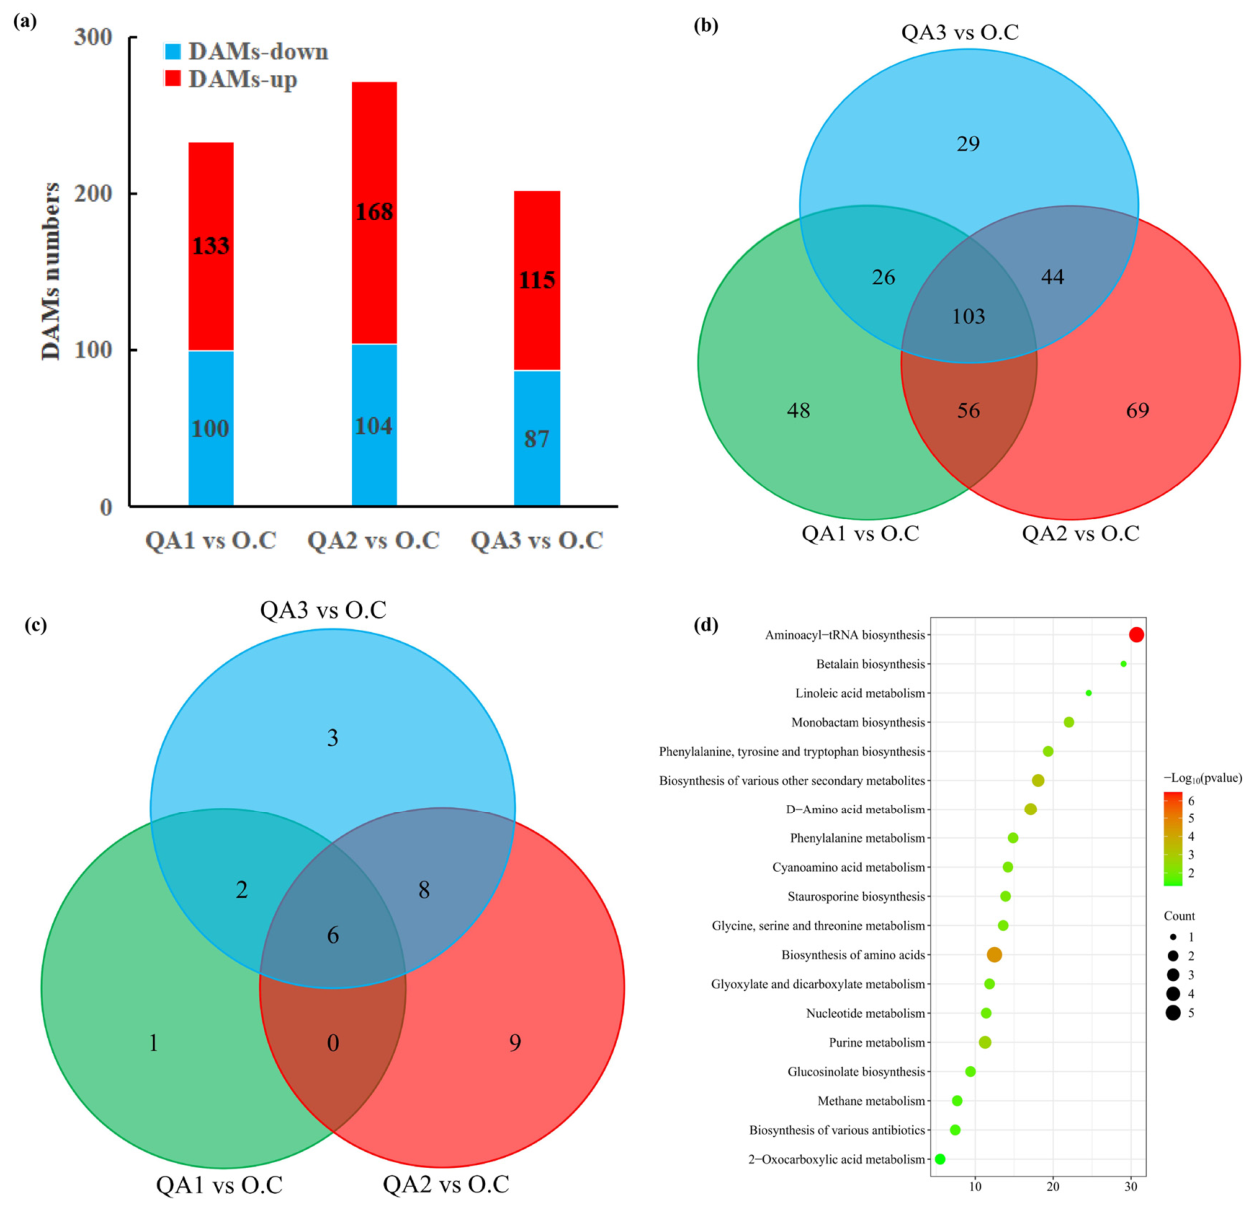
To characterize metabolite differences among cultivars, DAMs were identified between each cultivar comparison using the criteria of |log2(FoldChange)| > 1 and p < 0.05. A total of 233, 272, and 202 DAMs were identified in QA1 vs. O.C, QA2 vs. O.C, and QA3 vs. O.C, respectively. Among them, QA2 vs. O.C exhibited the highest number of DAMs (Figure 7a). Venn diagram analysis revealed that 103 DAMs were shared among the three comparison groups, whereas several metabolites were uniquely accumulated in each comparison (Figure 7b). To further investigate the biological functions of these DAMs, KEGG enrichment analysis was conducted. The numbers of significantly enriched pathways in QA1 vs. O.C, QA2 vs. O.C, and QA3 vs. O.C were 9, 23, and 19, respectively. Six pathways were commonly enriched among the three comparison groups (Figure 7c). Comprehensive KEGG enrichment analysis further identified 19 significantly enriched pathways among the differential metabolites (Figure 7d). Among them, Aminoacyl-tRNA biosynthesis, Betalain biosynthesis, Linoleic acid metabolism, Monobactam biosynthesis, Phenylalanine, tyrosine and tryptophan biosynthesis, Biosynthesis of various other secondary metabolites, D-Amino acid metabolism, and Phenylalanine metabolism exhibited relatively higher enrichment factors and metabolite numbers. Notably, the enrichment of Linoleic acid metabolism indicated that fatty acid metabolic pathways may play important roles in lipid accumulation and kernel quality formation in macadamia.

3.5. Integrated Transcriptomic and Metabolomic Analysis of Lipid Metabolism

To further characterize the molecular differences associated with oil accumulation among the four macadamia cultivars, we prioritized three pathways for detailed transcriptomic-metabolomic integration: Biosynthesis of amino acids, Glycerolipid metabolism, and Linoleic acid metabolism. These pathways were selected because they contained both pathway-associated DEGs and DAMs and, collectively, represented three complementary processes relevant to the traits investigated in this study: metabolic precursor-related processes, glycerolipid metabolism, and fatty acid modification, respectively. Their prioritization was also supported by the preceding GO and KEGG enrichment analyses. Other significantly enriched pathways, including Glycolysis/Gluconeogenesis, Carbon metabolism, Plant hormone signal transduction, Phenylpropanoid biosynthesis, and several amino acid-related pathways, may also contribute to kernel development and metabolic variation. However, they were not subjected to detailed pathway-level integration because their relationship to the specific focus on oil accumulation and fatty acid composition was comparatively broader or more indirect. These pathways should therefore not be regarded as biologically irrelevant, but rather as outside the primary scope of the present focused analysis.

3.5.1. Biosynthesis of Amino Acids Pathway

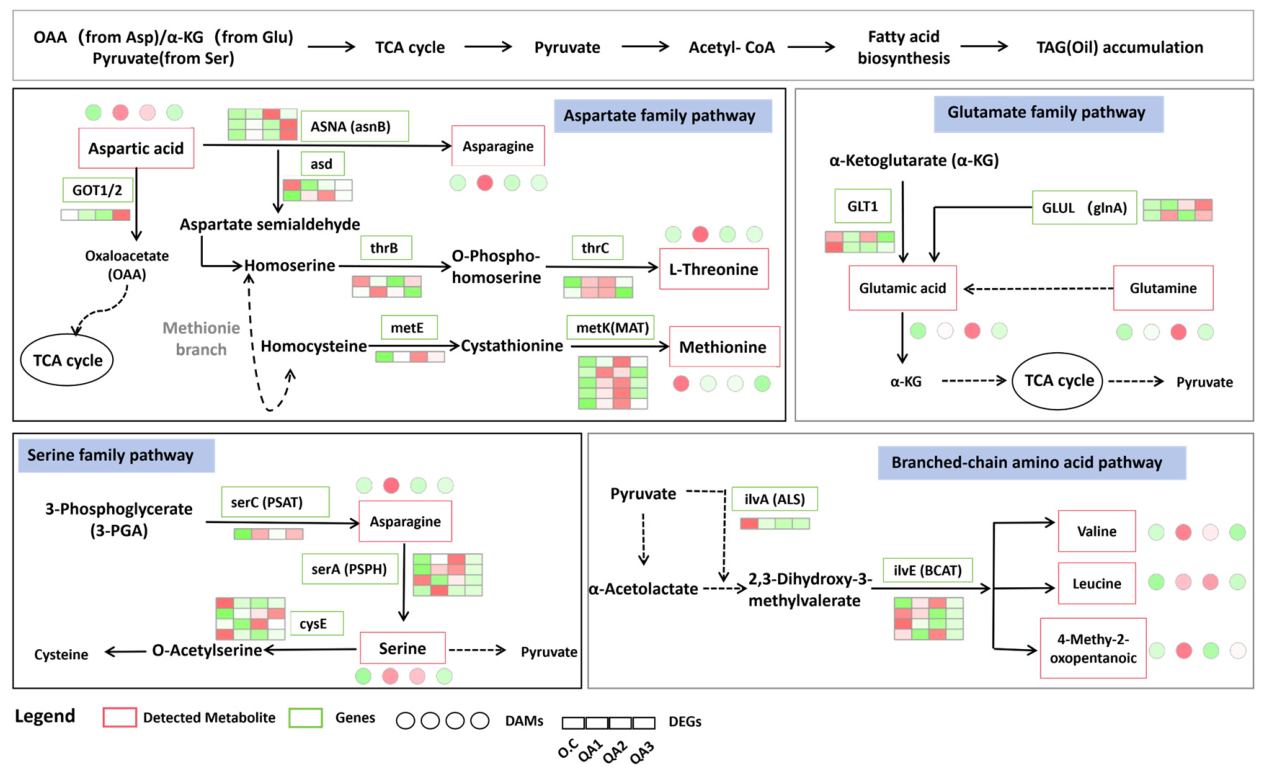
Integrated analysis of the Biosynthesis of amino acids pathway showed that DAMs were mainly distributed in the Aspartate family, Glutamate family, Serine family, and branched-chain amino acid (BCAA) biosynthetic modules (Figure 8). Multiple amino acids and their intermediate metabolites exhibited significant differences among the four macadamia cultivars, accompanied by coordinated changes in the expression of related structural genes.
In the Aspartate family pathway, Aspartic acid, Asparagine, L-threonine, and Methionine were identified as DAMs, together with differential expression of ASNS, metE, and metK/MAT, indicating distinct metabolic activities in Aspartate-derived branches among cultivars. In the Glutamate family pathway, Glutamic acid and Glutamine accumulated differentially and were associated with altered expression of GLT1 and GLUL. Within the Serine family branch, differential accumulation of Serine was accompanied by expression changes in serA (PGDH), PSAT, and cysE. In addition, the BCAA biosynthetic module showed significant changes in Valine and 4-methyl-2-oxopentanoic acid, together with differential expression of ilvB and ilvE.
Overall, the coordinated alterations of DAMs and DEGs within the amino acid biosynthetic pathway suggest extensive metabolic reprogramming during macadamia kernel development. Given that these amino acid pathways are closely linked to central carbon metabolism, they may contribute to oil accumulation by providing precursors and metabolic substrates required for fatty acid and triacylglycerol (TAG) biosynthesis.

3.5.2. Glycerolipid Metabolism Pathway

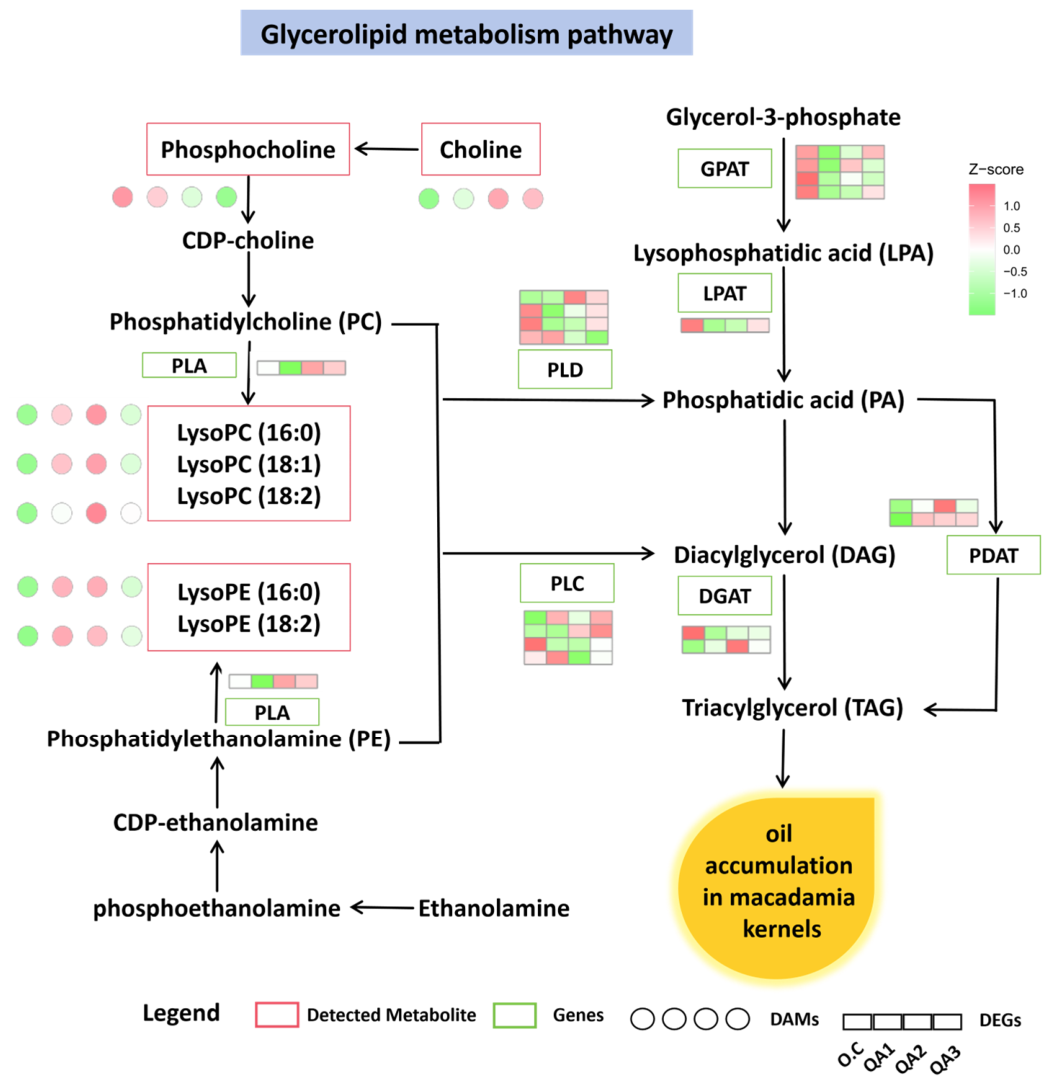
Integrated analysis of the Glycerolipid metabolism pathway identified cultivar-dependent differences in the abundance of several metabolites and in the expression of genes annotated to glycerolipid- and phospholipid-related processes (Figure 9). The identified DAMs included Choline, Phosphocholine, LysoPC (16:0), LysoPC (18:1), LysoPC (18:2), LysoPE (16:0), and LysoPE (18:2). These metabolites exhibited distinct accumulation patterns among the four macadamia cultivars, indicating cultivar-dependent differences in the abundance of phospholipid-related metabolites.
Several genes involved in TAG biosynthesis including GPAT, LPAT, PAP, DGAT, and PDAT, exhibited differential expression among the cultivars. In addition, PLA, PLC, and PLD, which are annotated to phospholipid-related processes, also showed distinct expression patterns. LysoPC and LysoPE species containing unsaturated fatty acids, particularly LysoPC (18:1), LysoPC (18:2), and LysoPE (18:2), differed significantly in abundance among cultivars. Taken together, these results demonstrate cultivar-dependent variation in the expression of glycerolipid-related genes and the accumulation of phospholipid-related metabolites.
Overall, the integrated analysis of the Glycerolipid metabolism pathway revealed coordinated cultivar-dependent differences in the expression of glycerolipid-related genes and the abundance of associated metabolites, including several lysophospholipid species.

3.5.3. Linoleic Acid Metabolism Pathway

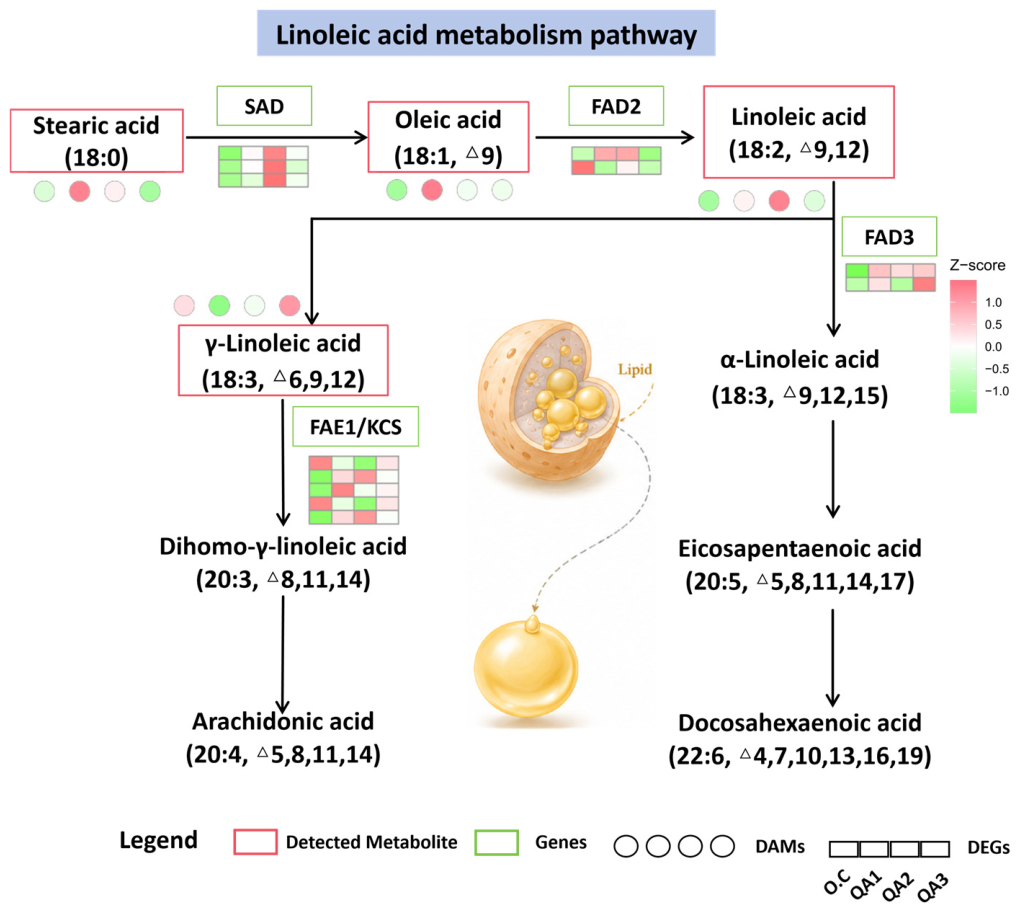
Integrated analysis of the linoleic acid metabolism pathway revealed distinct alterations in unsaturated fatty acid metabolism among the four macadamia cultivars (Figure 10). Several DAMs, including stearic acid (18:0), oleic acid (18:1), linoleic acid (18:2), and γ-linolenic acid (18:3), were identified in this pathway, indicating substantial variation in fatty acid desaturation profiles among the cultivars.
Consistent with the metabolite changes, multiple genes involved in fatty acid desaturation and elongation exhibited differential expression. The expression levels of stearoyl-acyl carrier protein desaturase (SAD), which is associated with the conversion of stearic acid to oleic acid, and fatty acid desaturase 2 (FAD2), involved in the formation of linoleic acid, varied markedly among the cultivars. In addition, fatty acid desaturase 3 (FAD3), related to the further desaturation of linoleic acid, also displayed distinct expression patterns. Notably, FAE1/KCS, a key gene associated with very-long-chain fatty acid elongation, was identified as a differentially expressed gene, suggesting potential differences in fatty acid elongation processes among the cultivars. Furthermore, the accumulation patterns of stearic acid, oleic acid, linoleic acid, and γ-linolenic acid generally corresponded with the expression profiles of the associated desaturase/elongase-related genes. These coordinated changes indicate that transcriptional regulation may contribute to the cultivar-specific differences in fatty acid composition observed in macadamia kernels.
Overall, the integrated analysis of the linoleic acid metabolism pathway revealed coordinated differences in metabolic and transcriptional patterns among mature kernels from different macadamia cultivars, which corresponded with variation in fatty acid composition among different macadamia cultivars.

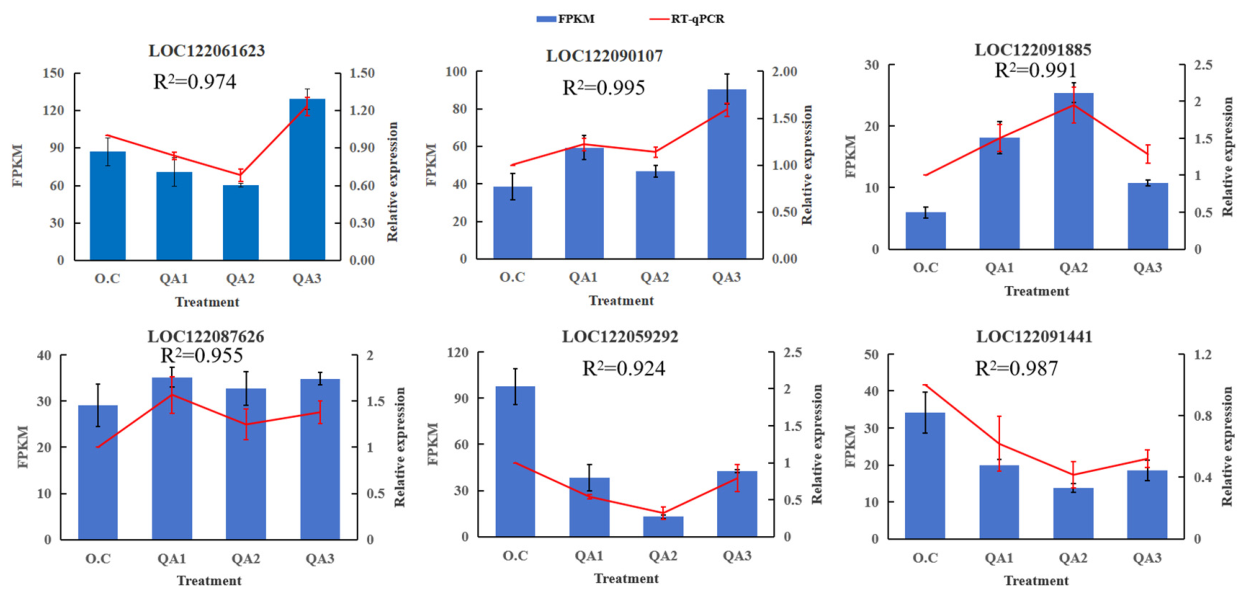
3.6. RT-qPCR Validation of Selected DEGs

Based on the previous pathway analysis, six genes were selected for RT-qPCR validation, and the primers used are listed in Table S1. The expression patterns obtained by RT-qPCR were generally consistent with those derived from the RNA-seq data for the six selected genes (Figure 11), with R2 values ranging from 0.924 to 0.995. Specifically, LOC122061623 showed relatively high expression in QA3, with both RNA-seq and RT-qPCR showing a decrease followed by an increase across the four cultivars. LOC122090107 showed a gradual increase in expression from O.C to QA3, whereas LOC122091885 exhibited its highest expression in QA2 followed by a decrease in QA3. LOC122087626 showed relatively high expression in QA1 and QA3, LOC122059292 showed its lowest expression in QA2, and LOC122091441 exhibited the highest expression in O.C followed by a gradual decrease in the other cultivars. Overall, the agreement between RT-qPCR and RNA-seq results supports the consistency of the expression patterns for these six selected genes.

4. Discussion

4.1. Differences in Fruit Traits and Oil Accumulation Among Macadamia Cultivars

Kernel oil content and fatty acid composition are major determinants of macadamia nutritional and commercial quality. Previous studies have documented substantial cultivar-dependent variation in nut size, kernel quality, oil content, and fatty acid composition [23,24,25,26]. Our results are consistent with these findings and demonstrate pronounced phenotypic and nutritional differences among macadamia cultivars. However, an important observation in the present study was that larger fruit size did not necessarily correspond to higher kernel oil concentration. QA1 and QA3 had greater fruit weight and transverse diameter, whereas O.C exhibited the highest crude fat content. This distinction is biologically plausible because whole-fruit size reflects the combined growth of structural and storage tissues, whereas crude fat content represents the proportion of lipid accumulated in kernel dry matter. Thus, fruit size and kernel oil concentration should be considered partially distinct quality traits rather than interchangeable indicators of oil accumulation. Similar decoupling between fruit or seed size and oil concentration has also been reported in other woody oil crops, including Camellia oleifera and walnut [27,28].
The differences in crude fat, protein, soluble sugar, and total amino acid contents further suggest that storage-reserve allocation varies among macadamia cultivars. For example, QA1 combined relatively low crude fat with high protein content, whereas O.C showed high crude fat and soluble sugar contents. In contrast, QA3 exhibited relatively high levels of both crude fat and total amino acids. These contrasting patterns indicate that the observed nutritional differences cannot be explained by a simple reciprocal trade-off between lipid and other storage compounds. Instead, they may reflect cultivar-specific differences in carbon and nitrogen allocation, precursor availability, and the metabolic capacity for storage-compound accumulation. Previous studies of woody oilseeds and macadamia have similarly reported genotype-dependent differences in carbon-nitrogen metabolism and primary metabolite accumulation, supporting the view that kernel composition is determined by coordinated metabolic allocation rather than by a single storage pathway [29,30].
Taken together, the significant differences observed in fruit traits, crude fat content, crude protein, soluble sugar and amino acid content among the four macadamia cultivars reflect distinct oil accumulation capacities and quality formation mechanisms. Because phenotypic variation ultimately arises from differences in metabolic activity and gene regulation, integrated transcriptomic and metabolomic analyses were subsequently performed to elucidate the key metabolic pathways and candidate genes associated with oil accumulation in macadamia kernels. These findings provide a foundation for understanding the molecular basis of high-oil traits and for the future molecular breeding of elite macadamia cultivars.

4.2. Amino Acid Metabolism Is Associated with Variation in Oil Accumulation

Previous studies have shown that amino acid metabolism is closely connected with carbon and nitrogen balance during seed development [31,32,33]. In the present study, integrated transcriptomic and metabolomic analyses revealed cultivar-dependent differences in amino acid metabolites and related gene expression patterns in macadamia kernels. In this study, the Biosynthesis of amino acids pathway showed significant differences in metabolite accumulation and gene expression patterns among cultivars with different oil contents. Differentially accumulated metabolites were mainly distributed in the aspartate family, glutamate family, and branched-chain amino acid pathways, accompanied by changes in the expression of related genes, including ASNS, GLUL, GLT1, MAT, ilvB, and ilvE. Extant literature posits that the metabolic pathways of aspartate, glutamate, and BCAAs are intricately interwoven with TCA cycle, sustaining fatty acid biosynthesis through the provision of carbon skeletons, acetyl-CoA precursors, and reducing equivalents [33,34,35]. These cultivar-dependent variations suggest that amino acid metabolism may be associated with differences in carbon and nitrogen metabolism during kernel development. Together, these findings indicate that amino acid metabolism represents one of the metabolic processes associated with variation in kernel oil accumulation among macadamia cultivars.

4.3. Glycerolipid- and Phospholipid-Related Changes Associated with Kernel Crude Fat Content

Integrated analysis of the Glycerolipid metabolism pathway revealed cultivar-dependent differences in genes and metabolites related to membrane lipid metabolism and TAG biosynthesis. Previous studies have demonstrated that seed oil accumulation involves multiple lipid metabolic processes, including fatty acid synthesis, TAG assembly, and membrane lipid metabolism [4]. LysoPC (16:0, 18:1, and 18:2) and LysoPE (16:0 and 18:2) containing different fatty acid chains showed differential accumulation patterns among cultivars, suggesting differences in phospholipid metabolic processes [36,37]. These metabolite variations were accompanied by changes in the expression of phospholipid metabolism-related genes, including PLA, PLC, and PLD. However, whether these changes directly contribute to TAG synthesis requires further functional validation.
Concurrently, key genes involved in TAG biosynthesis, including GPAT, LPAT, PAP, DGAT, and PDAT, exhibited differential expression among cultivars, suggesting differences in TAG biosynthesis-related transcriptional patterns. In particular, DGAT and PDAT showed cultivar-dependent expression patterns, suggesting that they may represent candidate genes associated with variation in crude fat content.

4.4. Unsaturated Fatty Acid Metabolism Shapes Fatty Acid Composition and Oil Quality in Macadamia Kernels

Fatty acid composition is a key determinant of the nutritional value and physicochemical properties of vegetable oils, and the proportion of unsaturated fatty acids directly influences oil stability, flavor, and health-related functional attributes [38]. Previous studies have demonstrated that fatty acid desaturation and elongation during seed development are tightly regulated at the transcriptional level, thereby shaping the relative proportions of monounsaturated and polyunsaturated fatty acids and ultimately determining oil quality [4,13,39,40]. In the present study, we detected significant differential accumulation of key fatty acids, including stearic acid (18:0), oleic acid (18:1), linoleic acid (18:2), and γ-linolenic acid (18:3), indicating pronounced variation in the degree of fatty acid desaturation among cultivars.
In plant fatty acid biosynthesis, SAD and FAD2 are key enzymes involved in fatty acid desaturation and are important for determining the relative proportions of monounsaturated and polyunsaturated fatty acids. SAD catalyzes the conversion of saturated stearic acid (18:0) to monounsaturated oleic acid (18:1), whereas the plastidial/desaturation-associated FAD2 further converts oleic acid into linoleic acid (18:2) [40,41,42]. In this study, both SAD and FAD2 exhibited significant cultivar-dependent differences in gene expression, and their expression levels showed a strong correspondence with the accumulation patterns of 18:0, 18:1, and 18:2 in kernels. This coordinated relationship suggests that transcriptional variation of key desaturase genes may contribute to cultivar-specific differences in fatty acid composition in macadamia. In particular, the observed expression patterns suggest that variation in SAD and FAD2 expression may be associated with differences in oleic acid and linoleic acid abundance among cultivars.
In addition, we observed differential expression of FAD3 (involved in the further desaturation of 18:2 to γ-linolenic acid and other highly unsaturated fatty acids) and FAE1/KCS (responsible for very-long-chain fatty acid elongation), accompanied by corresponding fluctuations in related metabolites. Fatty acid chain elongation and desaturation represent interconnected processes that can influence fatty acid profiles. The cultivar-dependent transcriptional variation of FAE1/KCS suggests that different cultivars employ distinct metabolic strategies to balance carbon allocation between chain length extension (e.g., C16/C18 to longer-chain fatty acids) and unsaturation levels, thereby shaping their unique fatty acid profiles [43,44,45].
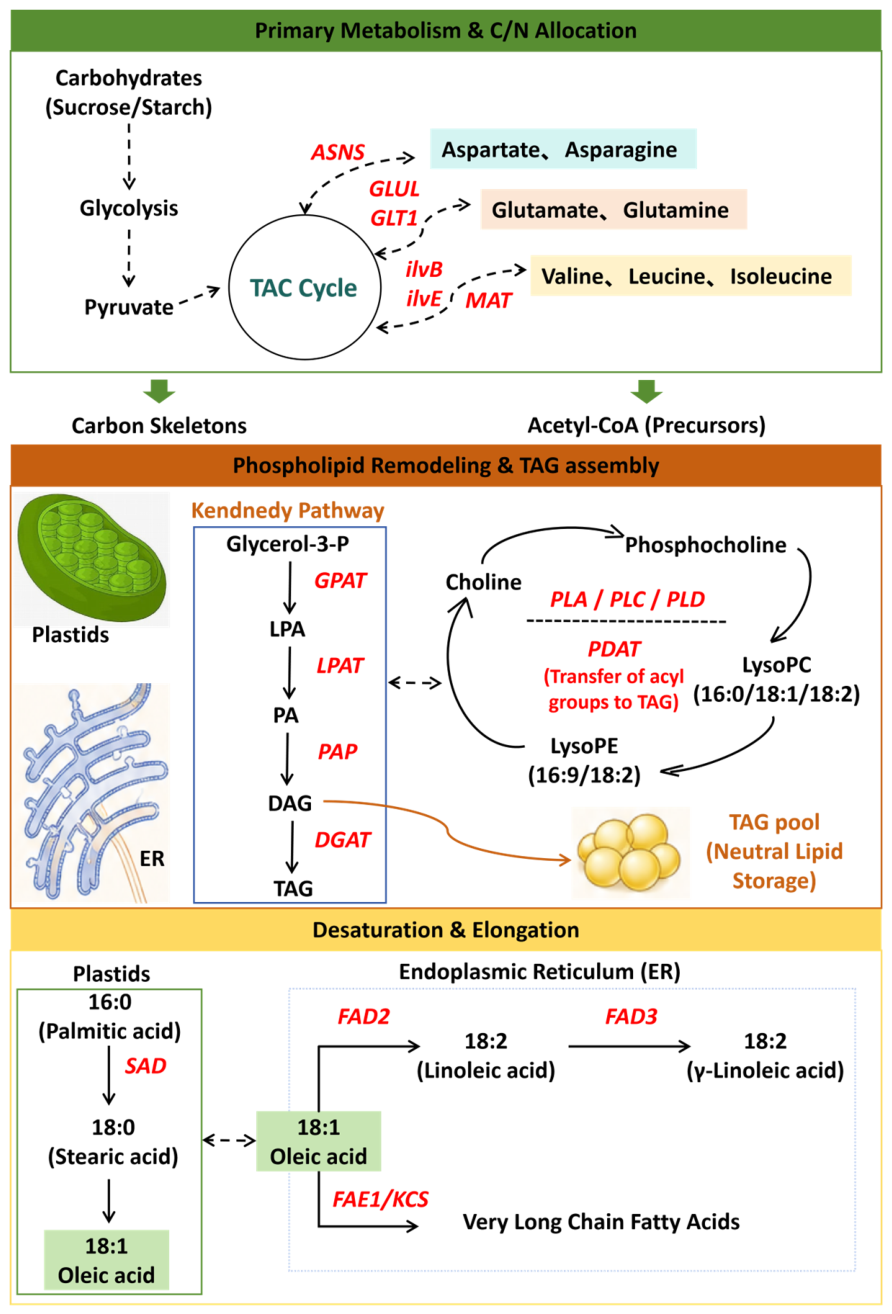
Based on the integrated transcriptomic and metabolomic results, we propose a working model summarizing the metabolic processes and gene–metabolite associations identified in this study (Figure 12). First, cultivar-dependent changes were observed in amino acid metabolism, including the Aspartate, Glutamate, and branched-chain amino acid pathways, together with differential expression of ASNS, GLUL, GLT1, MAT, ilvB, and ilvE. These coordinated changes indicate variation in amino acid-related metabolism among cultivars and may be associated with differences in metabolic precursor availability. Second, differential expression of genes involved in glycerolipid metabolism, including GPAT, LPAT, PAP, DGAT, and PDAT, was observed together with differences in phospholipid-related metabolites, including LysoPC and LysoPE. These findings support an association between glycerolipid-related transcriptional and metabolic variation and cultivar-dependent differences in crude fat content. However, phospholipid remodeling, TAG assembly rates, lipid turnover, and acyl-group fluxes were not directly measured in this study. Therefore, the biochemical relationships illustrated in Figure 12 should be interpreted as hypothetical pathways inferred from established metabolic knowledge rather than experimentally demonstrated metabolic fluxes. Third, differential expression of SAD, FAD2, FAD3, and FAE1/KCS was observed together with cultivar-dependent differences in several fatty acid-related metabolites, including stearic acid (18:0), oleic acid (18:1), linoleic acid (18:2), and γ-linolenic acid (18:3). These results indicate associations between fatty acid metabolism-related gene expression and metabolite variation among cultivars. Collectively, these findings provide a framework for generating hypotheses regarding the metabolic processes associated with cultivar-dependent variation in kernel crude fat content and fatty acid-related metabolites.

4.5. Study Limitations

Several limitations should be considered when interpreting the findings of this study. First, the present study compared four macadamia cultivars sampled at a single mature stage and from one experimental site. Therefore, the observed cultivar-associated differences cannot fully resolve developmental changes in oil accumulation or distinguish genetic effects from potential environmental influences. Validation across additional developmental stages, growing seasons, environments, and a broader range of cultivar would be valuable for evaluating the generalizability of these findings.
Second, the transcriptomic and metabolomic analyses performed in this study primarily identify associations among gene expression, metabolite abundance, and oil-related traits and do not establish causal regulatory relationships. Although RT-qPCR supported the expression patterns of six selected genes, their biological functions were not directly validated. Therefore, the biological roles of the identified putative candidate genes in kernel oil accumulation remain to be established through functional studies, such as gene overexpression, gene silencing or knockout, and enzyme-activity assays. In addition, metabolic fluxes, carbon-nitrogen allocation, phospholipid remodeling, acyl flux, and the activities of relevant enzymes were not directly measured. Therefore, the proposed relationships among primary metabolism, glycerolipid-associated processes, fatty acid metabolism, and kernel oil accumulation should be regarded as hypotheses based on the observed multi-omic associations and previous biological knowledge. Future studies incorporating developmental time-course sampling, functional characterization of candidate genes, enzyme-activity assays, and isotope-based metabolic flux analyses will be required to test these proposed relationships and further clarify the molecular basis of oil accumulation in macadamia kernels.

5. Conclusions

This study integrated nutritional, transcriptomic, and metabolomic analyses to characterize cultivar-dependent molecular and metabolic variation in four macadamia cultivars. O.C exhibited the highest crude fat content among the evaluated cultivars, while substantial differences in gene expression and metabolite abundance were observed across the three pairwise comparisons. Integrated analysis identified Biosynthesis of amino acids, Glycerolipid metabolism, and Linoleic acid metabolism as pathways showing coordinated gene expression and metabolite variation among cultivars. Differential expression of genes related to amino acid metabolism, glycerolipid metabolism, and fatty acid desaturation and elongation was accompanied by differences in corresponding metabolites, including LysoPC, LysoPE, stearic acid, oleic acid, linoleic acid, and γ-linolenic acid. These findings identify candidate genes, metabolites, and metabolic pathways associated with cultivar-dependent variation in crude fat content and fatty acid-related metabolites. However, the present study does not directly establish metabolic fluxes, lipid turnover, or causal functions of the identified genes. Further functional, enzymatic, developmental, and multi-environment studies are therefore required to validate these associations and clarify their roles in macadamia kernel oil-related traits.

Supplementary Materials

The following supporting information can be downloaded at: https://www.mdpi.com/article/10.3390/horticulturae12091082/s1, Table S1: Primers selected for real-time quantitative polymerase chain reaction (RT-qPCR).

Author Contributions

All authors contributed to the study’s conception. Material preparation was performed by G.G., F.H. and Q.Z. G.G., Z.K. and Q.Z. wrote the draft. L.T., W.W., Y.N. and X.T. conceived and designed the experiment, provided financial support, and reviewed the manuscript. All authors have read and agreed to the published version of the manuscript.

Funding

This research was financially supported by the Key Scientific Research Project of the Guizhou Provincial Forestry Bureau, titled “Integration and Demonstration of Key Technologies for Quality Improvement and Efficiency Enhancement of Key Characteristic Economic Forests in Guizhou” (Grant number: Qianlinkehe [2026] zhongdian 008); Study on the Coordinated Regulatory Mechanisms of Oil Synthesis and Fruit Development in Macadamia (Qian Kehe Basic QN [2025]224); Chinese Academy of Tropical Agricultural Sciences for Science and Technology Innovation Team of National Tropical Agricultural Science Center (NO.CATASCXTD202512); Forestry Science and Technology Innovation Platform Operation Subsidy Funds (2020132540); Ministry of Agriculture Opening Project Fund of Key Laboratory of Tropical Fruit Biology, Ministry of Agriculture & Rural Affairs; Yunnan Province Twelfth Batch Technological Innovation Talent Cultivation Candidate Project (202305AD160033); Yunnan Special Fund for Scientific and Technological Innovation of Tropical Crops (RF2025).

Data Availability Statement

The original contributions presented in this study are included in the article. Further inquiries can be directed to the corresponding authors.

Conflicts of Interest

The authors declare no conflict of interest.

References

  1. Ros, E.; Mataix, J. Fatty acid composition of nuts—Implications for cardiovascular health. Br. J. Nutr. 2006, 96, S29–S35. [Google Scholar] [CrossRef] [Scilit]
  2. Gama, T.; Wallace, H.M.; Trueman, S.J.; Bai, S.H. Quality and shelf life of tree nuts: A review. Sci. Hortic. 2018, 242, 116–126. [Google Scholar] [CrossRef] [Scilit]
  3. Chapman, K.D.; Ohlrogge, J.B. Compartmentation of triacylglycerol accumulation in plants. J. Biol. Chem. 2012, 287, 2288–2294. [Google Scholar] [CrossRef] [Scilit]
  4. Bates, P.D.; Stymne, S.; Ohlrogge, J. Biochemical pathways in seed oil synthesis. Curr. Opin. Plant Biol. 2013, 16, 358–364. [Google Scholar] [CrossRef] [Scilit]
  5. Hardner, C.M.; Peace, C.; Lowe, A.J.; Neal, J.; Pisanu, P.; Powell, M.; Schmidt, A.; Spain, C. Genetic resources and domestication of macadamia. Hortic. Rev. 2009, 35, 1–125. [Google Scholar] [CrossRef] [Scilit]
  6. Nock, C.J.; Hardner, C.M.; Alam, M. Macadamia (Macadamia spp.) breeding and domestication. Plant Breed. Rev. 2019, 43, 1–30. [Google Scholar] [CrossRef] [Scilit]
  7. Griel, A.E.; Cao, Y.; Bagshaw, D.D.; Cifelli, A.M.; Kris-Etherton, P.M. A macadamia nut-rich diet reduces total and LDL-cholesterol in mildly hypercholesterolemic men and women. J. Nutr. 2008, 138, 761–767. [Google Scholar] [CrossRef] [Scilit]
  8. Lai, C.Y.; Cheng, S.B.; Lee, T.Y.; Hsiao, Y.F.; Liu, H.T.; Huang, Y.C. Impact of Glutathione and Vitamin B-6 in Cirrhosis Patients: A Randomized Controlled Trial and Follow-Up Study. Nutrients 2020, 12, 1978. [Google Scholar] [CrossRef] [Scilit]
  9. Walton, D.A.; Randall, B.W.; Poienou, M.; Moxon, J.; Wallace, H.M. Maturity indices of Canarium indicum (Burseraceae) nuts. Acta Hortic. 2016, 1109, 17–22DOI. [Google Scholar] [CrossRef] [Scilit]
  10. Peršurić Palčić, A.; Jeromel, A.; Pecina, M.; Palčić, I.; Gluhić, D.; Petek, M.; Herak Ćustić, M. Decreased Leaf Potassium Content Affects the Chemical Composition of Must for Sparkling Wine Production. Horticulturae 2022, 8, 512. [Google Scholar] [CrossRef] [Scilit]
  11. O’Hare, P.; Stephenson, R.; Vock, N. HortScience review of macadamia cultivar performance and breeding limitations. Aust. J. Exp. Agric. 2004, 44, 519–528. [Google Scholar] [CrossRef] [Scilit]
  12. Migicovsky, Z.; Myles, S. Exploiting Wild Relatives for Genomics-assisted Breeding of Perennial Crops. Front. Plant Sci. 2017, 8, 460. [Google Scholar] [CrossRef] [Scilit]
  13. Kong, Q.; Ma, W. Transcriptional regulation of oil biosynthesis in seed plants: Current understanding, applications, and perspectives. Plant Commun. 2022, 3, 100328. [Google Scholar] [CrossRef] [Scilit]
  14. Xu, W.; Dubos, C.; Lepiniec, L. Transcriptional control of flavonoid biosynthesis by MYB–bHLH–WDR complexes. Trends Plant Sci. 2015, 20, 176–185. [Google Scholar] [CrossRef] [Scilit] [PubMed]
  15. Fernie, A.R.; Schauer, N. Metabolomics-assisted breeding: A viable option for crop improvement? Trends Genet. 2009, 25, 39–48. [Google Scholar] [CrossRef] [Scilit] [PubMed]
  16. Weckwerth, W. Green systems biology—From single genomes, proteomes and metabolomes to ecosystems research and biotechnology. J. Proteom. 2011, 75, 284–305. [Google Scholar] [CrossRef] [Scilit]
  17. Hasin, Y.; Seldin, M.; Lusis, A. Multi-omics approaches to disease. Genome Biol. 2017, 18, 83. [Google Scholar] [CrossRef] [Scilit] [PubMed]
  18. Tohge, T.; Fernie, A.R. Co-expression and co-responses: Within and beyond transcription. Front. Plant Sci. 2012, 3, 248. [Google Scholar] [CrossRef] [Scilit]
  19. Cavill, R.; Jennen, D.; Kleinjans, J.; Briedé, J.J. Transcriptomic and metabolomic data integration. Brief. Bioinform. 2016, 17, 891–901. [Google Scholar] [CrossRef] [Scilit]
  20. Carreno-Quintero, N.; Acharjee, A.; Maliepaard, C.; Bachem, C.W.; Mumm, R.; Bouwmeester, H.; Visser, R.G.; Keurentjes, J.J. Untargeted metabolic quantitative trait loci analyses reveal a relationship between primary metabolism and potato tuber quality. Plant Physiol. 2013, 158, 1306–1318. [Google Scholar] [CrossRef] [Scilit]
  21. Alseekh, S.; Fernie, A.R. Metabolomics 20 years on: What have we learned and what hurdles remain? Plant J. 2018, 94, 933–942. [Google Scholar] [CrossRef] [Scilit]
  22. Cherian, S.; Figueroa, C.R.; Nair, H. ‘Movers and shakers’ in the regulation of fruit ripening: A cross-dissection of climacteric versus non-climacteric fruit. J. Exp. Bot. 2014, 65, 4705–4722. [Google Scholar] [CrossRef] [Scilit]
  23. Aquino-Bolaños, E.N.; Mapel-Velazco, L.; Martín-del-Campo, S.T.; Chávez-Servia, J.L.; Martínez, A.J.; Verdalet-Guzmán, I. Fatty acids profile of oil from nine varieties of Macadamia nut. Int. J. Food Prop. 2017, 20, 1262–1269. [Google Scholar] [CrossRef] [Scilit]
  24. O’Hare, T.J.; Trieu, H.H.; Topp, B.; Russell, D.; Pun, S.; Torrisi, C.; Liu, D. Assessing Fatty Acid Profiles of Macadamia Nuts. HortScience 2019, 54, 633–637. [Google Scholar] [CrossRef] [Scilit]
  25. Richards, T.E.; Kämper, W.; Trueman, S.J.; Wallace, H.M.; Ogbourne, S.M.; Brooks, P.R.; Nichols, J.; Hosseini Bai, S. Relationships between nut size, kernel quality, nutritional composition and levels of outcrossing in three macadamia cultivars. Plants 2020, 9, 228. [Google Scholar]
  26. Shuai, X.; Dai, T.; Chen, M.; Liang, R.; Du, L.; Chen, J.; Liu, C. Comparative study of chemical compositions and antioxidant capacities of oils obtained from 15 macadamia (Macadamia integrifolia) cultivars in China. Foods 2021, 10, 1031. [Google Scholar] [CrossRef] [Scilit]
  27. Yang, L.; Gao, C.; Xie, J.; Qiu, J.; Deng, Q.; Zhou, Y.; Liao, D.; Deng, C. Fruit economic characteristics and yields of 40 superior Camellia oleifera Abel plants in the low-hot valley area of Guizhou Province, China. Sci. Rep. 2022, 12, 7068. [Google Scholar]
  28. Sarikhani Khorami, S.; Vahdati, K. Determination of Persian walnut yield components and its correlation with phenological, morphological and biochemical traits. Iran. J. Hortic. Sci. 2019, 50, 549–560. [Google Scholar] [CrossRef] [Scilit]
  29. Zhang, C.; Liu, H.; Zhang, H.; Dang, W.; Zhou, C.; Zhang, M. Comparative de novo Transcriptome Analysis of Two Cultivars With Contrasting Content of Oil and Fatty Acids During Kernel Development in Torreya grandis. Front. Plant Sci. 2022, 13, 909759. [Google Scholar] [CrossRef] [Scilit]
  30. Suo, J.; Li, Y.; Ma, S.; Yang, M.; Zhang, L.; Jiang, B.; Zheng, S.; Li, Q.; Chen, W.; Yan, J.; et al. TgZFP9–TgSBP3 and TgDOF5.4–TgPDH regulatory networks drive photosynthate allocation to oil in Torreya grandis kernels. J. Agric. Food Chem. 2026, 74, 15644–15658. [Google Scholar] [CrossRef] [Scilit]
  31. Fait, A.; Angelovici, R.; Less, H.; Ohad, I.; Urbanczyk-Wochniak, E.; Fernie, A.R.; Galili, G. Arabidopsis seed development and germination is associated with temporally distinct metabolic switches. Plant Physiol. 2006, 142, 839–854. [Google Scholar] [CrossRef] [Scilit]
  32. Allen, D.K.; Young, J.D. Carbon and nitrogen provisions alter the metabolic flux in developing soybean embryos. Plant Physiol. 2013, 161, 1458–1475. [Google Scholar] [CrossRef] [Scilit]
  33. Mukherjee, T.; Kambhampati, S.; Morley, S.A.; Durrett, T.P.; Allen, D.K. Metabolic flux analysis to increase oil in seeds. Plant Physiol. 2025, 197, kiae595. [Google Scholar] [CrossRef] [Scilit]
  34. Galili, G. The aspartate-family pathway of plants: Linking production of essential amino acids with energy and stress regulation. Plant Signal. Behav. 2011, 6, 192–195. [Google Scholar] [CrossRef] [Scilit]
  35. Wang, W.; Xu, M.; Wang, G.; Galili, G. New insights into the metabolism of aspartate-family amino acids in plant seeds. Plant Reprod. 2018, 31, 203–211. [Google Scholar] [CrossRef] [Scilit]
  36. Bates, P.D.; Browse, J. The significance of different diacylglycerol synthesis pathways on plant oil composition and bioengineering. Front. Plant Sci. 2012, 3, 147. [Google Scholar] [CrossRef] [Scilit]
  37. Bates, P.D.; Fatihi, A.; Snapp, A.R.; Carlsson, A.S.; Browse, J.; Lu, C. Acyl editing and headgroup exchange are the major mechanisms that direct polyunsaturated fatty acid flux into triacylglycerols. Plant Physiol. 2012, 160, 1530–1539. [Google Scholar] [CrossRef] [Scilit]
  38. Hunter, J.E.; Zhang, J.; Kris-Etherton, P.M. Cardiovascular disease risk of dietary stearic acid compared with trans, saturated, and unsaturated fatty acids: A systematic review. Am. J. Clin. Nutr. 2010, 91, 46–63. [Google Scholar] [CrossRef] [Scilit]
  39. Ohlrogge, J.; Browse, J. Lipid biosynthesis. Plant Cell 1995, 7, 957–970. [Google Scholar] [CrossRef] [Scilit][Green Version]
  40. Shanklin, J.; Cahoon, E.B. Desaturation as a mechanism of modification of fatty acids in plants. Annu. Rev. Plant Physiol. Plant Mol. Biol. 1998, 49, 611–641. [Google Scholar] [CrossRef] [Scilit] [PubMed]
  41. Okuley, J.; Lightner, J.; Feldmann, K.; Yadav, N.; Lark, E.; Browse, J. Arabidopsis FAD2 gene encodes the enzyme that is essential for polyunsaturated lipid synthesis. Plant Cell 1994, 6, 147–158. [Google Scholar] [CrossRef] [Scilit]
  42. Dmitriev, A.A.; Kezimana, P.; Rozhmina, T.A.; Zhuchenko, A.A.; Povkhova, L.V.; Pushkova, E.N.; Novakovskiy, R.O.; Pavelek, M.; Vladimirov, G.N.; Nikolaev, E.N.; et al. Genetic diversity of SAD and FAD genes responsible for the fatty acid composition in flax cultivars and lines. BMC Plant Biol. 2020, 20, 301. [Google Scholar] [CrossRef] [Scilit]
  43. Belide, S.; Petrie, J.R.; Shrestha, P.; Singh, S.P. Modification of seed oil composition in Arabidopsis by artificial microRNA-mediated gene silencing. Front. Plant Sci. 2012, 3, 168. [Google Scholar] [CrossRef] [Scilit]
  44. Wang, P.; Xiong, X.; Zhang, X.; Wu, G.; Liu, F. A review of erucic acid production in Brassicaceae oilseeds: Progress and prospects for the genetic engineering of high and low-erucic acid rapeseeds (Brassica napus). Front. Plant Sci. 2022, 13, 899076. [Google Scholar] [CrossRef] [Scilit]
  45. Fatima, S.; Iqbal, N.; Lu, S.; Khan, M.O.; Mehmood, M.A.; Qari, S.H.; Ahmad, N. FAE1 and FAD2 gene expression dynamics and fatty acid modulation in Brassica under salt stress: A molecular insight. PLoS ONE 2026, 21, e0345945. [Google Scholar] [CrossRef] [Scilit]
Figure 1. Fruit morphology and cross-sectional structure of four macadamia cultivars.
Horticulturae 12 01082 g001
Figure 2. Nutritional characteristics of kernels among cultivars. (a) Crude fat content, (b) crude protein content, (c) soluble sugar content, and (d) total amino acid content in kernels of four macadamia cultivars. Data are presented as mean ± SD (n = 3 biological replicates). Different lowercase letters indicate significant differences among cultivars according to Tukey’s HSD test at p < 0.05.
Horticulturae 12 01082 g002
Figure 3. Quality assessment and reproducibility analysis of transcriptome sequencing data. (a) Principal component analysis (PCA) of transcriptome data from different macadamia nut kernel samples. (b) Pearson correlation heatmap showing the correlation coefficients among all samples based on gene expression levels.
Horticulturae 12 01082 g003
Figure 4. Identification and analysis of differentially expressed genes (DEGs) and transcription factors in macadamia nut kernel samples. (a) Venn diagram showing the number of shared and unique DEGs among different comparison groups. (b) Statistics of up-regulated and down-regulated DEGs identified in each comparison group. Red bars represent up-regulated genes, and blue bars represent down-regulated genes. (c) Distribution of major differentially expressed transcription factor families. (d) Venn diagram showing shared and unique differentially expressed transcription factors among comparison groups. (e) Heatmap displaying the expression patterns of common differentially expressed transcription factors across different samples.
Horticulturae 12 01082 g004
Figure 5. GO functional enrichment and KEGG pathway analysis of differentially expressed genes (DEGs) in macadamia. (a) GO enrichment analysis of DEGs from three comparison groups. Triangles (▲) represent Biological Process (BP) and circles (●) represent Molecular Function (MF). Color intensity indicates the enrichment significance (Log10(Padj)), and dot size represents the number of enriched genes (Count). (b) KEGG pathway enrichment analysis. Dot size indicates the number of enriched genes, and color intensity indicates −Log10(Padj).
Horticulturae 12 01082 g005
Figure 6. Metabolomic profiling of macadamia nut kernels among different cultivars. (a) Principal component analysis (PCA) of metabolomic data. (b) Hierarchical clustering heatmap of metabolite abundances across all samples. Color scale indicates Z-score normalized metabolite levels (red: high, blue: low). (c) Relative abundance of metabolites with defined biological roles across developmental stages. (d) Top 20 most abundant metabolites in macadamia nut kernels. All other metabolites are grouped as “Others”. O.C, QA1, QA2, and QA3 represent different macadamia cultivars.
Horticulturae 12 01082 g006
Figure 7. Differential metabolite analysis and KEGG enrichment among different macadamia cultivars. (a) Number of up-regulated and down-regulated differential accumulated metabolites (DAMs) identified in the comparison groups. Red and blue bars represent up-regulated and down-regulated metabolites, respectively. (b) Venn diagram showing the shared and unique DAMs among the three comparison groups. (c) Venn diagram of significantly enriched KEGG pathways among QA1 vs. O.C, QA2 vs. O.C, and QA3 vs. O.C (d) KEGG enrichment analysis of differential metabolites among different comparison groups. Bubble size indicates the number of enriched metabolites, and bubble color represents the significance level [−Log10(p-value)].
Horticulturae 12 01082 g007
Figure 8. Integrated transcriptomic and metabolomic analysis of the biosynthesis of amino acids pathway associated with oil accumulation in macadamia kernels. Metabolic pathway framework: Red boxes indicate detected metabolites; green boxes indicate genes; Expression heatmaps: Colored circles represent DAMs (Differentially Accumulated Metabolites); colored squares represent DEGs (Differentially Expressed Genes); Z-score scale: Red indicates up-regulation/high accumulation (Z-score = 1.0); white indicates mean expression level (Z-score = 0); green indicates down-regulation/low accumulation (Z-score = −1.0); Abbreviations: OAA, oxaloacetate; α-KG, α-ketoglutarate; 3-PGA, 3-phosphoglycerate; ASNA/asnB, asparagine synthetase A; GOT1/2, glutamate-oxaloacetate transaminase 1/2; asd, aspartate semialdehyde dehydrogenase; thrB, homoserine kinase; thrC, O-phosphohomoserine synthase; metE, methionine synthase; metK/MAT, methionine adenosyltransferase; GLT1, glutamate transporter 1; GLUL/glnA, glutamine synthetase; serC/PSAT, phosphoserine aminotransferase; serA/PSPH, phosphoserine phosphatase; cysE, cysteine synthase; ilvA/ALS, acetolactate synthase; ilvE/BCAT, branched-chain amino acid transaminase.
Horticulturae 12 01082 g008
Figure 9. Integrated transcriptomic and metabolomic analysis of the Glycerolipid metabolism pathway associated with oil accumulation in macadamia kernels. Metabolic pathway framework: Red boxes indicate detected metabolites; green boxes indicate genes; Expression heatmaps: Colored circles represent DAMs (Differentially Accumulated Metabolites); colored squares represent DEGs (Differentially Expressed Genes); Z-score scale: Red indicates up-regulation/high accumulation (Z-score = 1.0); white indicates mean expression level (Z-score = 0); green indicates down-regulation/low accumulation (Z-score = −1.0); Abbreviations: GPAT, glycerol-3-phosphate acyltransferase; LPAT, lysophosphatidic acid acyltransferase; DGAT, diacylglycerol acyltransferase; PDAT, phospholipid:diacylglycerol acyltransferase; PLA, phospholipase A; PLC, phospholipase C; PLD, phospholipase D; LPA, lysophosphatidic acid; PA, phosphatidic acid; DAG, diacylglycerol; TAG, triacylglycerol; PC, phosphatidylcholine; PE, phosphatidylethanolamine; LysoPC, lysophosphatidylcholine; LysoPE, lysophosphatidylethanolamine.
Horticulturae 12 01082 g009
Figure 10. Integrated transcriptomic and metabolomic analysis of the Linoleic acid metabolism pathway associated with oil accumulation in macadamia kernels. Metabolic pathway framework: Red boxes indicate detected metabolites; green boxes indicate genes; Expression heatmaps: Colored circles represent DAMs (Differentially Accumulated Metabolites); colored squares represent DEGs (Differentially Expressed Genes); Z-score scale: Red indicates up-regulation/high accumulation (Z-score = 1.0); white indicates mean expression level (Z-score = 0); green indicates down-regulation/low accumulation (Z-score = −1.0); Abbreviations: SAD, stearoyl-ACP desaturase; FAD2, fatty acid desaturase 2 (Δ12-desaturase/oleate desaturase/ω-6 fatty acid desaturase); FAD3, fatty acid desaturase 3 (Δ15-desaturase/linoleate desaturase/ω-3 fatty acid desaturase); FAE1/KCS, fatty acid elongase 1/β-ketoacyl-CoA synthase.
Horticulturae 12 01082 g010
Figure 11. RT-qPCR validation of the transcriptome data results for 6 selected genes. The blue bars represent normalized transcript abundance obtained from RNA-seq analysis, and the vertical bars shown in the columns represent relative expression level by RT-qPCR. Relative expression levels of RT-qPCR were calculated using 18sRNA as a standard. The seed samples of O.C, QA1, QA2, and QA3 were selected for RT-qPCR analysis. Among them, the gene level of O.C was standardized with an arbitrary value of 1 as the reference. Pearson correlation coefficients were calculated by comparing RT-qPCR and FPKM for each gene.
Horticulturae 12 01082 g011
Figure 12. Proposed model illustrating metabolic and transcriptional changes associated with oil accumulation and fatty acid composition in macadamia kernels. Solid arrows indicate established biochemical pathway; dashed arrows indicate association supported by transcriptomic/metabolomic data. Red text denotes differentially expressed genes (DEGs).
Horticulturae 12 01082 g012
Table 1. Information of macadamia cultivars used in this study.
No.CultivarsAbbreviationSources of Cultivars
1OwnChoiceO.CAustralia
2Qianao No.1QA1China
3Qianao No.2QA2China
4Qianao No.2QA3China
Table 2. Phenotypic characteristics of fruits from four macadamia cultivars.
CultivarsSingle Fruit
Weight (g)
Fruit Transverse
Diameter (mm)
Fruit Longitudinal
Diameter (mm)
O.C23.55 ± 2.30 b33.81 ± 1.16 b42.38 ± 2.01 a
QA128.42 ± 3.78 a35.80 ± 1.60 a43.14 ± 2.67 a
QA220.94 ± 2.43 b32.61 ± 1.30 b37.49 ± 1.95 b
QA329.43 ± 3.00 a36.34 ± 1.29 a42.46 ± 2.32 a
Note: Values are presented as mean ± standard deviation (SD) (n = 15). Different lowercase letters within the same column indicate significant differences among cultivars according to Tukey’s HSD test at p < 0.05.
Table 3. Summary statistics of transcriptome sequencing data from macadamia nut kernel samples.
SamplesClean Reads (M)Clean Bases
(Gb)
Q20 (%)Q30 (%)GC Content (%)Mapping Rate (%)
O.C142.016.0999.7198.2046.5192.60
O.C244.666.4899.7398.3046.2193.00
O.C344.076.3999.7298.2745.9993.60
QA1143.716.3399.7098.2047.0691.50
QA1244.746.4899.7298.2346.9393.70
QA1344.236.4199.7198.1946.6590.40
QA2144.466.4499.7198.2147.2093.70
QA2244.336.499.7098.1847.6793.00
QA2342.396.1599.7298.2346.6993.30
QA3145.486.6099.7298.2846.8093.50
QA3244.796.5099.7398.3046.2094.90
QA3350.727.3599.7198.2647.0293.00
Disclaimer/Publisher’s Note: The statements, opinions and data contained in all publications are solely those of the individual author(s) and contributor(s) and not of MDPI and/or the editor(s). MDPI and/or the editor(s) disclaim responsibility for any injury to people or property resulting from any ideas, methods, instructions or products referred to in the content.