Article

Secondary Metabolites Profile Diversity of Lobostemon fruticosus Leaves Across Geographical Locations in the Western Cape


by
Luvolwethu Dukashe
1,2,
Nompumelelo Happiness Mnisi
1,2,
Rotondwa Pascalia Gunununu
1,
Manaka Justice Makgato
2,
Motiki Meshack Mofokeng
3,
Stephen Amoo
3,4,
Daphney Marabe
5,
Azwimbavhi Reckson Mulidzi
2,
Callistus Bvenura
6 and
Ngwatshipane Madonna Mashabela
2,*
1
Department of Crop Sciences, Tshwane University of Technology, Private Bag X680, Pretoria 0001, South Africa
2
Agricultural Research Council Infruitec-Nietvoorbij, Private Bag X5026, Stellenbosch 7599, South Africa
3
Agricultural Research Council, Vegetable, Industrial and Medicinal Plants, Private Bag X293, Pretoria 0001, South Africa
4
Unit for Environmental Sciences and Management, Faculty of Natural and Agricultural Sciences, North-West University, Private Bag X293, Potchefstroom 2520, South Africa
5
Department of Agriculture, Land Reform and Rural Development, Private Bag X293, Pretoria 0001, South Africa
6
Department of Horticulture, Faculty of Applied Sciences, Cape Peninsula University of Technology, Bellville 7535, South Africa
*
Author to whom correspondence should be addressed.
Horticulturae 2026, 12(8), 957; https://doi.org/10.3390/horticulturae12080957
Submission received: 1 June 2026 / Revised: 23 July 2026 / Accepted: 27 July 2026 / Published: 2 August 2026
(This article belongs to the Section Medicinals, Herbs, and Specialty Crops)

Abstract

Lobostemon fruticosus (L.) H. Buek is an indigenous South African medicinal plant valued for its traditional therapeutic uses; however, information on its phytochemical variation and pyrrolizidine alkaloid (PA) content across geographical populations remains limited. This study investigated the secondary metabolite composition and PA accumulation in nine biological samples (three geographical locations × three biological replicates) of L. fruticosus collected from Rhodes Memorial, Doringrivier, and Grootnek Fontein in the Western Cape Province between January and March 2025 using untargeted UPLC-QTOF-MS and targeted LC-MS/MS, with values presented as mean ± standard deviation (SD). A total of 15 secondary metabolites of different classes were putatively annotated. Seven compounds, including kaempferol, jaceidin 7-rhamnoside, schizotenuin F, senburiside III, cosmosporaside B, lirioresinol A, and (−)-steganacin, are reported for the first time in L. fruticosus. Significant geographical variation (p < 0.05) was observed, with Doringrivier containing the highest relative abundances of rutin (4815.60 ± 18.96 mg CE g−1 DW), rosmarinic acid (3846.89 ± 285.78 mg CE g−1 DW), and rabdosiin (5142.10 ± 651.00 mg CE g−1 DW). Six of the ten targeted PAs were detected, with lycopsamine N-oxide being the predominant alkaloid (3.89 mg kg−1 in Grootnek Fontein). Principal component analysis explained 97.2% of the total metabolomic variation (PC1 = 72.6%; PC2 = 24.6%) and clearly separated the three geographical populations. The OPLS-DA model showed strong discrimination among populations (R2X = 0.725, R2Y = 0.998, and Q2 = 0.994), supporting the presence of location-specific chemotypic differences. The observed chemotypic differences may be associated with variation in soil properties, climatic conditions, water availability, altitude, and nutrient status among the study sites. Collectively, the results provide a foundation for chemotype selection, quality control, conservation, and the safe medicinal utilization of this species.

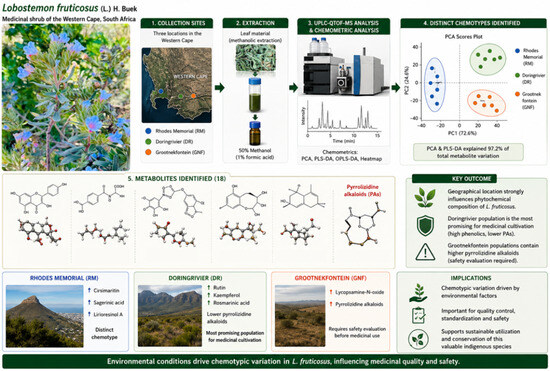
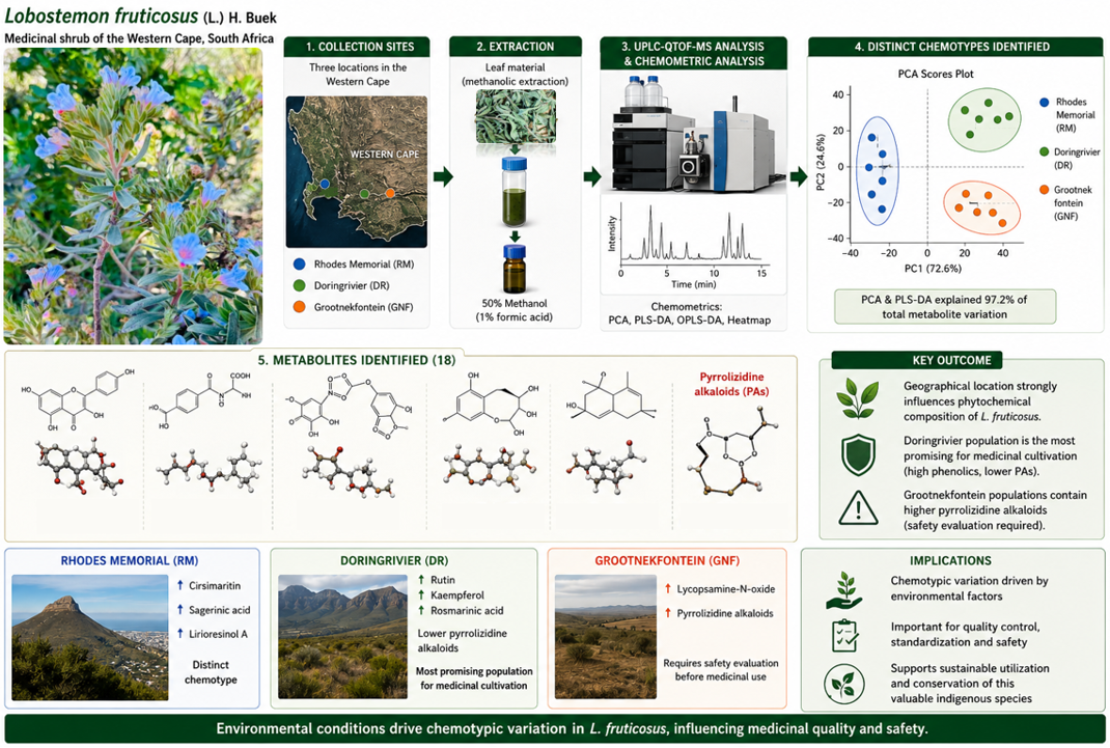
Graphical Abstract

1. Introduction

Lobostemon fruticosus (L.) H. Buek is a perennial woody shrub indigenous to the Western Cape Province, South Africa, and belongs to the Boraginaceae family. The plant has long been recognized in traditional medicine systems and was highly valued by the Khoi-San, early settlers, and Malay communities, who prepared herbal teas from its leaves and consumed them regularly for the maintenance of general health and wellbeing [1]. Traditionally, L. fruticosus has been used internally for the treatment of gynaecological disorders, stomach ailments, internal ulcers, blood poisoning, and uterine cleansing [2,3]. Externally, the leaves are commonly fried in sweet oil or animal fat to prepare topical ointments used for the management of skin-related conditions such as wounds, ringworm, eczema, syphilis, erysipelas, swellings, and other inflammatory disorders [4,5,6,7,8]. Despite its official LC (Least Concern) status, wild populations of L. fruticosus show signs of decline in certain areas because it is widely used as a traditional Cape remedy, and the leaves and stems are mainly traded in “muthi” markets within the Eastern and Western Cape provinces of South Africa [5]. Although a maximum of approximately 15 kg of wet plant material per population may be harvested, continued reliance on wild-harvested material could potentially threaten this species [5].
Previous phytochemical studies on the leaves and twigs have identified 16 secondary metabolites belonging to several phytochemical classes, including flavonoids, terpenoids and glycosides, phenolic acid derivatives, phenylpropanoids, lignans, and other specialized metabolites [9,10]. Many of these compounds exhibit antioxidant, antimicrobial, and anti-inflammatory activities, which may contribute to the plant’s traditional medicinal uses [5]. Studies have also reported the presence of pyrrolizidine alkaloids (PAs), which are characteristic of the Boraginaceae family and are associated with hepatotoxicity, nephrotoxicity, mutagenicity, and carcinogenicity [11,12,13,14]. Specifically, lycopsamine-N-oxide and lycopsamine were identified in L. fruticosus extracts [9], while a recent study reported additional PAs at concentrations ranging from 53–169 mg kg−1 [10].
Secondary metabolite production in medicinal plants is strongly influenced by environmental and geographical factors, including climate, soil physicochemical properties, altitude, water availability, and other abiotic stresses [15]. These factors can alter biosynthetic pathways and consequently affect both the qualitative and quantitative composition of bioactive compounds [16]. Such variation is particularly important for medicinal plants because it influences the quality, efficacy, safety, and standardization of herbal raw materials intended for therapeutic and commercial applications [17]. These observations emphasise the need for further phytochemical investigations to evaluate both the therapeutic potential of L. fruticosus and the influence of geographical variation on its secondary metabolite composition. This knowledge of phytochemical variation is important for supporting the sustainable cultivation and conservation of this species. Moreover, chemotyping can contribute to the characterization of phytochemical profiles in wild plants and assess whether the development of cultivation strategies can help reduce dependence on wild harvesting [10]. Although phytochemical profiling of L. fruticosus has previously been reported [9,10], no study has evaluated the metabolomic variation among wild populations collected from Rhodes Memorial, Doringrivier, and Grootnek Fontein while simultaneously assessing chemotypic diversity and pyrrolizidine alkaloid distribution. Given that environmental conditions can substantially influence secondary metabolite accumulation, additional investigations of wild populations from different locations remain necessary. Therefore, the aim of this study was to investigate the secondary metabolite profiles of wild L. fruticosus populations collected from three locations within the Western Cape Province, South Africa. This study contributes to the growing body of research on medicinal plants of the Western Cape and forms part of an ongoing research programme focused on the phytochemical characterization of South African indigenous flora.

2. Materials and Methods

2.1. Chemicals and Reagents

Reagents and solvents utilised in this study included methanol (CH3OH, Romil LC-MS grade), formic acid (HCOOH, ≥98%), and acetonitrile (CH3CN, Romil LC-MS grade), all of which were obtained from Microsep, Johannesburg, South Africa.

2.2. Sampling Sites and Collection of Wild Lobostemon fruticosus

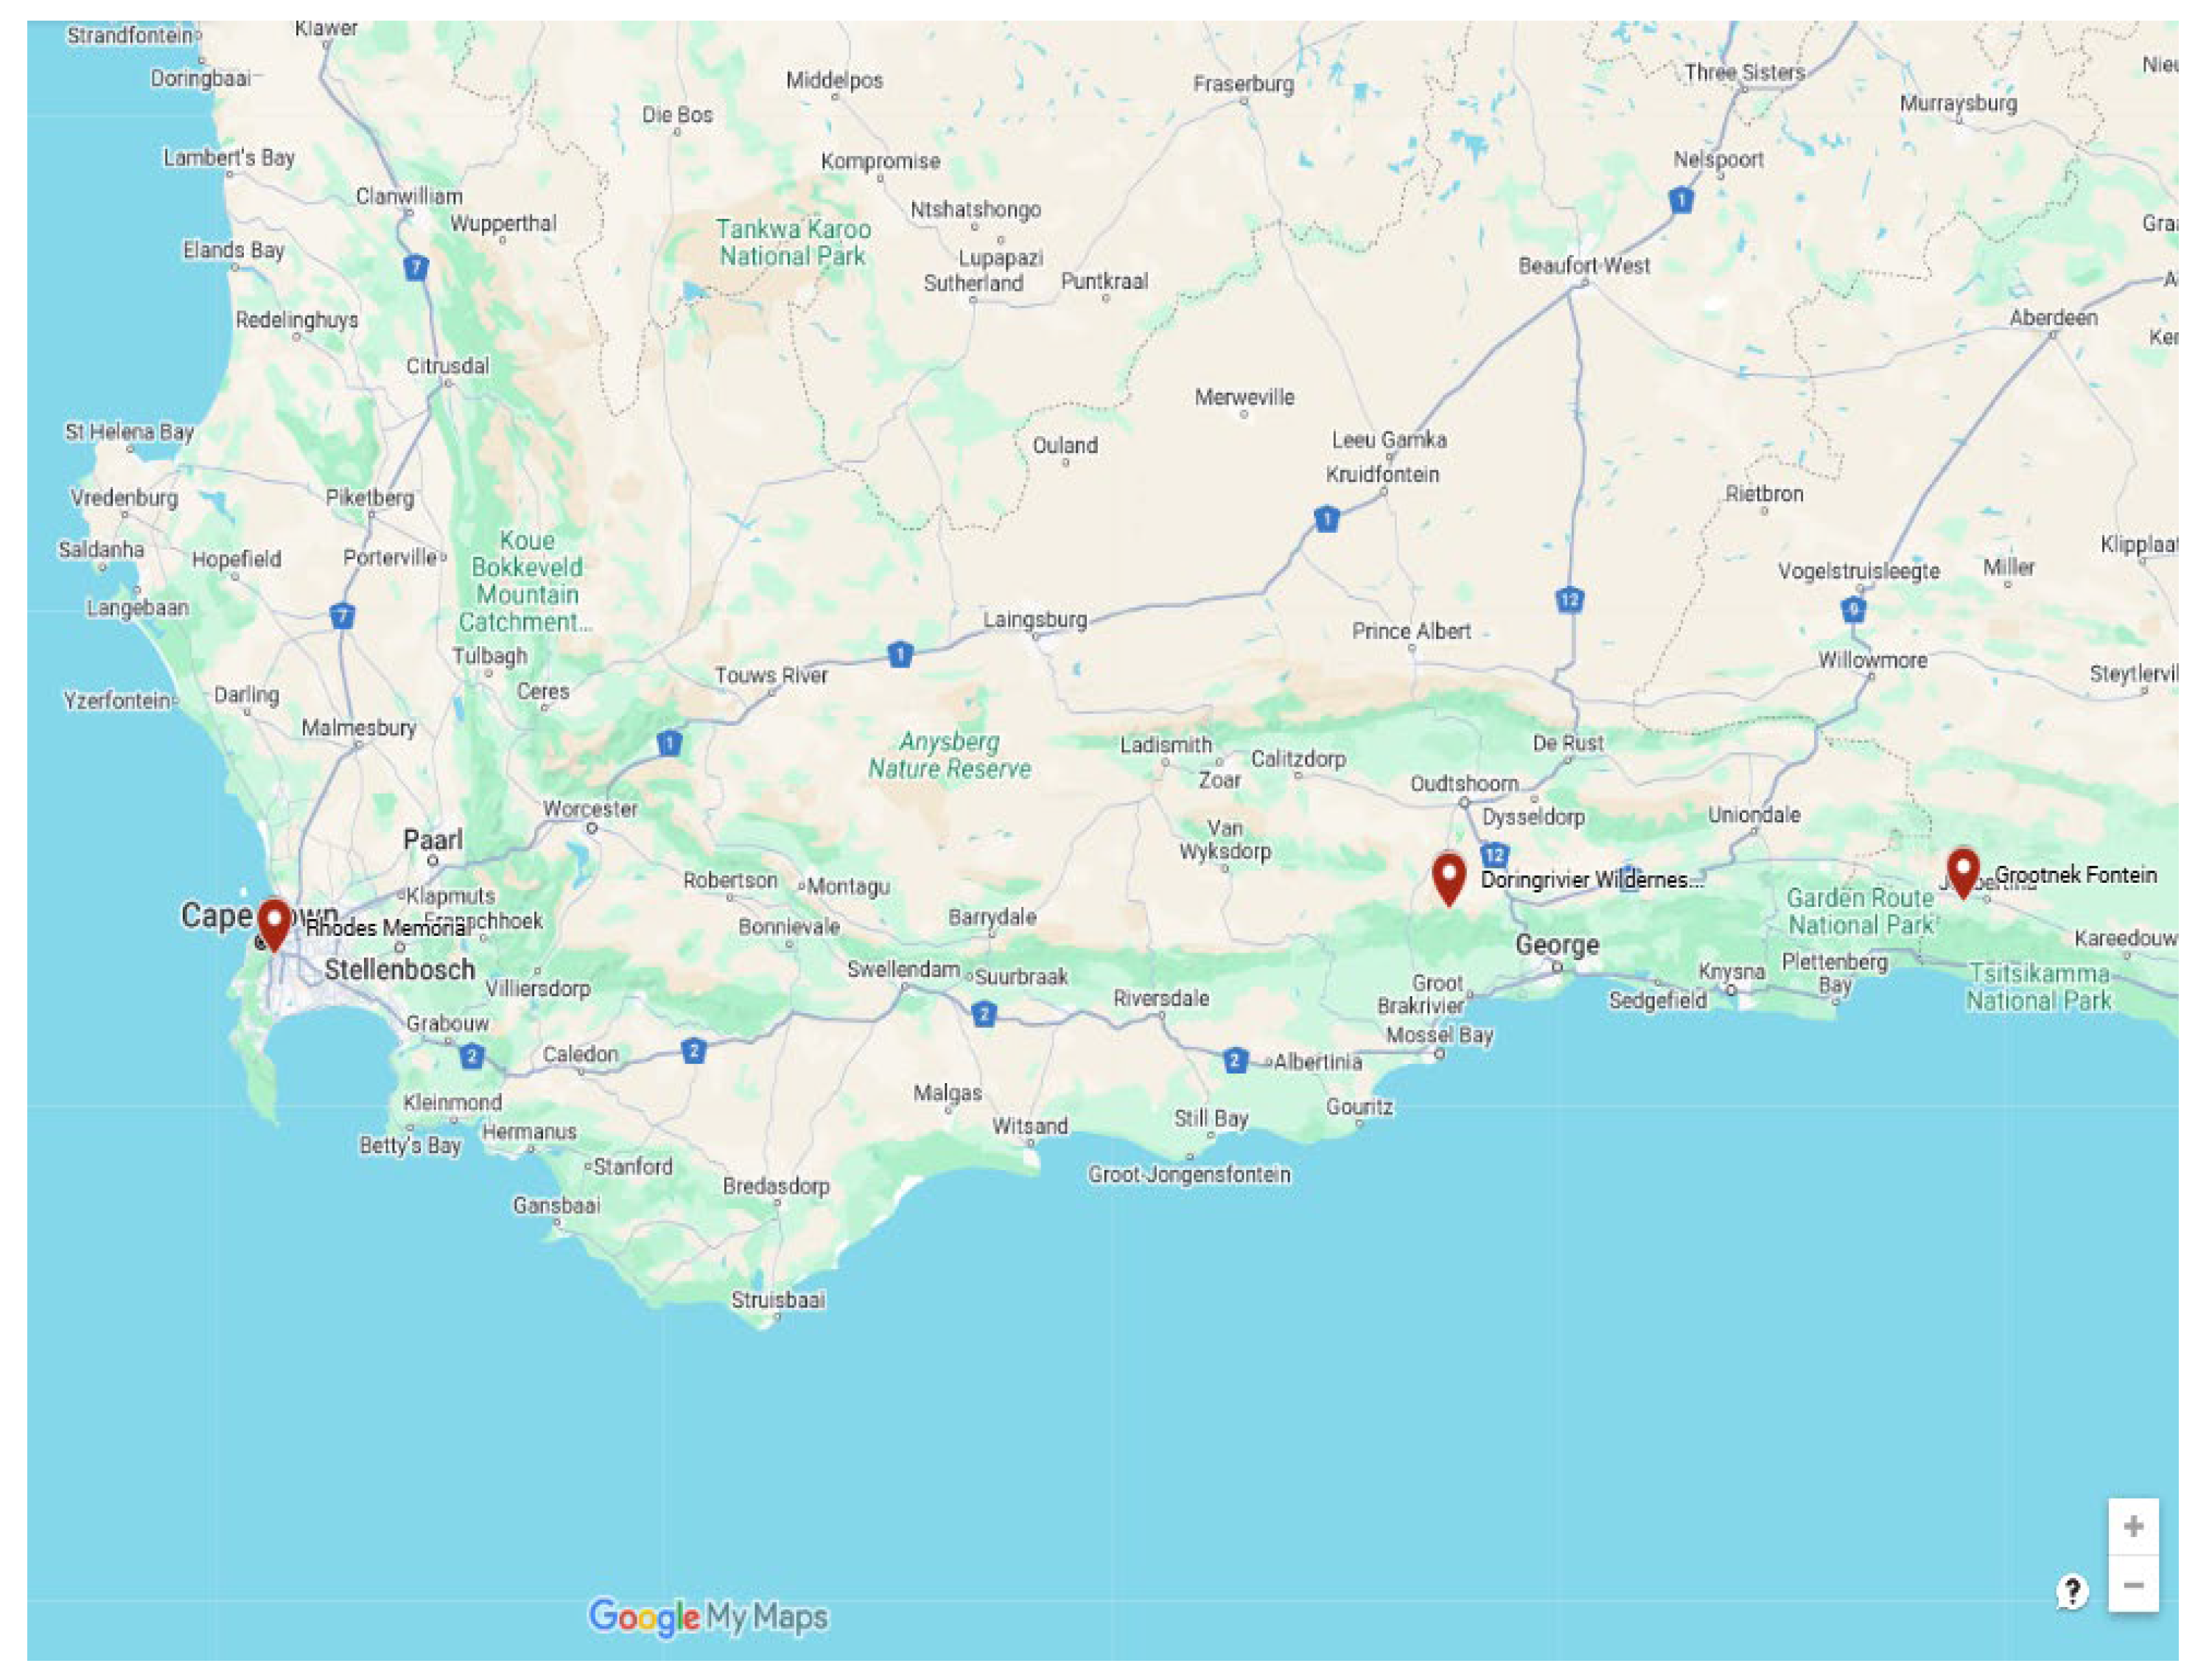
Lobostemon fruticosus leaves were collected between January and March 2025 from three mountainous locations within protected areas of the Western Cape Province, South Africa: Rhodes Memorial (33°57′03.2″ S, 18°27′26.0″ E), Doringrivier (33°49′57.8″ S, 22°12′20.5″ E), and Grootnek Fontein (33°48′51.4″ S, 22°09′16.7″ E) (Figure 1). Plant material was collected under CapeNature Plant Collection Permit No. CN35-28-35757. Voucher specimens were prepared and taxonomically authenticated as L. fruticosus (L.) H. Buek by Mr Mashudu Nndanduleni (SANBI, Kirstenbosch National Botanical Garden, Cape Town, South Africa). A voucher specimen (Voucher No. ARC-LF-001) was deposited at the Agricultural Research Council (ARC), Infruitec-Nietvoorbij, Stellenbosch, South Africa. A trained CapeNature ranger further assisted with field identification and sample collection.
Soil samples were collected from each study site using a zig-zag sampling pattern where ten bulk subsamples were taken with a soil auger at a depth of 30 cm. The samples were stored in brown bags for subsequent air drying, sieving and testing. Soil nutrient analyses (Table 1), including phosphorus, potassium, magnesium, manganese, zinc, calcium, and sodium, were conducted at Bemlab, Somerset West, South Africa. The available phosphorus was determined using the [18] method with modifications, while cation exchange capacity (CEC) and exchangeable bases were measured using the ammonium acetate extraction method. Soil pH was determined in a soil-water suspension (1:10, w/v) using a calibrated pH metre. These sites were selected to capture environmental variability that may influence plant growth and metabolite profiles. The selection criteria for these areas included differences in soil pH, moisture, temperature, altitude, light exposure and general soil characteristics, which are known to affect secondary metabolite accumulation in medicinal plants [15].
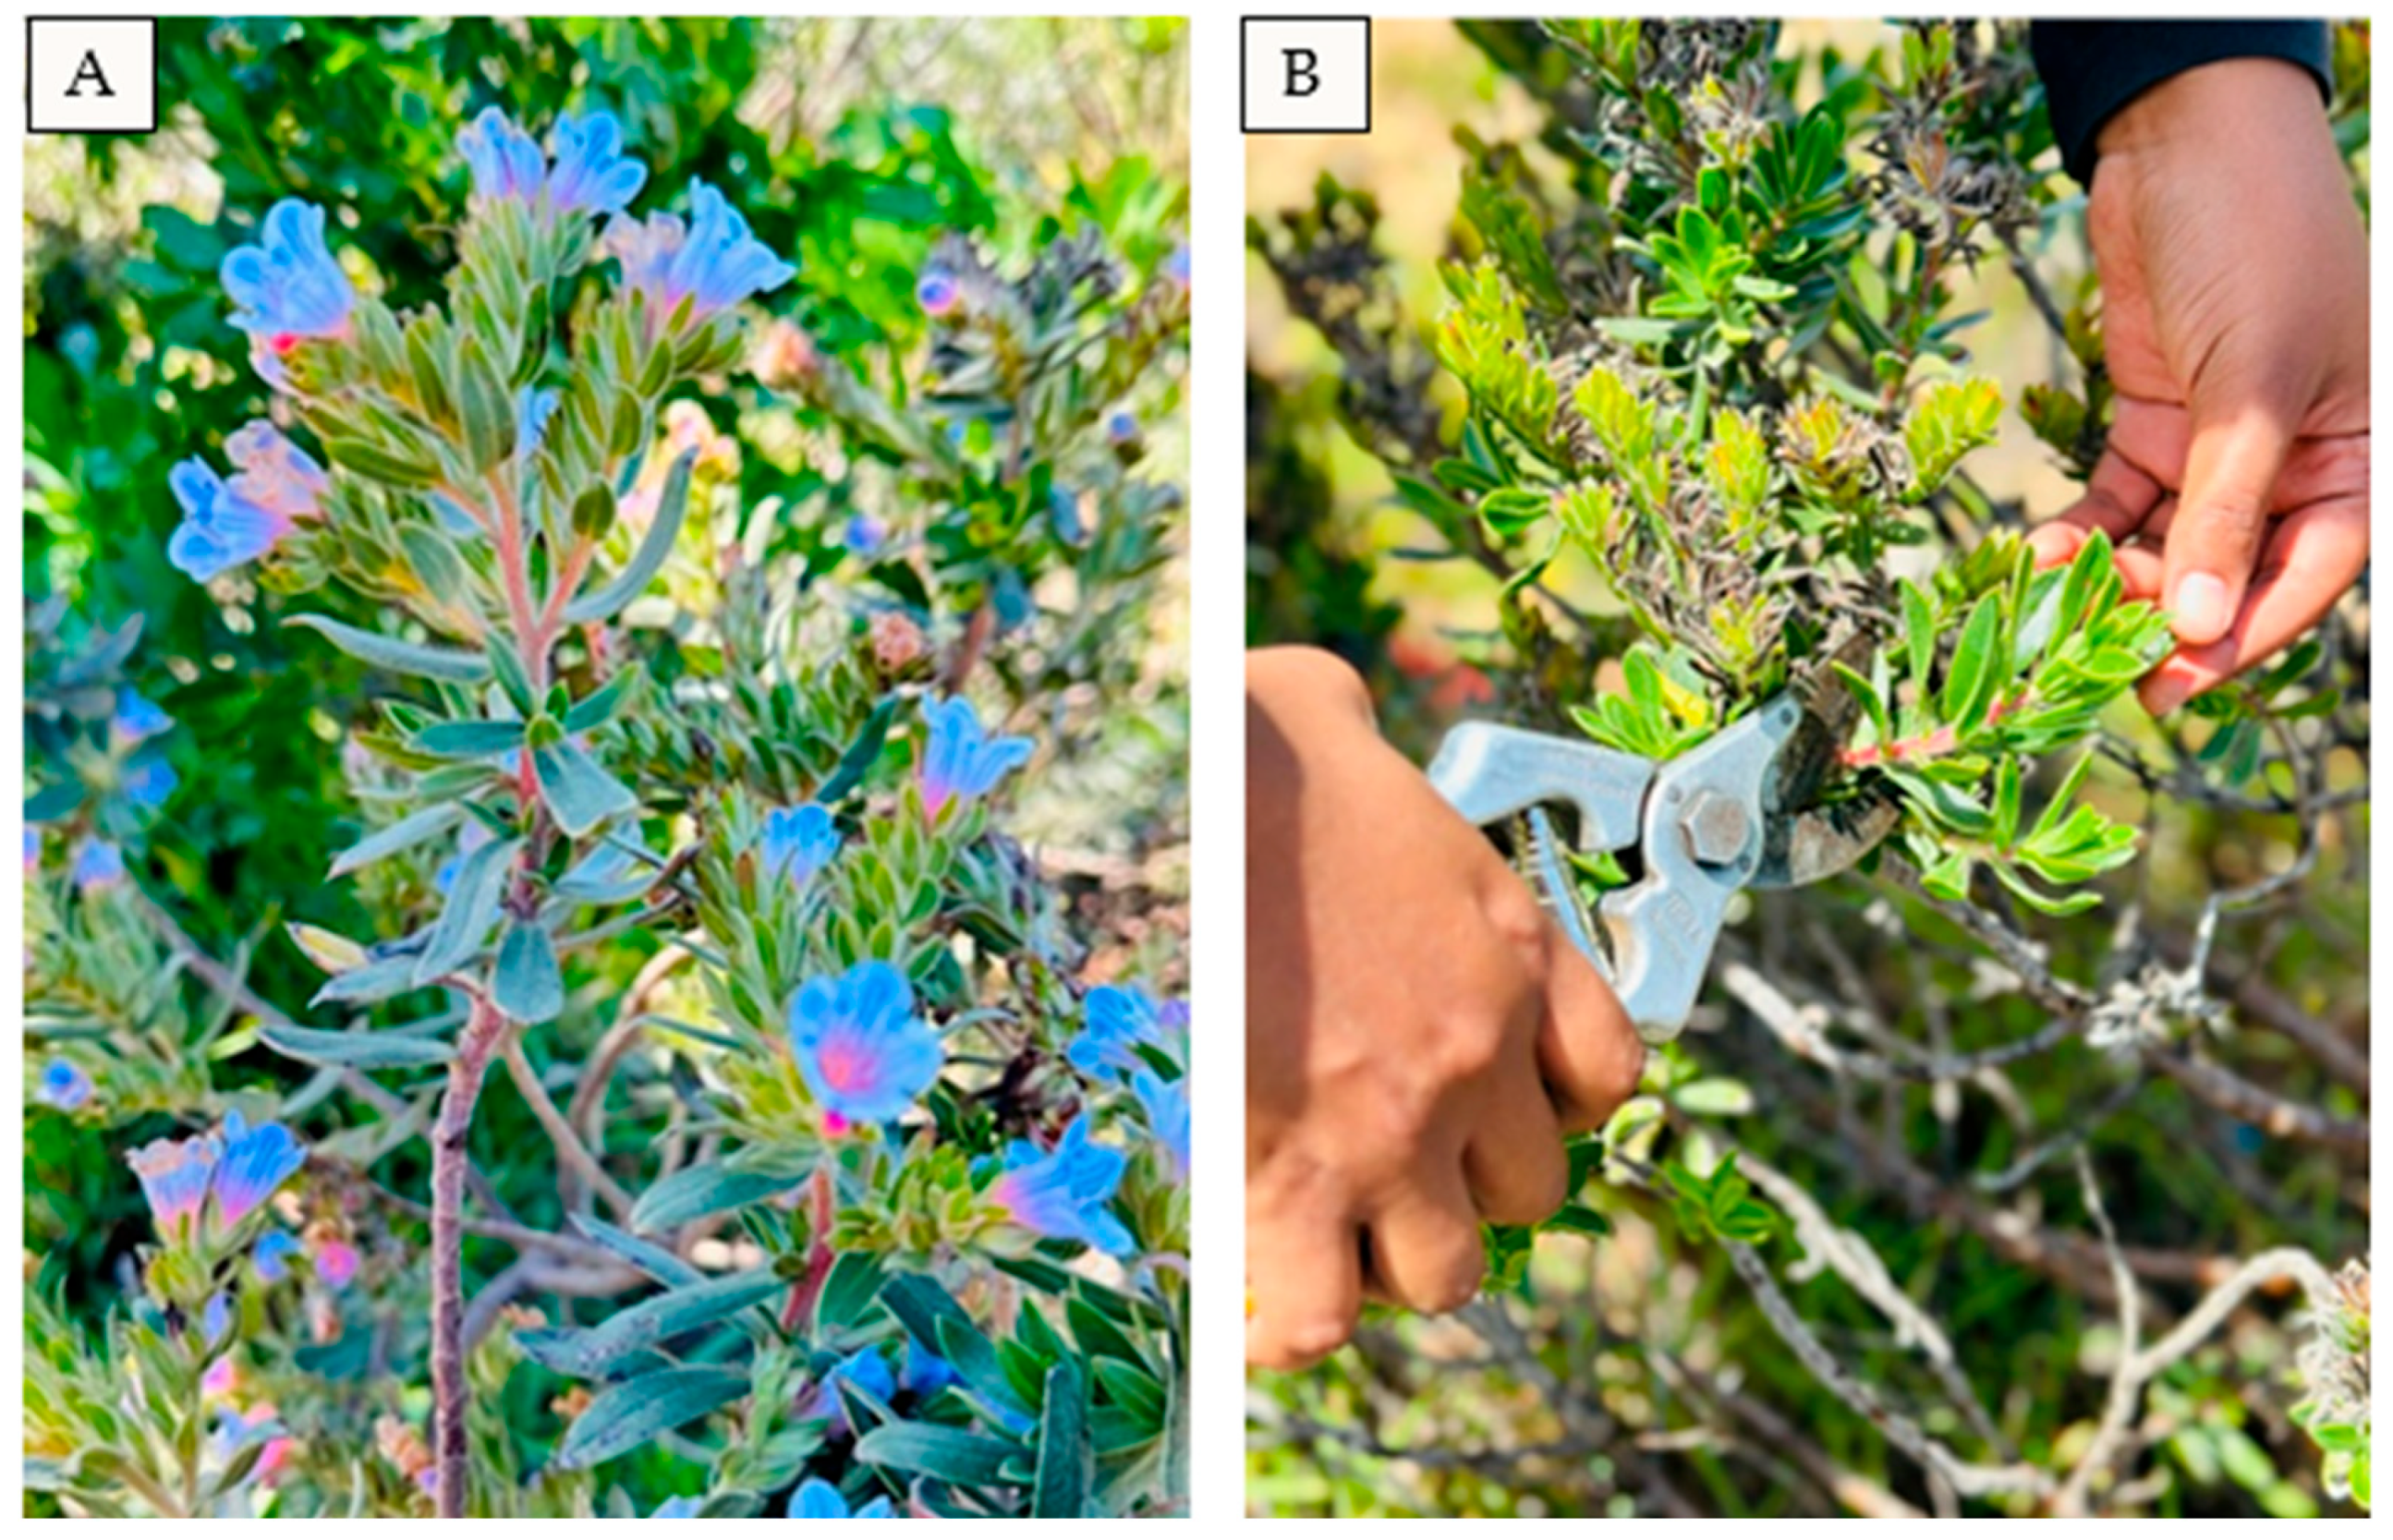
Among the three sites studied, samples from Doringrivier and Grootnek Fontein were collected from plateau-like sections of the mountain at approximately 540 m and 560 m above sea level, respectively. These areas receive approximately 657 mm of annual rainfall distributed throughout the year, with average temperatures of approximately 21 °C. In contrast, samples from Rhodes Memorial were obtained from a steep area exposed to the ocean breeze at approximately 200 m above sea level. This area falls within a winter-rainfall region receiving approximately 686 mm of annual precipitation and average temperatures of 25 °C. Plant material was collected from a 3 ha demarcated area in accordance with the CapeNature permit. Ten plants were randomly selected within the designated area, and samples were collected by cutting the twigs of each plant with leaves attached using pruning shears (Figure 2B). The samples were placed in brown paper bags and promptly transported to the Agricultural Research Council (ARC) Infruitec-Nietvoorbij, where they were air-dried at room temperature on the laboratory workbench for two weeks to prevent discoloration. The leaves of the dried plant material were separated from the twigs, finely ground, and stored in glass vials at 4 °C until further use.

2.3. Methanolic Extraction

At each geographical location, leaves were collected from nine randomly selected plants within the designated sampling area. The collected material was used to prepare three independent biological replicates, each comprising a composite sample of leaves collected from different individual plants. Each biological replicate was extracted and analysed independently by UPLC-QTOF-MS, resulting in a total of nine biological samples (three geographical locations × three biological replicates). Approximately 0.25 g of dried, finely ground L. fruticosus leaf material from each biological replicate was accurately weighed into a 15 mL Falcon tube and extracted with 10 mL of 50% (v/v) methanol containing 1% (v/v) formic acid in water. The extraction was performed in an E-UC13-HD-D Eins Sci ultrasonic bath (Sigma-Aldrich, Johannesburg, South Africa) operating at 300 W and 35 °C for 30 min. Following sonication, the extracts were continuously agitated on an orbital shaker for 24 h. The extracts were then vortex-mixed and centrifuged at 5000× g for 10 min using a Hermle Z160M centrifuge (Hermle Labortechnik, Wehingen, Germany). The resulting supernatants were filtered through 0.22 μm Millipore syringe filters (Merck Millipore, Johannesburg, South Africa) and stored at −20 °C until UPLC-QTOF-MS analysis.

2.4. UPLC-QTOF-MS Analysis and Semi-Quantification of Secondary Metabolites

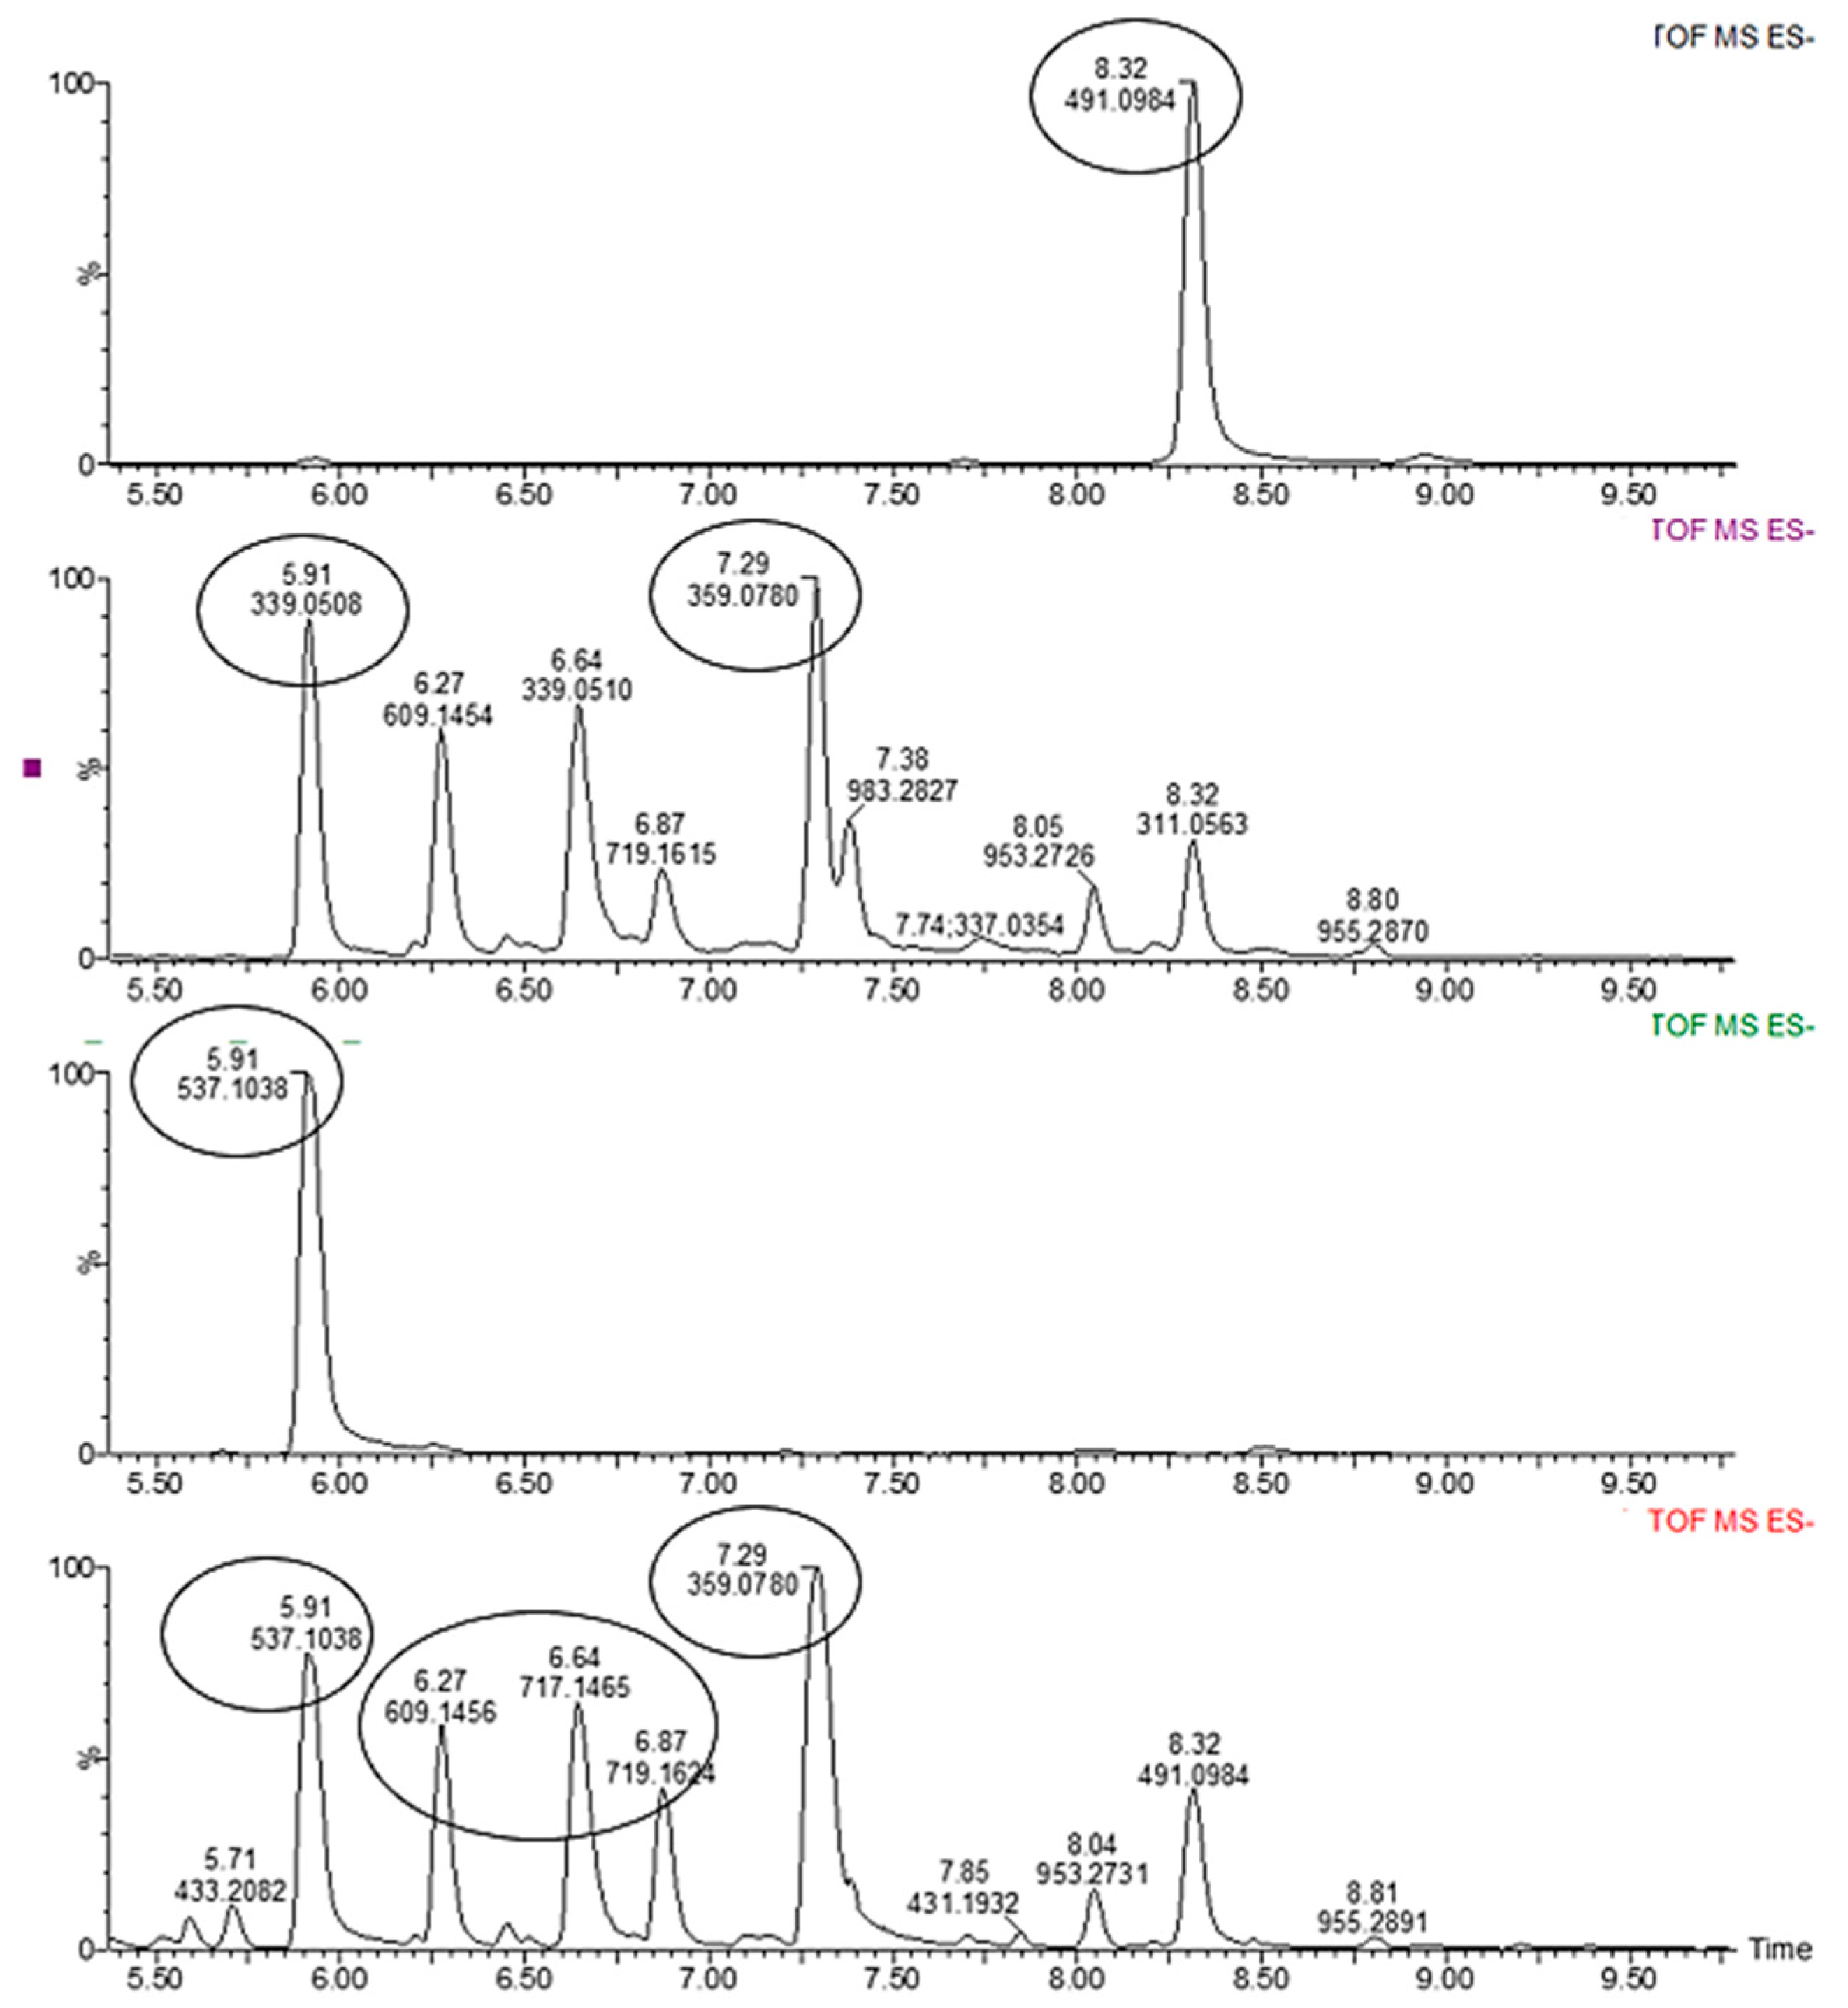
High-resolution metabolite profiling was performed using a Waters Select Cyclic IMS quadrupole time-of-flight (qTOF) mass spectrometer coupled to a Waters Acquity Ultra Performance Liquid Chromatography (UPLC) system (Waters Corporation, Milford, MA, USA) following the method of [19]. Data were acquired in negative electrospray ionization (ESI) (Figure A1) mode with a desolvation gas flow of 800 L h−1, a desolvation temperature of 275 °C, and a cone voltage of 20 V. All remaining instrument parameters were optimized to maximize sensitivity and mass accuracy. Data were acquired in MSE mode using low-energy (4 eV) and elevated-energy (40–100 eV) acquisition functions to obtain precursor and fragment ion information over an m/z range of 100–1500. Sodium formate was used for instrument calibration, while leucine enkephalin served as the lock-mass reference to ensure accurate mass measurements throughout the analysis.
Chromatographic separation was achieved using a Waters HSS T3 column (2.1 × 100 mm, 1.8 μm). Mobile phase A consisted of 0.1% (v/v) formic acid in water, while mobile phase B consisted of 0.1% (v/v) formic acid in acetonitrile. The injection volume was 0.5 μL. The gradient program commenced at 2.5% B for 0.5 min, increased linearly to 44% B over 7 min, followed by an increase to 100% B over 12 min, a 0.5 min wash step at 100% B, and re-equilibration to the initial conditions for 2.5 min, resulting in a total run time of 15 min. The column temperature was maintained at 60 °C and the flow rate at 0.35 mL min−1.
Untargeted metabolite profiling was performed using the UPLC-QTOF-MS dataset. Semi-quantitative analysis was conducted using an external calibration curve prepared from catechin standards (0.5–100 mg L−1) and processed using TargetLynx, version 4.2 software (Waters Corporation, Milford, MA, USA). Since authentic reference standards were unavailable for all detected metabolites, metabolite abundances were expressed as catechin equivalents (CE). These values represent relative estimates of metabolite abundance and should not be interpreted as absolute concentrations of individual compounds. Differences in ionization efficiency and detector response among metabolites may influence response intensity; therefore, the reported CE values were used exclusively for comparative assessment of metabolite accumulation among the three geographical populations.
Raw UPLC-QTOF-MS data were processed using MS-DIAL (version 5.0) and MS-FINDER (version 3.5) (RIKEN Center for Sustainable Resource Science, Kanagawa, Japan) for peak detection, retention time alignment, deconvolution, normalization, feature extraction, and metabolite annotation. Each detected feature was characterized by its mass-to-charge ratio (m/z) and retention time. Where required, MS2 spectra generated in MassLynx were exported as .csv files and further analysed using SIRIUS to improve structural interpretation and metabolite annotation [20].
Metabolite identification confidence was assigned according to the Metabolomics Standards Initiative (MSI) guidelines. All metabolites annotated from the untargeted UPLC-QTOF-MS dataset, including selected pyrrolizidine alkaloid-related features detected during profiling, were classified as MSI Level 2 (putatively annotated compounds) based on accurate mass measurements, MS/MS fragmentation patterns, literature comparison, and database matching using MS-DIAL, MS-FINDER, MoNA, PubChem, and SIRIUS. Targeted LC-MS/MS analysis was subsequently performed for selected pyrrolizidine alkaloids (PAs) to confirm their occurrence and obtain accurate concentrations using authentic reference standards. PA-related features detected during the untargeted UPLC-QTOF-MS profiling were further evaluated through targeted LC-MS/MS analysis to provide complementary qualitative and quantitative information on PA distribution among the geographical populations.

2.5. Chemometric Data Analysis

The UPLC-QTOF-MS data obtained from L. fruticosus leaf extracts were subjected to multivariate statistical analysis to investigate metabolomic variation among the three geographical populations and identify discriminating metabolomic features. The processed feature matrix generated in MS-DIAL, consisting of aligned and normalized metabolomic features defined by their mass-to-charge ratio (m/z) and retention time, was exported for chemometric analysis using SIMCA-P+ version 13.0 (Umetrics, Umeå, Sweden).
Principal Component Analysis (PCA) was initially performed as an unsupervised approach to evaluate intrinsic sample clustering, identify potential outliers, and assess overall variation within the metabolomic dataset. Orthogonal Partial Least Squares Discriminant Analysis (OPLS-DA) was subsequently performed as a supervised classification method to maximize separation among geographical populations and identify metabolomic features contributing to population discrimination. Model performance was assessed using cumulative explained variation in the predictor matrix (R2X), explained variation in the response matrix (R2Y), and predictive ability of the model (Q2).
Variable Importance in Projection (VIP) scores were used to identify the most influential metabolomic features contributing to group separation. The corresponding discriminating features were subsequently interpreted based on metabolite annotation obtained from accurate mass measurements, MS/MS fragmentation patterns, and database matching using MS-DIAL, MS-FINDER, MoNA, PubChem, and SIRIUS.

2.6. Targeted LC-MS/MS Determination of Pyrrolizidine Alkaloids (PAs)

Composite leaf samples representing each L. fruticosus geographical population were analysed for pyrrolizidine alkaloids (PAs) at the Central Analytical Facility, Stellenbosch University (Stellenbosch, South Africa), using an Acquity UPLC system coupled to a Xevo TQ-S Micro triple quadrupole mass spectrometer (Waters Corporation, Milford, MA, USA). For targeted PA determination, leaf material collected from the ten randomly selected plants within each geographical population was combined to prepare one composite sample per location. Therefore, PA analysis was performed at the population level and was used for comparative assessment of PA occurrence and abundance among the three geographical populations.
Approximately 2 g of finely ground leaf material was weighed into 50 mL centrifuge tubes and extracted with 5 mL of water:methanol:formic acid (50:25:1, v/v/v). Samples were sonicated for 1 h at room temperature and centrifuged at 13,000 rpm for 5 min. The supernatants were transferred to 2 mL microcentrifuge tubes, and a 1 mL aliquot of each extract was collected for LC-MS/MS analysis.
Chromatographic separation was performed using an Acquity UPLC BEH C18 column (100 × 2.1 mm, 1.7 μm particle size). The mobile phase consisted of solvent A (0.1% formic acid in water) and solvent B (1% formic acid in a mixture of 49% methanol, 49% acetonitrile, and 2% isopropanol). Gradient elution and chromatographic conditions were performed according to the method described by [21].
Quantification was conducted in multiple reaction monitoring (MRM) mode using authentic lycopsamine and lycopsamine N-oxide reference standards (Phytoplan, Vestenbergsgreuth, Germany). Optimized precursor-to-product ion transitions were used for each analyte, and peak areas were normalized against the deuterated internal standard, senecionine-N-oxide-D3. Concentrations were calculated using external calibration curves generated from authentic reference standards. A total of ten targeted pyrrolizidine alkaloids were screened in the leaf extracts.
Unlike the secondary metabolites detected through untargeted UPLC-QTOF-MS profiling and expressed as catechin equivalents (Section 2.4), pyrrolizidine alkaloids were quantified using authentic reference standards and are therefore reported as absolute concentrations (mg kg−1 dry weight). The targeted LC-MS/MS analysis was used to validate and quantify PA occurrence, complementing the untargeted metabolomic assessment of chemical variation among geographical populations.

3. Results and Discussion

3.1. UPLC-QTOF-MS Identification and Annotation of the Secondary Metabolites

A total of 15 secondary metabolites were annotated at Metabolomics Standards Initiative (MSI) Level 2 in the 50% aqueous methanolic leaf extracts of L. fruticosus using UPLC-QTOF-MS over a retention time range of 4.69–9.59 min (Table 2). Metabolite annotation was based on accurate mass measurements, MS/MS fragmentation patterns, comparison with the published literature, and database matching using MoNA, PubChem, MS-DIAL, MS-FINDER, and SIRIUS. The annotated compounds comprised several major phytochemical classes, including flavonoids, phenolic acid derivatives, phenylpropanoids, lignans, sesquiterpenoids, and fatty acyl glycosides, demonstrating the diverse secondary metabolite composition of L. fruticosus.
Among the annotated metabolites, globoidnan A, globoidnan B, rosmarinic acid, rabdosiin, and sagerinic acid were consistent with previous reports for L. fruticosus and other members of the Boraginaceae family [9,10]. In contrast, kaempferol, jaceidin 7-rhamnoside, schizotenuin F, senburiside III, cosmosporaside B, lirioresinol A, and (−)-steganacin have not previously been reported in L. fruticosus, to the best of our knowledge. Although these metabolites were putatively identified (MSI Level 2), their detection expands the currently known phytochemical profile of the species and suggests that L. fruticosus may possess greater chemical diversity than previously recognized.
Previous phytochemical investigations of L. fruticosus have primarily focused on populations distributed across the Western Cape Province [10]. The present study extends this knowledge by characterizing wild populations from Rhodes Memorial, Doringrivier, and Grootnek Fontein. The inclusion of these geographically distinct populations provides further insight into the influence of environmental conditions on secondary metabolite accumulation and chemotypic variation. Collectively, these findings broaden the current understanding of the phytochemical diversity of L. fruticosus and provide a valuable foundation for future studies on its medicinal potential, quality standardization, conservation, and sustainable utilization.

3.1.1. Flavonoids

Flavonoids constituted one of the major classes of secondary metabolites detected in L. fruticosus and exhibited significant differences among the three geographical populations (Table 2). Rutin was the most abundant flavonoid and showed significant (p < 0.05) variation, with the highest abundance recorded in Doringrivier (4815.60 ± 18.96 mg CE g−1 DW), followed by Grootnek Fontein (4095.59 ± 170.34 mg CE g−1 DW), whereas Rhodes Memorial contained significantly lower levels (759.86 ± 46.93 mg CE g−1 DW). Rutin is a widely distributed flavonol glycoside with well-documented antioxidant activity [15,22].
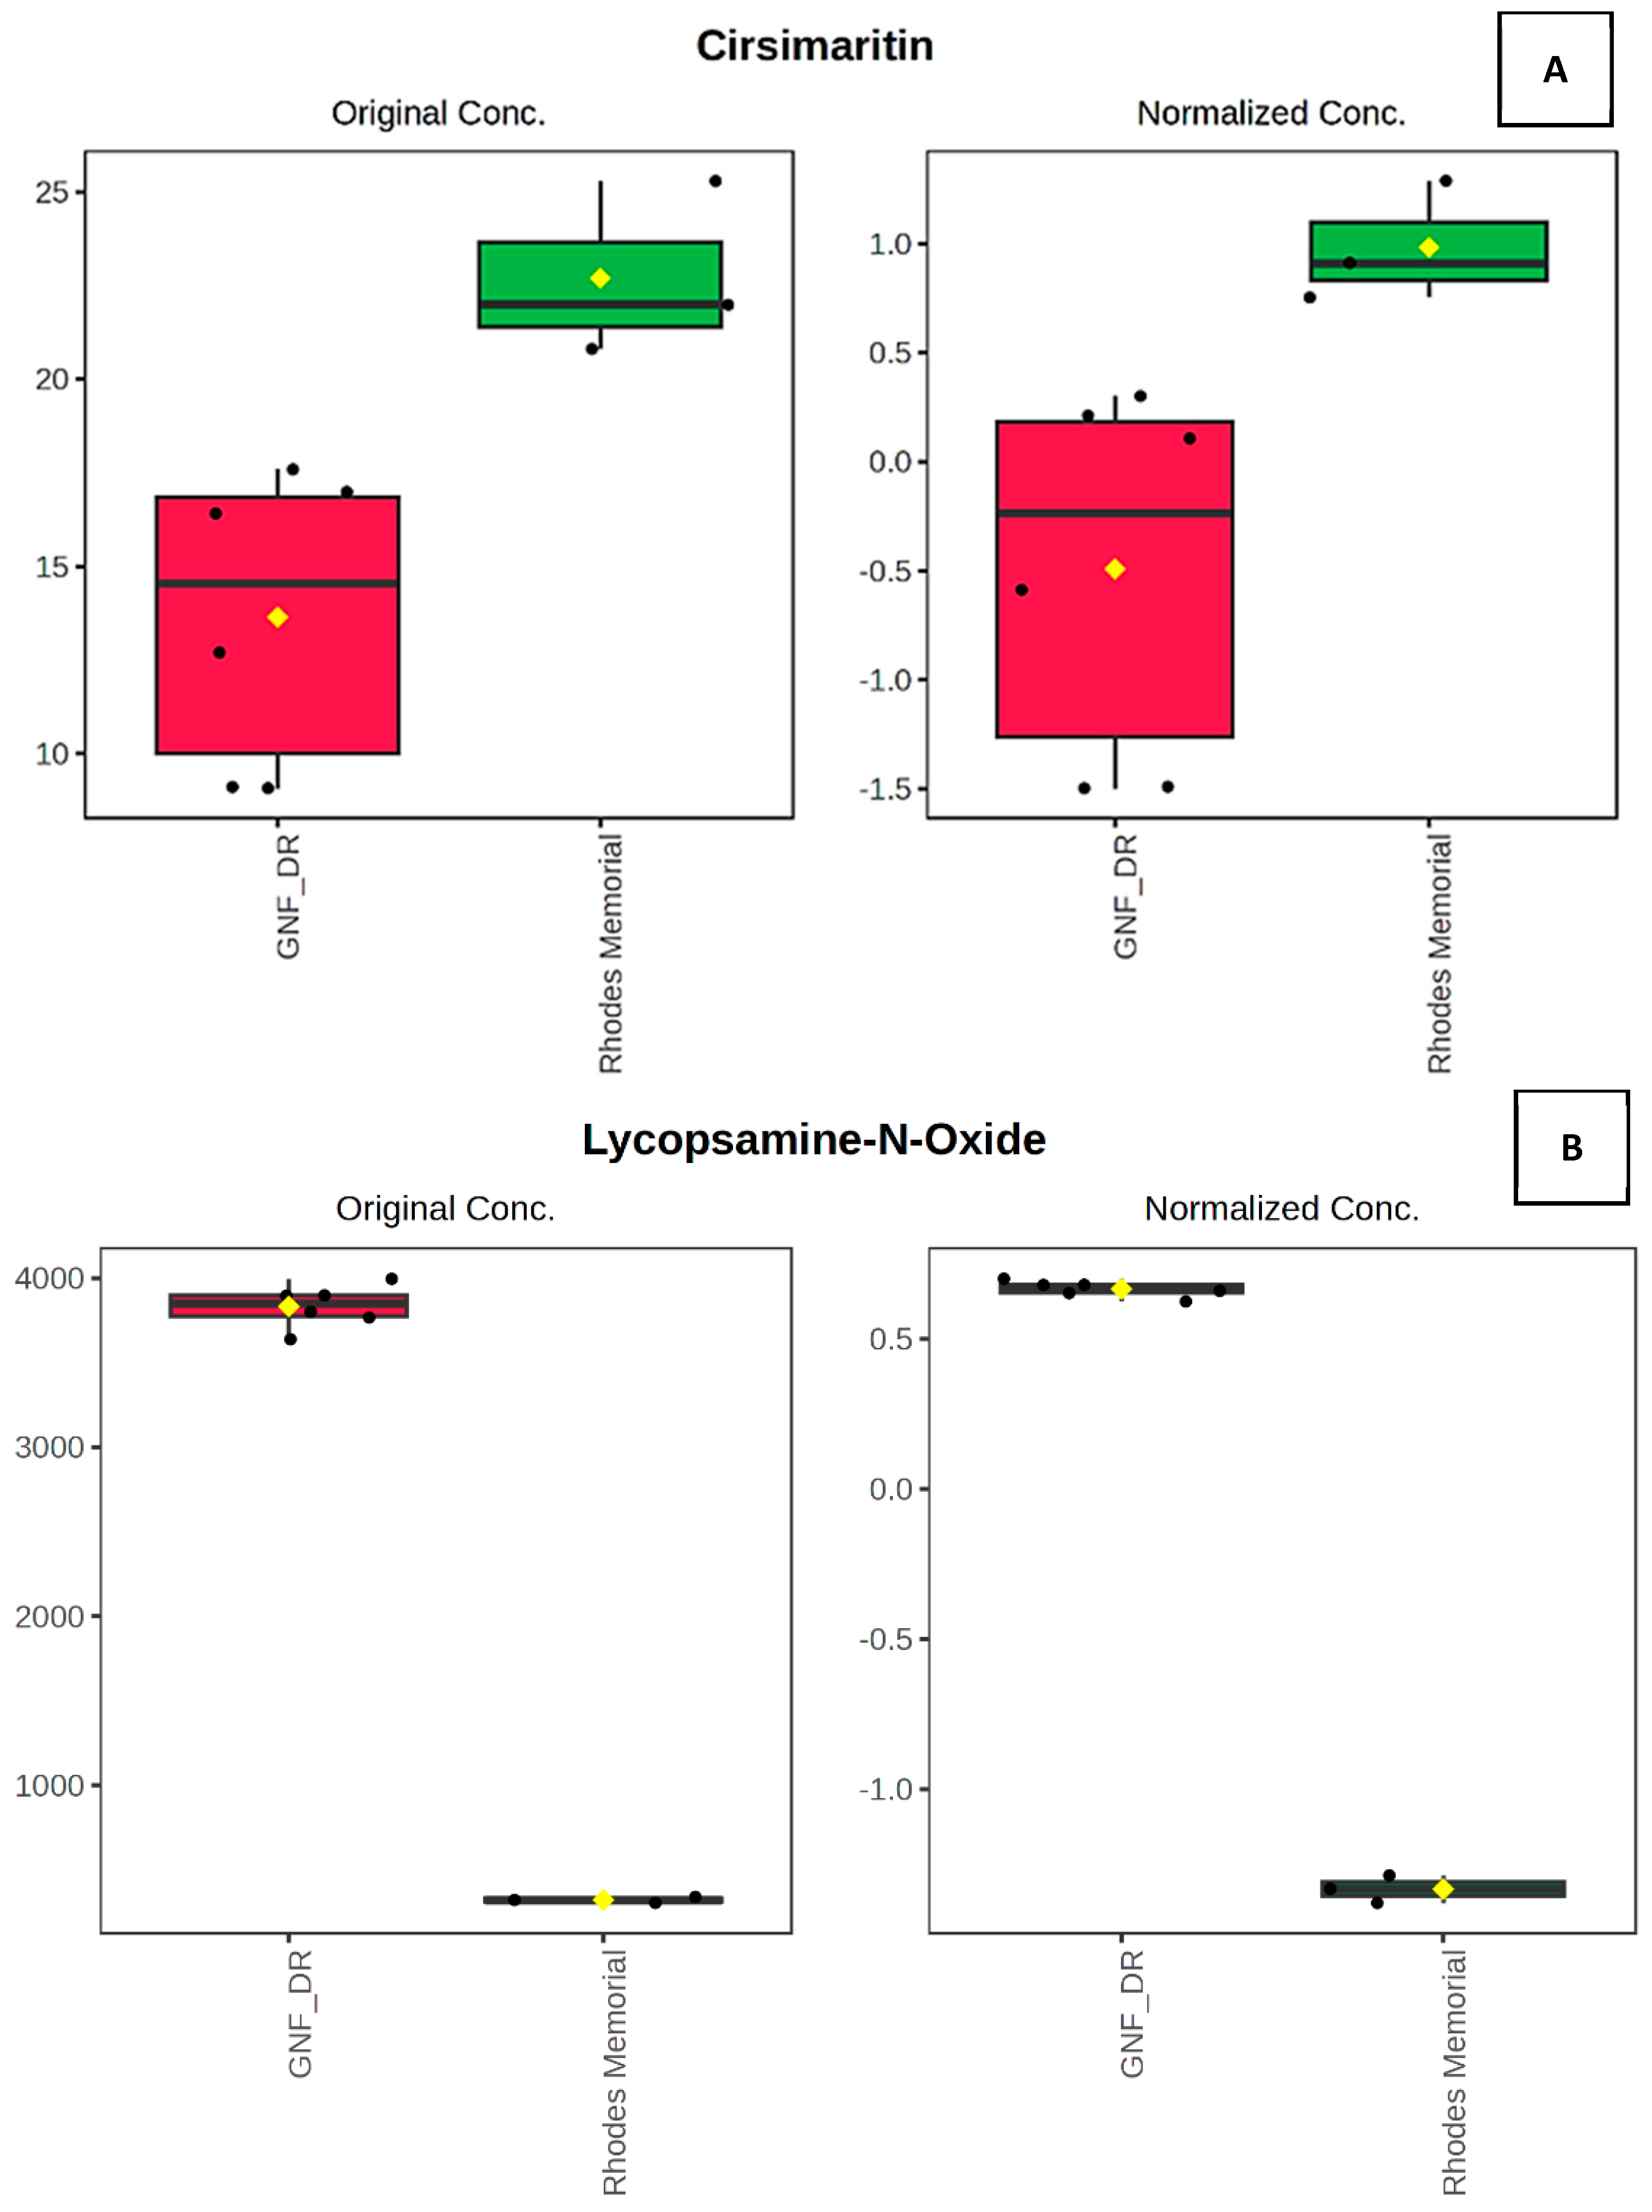
Cirsimaritin displayed an opposite geographical trend, with the highest abundance detected in Rhodes Memorial (22.69 ± 2.32 mg CE g−1 DW), followed by Doringrivier (16.97 ± 0.61 mg CE g−1 DW) and Grootnek Fontein (10.30 ± 2.11 mg CE g−1 DW). This contrasting distribution may reflect differences in flavonoid biosynthesis among the geographical populations. Cirsimaritin has previously been reported in several medicinal plant species, including Microtea debilis, Cirsium japonicum, Lithocarpus dealbatus, Ocimum sanctum, and Artemisia judaica, where it has been associated with antioxidant and anti-inflammatory activities [23,24,25,26].
Additional flavonoids also exhibited location-dependent accumulation patterns. Jaceidin 7-rhamnoside showed significant (p < 0.05) geographical variation, with the highest abundance recorded in Rhodes Memorial (95.01 ± 17.28 mg CE g−1 DW), followed by Doringrivier (63.59 ± 2.20 mg CE g−1 DW), whereas Grootnek Fontein contained the lowest abundance (24.94 ± 0.05 mg CE g−1 DW). Similarly, kaempferol was most abundant in Rhodes Memorial (79.19 ± 1.56 mg CE g−1 DW), followed by Doringrivier (48.58 ± 2.91 mg CE g−1 DW) and Grootnek Fontein (44.71 ± 2.70 mg CE g−1 DW). These geographical differences in flavonoid accumulation further demonstrate the influence of environmental conditions on secondary metabolite biosynthesis and contribute to the chemotypic differentiation observed among the three L. fruticosus populations [22,27].

3.1.2. Phenolic Acid Derivatives and Phenylpropanoids

Phenolic acid derivatives constituted the predominant metabolite class detected in L. fruticosus. Rosmarinic acid was the most abundant metabolite identified and differed significantly (p < 0.05) among the three populations, with the highest relative abundance estimate recorded in Doringrivier (3846.89 ± 285.78 mg CE g−1 DW), followed by Grootnek Fontein (3289.76 ± 870.83 mg CE g−1 DW), whereas Rhodes Memorial exhibited significantly lower relative abundance estimates (1953.26 ± 109.68 mg CE g−1 DW). Rosmarinic acid is a characteristic phenylpropanoid of the Boraginaceae family and contributes substantially to the antioxidant capacity of many medicinal plants [28,29].
Rabdosiin and the caffeic acid oligomers globoidnan A and globoidnan B also exhibited significant geographical variation (p < 0.05). Rabdosiin showed the highest relative abundance estimates in Doringrivier (5142.10 ± 651.00 mg CE g−1 DW), followed by Grootnek Fontein (4398.16 ± 124.51 mg CE g−1 DW), whereas Rhodes Memorial exhibited substantially lower relative abundance estimates (1255.87 ± 184.74 mg CE g−1 DW). A similar trend was observed for globoidnan B, which showed higher relative abundance estimates in Doringrivier (3449.69 ± 59.51 mg CE g−1 DW) and Grootnek Fontein (3582.69 ± 99.60 mg CE g−1 DW) than in Rhodes Memorial (1273.44 ± 49.93 mg CE g−1 DW). Conversely, globoidnan A showed the highest relative abundance estimate in Grootnek Fontein (835.08 ± 51.23 mg CE g−1 DW), followed by Doringrivier (692.13 ± 6.16 mg CE g−1 DW), while Rhodes Memorial exhibited the lowest relative abundance estimate (588.09 ± 4.73 mg CE g−1 DW). These caffeic acid oligomers are implicated in antioxidant defence and plant protection against environmental stress [6,30].
Schizotenuin F also exhibited significant differences among populations, with the highest relative abundance estimate observed in Grootnek Fontein (284.07 ± 8.90 mg CE g−1 DW), followed by Doringrivier (261.78 ± 9.76 mg CE g−1 DW), while considerably lower relative abundance estimates were detected in Rhodes Memorial (96.16 ± 17.39 mg CE g−1 DW). Collectively, the variation observed among these phenolic acid derivatives indicates that environmental conditions may influence secondary metabolite biosynthesis and contribute to the chemotypic differentiation of L. fruticosus populations [30].

3.1.3. Lignan and Related Compounds

Among the lignan-related metabolites, sagerinic acid exhibited significant (p < 0.05) geographical variation, with the highest relative abundance estimate recorded in Doringrivier (1990.83 ± 11.24 mg CE g−1 DW), followed by Grootnek Fontein (1331.93 ± 74.89 mg CE g−1 DW), whereas Rhodes Memorial exhibited the lowest relative abundance estimate (713.98 ± 18.48 mg CE g−1 DW). Sagerinic acid is a caffeic acid tetramer derived from the phenylpropanoid pathway and has been associated with antioxidant activity and plant defence against abiotic stress [30]. The lignan-type metabolites lirioresinol A and (−)-steganacin also differed significantly among populations. Lirioresinol A showed the highest relative abundance estimate in Grootnek Fontein (53.55 ± 7.07 mg CE g−1 DW), followed by Rhodes Memorial (40.64 ± 3.66 mg CE g−1 DW) and Doringrivier (32.91 ± 0.08 mg CE g−1 DW). Similarly, (−)-steganacin exhibited the highest relative abundance estimate in Grootnek Fontein (40.85 ± 13.22 mg CE g−1 DW), while considerably lower relative abundance estimates were detected in Rhodes Memorial (13.11 ± 1.05 mg CE g−1 DW) and Doringrivier (1.88 ± 0.16 mg CE g−1 DW). Lignans play important roles in plant defence and oxidative stress tolerance and may contribute to the ecological adaptation of L. fruticosus populations growing under different environmental conditions [31].

3.1.4. Glycosides and Other Specialized Metabolites

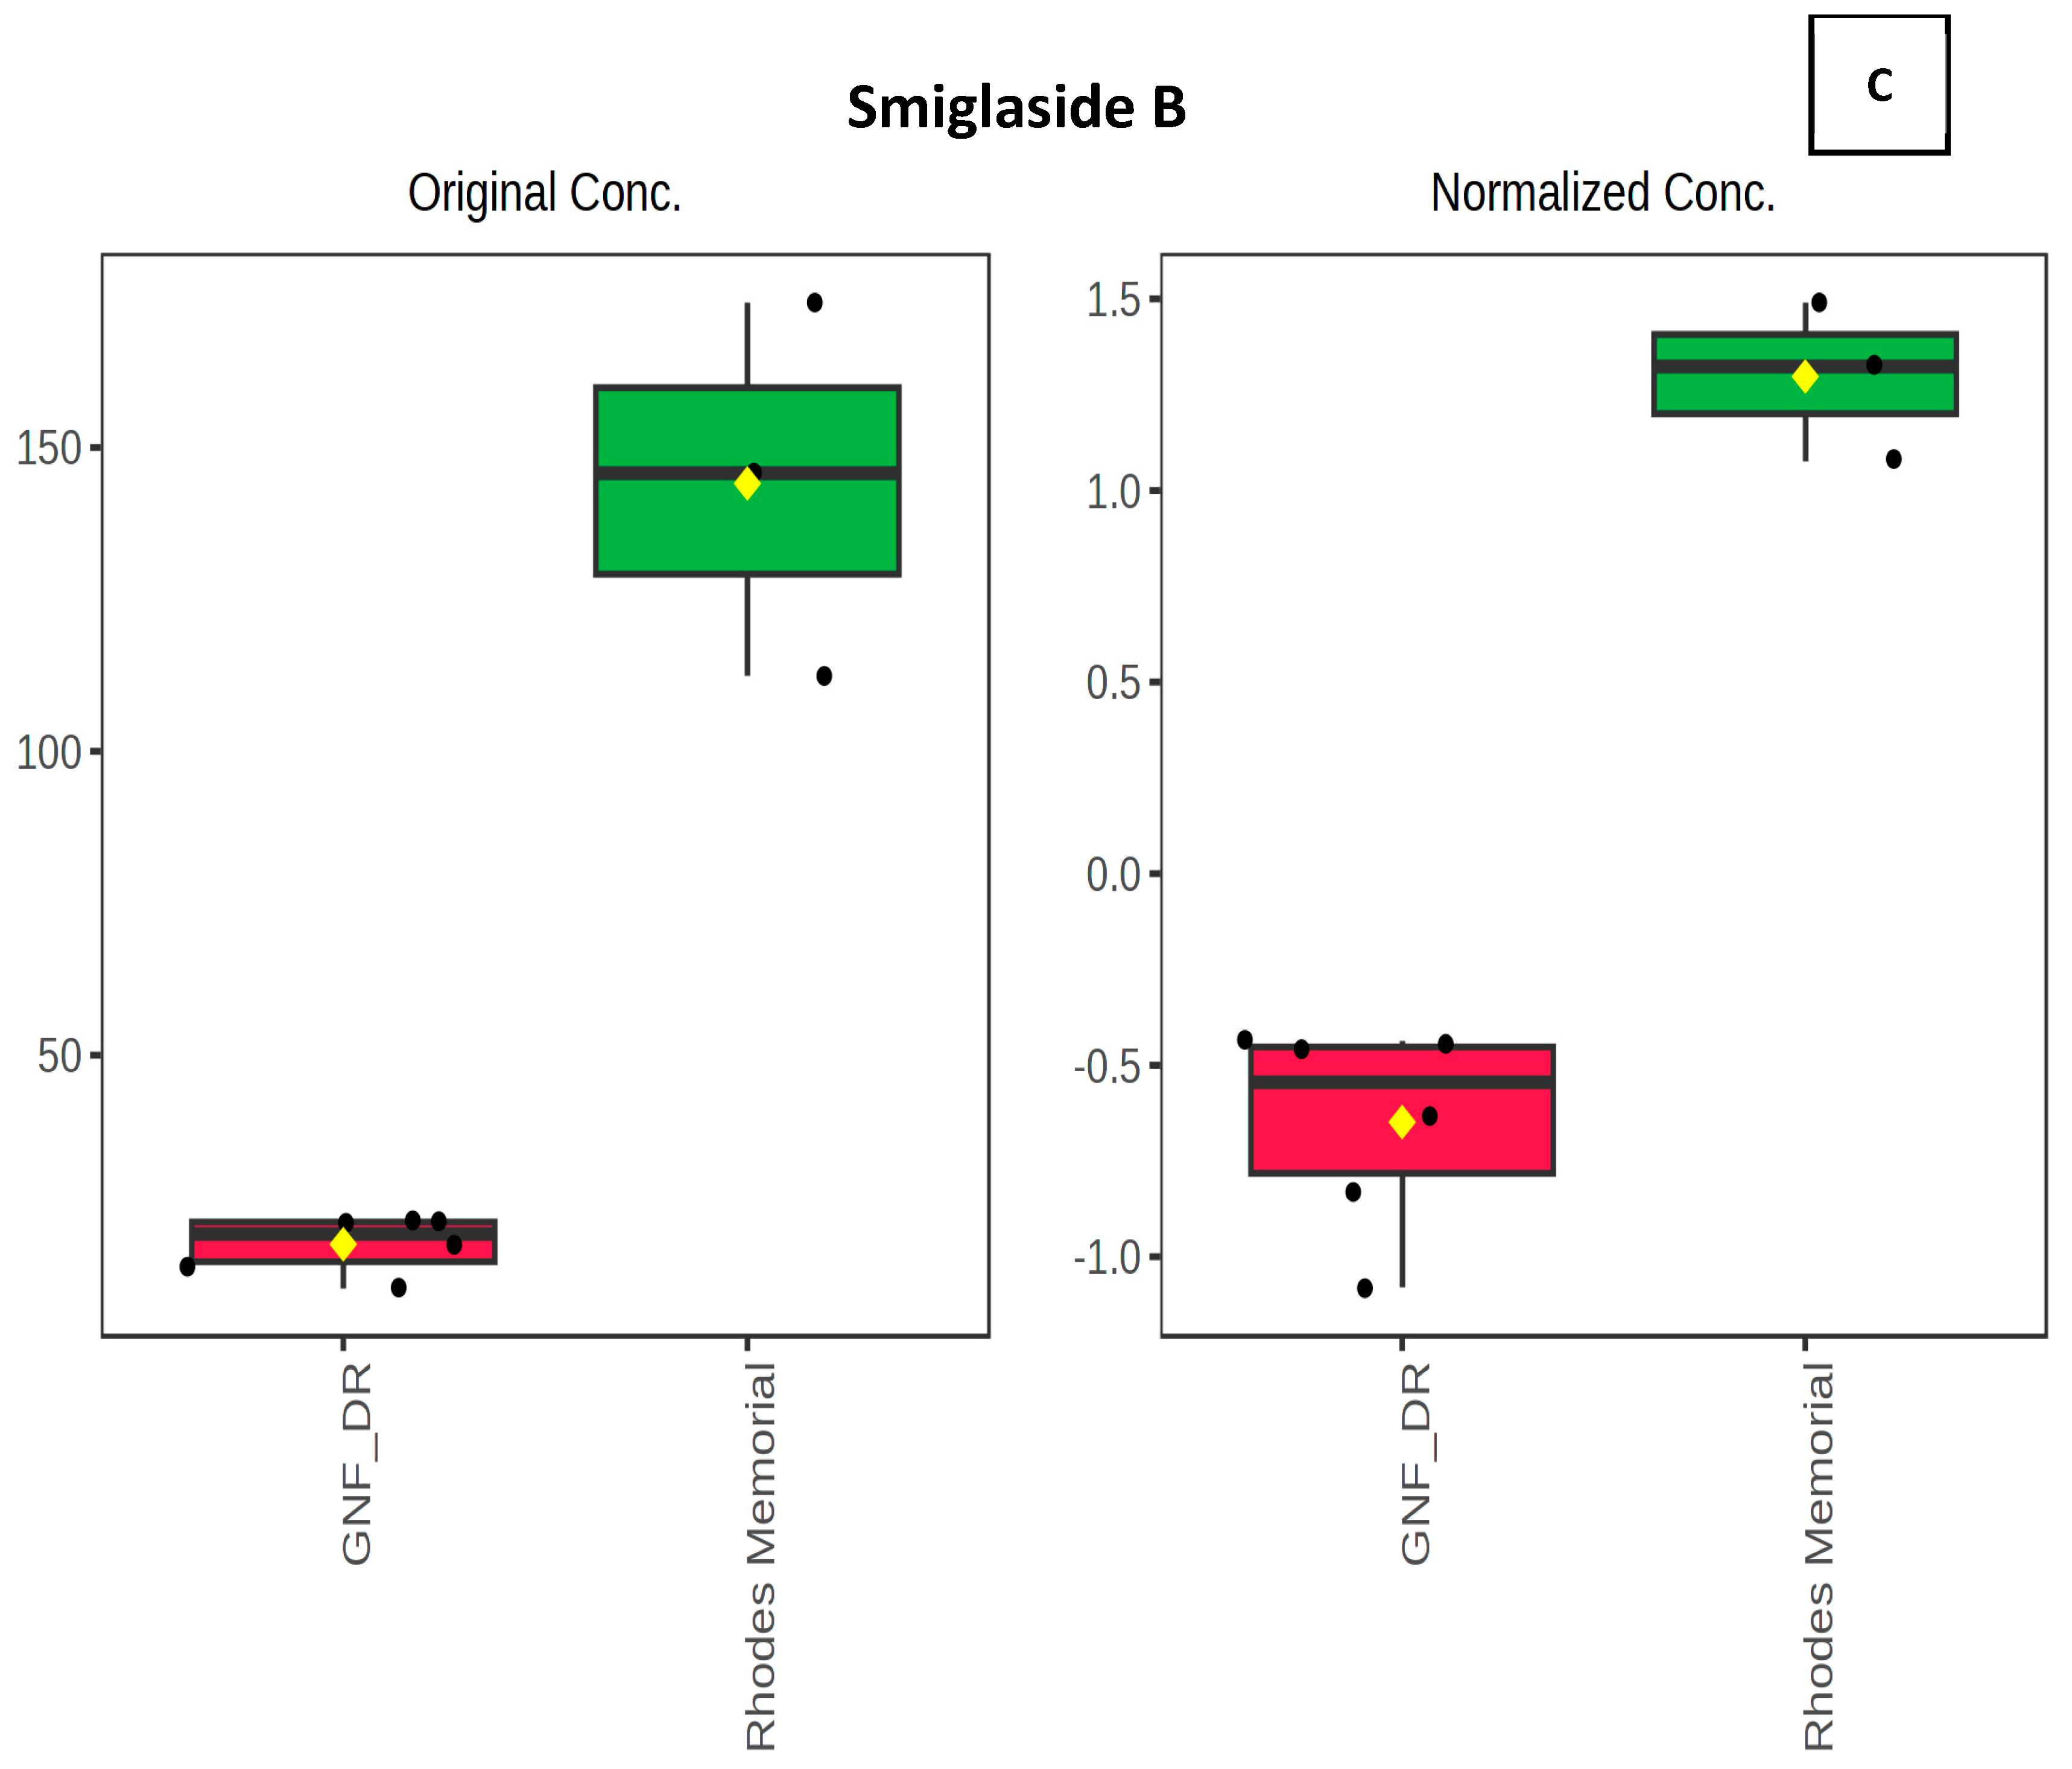
Several glycosylated secondary metabolites also exhibited significant geographical variation among the three L. fruticosus populations. Smiglaside B showed the highest relative abundance estimate in Rhodes Memorial (144.05 ± 30.77 mg CE g−1 DW), whereas substantially lower relative abundance estimates were recorded in Doringrivier (22.59 ± 0.30 mg CE g−1 DW) and Grootnek Fontein (15.13 ± 3.52 mg CE g−1 DW). The greater relative abundance of Smiglaside B in the Rhodes Memorial population suggests that local environmental conditions may promote its biosynthesis. Phenolic glycosides such as Smiglaside B are associated with antioxidant activity and plant defence responses under environmental stress [32].
Senburiside III followed a similar pattern, exhibiting its highest relative abundance estimate in Rhodes Memorial (181.97 ± 12.63 mg CE g−1 DW), followed by Grootnek Fontein (149.72 ± 20.54 mg CE g−1 DW) and Doringrivier (85.76 ± 1.22 mg CE g−1 DW). In contrast, cosmosporaside B showed the highest relative abundance estimate in Doringrivier (56.29 ± 1.83 mg CE g−1 DW), with lower relative abundance estimates detected in Grootnek Fontein (33.61 ± 8.54 mg CE g−1 DW) and Rhodes Memorial (24.69 ± 1.36 mg CE g−1 DW). The contrasting distribution of these glycosylated metabolites contributes to the chemotypic differentiation observed among L. fruticosus populations.

3.2. Quantification of Pyrrolizidine Alkaloids

Targeted LC-MS/MS analysis of pyrrolizidine alkaloids (PAs) (Table 3) was performed using authentic lycopsamine and lycopsamine N-oxide reference standards. Ten targeted PAs were screened in L. fruticosus leaf extracts from the three geographical populations. Six PAs were detected, while the remaining compounds were below the limit of detection. Lycopsamine N-oxide was the predominant PA detected across all populations, with concentrations of 3.89, 3.77, and 0.32 mg kg−1 dry weight (DW) in Grootnek Fontein, Doringrivier, and Rhodes Memorial, respectively. Lycopsamine + indicine occurred at lower concentrations, ranging from 0.001 to 0.100 mg kg−1 DW. Other detected alkaloids, including seneciphylline N-oxide/spatioidine N-oxide, integerrimine N-oxide, intermedine, and echimidine N-oxide, were present only at trace levels (0.001 mg kg−1 DW) and were detected in one or two populations.
The total detected PA concentration was 3.894 mg kg−1 DW in Grootnek Fontein, 3.880 mg kg−1 DW in Doringrivier, and 0.343 mg kg−1 DW in Rhodes Memorial. These values were considerably lower than the previously reported PA concentrations of 53–169 mg kg−1 for L. fruticosus [10]. Although targeted PA analysis was performed using single composite samples per population and therefore does not allow statistical comparison among populations, the observed variation suggests differences in PA accumulation among geographical populations.
The predominance of lycopsamine N-oxide agrees with previous reports identifying this compound as the major pyrrolizidine alkaloid in L. fruticosus [9]. In Boraginaceae species, PAs commonly occur as N-oxide derivatives, which serve as storage forms due to their higher water solubility and reduced phytotoxicity within plant tissues [33,34]. Differences in PA composition among populations may be influenced by environmental factors and nutrient status, although genetic contributions cannot be excluded.
Although PAs are recognized for their potential hepatotoxic and genotoxic effects following metabolic activation [13], the concentrations detected in this study were relatively low compared with previously reported values. Nevertheless, the detection of these compounds highlights the importance of PA monitoring in L. fruticosus, particularly where medicinal or commercial applications are considered. Future studies incorporating larger sample sizes, biological replication, seasonal sampling, and controlled cultivation experiments are required to better understand the environmental and genetic factors regulating PA accumulation and to support quality and safety assessment of this species.

3.3. Multivariate Analysis and Chemotypic Variation in Lobostemon fruticosus

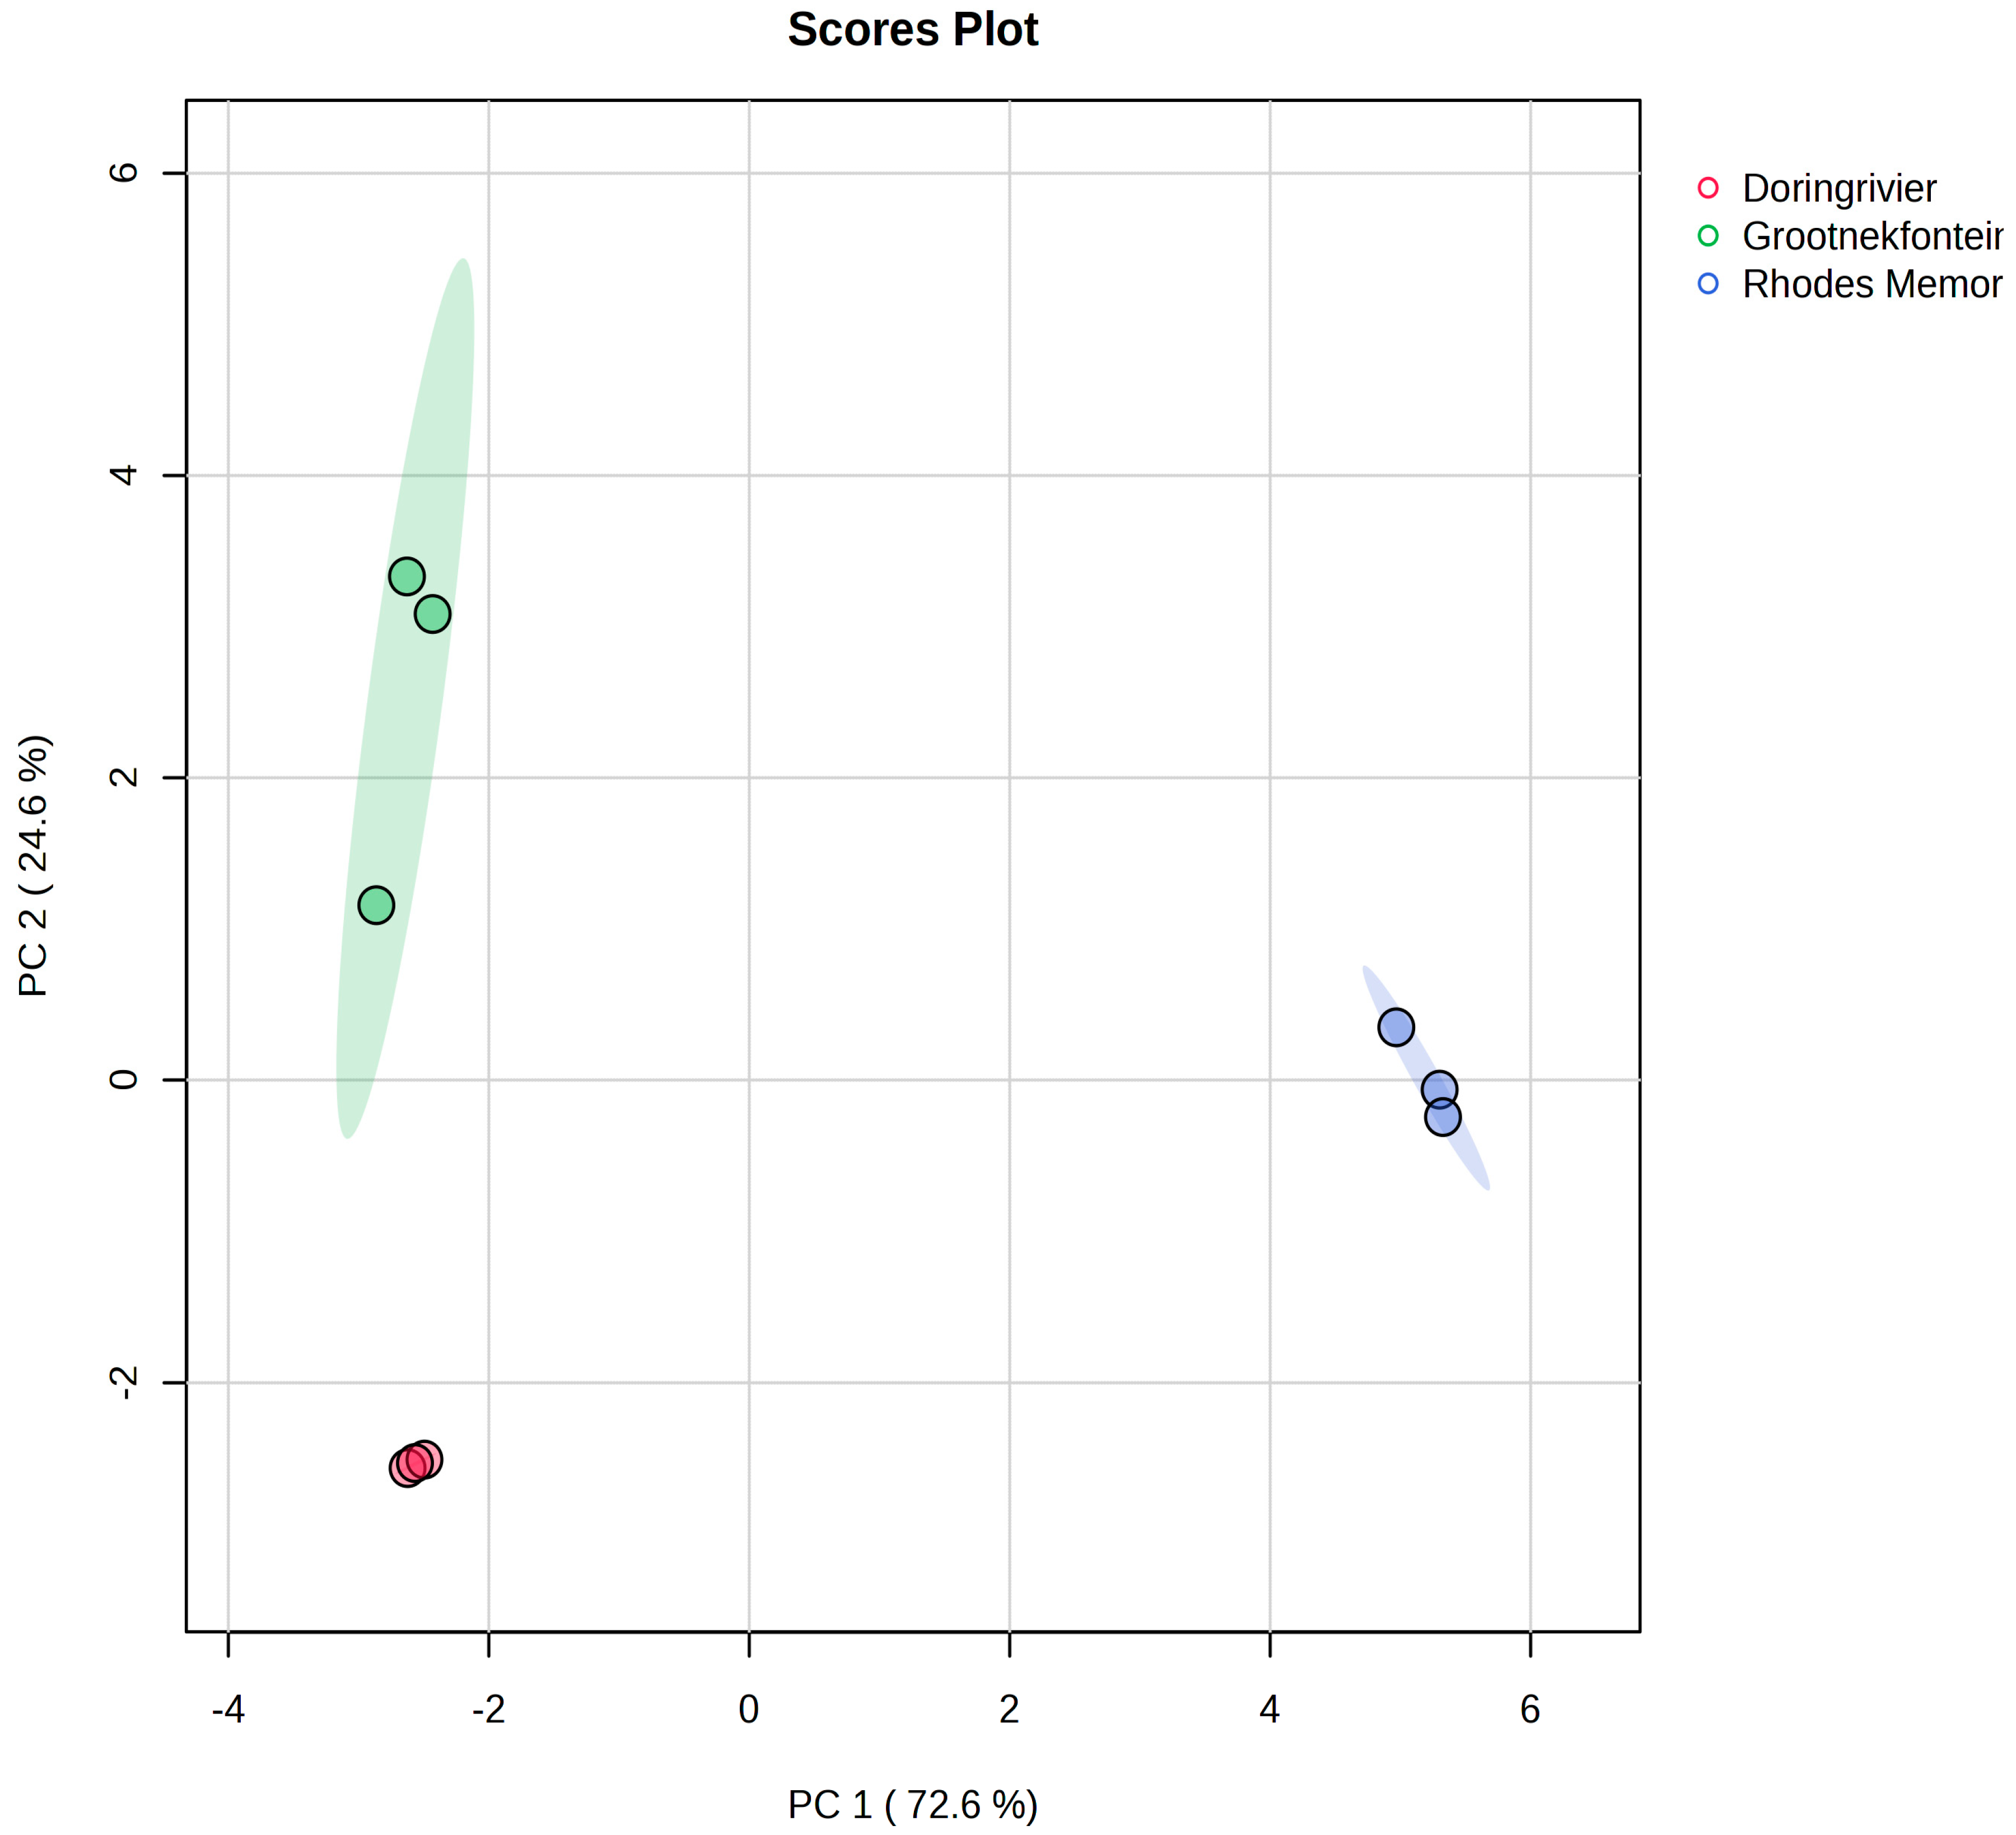
The high sensitivity and mass accuracy of UPLC-QTOF-MS enabled comprehensive metabolite profiling of L. fruticosus, revealing marked phytochemical variation among the three geographical populations. Principal Component Analysis (PCA), performed using the processed metabolomic feature matrix generated following MarkerLynx preprocessing, demonstrated clear chemotypic differentiation among the three geographical populations. The first two principal components explained 97.2% of the total variation (PC1 = 72.6%; PC2 = 24.6%) (Figure 3). The three geographical populations formed distinct and non-overlapping clusters, indicating pronounced differences in their secondary metabolite composition. The PCA score plot (Figure 3) showed that Principal Component 1 (PC1) primarily separated the Rhodes Memorial population from the Doringrivier and Grootnek Fontein populations, whereas Principal Component 2 (PC2) distinguished Doringrivier from Grootnek Fontein. The close clustering of biological replicates within each population indicates good analytical reproducibility and low within-population variability, while the clear separation among populations suggests substantial chemotypic divergence associated with geographical origin.
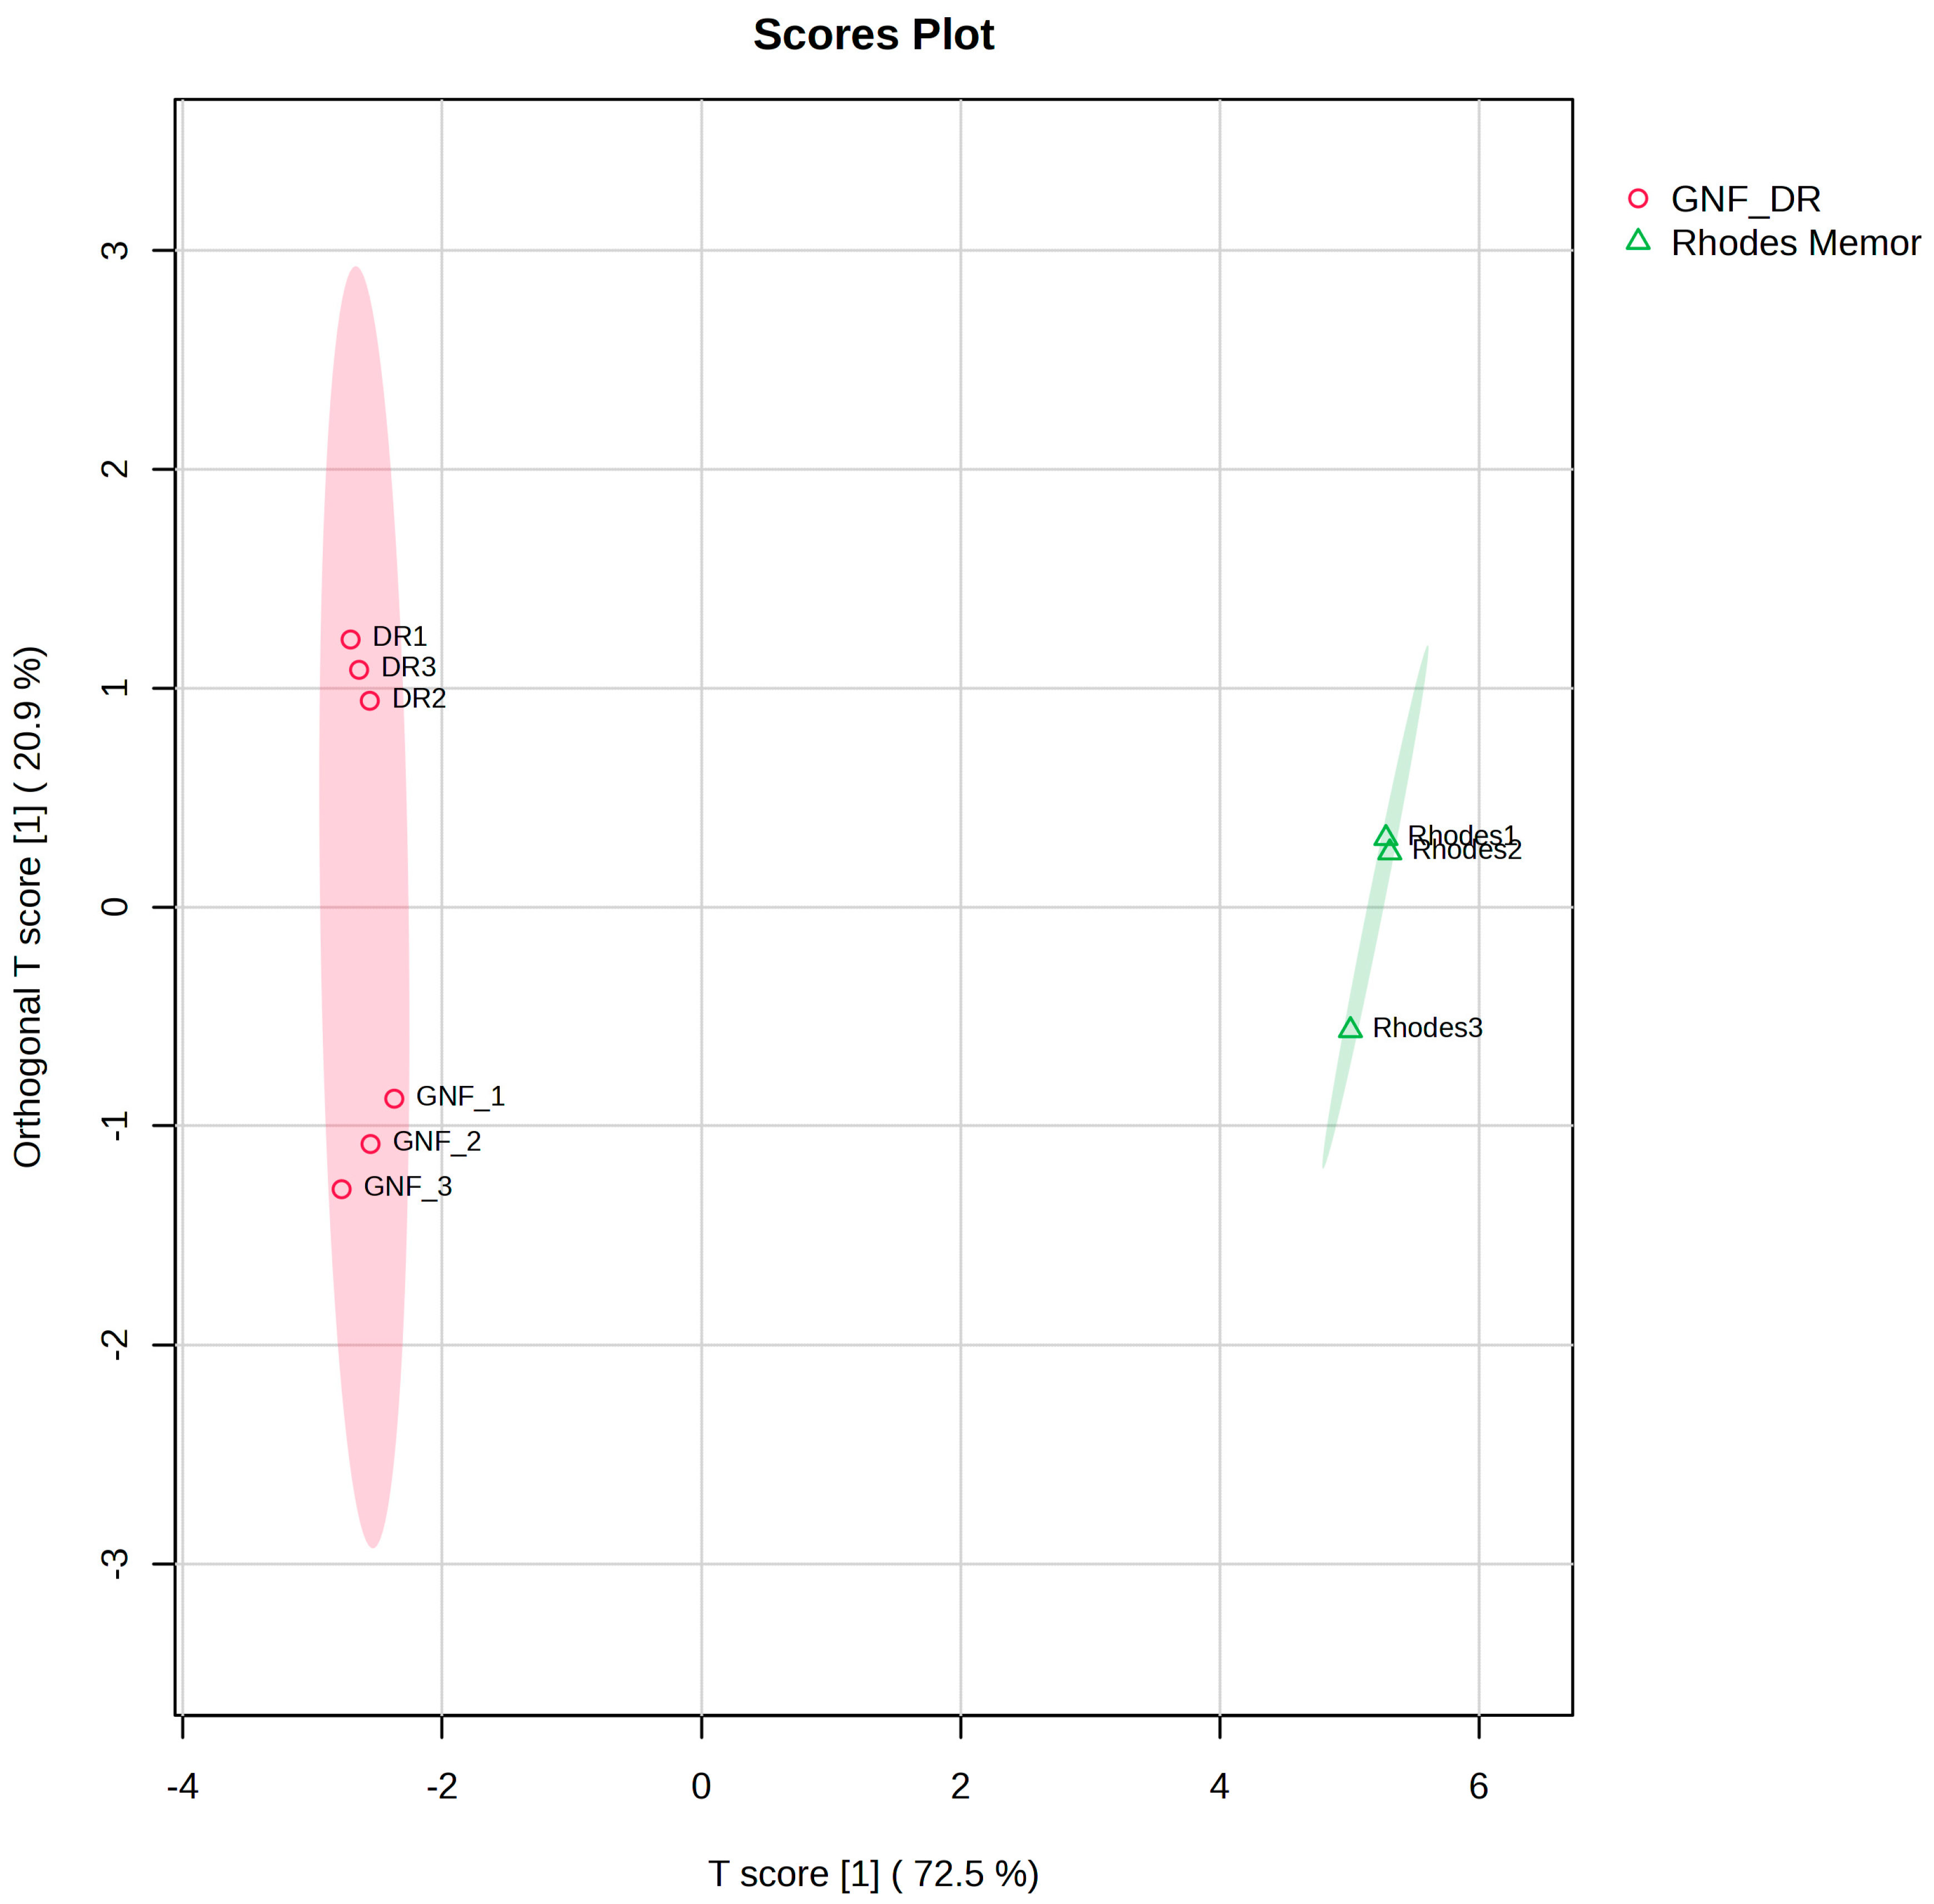
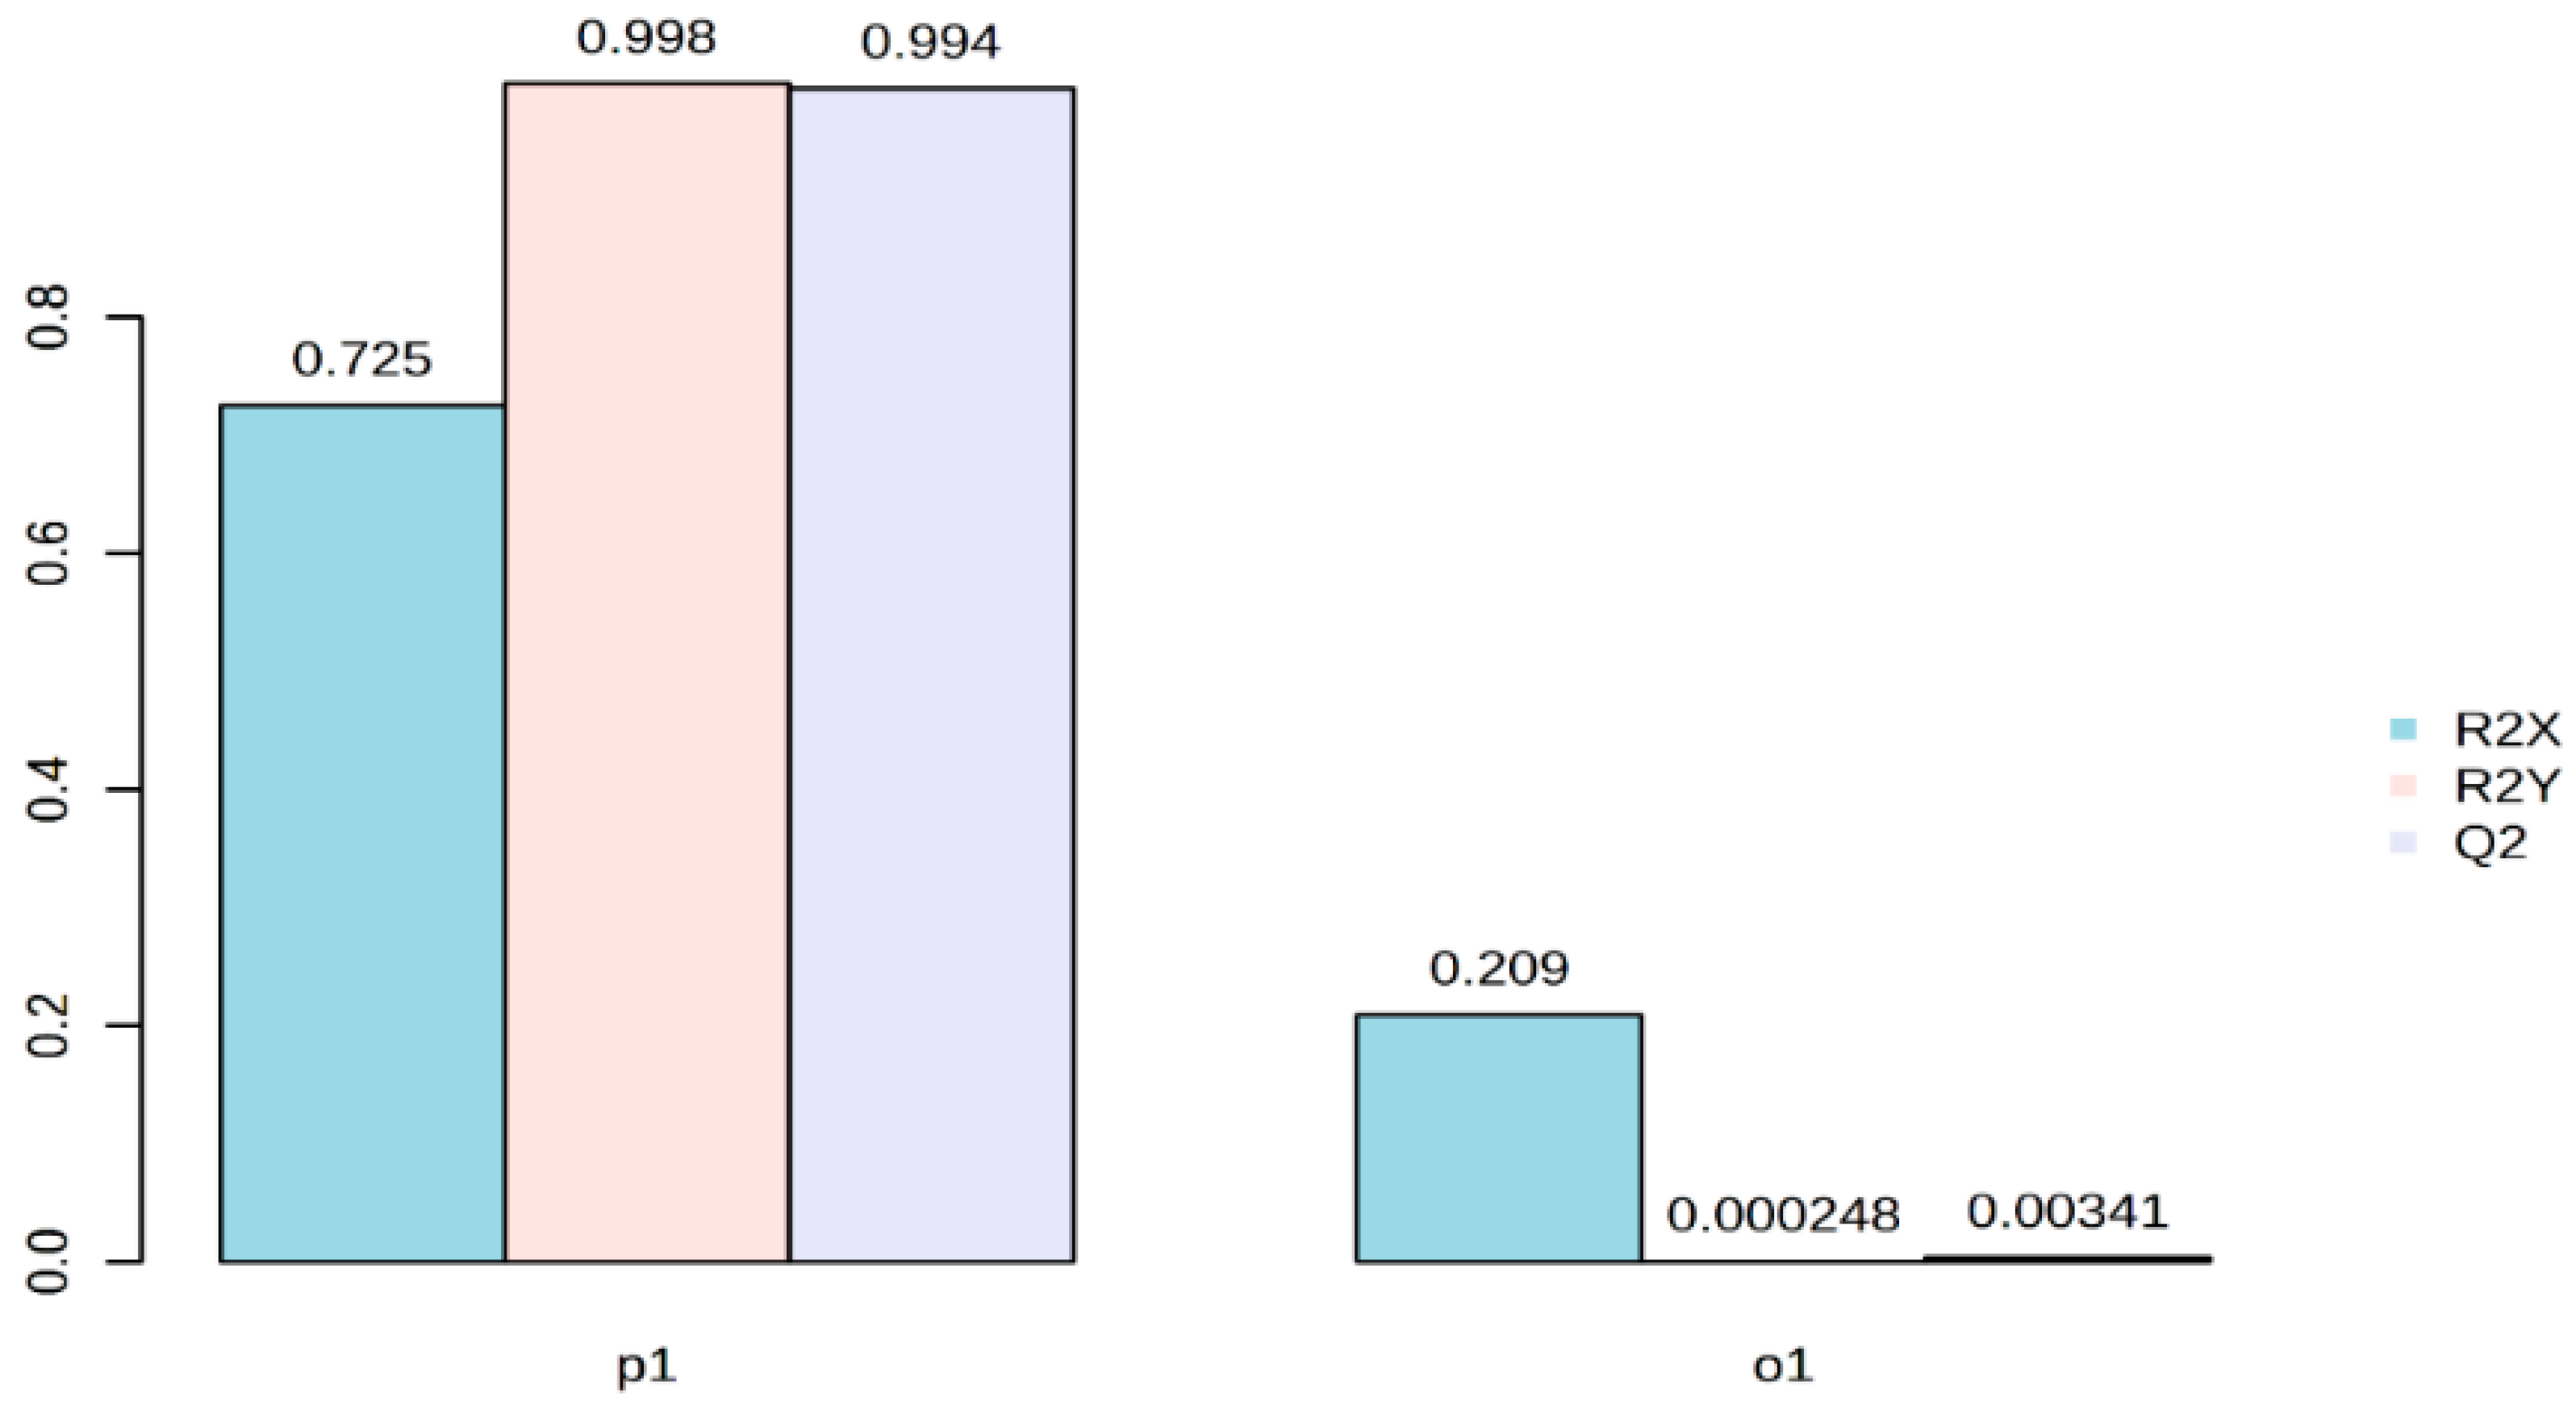
To facilitate group comparisons, Orthogonal Partial Least Squares-Discriminant Analysis (OPLS-DA) was performed by combining the Doringrivier and Grootnek Fontein populations into a single group (GNF_DR) and comparing them with the Rhodes Memorial population. This grouping was based on the close geographical proximity of the Doringrivier and Grootnek Fontein sampling sites, which are situated adjacent to one another and experience similar environmental conditions. Consistent with this, the PCA showed that samples from these two populations clustered more closely together than with the Rhodes Memorial population, indicating greater similarity in their metabolite profiles. The OPLS-DA score plot (Figure 4) showed clear separation between the GNF_DR and Rhodes Memorial groups along the predictive component, indicating marked differences in metabolite composition. The OPLS-DA model yielded R2X = 0.725, R2Y = 0.998, and Q2 = 0.994 for the predictive component (Figure 5), indicating strong model fit and predictive ability. However, these results should be interpreted with caution due to the limited sample size, which may increase the risk of model overfitting. Nevertheless, the OPLS-DA results were consistent with the PCA model and support the existence of geographical variation in the metabolome of L. fruticosus.
Collectively, the PCA and OPLS-DA analyses demonstrate that geographical origin exerts a strong influence on the secondary metabolite composition of L. fruticosus. The observed chemotypic variation is likely associated with differences in environmental conditions, including climate, soil characteristics, altitude, water availability, and nutrient status among the study sites. Such geographical variation has important implications for the quality control, standardization, safety assessment, and therapeutic consistency of L. fruticosus-derived medicinal products.
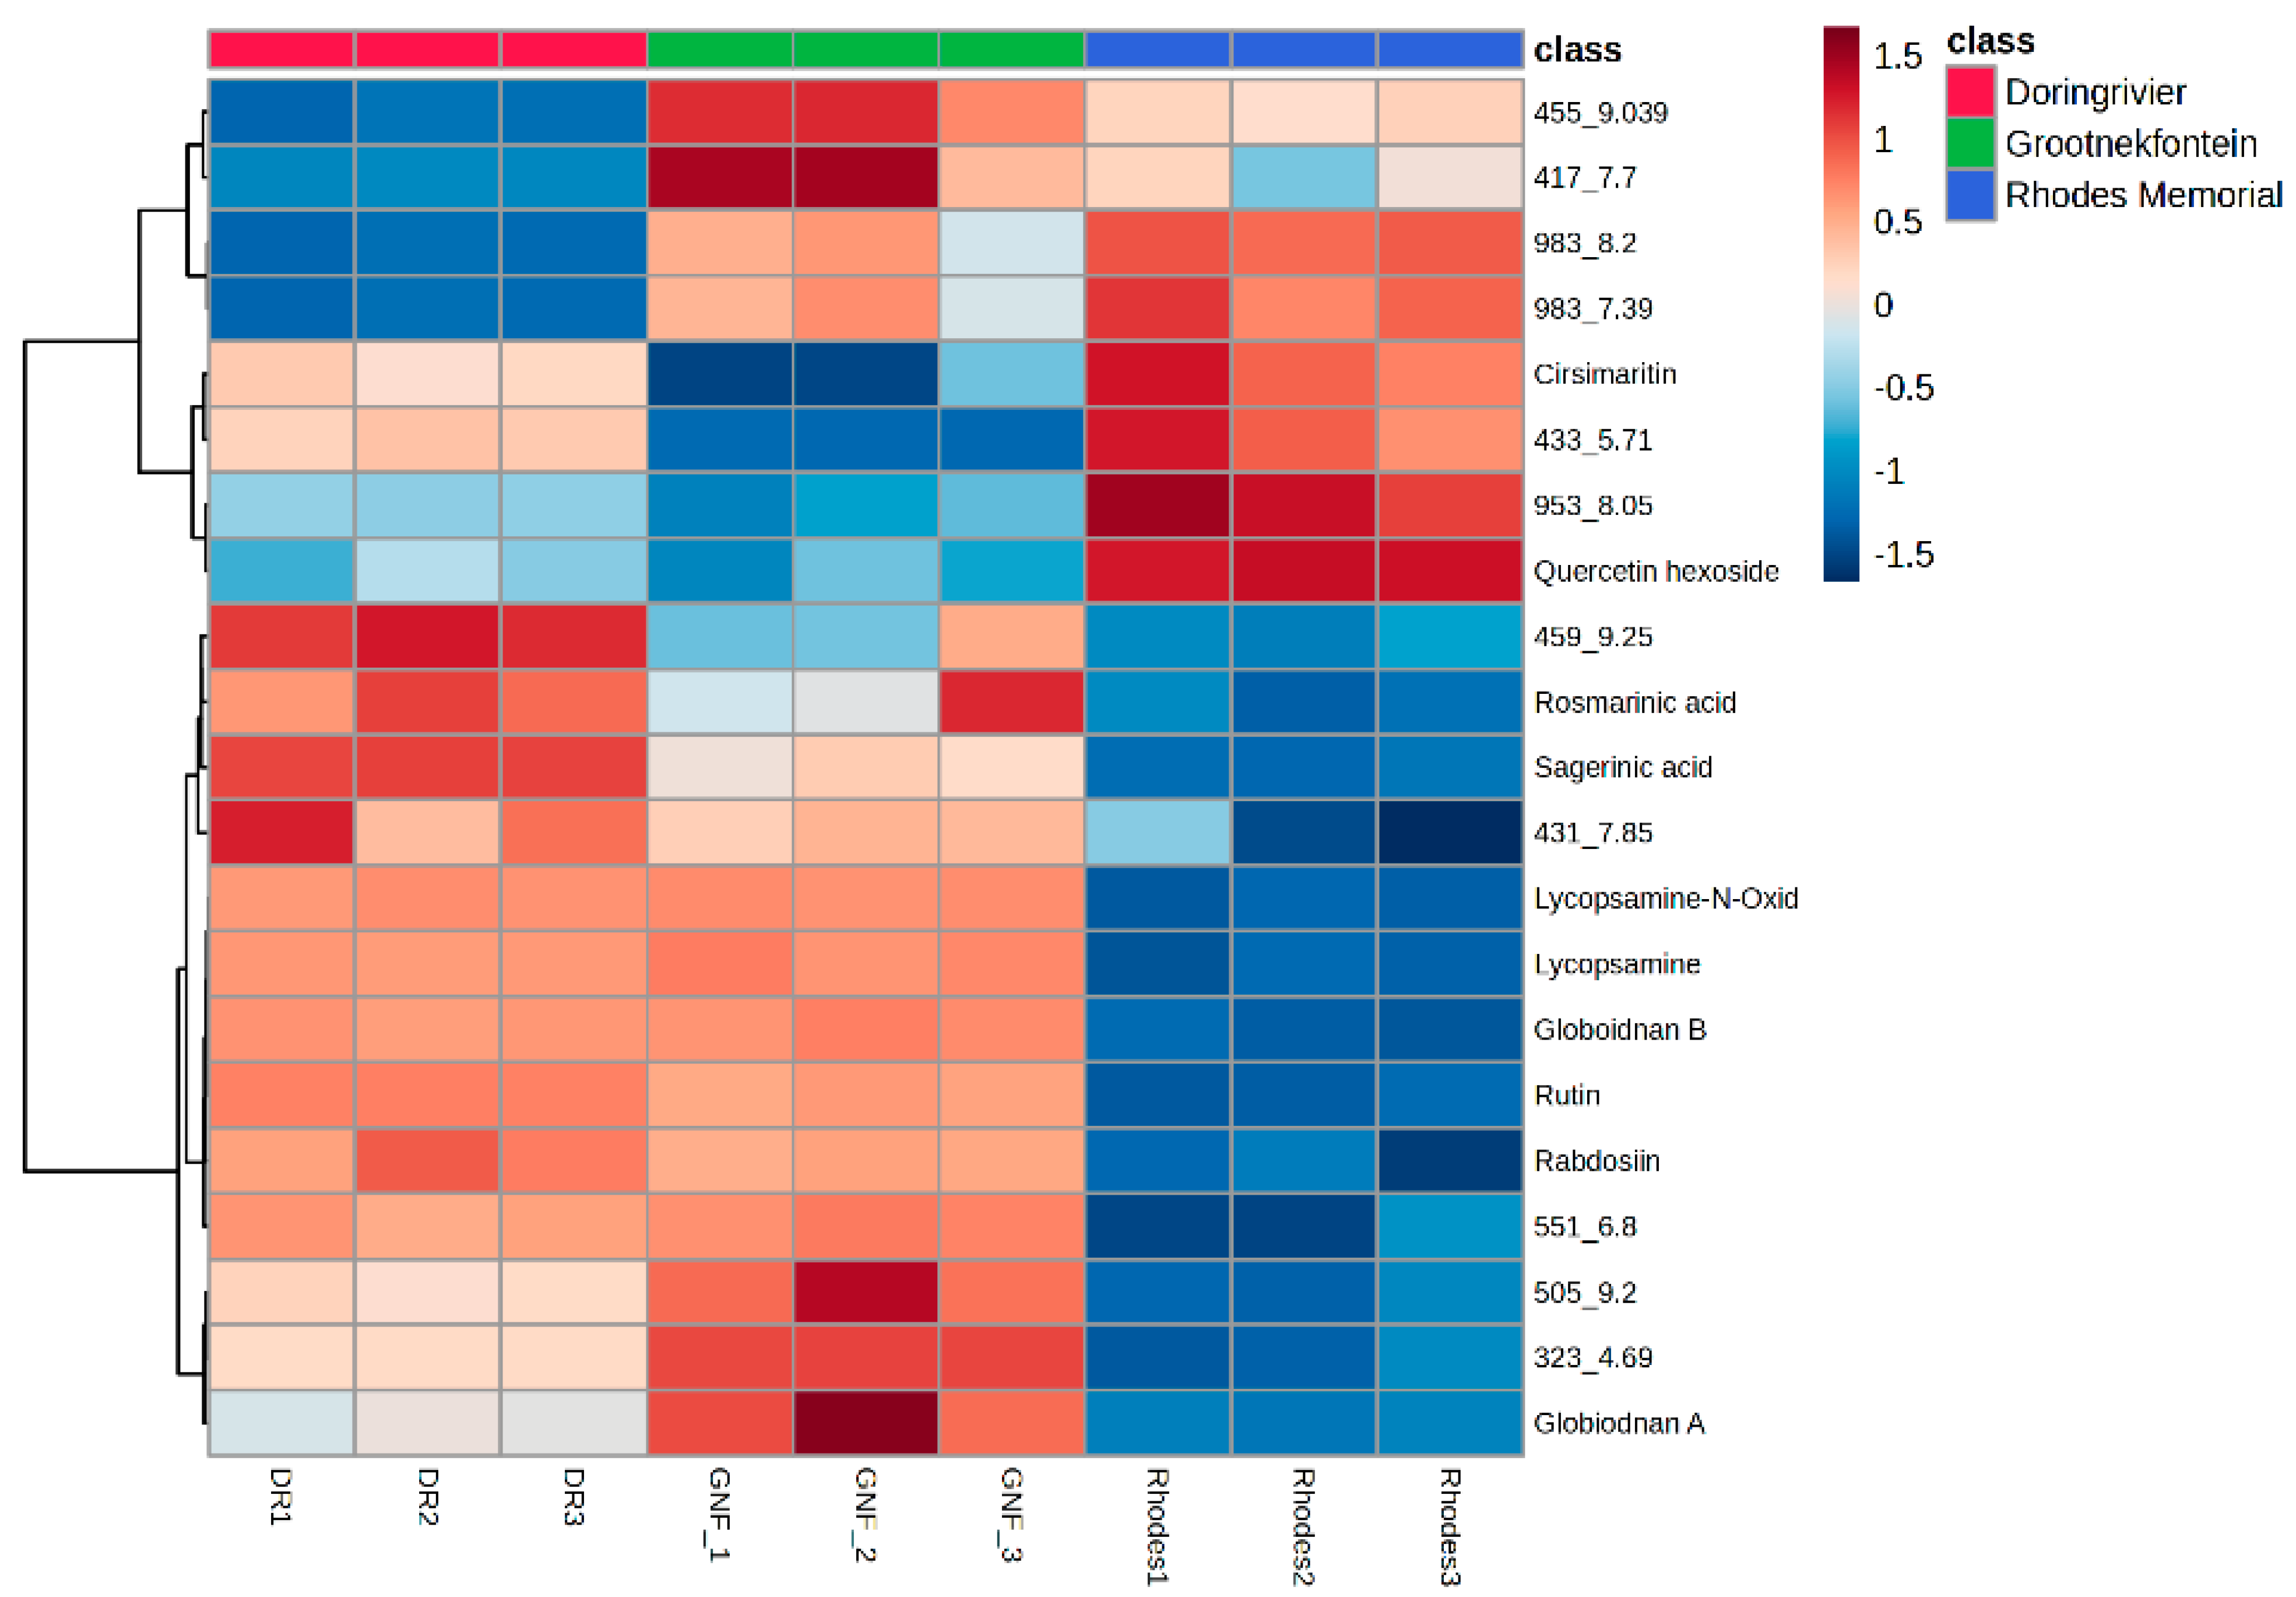
Heat map analysis further supported the multivariate statistical results by revealing distinct metabolite accumulation patterns among the three geographical populations (Figure 6). Hierarchical clustering grouped the Doringrivier and Grootnek Fontein populations together, whereas Rhodes Memorial formed a separate cluster. This clustering pattern is likely attributable to the close geographical proximity of the Doringrivier and Grootnek Fontein sites and their similar environmental conditions, which may have contributed to comparable metabolite accumulation patterns. Metabolites such as rosmarinic acid, sagerinic acid, globoidnan A, globoidnan B, rabdosiin, and rutin were generally more abundant in the Doringrivier and Grootnek Fontein populations, whereas cirsimaritin, kaempferol, jaceidin 7-rhamnoside, senburiside III, and Smiglaside B showed relatively greater abundance in the Rhodes Memorial population. These metabolite distribution patterns are consistent with the PCA and OPLS-DA models and further support the existence of distinct location-specific chemotypes in L. fruticosus.

3.4. Box-and-Whisker Plots of Selected Metabolites

Box-and-whisker plots of selected discriminatory metabolites further illustrated the geographical variation in metabolite abundance among the three L. fruticosus populations (Figure 7). Cirsimaritin exhibited consistently greater abundance in the Rhodes Memorial population compared with the Doringrivier and Grootnek Fontein populations (Figure 7A). In addition, Rhodes Memorial samples displayed relatively narrow interquartile ranges, indicating lower within-population variability and a more uniform accumulation pattern for this metabolite. The higher abundance of cirsimaritin at this site may reflect differential regulation of flavonoid biosynthesis in response to local environmental conditions.
In contrast, lycopsamine N-oxide showed higher relative abundance in the Doringrivier and Grootnek Fontein populations compared with Rhodes Memorial (Figure 7B). This pattern agrees with the targeted LC-MS/MS analysis, which identified lycopsamine N-oxide as the predominant pyrrolizidine alkaloid detected across the three populations. Similarly, Smiglaside B exhibited greater abundance in Rhodes Memorial compared with the Doringrivier and Grootnek Fontein populations (Figure 7C). Collectively, these metabolites contributed to the chemotypic differentiation observed among the populations and represent potential chemical markers associated with geographical variation in L. fruticosus.
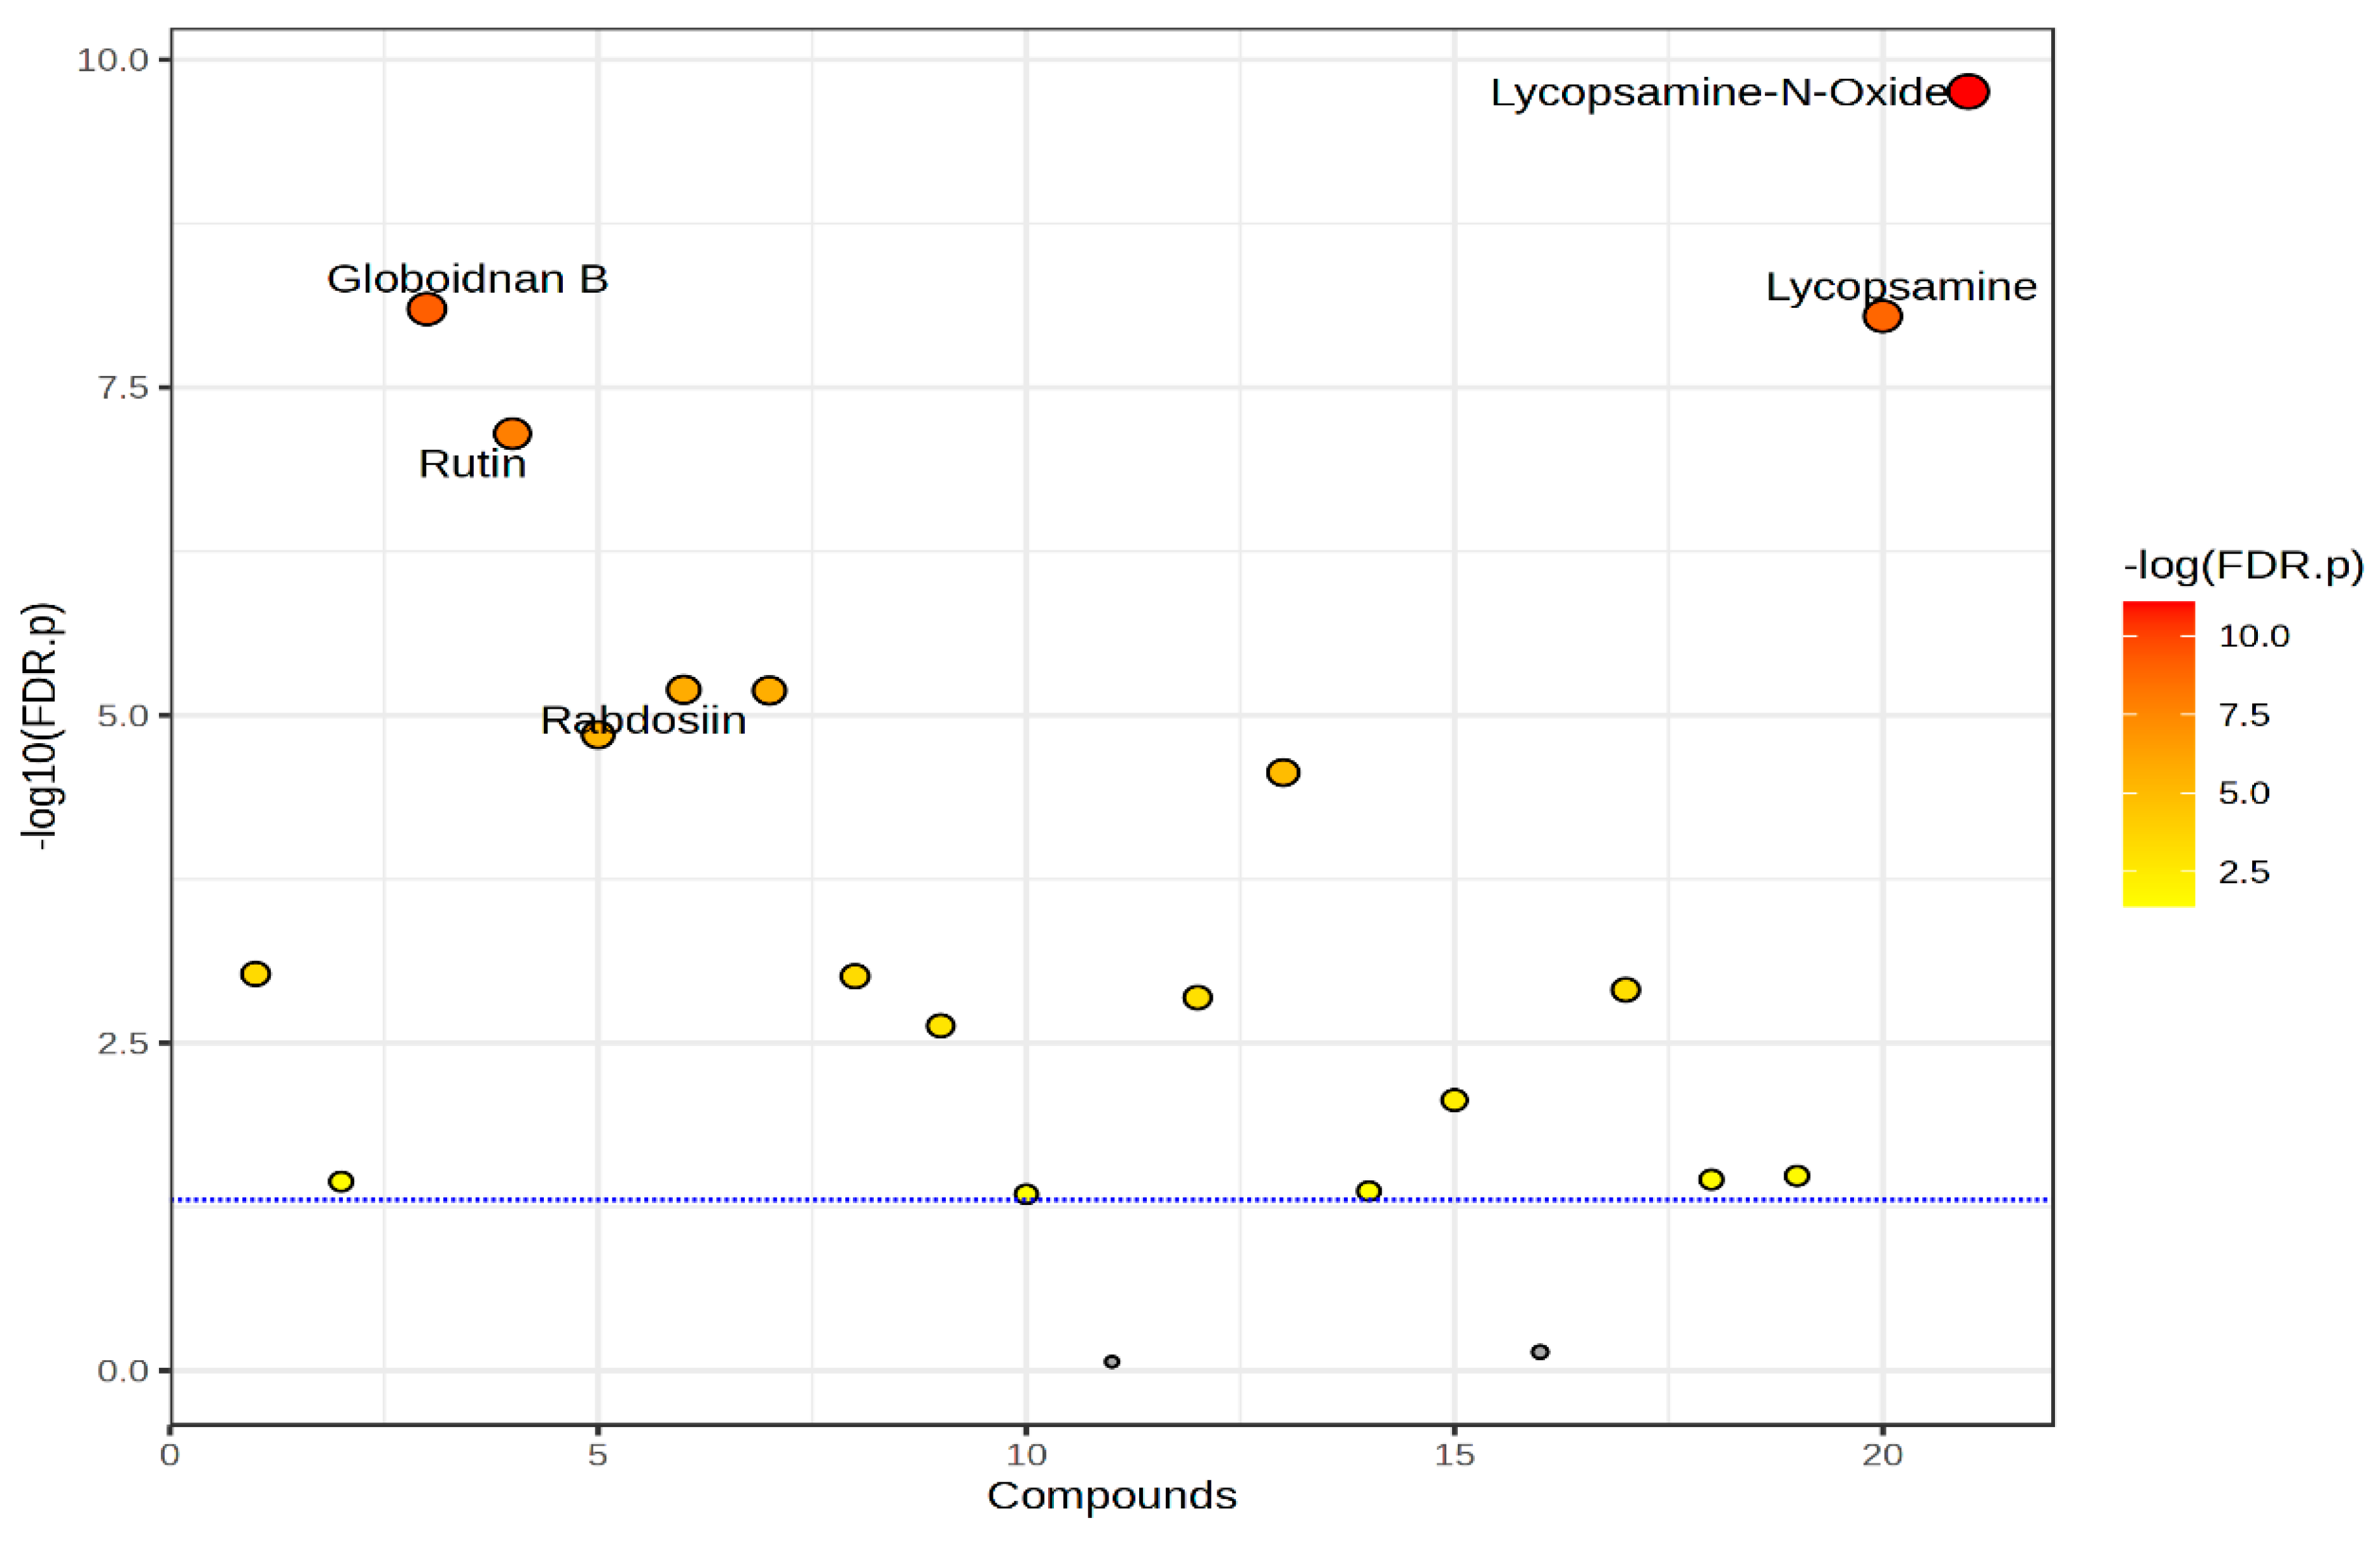
Differential metabolite significance analysis based on the untargeted UPLC-QTOF-MS dataset identified several metabolites that significantly distinguished the combined Doringrivier–Grootnek Fontein (GNF_DR) group from the Rhodes Memorial population (Figure 8; Table 4). Lycopsamine N-oxide, lycopsamine, globoidnan B, rutin, and rabdosiin were among the important discriminating features contributing to population separation. The detection of pyrrolizidine alkaloids within the untargeted metabolomic dataset further supports their contribution to chemotypic differentiation among L. fruticosus populations. These findings are consistent with the PCA, OPLS-DA, and heat map analyses, demonstrating that geographical origin influences both specialized metabolite composition and PA distribution within this species.

4. Conclusions

This study provides the first comprehensive comparison of the secondary metabolite profiles of L. fruticosus collected from the Rhodes Memorial, Doringrivier, and Grootnek Fontein populations in the Western Cape Province of South Africa using an integrated untargeted UPLC-QTOF-MS and targeted LC-MS/MS approach. Untargeted metabolite profiling resulted in the annotation of fifteen secondary metabolites at Metabolomics Standards Initiative (MSI) Level 2, representing diverse phytochemical classes, including flavonoids, phenolic acid derivatives, phenylpropanoids, lignans, sesquiterpenoids, and fatty acyl glycosides. Several compounds, including kaempferol, jaceidin 7-rhamnoside, schizotenuin F, senburiside III, cosmosporaside B, lirioresinol A, and (−)-steganacin, are reported for the first time in L. fruticosus, thereby expanding the currently known phytochemical diversity of this indigenous medicinal species.
Significant geographical variation was observed in the relative abundance of several secondary metabolites, particularly rutin, rosmarinic acid, rabdosiin, globoidnan A, globoidnan B, sagerinic acid, and several flavonoid and lignan derivatives. Chemometric analyses, including PCA, OPLS-DA, hierarchical clustering, and differential metabolite analysis, consistently demonstrated distinct chemotypic differentiation among the three geographical populations. These findings indicate that geographical origin, together with associated environmental factors such as soil characteristics, climate, altitude, and water availability, contributes substantially to variation in the secondary metabolite composition of L. fruticosus. Rather than identifying a single superior population, the results demonstrate that each geographical population possesses a unique phytochemical profile, with Doringrivier and Grootnek Fontein showing greater similarity in their untargeted metabolite profiles, whereas Rhodes Memorial exhibited distinct accumulation patterns for selected flavonoids and glycosylated metabolites.
Targeted LC-MS/MS analysis was subsequently employed to confirm and quantify selected pyrrolizidine alkaloids using authentic reference standards. Lycopsamine N-oxide was identified as the predominant pyrrolizidine alkaloid detected across the three populations, while the overall PA concentrations were relatively low compared with previously reported values for L. fruticosus. Although PA-related features contributed to metabolomic differentiation in the untargeted dataset, their accurate identification and quantification required targeted analysis. The detection of these toxic alkaloids highlights the importance of routine safety evaluation and quality control when L. fruticosus is considered for medicinal applications.
The discriminatory metabolites identified through untargeted metabolomics represent potential chemical markers for population differentiation, quality assessment, and future selection of plant material for medicinal and commercial applications. Overall, this study advances the understanding of phytochemical diversity and chemotypic variation in L. fruticosus and provides a foundation for quality control, chemotype selection, cultivation strategies, conservation planning, and the development of safe and standardized phytotherapeutic products derived from this species.
Future studies should focus on confirming the identity of putatively annotated metabolites using authentic reference standards, investigating the biological activities of major discriminatory compounds, and elucidating the genetic and environmental mechanisms underlying chemotypic variation. Additional research should evaluate seasonal and developmental effects on metabolite accumulation, together with comprehensive toxicological assessments of pyrrolizidine alkaloids, including dose–response relationships, bioavailability, and in vivo safety evaluations. Such investigations will support the sustainable utilization, conservation, and responsible integration of L. fruticosus into evidence-based phytotherapeutic applications.

Limitations of the Study

This study was limited to three wild populations of L. fruticosus from the Western Cape Province and may not fully represent the phytochemical diversity of the species across its distribution range. Untargeted UPLC-QTOF-MS profiling was performed using three biological composite replicates per population, whereas targeted LC-MS/MS analysis of pyrrolizidine alkaloids (PAs) was conducted on one composite sample per population. Therefore, PA results provide quantitative estimates of detected alkaloids but do not allow assessment of within-population variability or statistical comparison among populations.
Although UPLC-QTOF-MS enabled comprehensive metabolite profiling, most compounds were annotated as MSI Level 2 (putatively identified) due to the limited availability of authentic standards. Further confirmation using reference standards or complementary techniques such as NMR is required. In addition, metabolite abundance was expressed as catechin equivalents, providing relative rather than absolute quantification.
Quality control samples were not included during untargeted metabolomic analysis; however, instrument calibration and lock-mass correction ensured analytical accuracy. Future studies should incorporate QC samples to strengthen analytical validation. Furthermore, sampling was conducted during a single season, and therefore seasonal, developmental, and environmental effects on metabolite accumulation require further investigation through multi-seasonal studies, expanded populations, and controlled cultivation experiments.

Author Contributions

Writing—original draft—L.D.; writing—review and editing—R.P.G., N.H.M., M.J.M., M.M.M., S.A., D.M., A.R.M., C.B. and N.M.M.; conceptualisation—L.D., R.P.G., C.B. and N.M.M.; methodology—L.D., R.P.G., N.H.M., D.M., M.J.M., C.B. and N.M.M.; software—N.M.M.; validation—R.P.G., M.M.M., S.A., C.B. and N.M.M.; formal analysis—L.D., C.B. and N.M.M.; investigation—L.D., N.H.M. and M.J.M.; resources—R.P.G., M.J.M., A.R.M. and N.M.M.; data curation—L.D., C.B. and N.M.M.; visualisation—L.D., N.H.M., A.R.M. and N.M.M.; supervision—R.P.G., C.B. and N.M.M.; project administration—A.R.M. and N.M.M.; funding acquisition—N.M.M. All authors have read and agreed to the published version of the manuscript.

Funding

This research was funded by the Department of Agriculture of South Africa, grant number VIM012403000094.

Data Availability Statement

The original contributions presented in this study are included in the article. Further inquiries can be directed to the corresponding author.

Acknowledgments

The authors would like to acknowledge Tshwane University of Technology; the Department of Agriculture (DOA); the Soil and Water Division at the Agricultural Research Council Infruitec-Nietvoorbij, Stellenbosch; the Stellenbosch Central Analytical Facilities (CAF); and Cape Nature for their contributions to ensuring the success of this work.

Conflicts of Interest

The authors declare no conflict of interest.

Appendix A

Figure A1. Total Ion Chromatogram (TIC) of Lobostemon fruticosus leaf extract in negative ES mode.
Horticulturae 12 00957 g0a1

References

  1. Van der Walt, J.J.A. Medicinal plant heritage of the Cape. S. Afr. J. Bot. 2005, 71, 113–120. [Google Scholar]
  2. Mintsa Mi Nzue, A.P. Use and conservation status of medicinal plants in the Cape Peninsula, Western Cape Province of South Africa. Doctoral Dissertation, University of Stellenbosch, Stellenbosch, South Africa, 2009. [Google Scholar]
  3. Swarts, A.; Matsiliza-Mlathi, B.; Kleynhans, R. Rooting and survival of Lobostemon fruticosus (L) H. Buek stem cuttings as affected by season, media and cutting position. S. Afr. J. Bot. 2018, 119, 80–85. [Google Scholar] [CrossRef]
  4. Lodama, K.E.; du Toit, E.S.; Steyn, J.M.; Araya, H.T.; Prinsloo, G.; Du Plooy, C.P.; Robbertse, P.J. Improving rooting of Lobostemon fruticosus L. cuttings with delayed auxin treatment. S. Afr. J. Bot. 2016, 105, 111–115. [Google Scholar] [CrossRef]
  5. Maroyi, A. Lobostemon fruticosus: A review of its botany, medicinal uses, phytochemistry and biological activities. J. Pharm. Sci. Res. 2019, 11, 3646–3650. [Google Scholar]
  6. Kgosana, M.R.; Sandasi, M.; Ncube, E.; Vermaak, I.; Gouws, C.; Viljoen, A.M. Exploring the wound healing potential of Lobostemon fruticosus using in vitro and in vivo bioassays. J. Ethnopharmacol. 2025, 336, 118632. [Google Scholar] [CrossRef] [PubMed]
  7. Motadi, L.R.; Ndlovu, N. Anti-HIV activity of selected South African medicinal plants. Afr. J. Tradit. Complement. Altern. Med. 2015, 12, 67–73. [Google Scholar]
  8. Blose, M.S. Evaluating the Anti-Proliferative Effects of Methanol and Butanol Extracts of Lobostemon fruticosus on a Pancreatic Cancer Cell Line ASPC-1. Thesis, University of the Witwatersrand, Johannesburg, South Africa, 2017. [Google Scholar]
  9. Bedane, K.G.; Zühlke, S.; Spiteller, M. Bioactive constituents of Lobostemon fruticosus: Anti-inflammatory properties and quantitative analysis of samples from different places in South Africa. S. Afr. J. Bot. 2020, 131, 74–180. [Google Scholar] [CrossRef]
  10. Kgosana, M.R.; Ncube, E.; Sandasi, M.; Vermaak, I.; Chen, W.; Viljoen, A.M. Phytochemical profiling and chemotypic variation study of Lobostemon fruticosus (L.) H. Buek. S. Afr. J. Bot. 2025, 183, 85–93. [Google Scholar] [CrossRef]
  11. Sharma, R.A.; Singh, B.; Singh, D.; Chandrawat, P. Ethnomedicinal, pharmacological properties and chemistry of some medicinal plants of Boraginaceae in India. J. Med. Plants Res. 2009, 3, 153–175. [Google Scholar] [CrossRef]
  12. Orfanou, E.; Exarchou, V.; Troganis, A. Secondary metabolites in Boraginaceae species. Phytochem. Rev. 2016, 15, 197–225. [Google Scholar]
  13. Knutsen, H.K.; Alexander, J.; Barregård, L.; Bignami, M.; Brüschweiler, B.; Ceccatelli, S.; Cottrill, B.; Dinovi, M.; Edler, L.; Grasl-Kraupp, B. Risks for human health related to the presence of pyrrolizidine alkaloids in honey, tea, herbal infusions and food supplements. EFSA J. 2017, 15, 04908. [Google Scholar] [CrossRef] [PubMed]
  14. Gould, A.N.; Penny, C.B.; Patel, C.C.; Candy, G.P. Enhanced cutaneous wound healing by Senecio serratuloides (Asteraceae/Compositae) in a pig model. S. Afr. J. Bot. 2015, 100, 63–68. [Google Scholar] [CrossRef]
  15. Pant, P.; Pandey, S.; Dall’acqua, S. The influence of environmental conditions on secondary metabolites in medicinal plants: A literature review. Chem. Biodivers. 2021, 18, 2100345. [Google Scholar] [CrossRef] [PubMed]
  16. Mnisi, N.H.; Gunununu, R.P.; Dukashe, L.; Makgato, M.J.; Mulidzi, A.R.; Bvenura, C.; Mashabela, N.M. Geographic Influence on Secondary Metabolite Profiles in Leaves of the Endemic Agathosma betulina (PJ Bergius) Pillans. in the Western Cape Province, South Africa. Int. J. Mol. Sci. 2026, 27, 4486. [Google Scholar] [CrossRef] [PubMed]
  17. Hossain, C.M.; Gera, M.; Ali, K.A. Current status and challenges of herbal drug development and regulatory aspect: A global perspective. Asian J. Pharm. Clin. Res. 2022, 15, 31–41. [Google Scholar] [CrossRef]
  18. Bray, R.H.; Kurtz, L.T. Determination of total, organic, and available forms of phosphorus in soils. Soil Sci. 1945, 59, 39–46. [Google Scholar] [CrossRef]
  19. Tsugawa, H.; Cajka, T.; Kind, T.; Ma, Y.; Higgins, B.; Ikeda, K.; Kanazawa, M.; Vandergheynst, J.; Fiehn, O.; Arita, M. MS-DIAL: Data-independent MS/MS deconvolution for comprehensive metabolome analysis. Nat. Methods 2015, 12, 523–526. [Google Scholar] [CrossRef] [PubMed]
  20. Dührkop, K.; Fleischauer, M.; Ludwig, M.; Aksenov, A.A.; Melnik, A.V.; Meusel, M.; Dorrestein, P.C.; Rousu, J.; Böcker, S. SIRIUS 4: A rapid tool for turning tandem mass spectra into metabolite structure information. Nat. Methods 2019, 16, 299–302. [Google Scholar] [CrossRef] [PubMed]
  21. Dai, J.I.N.; Russell, J. Plant phenolics: Extraction, analysis and their antioxidant and anticancer properties. Molecules 2010, 15, 7313–7352. [Google Scholar] [CrossRef] [PubMed]
  22. Bai, N.; He, K.; Roller, M.; Lai, C.S.; Shao, X.; Pan, M.H.; Bily, A.; Ho, C.T. Flavonoid glycosides from Microtea debilis and their cytotoxic and anti-inflammatory effects. Fitoterapia 2011, 82, 168–172. [Google Scholar] [CrossRef] [PubMed]
  23. Shin, M.S.; Park, J.Y.; Lee, J.; Yoo, H.H.; Hahm, D.H.; Lee, S.C.; Lee, S.; Hwang, G.S.; Jung, K.; Kang, K.S. Anti-inflammatory effects and corresponding mechanisms of cirsimaritin extracted from Cirsium japonicum var. maackii Maxim. Bioorganic Med. Chem. Lett. 2017, 27, 3076–3080. [Google Scholar] [CrossRef]
  24. Benali, T.; JaouadI, I.; Ghchime, R.; El Omari, N.; Harboul, K.; Hammani, K.; Rebezov, M.; Shariati, M.A.; Mubarak, M.S.; Simal-Gandara, J.; et al. The current state of knowledge in biological properties of cirsimaritin. Antioxidants 2022, 11, 1842. [Google Scholar] [CrossRef] [PubMed]
  25. Patel, D.K. Health beneficial aspect and therapeutic potential of cirsimaritin in the medicine for the treatment of human health complications. Curr. Bioact. Compd. 2022, 18, 27–38. [Google Scholar] [CrossRef]
  26. Aljeddani, G.S. Phenolic and Flavonoid Composition of Artemisia judaica (L.) and Teucrium polium (L.) Methanolic Leaf Extracts: Bioactivity and Antitumor Insights. Egypt. J. Chem. 2025, 68, 1041–1052. [Google Scholar]
  27. Jaakola, L.; Hohtola, A. Effect of latitude on flavonoid biosynthesis in plants. Plant Cell Environ. 2010, 33, 1239–1247. [Google Scholar] [CrossRef] [PubMed]
  28. Petersen, M.; Simmonds, M.S.J. Rosmarinic acid. Phytochemistry 2003, 62, 121–125. [Google Scholar] [CrossRef] [PubMed]
  29. Pezeshki, S.; Petersen, M. Rosmarinic acid and related metabolites. In Biotechnology of Natural Products; Springer: Berlin/Heidelberg, Germany, 2017; pp. 25–60. [Google Scholar] [CrossRef]
  30. Vogt, T. Phenylpropanoid biosynthesis. Mol. Plant 2010, 3, 2–20. [Google Scholar] [CrossRef] [PubMed]
  31. Davin, L.B.; Lewis, N.G. Lignin primary structures and dirigent sites. Curr. Opin. Biotechnol. 2005, 16, 407–415. [Google Scholar] [CrossRef] [PubMed]
  32. Shi, Q.; Chen, J.; Zhou, Q.; Lei, H.; Luan, L.; Liu, X.; Wu, Y. Indirect identification of antioxidants in Polygalae radix through their reaction with 2, 2-diphenyl-1-picrylhydrazyl and subsequent HPLC–ESI-Q-TOF-MS/MS. Talanta 2015, 144, 830–835. [Google Scholar] [CrossRef] [PubMed]
  33. Moreira, R.; Pereira, D.M.; Valentão, P.; Andrade, P.B. Pyrrolizidine alkaloids: Chemistry, pharmacology, toxicology and food safety. Int. J. Mol. Sci. 2018, 19, 1668. [Google Scholar] [CrossRef] [PubMed]
  34. Qaderi, M.M.; Martel, A.B.; Strugnell, C.A. Environmental factors regulate plant secondary metabolites. Plants 2023, 12, 447. [Google Scholar] [CrossRef] [PubMed]
Figure 1. Map of South Africa showing sampling points in the Western Cape Province (Google Maps, version 26.17.03).
Horticulturae 12 00957 g001
Figure 2. (A) Lobostemon fruticosus in its native habitat and (B) the collection of plant specimen using pruning shears. (Photo by Mashabela, 2025).
Horticulturae 12 00957 g002
Figure 3. Principal Component Analysis (PCA) score plot of secondary metabolites in Lobostemon fruticosus leaf extracts collected from three geographical populations in the Western Cape Province, South Africa.
Horticulturae 12 00957 g003
Figure 4. Orthogonal Partial Least Squares Discriminant Analysis (OPLS-DA) of (T score [1]) vs. (Orthogonal T score [1]) scores plot of Lobostemon fruticosus secondary metabolites from three different locations of the Western Cape province of South Africa analysed using UPLC-QTOF-MS.
Horticulturae 12 00957 g004
Figure 5. Orthogonal Partial Least Squares Discriminant Analysis (OPLS-DA) Model of Lobostemon fruticosus samples.
Horticulturae 12 00957 g005
Figure 6. The heat map showing different concentration intensities of Lobostemon fruticosus secondary metabolites in the Western Cape province of South Africa.
Horticulturae 12 00957 g006
Figure 7. Box-and-whisker plots of secondary metabolites: Cirsimaritin (A); Lycopsamine-N-Oxide (B) and Smiglaside B (C) detected in the leaves of L. fruticosus from 3 different locations of the Western Cape province.
Horticulturae 12 00957 g007aHorticulturae 12 00957 g007b
Figure 8. T-test analysis showing clear differences in the distribution of compounds.
Horticulturae 12 00957 g008
Table 1. Physical and chemical properties of topsoil (0–30 cm) of Lobostemon fruticosus harvest sites.
ParametersLocations
Rhodes MemorialDoringrivierGrootnek Fontein
Physical properties
TypeLoamLoamSand
Water holding 10 kPa (%)34.0914.2812.34
Water holding 100 kPa (%)24.176.814.78
Water holding mm/m (%)99.2674.6768.34
Chemical properties
pH KCl5.34.64.9
H+ (cmol(+)/kg)1.242.630.64
NO3 (mg kg−1)1.81.80.45
P (Bray ll) (mg kg−1)6.79.615.9
NH4 (mg kg−1)8.514.711.8
C (WB) (%)3.834.590.64
Soil Organic Matter (SOM) (%)6.597.901.10
S Am.acet (mg kg−1)9.09.86.1
Cation Exchange Capacity (CEC) (cmol/kg)11.139.052.10
Na a (%)3.231.156.69
K a (%)7.640.9712.65
Ca a (%)57.3368.9540.56
Mg a (%)21.8010.0513.38
T Value a (cmol/kg)12.3813.922.39
Acid Sat. a (%)10.0518.9226.82
Klip (% (v/v))6.141.318.72
a: parameters derived from base saturation percentage.
Table 2. Putative Annotation of Secondary Metabolites in Lobostemon fruticosus from Different Geographical Locations in the Western Cape.
Compound NoRt (min)Tentative IdentificationExperimental Mass [M-H]-m/zCalculated Mass [M-H]-m/zMass Error (ppm)MS/MS Fragment Ions (m/z)FormulaOntologyDoringrivier (mg CE g−1 DW)Grootnek
Fontein (mg CE g−1 DW)
Rhodes
Memorial (mg CE g−1 DW)
15.41Cirsimaritin313.0717313.0718−0.2163.0266; 183.0110C17H14O67-O-methylated flavonoids16.97 ± 0.61 b10.30 ± 2.11 c22.69 ± 2.32 a
25.92Globoidnan B537.1046537.10391.4179.0352; 295.0611; 313.0714; 357.0610; 197.0458; 339.0510C27H22O12Caffeic acid oligomer3449.69 ± 59.51 a3582.69 ± 99.60 a1273.44 ± 49.93 b
36.28Rutin609.1459609.1461−0.3197.0467C27H30O16Flavonoid-3-O-glycosides4815.60 ± 18.96 a4095.59 ± 170.34 b759.86 ± 46.93 c
46.64Rabdosiin717.1455717.1461−0.8229.0139; 243.0283
243.0283
C36H30O162-arylbenzofuran flavonoids5142.10 ± 651.00 a4398.16 ± 124.51 a1255.87 ± 184.74 b
56.80Schizotenuin F551.1190551.1195−0.9161.0119;
179.0137
C28H24O12Phenylpyruvic acid derivatives261.78 ± 9.76 a284.07 ± 8.90 a96.16 ± 17.39 b
66.85Kaempferol285.0403285.0405−0.6118.0100; 133.0159; 139.0420; 146.0118; 157.0103C15H10O6Flavonols48.58 ± 2.91 b44.71 ± 2.70 b79.19 ± 1.56 a
77.16Sagerinic acid719.1615719.1618−0.4135.0977; 161.0600;
197.0453; 359.0770
C36H32O16Cyclobutane lignans1990.83 ± 11.24 a1331.93 ± 74.89 b713.98 ± 18.48 c
87.23Jaceidin 7-rhamnoside505.1363505.13522.3100.2138;
242.3571
C24H26O12Flavonoid-7-O-glycosides63.59 ± 2.20 b24.94 ± 0.05 c95.01 ± 17.28 a
97.29Rosmarinic acid359.0784359.07723.2135.0452; 161.0247
179.0352; 197.0459
C18H16O8Coumaric acids and derivatives3846.89 ± 285.78 a3289.76 ± 870.83 a1953.26 ± 109.68 b
107.47Lirioresinol A417.1558417.15550.7100.1444;
283.0624
C22H26O8Furanoid lignans32.91 ± 0.08 b53.55 ± 7.07 a40.64 ± 3.66 b
118.05Smiglaside B953.2726953.27210.5100.1762;
256.9495
C46H50O22Pentacarboxylic acids and derivatives22.59 ± 0.30 b15.13 ± 3.52 b144.05 ± 30.77 a
128.21Senburiside III; (-)-Senburiside III983.2828983.28270.1100.0661;
206.6485
C47H52O23Hydrolyzable tannins 85.762 ± 1.22 c149.72 ± 20.54 b181.97 ± 12.63 a
138.31Globoidnan A491.0985491.09840.3135.0437C26H20O102-arylbenzofuran flavonoids692.13 ± 6.16 b835.08 ± 51.23 a588.09 ± 4.73 c
149.03-(-)-Steganacin455.1350455.13480.5188.0453C24H24O9Lignan lactones1.88 ± 0.16 b40.85 ± 13.22 a13.11 ± 1.05 b
159.59Cosmosporaside B459.2600459.26000.1184.9793C23H40O9Sesquiterpenoids56.29 ± 1.83 a33.61 ± 8.54 b24.69 ± 1.36 b
Values expressed as mg CE g−1 DW (dry weight) represent semi-quantitative relative abundance estimates derived from calibration against catechin and should not be interpreted as absolute metabolite concentrations. Because response factors differ among compounds, values may exceed 1000 mg CE g−1 DW. Data is presented as mean ± standard deviation (SD). Superscript letters represent significant differences.
Table 3. Quantification of pyrrolizidine alkaloids in Lobostemon fruticosus leaves from three geographical locations.
Compounds: Pyrrolizidine AlkaloidsLocations
Grootnek Fontein
(mg kg−1)
Doringrivier
(mg kg−1)
Rhodes Memorial (mg kg−1)
Lycopsamine + Indicine0.0010.1000.023
Lycopsamine-N-Oxide3.893.770.320
Seneciphyline-N-oxide and spatioidine-N-oxide0.001__
Integerrimine-N-oxide0.001__
Intermedine_0.001_
Intermedine-N-oxide___
Heliotrine-N-oxide___
Europine-N-oxide___
Echimidine___
Echimidine-N-oxide0.001__
Total pyrrolizidine alkaloids 3.8943.8800.343
Table 4. ANOVA post hoc analysis.
Metabolitef.Valuep.ValueLOG10(p)FDRTukey’s HSD
Lycopsamine-N-Oxide3635.55.61 × 10−109.25141.18 × 10−8Rhodes Memorial-DR; Rhodes Memorial-GNF
Rutin1726.95.22 × 10−98.28275.48 × 10−8GNF-DR; Rhodes Memorial-DR; Rhodes Memorial-GNF
Lycopsamine1225.91.46 × 10−87.83718.17 × 10−8Rhodes Memorial-DR; Rhodes Memorial-GNF
Globoidnan B1198.41.56 × 10−87.80778.17 × 10−8Rhodes Memorial-DR; Rhodes Memorial-GNF
Sagerinic acid621.41.11 × 10−76.9554.66 × 10−7GNF-DR; Rhodes Memorial-DR; Rhodes Memorial-GNF
323_4.69287.891.10 × 10−65.95983.84 × 10−6GNF-DR; Rhodes Memorial-DR; Rhodes Memorial-GNF
455_9.039142.598.75 × 10−65.0582.63 × 10−5GNF-DR; Rhodes Memorial-DR; Rhodes Memorial-GNF
Rabdosiin136.151.00 × 10−54.99912.63 × 10−5Rhodes Memorial-DR; Rhodes Memorial-GNF
953_8.05123.911.32 × 10−54.87912.85 × 10−5Rhodes Memorial-DR; Rhodes Memorial-GNF
433_5.71122.841.35 × 10−54.86812.85 × 10−5GNF-DR; Rhodes Memorial-DR; Rhodes Memorial-GNF
551_6.8103.222.25 × 10−54.64733.94 × 10−5Rhodes Memorial-DR; Rhodes Memorial-GNF
505_9.285.4933.90 × 10−54.40946.29 × 10−5GNF-DR; Rhodes Memorial-DR; Rhodes Memorial-GNF
Globoidnan A72.1066.37 × 10−54.19579.56 × 10−5GNF-DR; Rhodes Memorial-DR; Rhodes Memorial-GNF
983_8.265.6798.33 × 10−54.07910.0001167GNF-DR; Rhodes Memorial-DR
983_7.3954.5830.000141413.84950.0001856GNF-DR; Rhodes Memorial-DR
Cirsimaritin30.310.000730553.13630.0009024GNF-DR; Rhodes Memorial-GNF
459_9.2525.4140.00117692.92920.0013731GNF-DR; Rhodes Memorial-DR
417_7.718.9570.00255072.59330.0028192GNF-DR; Rhodes Memorial-GNF
431_7.8517.3940.0031832.49720.0033422Rhodes Memorial-DR; Rhodes Memorial-GNF
Rosmarinic acid15.6040.00419292.37750.0041929Rhodes Memorial-DR; Rhodes Memorial-GNF
Disclaimer/Publisher’s Note: The statements, opinions and data contained in all publications are solely those of the individual author(s) and contributor(s) and not of MDPI and/or the editor(s). MDPI and/or the editor(s) disclaim responsibility for any injury to people or property resulting from any ideas, methods, instructions or products referred to in the content.