Article

Divergent Regulatory Roles of Supplemental Far-Red or UV-A Radiation in Modulating Pak Choi (Brassica rapa L. ssp. chinensis) Growth and Quality Under Different Light Levels


1
School of Agriculture and Biology, Shanghai Jiao Tong University, Shanghai 200240, China
2
Shanghai Agricultural Science and Technology Service Center, Shanghai 200335, China
3
Shanghai Pudong New District Agro-Technology Extension Center, Shanghai 201201, China
4
Shanghai Sunqiaoyijia Tech-Agriculture Co. Ltd., Shanghai 200120, China
*
Author to whom correspondence should be addressed.
Horticulturae 2026, 12(8), 933; https://doi.org/10.3390/horticulturae12080933
Submission received: 23 May 2026 / Revised: 18 July 2026 / Accepted: 21 July 2026 / Published: 29 July 2026
(This article belongs to the Special Issue Precision Nutrient Management in Controlled-Environment Horticulture)

Abstract

This study investigated the effects of far-red (FR, 740 nm) and ultraviolet-A (UV-A, 370 nm) supplementation on the growth and nutritional quality of pak choi (Brassica rapa ssp. chinensis ‘Xiawang’) under different light intensities. Plants were grown under a white LED background light (6500 K) at two light intensities (100 and 400 μmol·m−2·s−1) either without (T100 and T400) or with an additional 40 μmol·m−2·s−1 of FR or UV-A radiation (T100FR, T100UV-A, T400FR, and T400UV-A). The results demonstrated a significant interactive effect between light intensity and FR/UV-A supplementation. Under low light intensity (T100), both FR and UV-A significantly enhanced biomass accumulation, the net photosynthetic rate, and the content of soluble proteins, soluble sugars, and cellulose. Under a high light intensity (T400), FR and UV-A primarily promoted morphological development (leaf expansion and thickening), photosynthetic performance, and carbohydrate accumulation. Specifically, FR notably promoted petiole elongation while reducing photosynthetic pigment content, whereas UV-A markedly increased the vitamin C content while decreasing nitrate accumulation. In conclusion, both FR and UV-A supplementation effectively improve the growth and quality of pak choi, but, through light-intensity-dependent mechanisms. FR acts mainly via morphological and photosynthetic optimization, whereas UV-A acts as a physiological and nutritional regulator. These findings highlight the complementary roles of FR and UV-A, providing practical guidance for optimizing spectral strategies in controlled environment agriculture (CEA).

1. Introduction

Light not only acts as an energy source to drive photosynthesis and produce assimilates in plant leaves but also serves as a signal regulating plant growth, development, morphological formation, and metabolism [1,2]. The variation in light intensity and spectrum significantly affects plant growth. Light intensity is a fundamental factor that has a positive correlation with photosynthetic efficiency below the light saturation point. Both excessive and insufficient light intensities are detrimental to plant growth. Insufficient light causes plants to elongate, reduce the leaf area, increase stem elongation, decrease the root biomass, and enhance apical dominance, resulting in various effects on plant morphology, anatomical structure, and physiological metabolism [3]. On the other hand, an excessively high light intensity can lead to smaller, thicker leaves, chlorosis, or even wilting [4].
In terms of the light spectrum, apart from photosynthetically active radiation (PAR, 400–700 nm), which is principally absorbed by photosynthetic pigments to drive the photosynthetic machinery, far-red (FR, 700–760 nm) light and ultraviolet light (UV, 280–400 nm), serving as light signals, also have great regulatory effects on multiple aspects of plant growth [5]. The typical effect of FR on plants is the shade avoidance response through photoreceptors, manifested as promoting stem elongation and leaf expansion to increase the light capture area [6]. However, pure FR was long considered detrimental to photosynthesis due to its ability to reduce the leaf absorption capacity and the quantum yield of photosynthesis [7]. Most notably, plenty of recent studies suggest that FR combined with PAR can be utilized by plants for photosynthesis more efficiently than previously thought [8,9]. Numerous studies have shown that the addition of FR light also has significant effects on the plant physiological metabolism [10,11], thus affecting the nutritional quality. Among UV light, UV-A accounts for about 95–98% of the total ultraviolet radiation that reaches the Earth’s surface, but little research has been conducted on the physiological and biochemical responses of plants to UV-A radiation. Available studies indicate that the UV-A effects on plants should not be viewed solely as abiotic stress, as UV-A supplementation promotes positive morphological development in tomatoes and increases light interception [12]. Moreover, UV-A shares similar functional roles with blue light in enhancing secondary metabolite accumulation and regulating photosynthesis, especially in enhancing the antioxidant capacity [13].
Furthermore, the effects of the light spectrum on plants depend on the light intensity level. In high-light environments, the addition of FR light can alleviate photoinhibition through photoreceptor-mediated signaling pathways, regulating the energy distribution in photosynthetic systems [14]. Additionally, the ratio of far-red to red light (R:FR) will change with the light intensity, which is the key factor that determines the phytochrome activity and regulating the shade-avoidance response. For example, a low R:FR ratio promotes flowering and inhibits branching [15]. It has been reported that promoting the effects of UV-A wavelengths on photosynthetic rates may exert more substantial influences under low light conditions [16]. Moderate UV-A supplementation can increase the chlorophyll content and photosynthetic efficiency in pak choi, while also enhancing its stress resistance [17]. Under high-light conditions, moderate supplementation with UV-A radiation can induce a series of photoprotective responses in plants, including the biosynthesis of flavonoids, phenolic compounds, and antioxidant enzymes. These responses effectively enhance both enzymatic and non-enzymatic antioxidant systems in tomato plants, thereby mitigating the photo-oxidative stress caused by intense light [18]. Therefore, investigating the impact of FR and UV-A supplementation under different light intensity conditions (particularly under low- or high-light conditions) on regulating the plant photoadaptation capacity is of great significance in improving light use efficiency.
Pak choi (Brassica rapa L. subsp. chinensis (L.)) is a variety of the upright or semi-upright type within the Brassica family. It has a short cultivation cycle, strong adaptability, compact morphology, high yield, and high nutritional value, making it an appropriate leafy vegetable suitable for cultivation in plant factories. However, the effects of UV-A and FR radiation on the growth and nutritional quality of pak choi remain poorly understood. Furthermore, it is not known whether UV-A and FR radiation exert different effects under different light intensity levels. Thus, this study explored the regulatory effects of FR or UV-A supplementation on the growth, physiological characteristics, and quality of pak choi under relatively low and high background white light intensities. This study will help to optimize the light conditions for pak choi production in controlled environment agriculture and reveal the complexity of the interaction between spectral components and light intensity.

2. Materials and Methods

2.1. Growing Conditions and Light Treatments

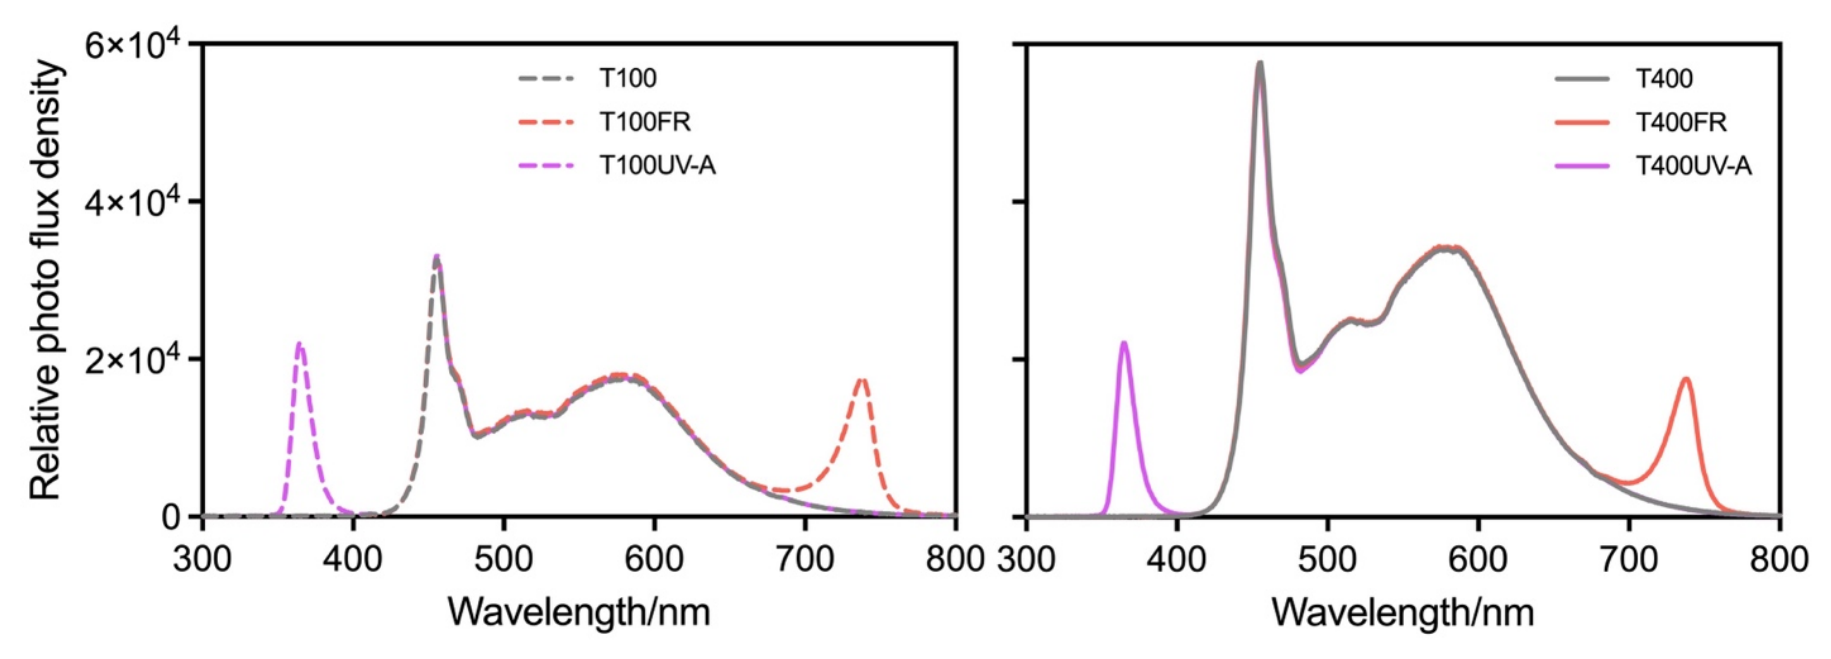
The experiment was conducted in a closed plant factory (Aisheng Biotechnology Co., Ltd., Shanghai, China). Seeds of pak choi var. Xiawang (Shanghai Huihe Seedling Co., Ltd., Shanghai, China) were sown in 128-cell plug trays with organic substrate (Danyang Organic Fertilizer Co., Ltd., Zhenjiang, China). After seeds have germinated, seedlings were cultivated under 100 μmol·m−2·s−1 white LED light (16/8 h) with a temperature of 25 ± 1/20 ± 1 °C (day/night) and humidity maintained around 65%. After 14 days, seedlings were randomly transferred to different light treatments (Table 1) with adjustable white (W), UV-A (370 nm), and FR (740 nm) LED light sources. Based on previous studies reporting an optimal light intensity of 200~300 μmol·m−2·s−1 for pak choi [19,20], the intensities of background white light were set at 100 μmol·m−2·s−1 and 400 μmol·m−2·s−1 to represent relative low and high light levels, respectively. The light cycle was 16 h per day. A commercial water-soluble fertilizer (Shanghai Yongtong Ecological Engineering Co., Ltd., Shanghai, China) with an EC value of 1500 ± 50 μs·cm−1 was used for irrigation. A portable spectrometer (ALP-01, Quanta-Tech, Taiwan, China) was used to measure the photon flux density at the height of the plant canopy. The specific light quality information is shown in Figure 1. Each treatment contained five independent cultivation units, all of which were located in the same plant factory.

2.2. Biomass, Morphological, and Energy-Use Efficiency Determinations

Samples were collected at 29 days after sowing (DAS) for each treatment, with 5 replicates per treatment and 10 plants per replicate. The leaf area of a single plant was scanned using a scanner (PERFECTION V700 PHOTO, Epson, Suwa, Japan) and determined using Image-J software (version 1.53t, National Institutes of Health, Bethesda, MD, USA). The fresh weight of the aboveground part was measured using an electronic balance. Subsequently, samples were dried to a constant weight by hot-air drying in order to measure the dry weight.
To evaluate energy consumption associated with FR or UV-A supplementation, energy-use efficiency (EUE) was calculated according to the reported formula: EUE = DW × Wche × S × D/(P × t) (DW, dry weight; Wche, the chemical energy per gram of dry weight (2 × 10⁴ J·g−1); S, cultivation area; D, planting density; and P, the electrical power of the light source; t, the cumulative lighting duration) [21]. Furthermore, given that absolute EUE values under our experimental conditions hold limited practical relevance, we normalized EUE to a relative scale, with the T100 treatment serving as the reference (100%).

2.3. Photosynthetic Characteristics Determinations

The second fully expanded leaf was selected for measurement at 20 DAS, with 5 replicates per treatment, and 2 plants per replicate. Gas exchange parameters were measured using a portable photosynthesis system (GFS-3000, WALZ, Effeltrich, Germany), with the light intensity, flow rate, and leaf temperature set at 250 μmol·m−2·s−1, 750 m·s−1, and 25 °C, respectively. The net photosynthetic rate (Pn), stomatal conductance (Gs), transpiration rate (Tr), and intercellular CO2 concentration (Ci) were determined. Chlorophyll fluorescence parameters were measured using a modulated chlorophyll fluorometer (IMAGING-PAM, WALZ, Germany). Leaves were dark-adapted for 30 min, and then minimal fluorescence (Fo), maximal fluorescence (Fm), minimal fluorescence in light-adapted state (Fo′), maximal fluorescence in light-adapted state (Fm′), and steady-state fluorescence (Fs) were measured according to the instrument manual with actinic light set at 281 μmol·m−2·s−1. Maximum photochemical efficiency of PSII (Fv/Fm), actual photochemical efficiency of PSII (Y(II)), photochemical quenching coefficient (qL), and relative electron transport rate (ETR) were calculated following Kitajima and Butler [22], Genty et al. [23], Kramer et al. [24], and Schreiber et al. [25], respectively, using the following equations: Fv/Fm = (Fm − Fo)/Fm, Y(II) = (Fm′ − F)/Fm′, qL = (Fm′ − F)/(Fm′ − Fo′)·Fo′/F, ETR = PAR × Y(II) × 0.84 × 0.5.

2.4. Physiological Determinations

For leaf anatomical structure analysis, cross-sectional slices of pak choi leaves were prepared. Then, 1 mm × 5 mm leaf fragments at one-third of the distance from the leaf tip were collected from the fourth fully expanded leaves, avoiding the central part of the leaf vein. The samples were fixed in formalin–acetic acid–alcohol (FAA) solution under vacuum for 30 min. Following fixation, samples were pre-stained with toluidine blue for 3 min, and then rinsed with ultrapure water, and dehydrated through a graded ethanol series (10 min per step). Dehydration was completed by sequential immersion in 90% ethanol–90% acetone (1:1, v/v), 90% acetone, 100% acetone (three changes), and a mixture of acetone and complete Eponate 12 embedding resin (No. 18010, TED PELLA, INC., Redding, CA, USA; 10 min each). Samples were then infiltrated with pure epoxy resin for 2 h; the resin was replaced, and samples were kept at 4 °C. Next, samples were transferred to molds and overfilled with epoxy resin. The resin was polymerized at 60 °C in a convection oven for 48 h. Then, 1 µm slices were cut with an ultramicrotome (EM UC7, Leica, Wetzlar, Germany), mounted on glass slides with a drop of ultrapure water, heat-dried, stained with toluidine blue on a hot plate for 30 s, rinsed with ultrapure water, and dried. Images were captured using an optical microscope (DM6B, Leica, Wetzlar, Germany) under a 20× objective lens. Clear and intact areas without impurities or structural damage were selected for imaging, and images were captured using LASX software (version 5.1, Leica Microsystems, Wetzlar, Germany). Sampling was conducted at 25 DAS, and 3 replicates per treatment.

2.5. Measurement of Nutritional Quality Indicators

Sampling for nutritional quality indicators was conducted at 29 DAS, with 3 replicates per treatment and 10 plants per replicate. Vitamin C content was measured using the molybdenum blue colorimetric method. Soluble protein content was determined using the Coomassie Brilliant Blue G-250 staining method. Soluble sugar content was determined using the anthrone–sulfuric acid colorimetric method. Nitrate content was measured using the salicylic acid–sulfuric acid colorimetric method. Chlorophyll and carotenoid contents were determined using the 95% ethanol extraction colorimetric method. These methods were all executed according to Cao et al. [26].
Dietary fiber content was determined in accordance with the national standard National Food Safety Standard—Determination of Dietary Fiber in Foods (GB 5009.88-2023) [27]. Cell wall polysaccharide content was measured according to the method which was adapted from Foster et al. [28]. First, extraction of cell wall material (CWM): CWM was prepared by sequentially washing 500 mg of dried pak choi powder (60-mesh sieve) with 5 mL each of 70% ethanol, chloroform/methanol (1:1, v/v), and acetone. The precipitate was collected by centrifugation after each wash, and, finally, the precipitate was vacuum-dried. Then, 20 mg CWM was sequentially extracted as follows: (1) Pectin: 4 mL of anhydrous ethanol (85 °C water bath) was added to wash CWM, and then centrifuged to obtain the precipitate (repeated 4 times). Then, 5 mL of pure water and 0.5 mL of 50 mM NaOH (25 °C, 6 h) were added to the precipitate to extract pectin. (2) Hemicellulose: The previous precipitate was extracted using a mixture of 2 mL of 0.1% NaBH4 and 4% KOH alkaline solution (RT, 12 h, repeated 4 times). (3) Cellulose: The centrifugal residue after extracting hemicellulose was counted as the cellulose component. Pectin detection: carbazole colorimetric method (525 nm); hemicellulose determination: anthrone-sulfuric acid colorimetric method (620 nm); and cellulose calculation: direct weighing method for dry residue.

2.6. Data Analysis

Data were analyzed using IBM SPSS Statistics (version 29.0, IBM Corp., Armonk, NY, USA). A two-way analysis of variance (ANOVA) was conducted to evaluate the effects of light intensity, light quality, and their interaction. When significant main effects or interactions were detected, pairwise comparisons were performed using Tukey’s test at p < 0.05. All figures were generated using GraphPad Prism (version 10, GraphPad Software, San Diego, CA, USA).

3. Results and Analysis

3.1. Biomass and Leaf Morphology

Under the T400 level, total biomass followed the order T400FR > T400UV-A > T400 (Table 2). Compared to the control, both FR and UV-A supplementation significantly enhanced fresh and dry weights, with FR eliciting a more pronounced stimulatory response than UV-A. Under the T100 level, biomass followed a consistent trend (T100FR > T100UV-A > T100). T100FR significantly increased both the fresh and dry weight, whereas T100UV-A only significantly increased the dry weight, with no significant difference in the fresh weight compared to the control. Under low-light conditions, FR radiation significantly promoted both fresh and dry biomass accumulation in plants, while the effect of UV-A was limited and primarily observed in dry matter production. The EUE of T100 treatment was the highest. Under the T100 level, FR or UV-A supplementation reduced the EUE, but, under the T400 level, EUE was significantly increased by FR or UV-A supplementation.
Under the T100 level, neither the FR nor UV-A addition significantly altered the leaf area, length, or width. In contrast, under the T400 level, both FR and UV-A significantly increased the leaf area compared to the control, with UV-A inducing a stronger promoting effect on the leaf length and width than FR. Petiole elongation was significantly facilitated by FR under both light intensity levels. Two-way ANOVA revealed that light intensity was the predominant driver of plant growth, accounting for the highly significant variation in fresh and dry weights, leaf area, leaf length, and leaf width (p < 0.01), as well as the significant variation in petiole length (p < 0.05). Light quality significantly influenced fresh and dry weights (p < 0.01), and additionally modulated the leaf area, leaf dimensions, and petiole length (p < 0.05). The light intensity × light quality interaction was significant for fresh and dry weights (p < 0.01) and leaf area (p < 0.05), but not for leaf length, width, or petiole length (p > 0.05). Notably, the F values for the biomass parameters substantially exceeded those for morphological traits, underscoring that light intensity was the principal determinant of biomass accumulation.

3.2. Photosynthetic Physiological Characteristics

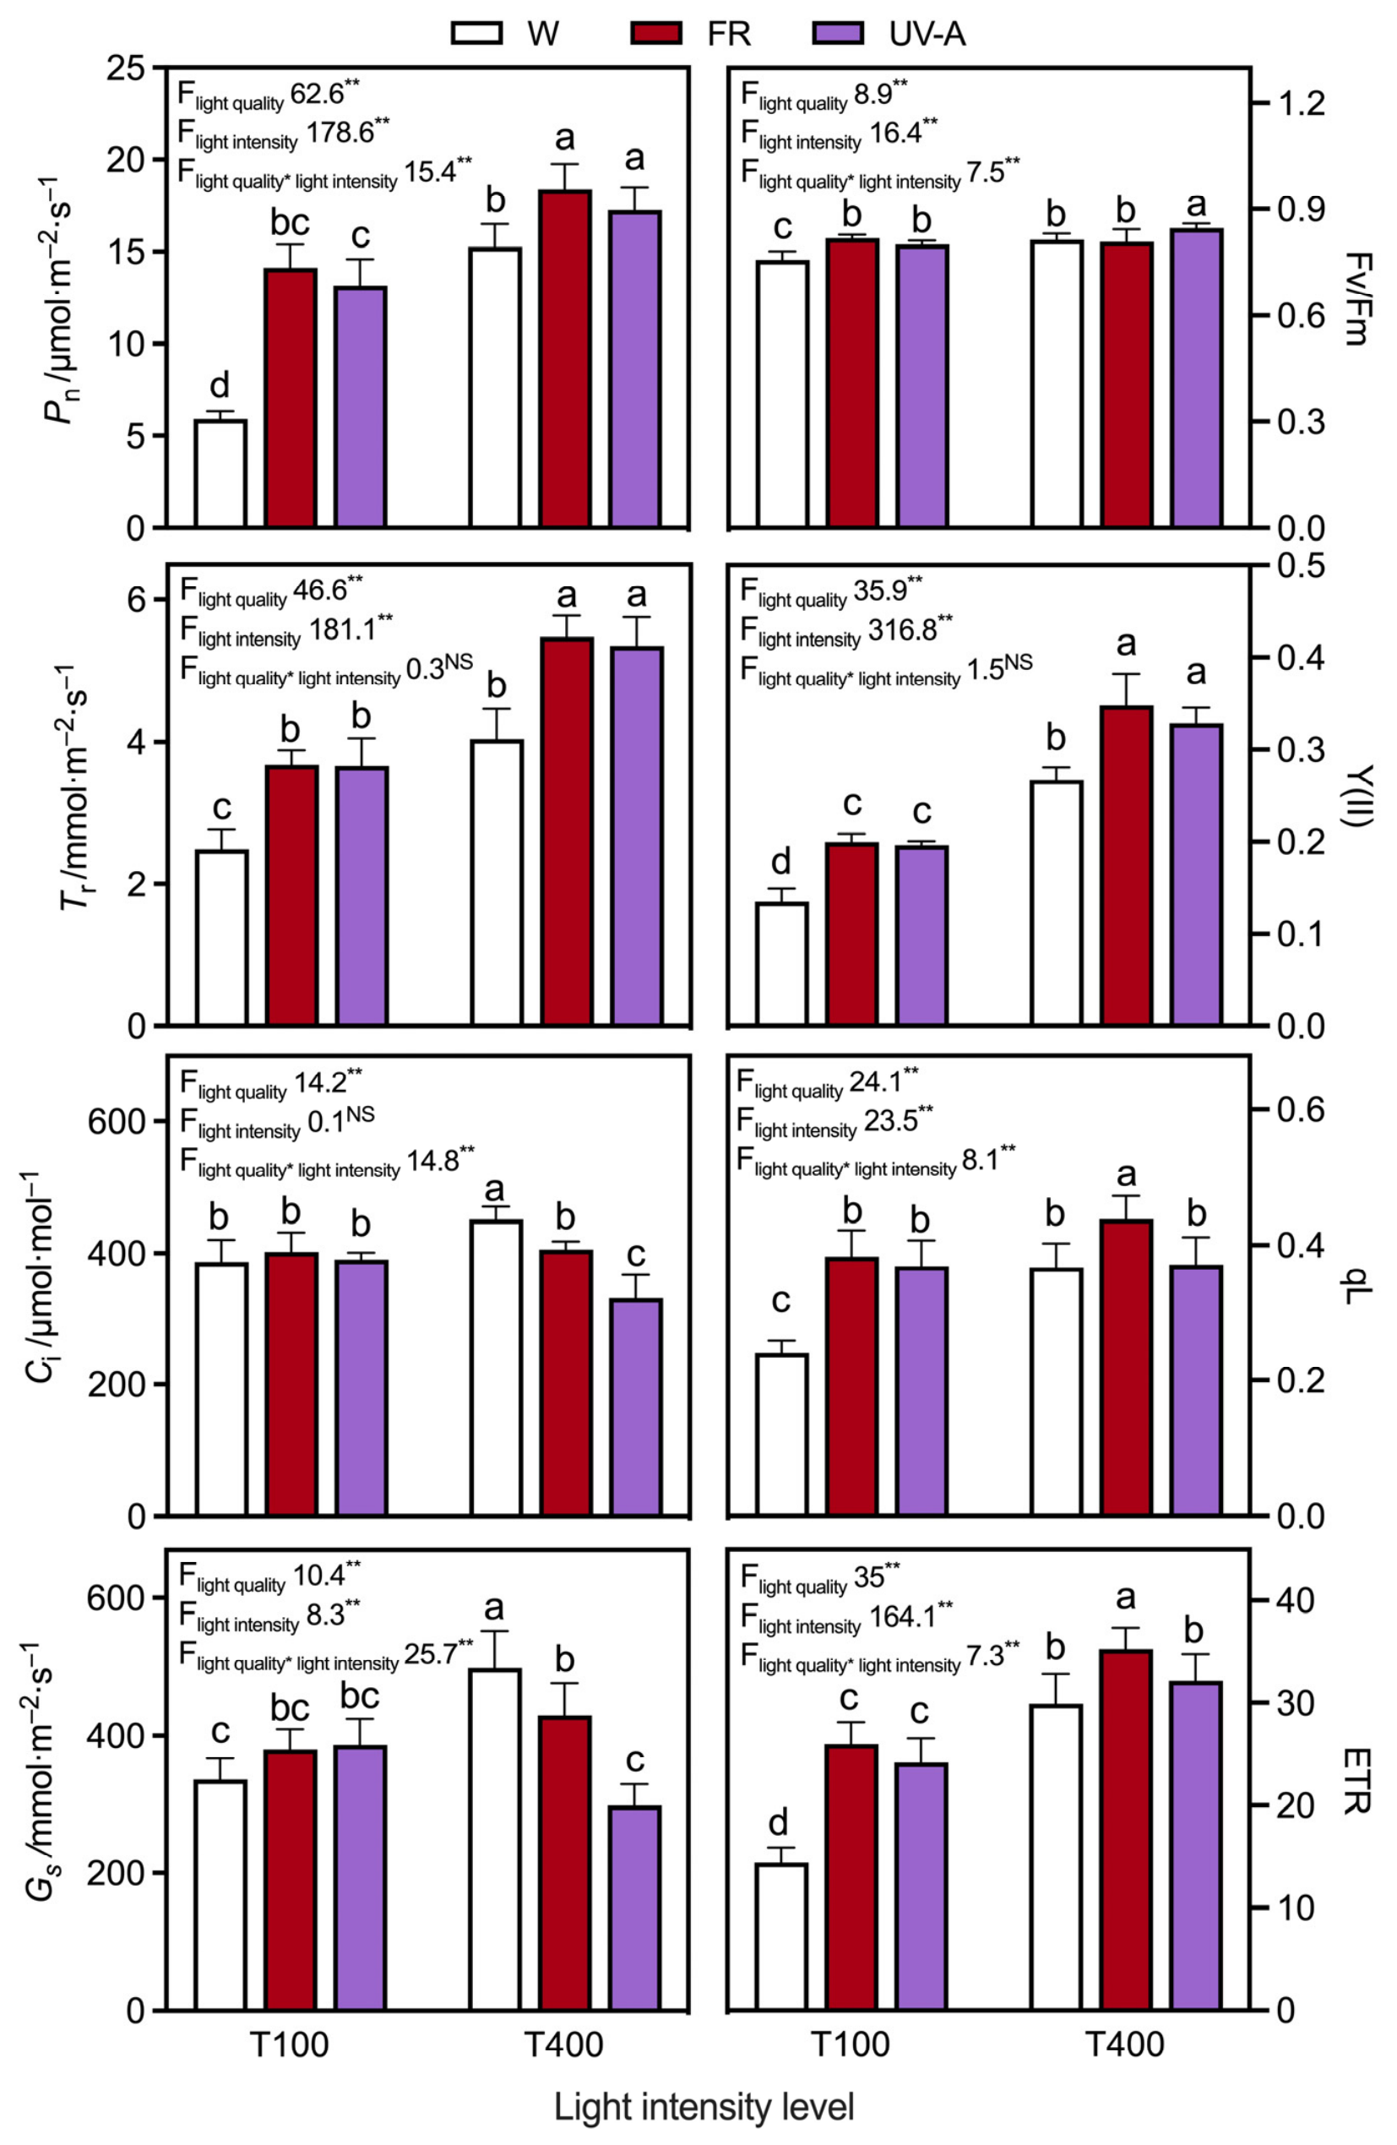
The net photosynthetic rate (Pn) was elevated by supplemental FR and UV-A radiation under both irradiance levels (Figure 2). At the 100 μmol·m−2·s−1 level, Pn was elevated by approximately 122~139% by FR and UV-A compared with the control, with a 13~20% increment at the 400 μmol·m−2·s−1 level. Notably, although the Pn of the T100FR and T400FR treatments was higher than that of T100UV-A and T400UV-A, FR and UV-A treatments were statistically indistinguishable at either irradiance level. The transpiration rate (Tr) paralleled the Pn response, being significantly elevated by both FR and UV-A application. No significant difference in Tr between the FR and UV-A treatments was observed at both the 100 and 400 μmol·m−2·s−1 levels. Stomatal conductance (Gs) and intercellular CO2 concentration (Ci) displayed irradiance-dependent divergence among treatments. Under the T100 level, neither Gs nor Ci exhibited significant differences among light quality treatments. Conversely, under the T400 level, T400 maintained the highest Gs and Ci, followed by T400FR and T400UV-A. The Gs and Ci of the T400UV-A treatment were approximately 60% and 73% of the T400 values, respectively.
The maximum photochemical efficiency of PSII (Fv/Fm) was differentially modulated by light quality and intensity. Under the T400 level, the maximum photochemical efficiency (Fv/Fm) of T400UV-A was significantly higher than that of T400FR and T400, with an increment of approximately 4% relative to T400. Under the T100 level, both T100UV-A and T100FR exhibited significantly higher Fv/Fm values than T100. The actual photochemical efficiency of PSII (Y(II)) was significantly elevated by the FR and UV-A supplementation across all irradiance levels, yet showed no significant differences among treatments within the same light intensity level. The photochemical quenching coefficient (qL) of T400FR significantly exceeded that of T400UV-A and T400 by approximately 20%. Under the T100 level, both T100UV-A and T100FR significantly enhanced qL relative to T100, with T100FR producing an increment of approximately 68%. The relative electron transport rate (ETR) exhibited a similar trend to that of qL. Light intensity played a dominant role in regulating Pn, Tr, Fv/Fm, Y(II), and ETR. However, light quality was the major regulatory factor for qL.

3.3. Photosynthetic Pigments

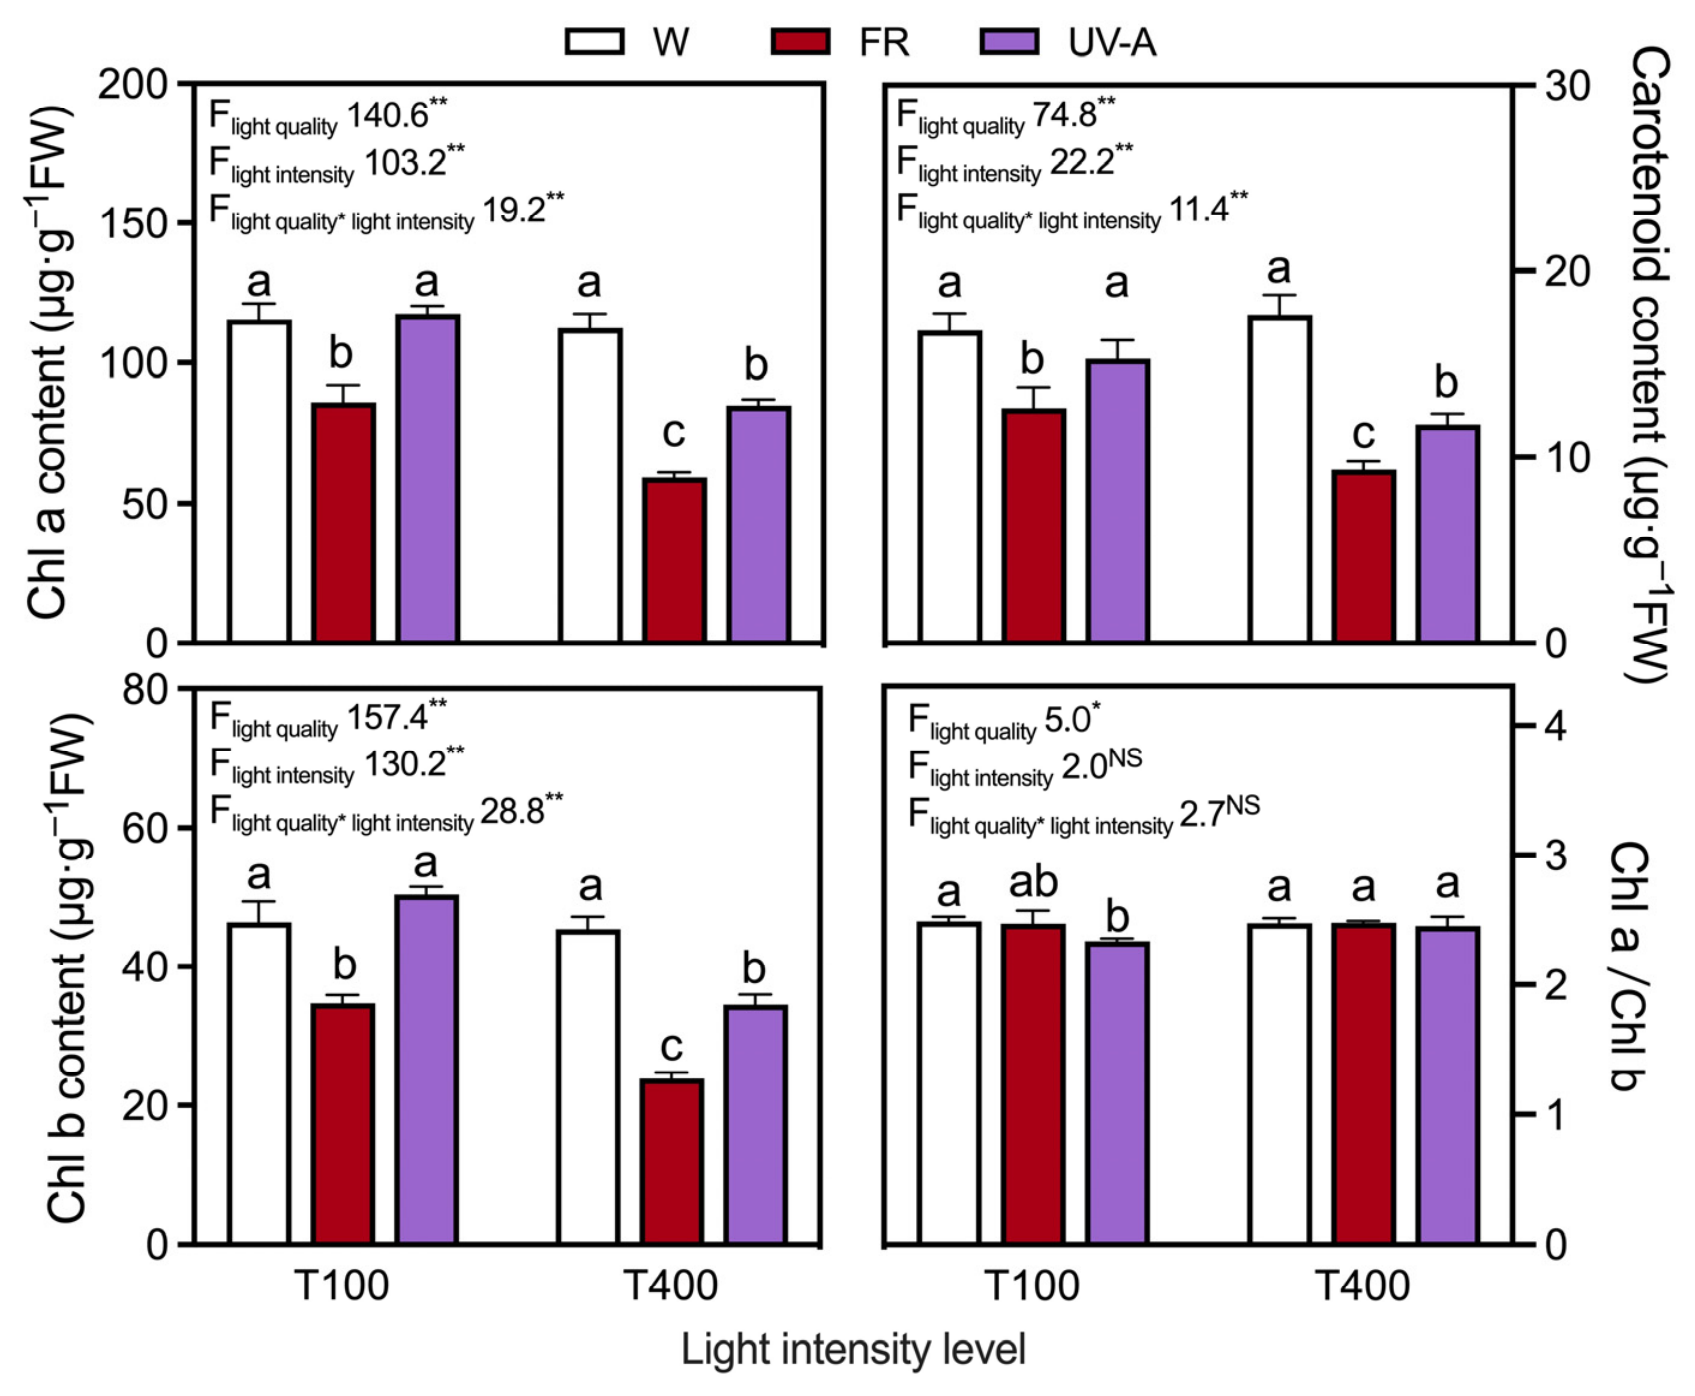
Under both the T100 and T400 light levels, the addition of FR significantly decreased the content of chlorophyll a, chlorophyll b, and carotenoids (Figure 3). The effect of UV-A on the photosynthetic pigment content depends on the light intensity: the addition of UV-A had no significant effect on the photosynthetic pigment contents under the T100 level, but significantly reduced the chlorophyll a, chlorophyll b, and carotenoid contents under the T400 level, albeit to a lesser extent than FR. It is worth noting that adding FR had no effect on the chlorophyll a/b ratio, while adding UV-A significantly reduced the chlorophyll a/b ratio under the T100 level. The F-value of the ANOVA analysis indicates that the effect of light quality on the content of photosynthetic pigments was more significant than that of light intensity.

3.4. Leaf Anatomical Structure

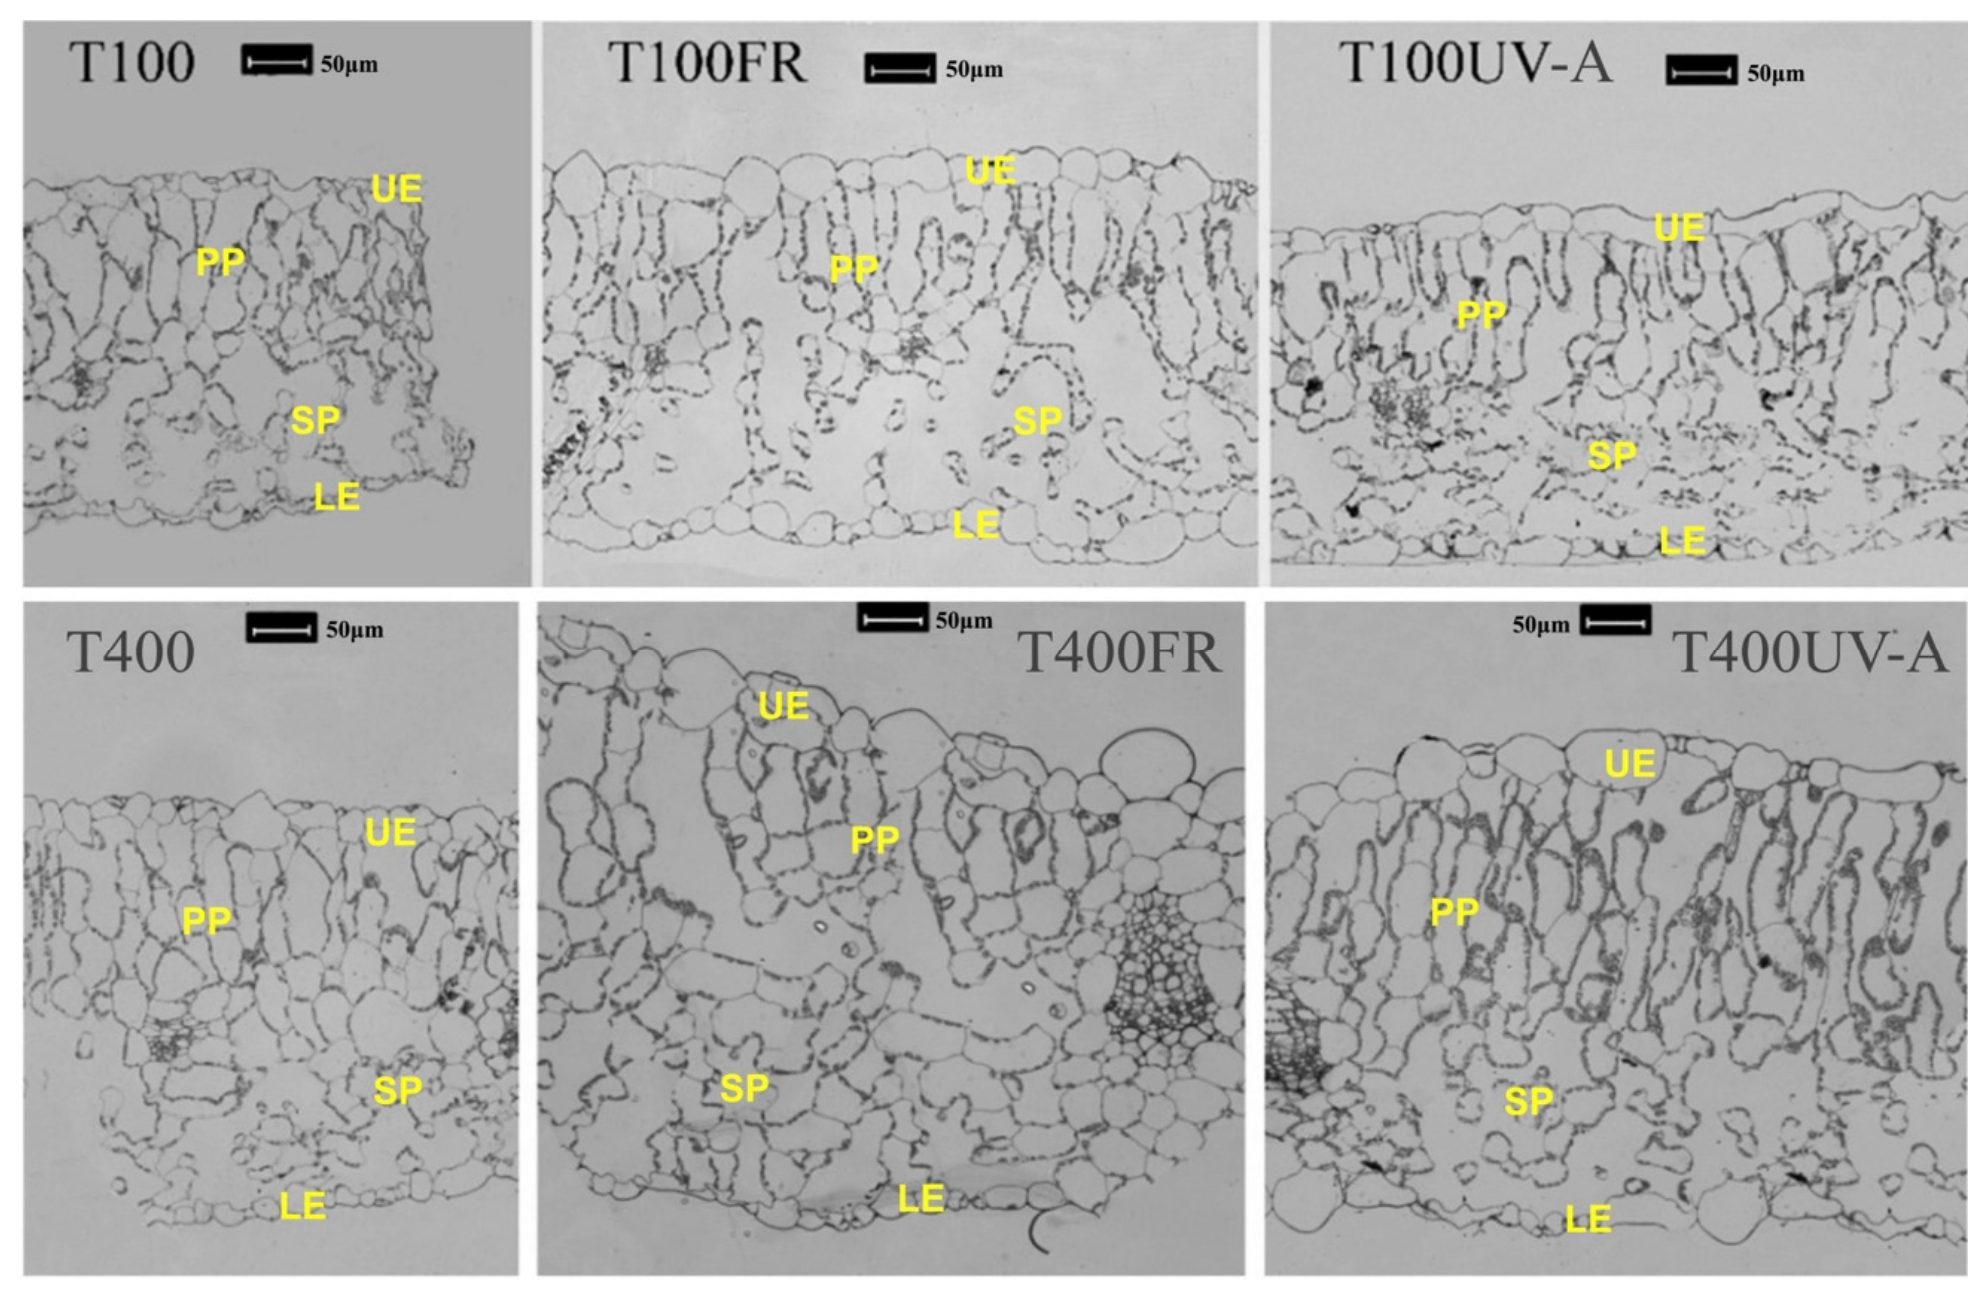
The effects of the FR and UV-A supplementation on the leaf anatomical structure were different and depended on the intensity level of the background white light (Figure 4, Table 3). Under the T100 level, FR significantly increased the total leaf thickness, upper epidermis thickness, spongy tissue thickness, and lower epidermis thickness of pak choi, while the palisade tissue thickness was significantly lower than that of the control (T100), indicating that FR primarily promoted the expansion of non-photosynthetic tissue layers. In contrast, T100UV-A significantly reduced the thickness of the lower epidermis, while no significant differences were observed in the total leaf thickness or other anatomical layers compared to T100, suggesting that, under a low light level, UV-A had a relatively weak regulatory effect on the leaf anatomy; and, under the T400 level, the total leaf thickness, upper epidermis thickness, palisade tissue thickness, and spongy tissue thickness of pak choi showed a consistent trend of T400FR > T400UV-A > T400. Both the T400FR and T400UV-A treatments resulted in significantly greater thickness across all anatomical layers compared to T400, indicating that FR and UV-A supplementation can markedly enhance the leaf structural development under a high light level, with the effect of FR being particularly prominent. An analysis of ANOVA showed that light intensity had the most significant effects on the thickness of the whole blade and palisade parenchyma, while the thickness of the upper epidermis and spongy parenchyma were mainly regulated by the light quality.

3.5. Nutritional Quality and Dietary Fiber Content

Under the T100 level, FR supplementation (T100FR) significantly increased the contents of soluble protein, soluble sugar, cellulose, hemicellulose, insoluble dietary fiber (IDF), and soluble dietary fiber (SDF) in pak choi, while no significant changes were observed in pectin, vitamin C, and nitrate contents (Table 4). UV-A supplementation (T100UV-A) significantly enhanced the levels of vitamin C, soluble protein, soluble sugar, and cellulose, and significantly reduced the nitrate content, whereas the pectin, hemicellulose, IDF, and SDF levels did not differ from the control (T100). Under the T400 level, T400FR treatment significantly increased the contents of soluble sugar, cellulose, pectin, and SDF, with no effect on the nitrate and hemicellulose content, whereas the vitamin C and soluble protein contents were significantly lower than those in the control (T400). In contrast, the T400UV-A treatment significantly improved the accumulation of vitamin C, soluble sugar, cellulose, pectin, IDF, and SDF, while simultaneously decreasing the soluble protein and nitrate contents. Moreover, the soluble sugar, nitrate, hemicellulose, pectin, SDF, and IDF contents in pak choi leaves under T400-level treatments were significantly greater than those in pak choi leaves grown under T100-level treatments. The ANOVA analysis showed that light intensity was the main factor regulating soluble sugars, nitrates, hemicellulose, pectin, SDF, and IDF, while vitamin C and cellulose were mainly regulated by light quality. The interaction between light intensity and light quality played a dominant role in regulating soluble protein.

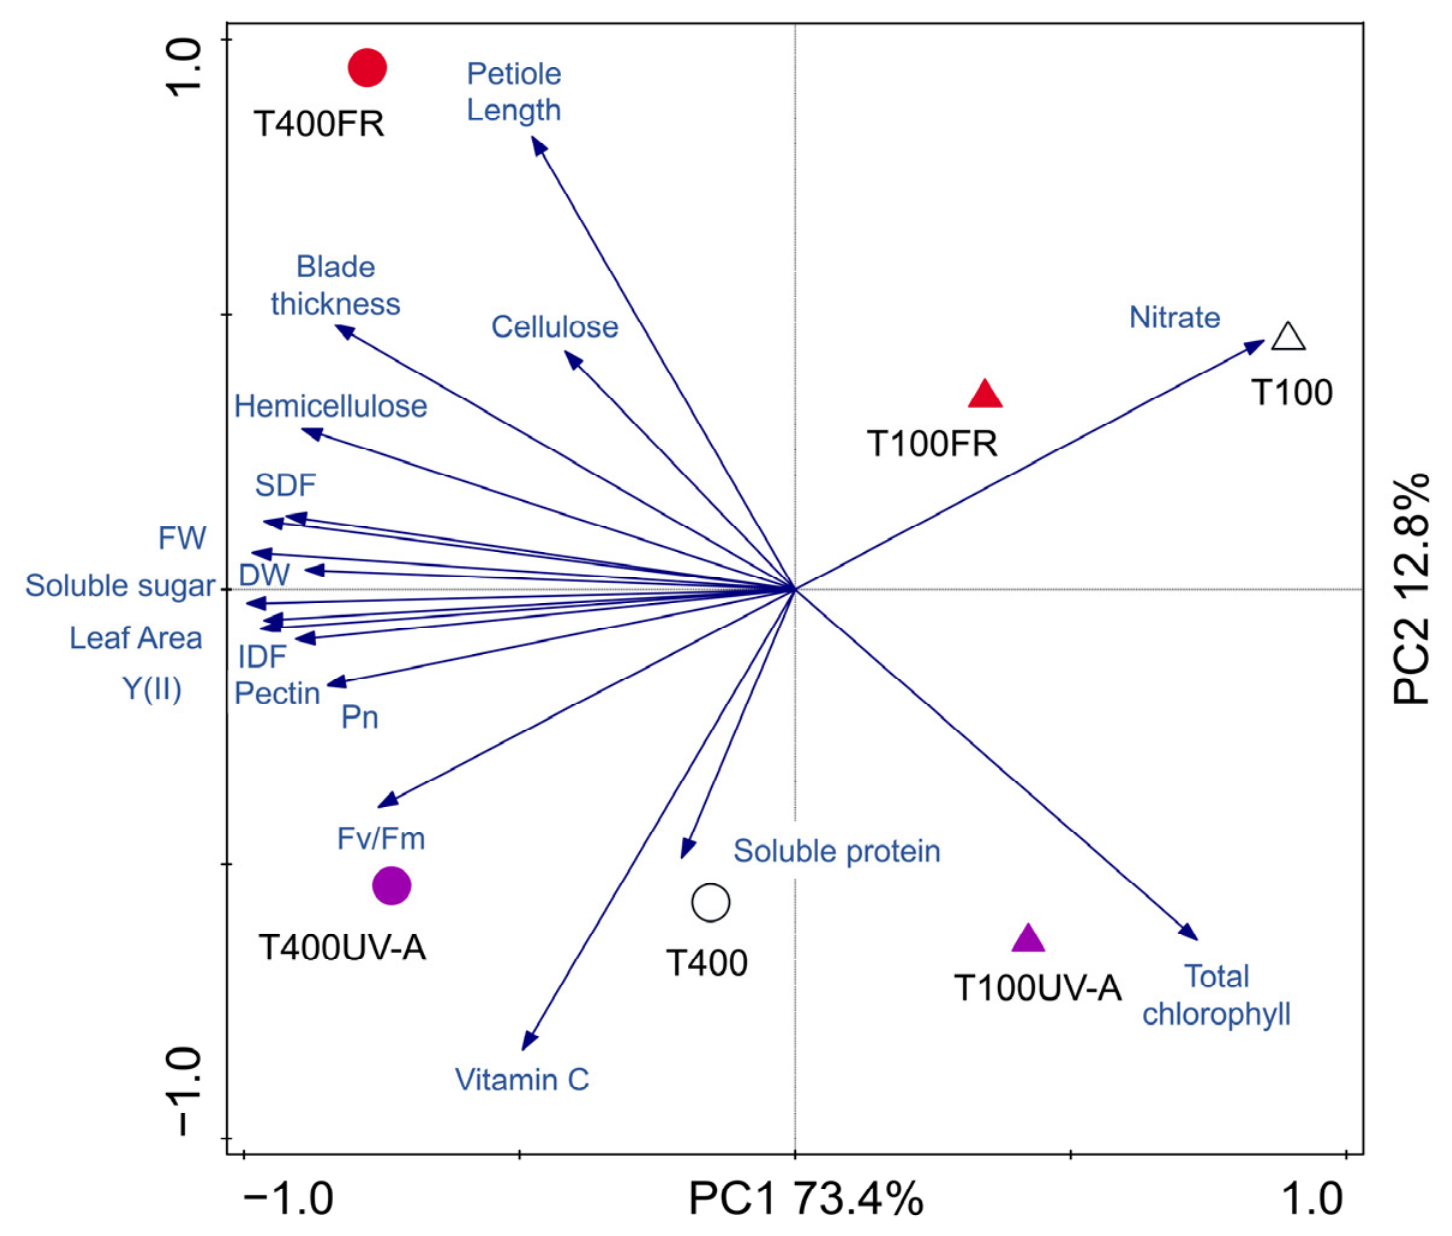
3.6. Principal Component Analysis of Biomass and Nutrient Content in Pak Choi

The results showed that the first two principal components, PC1 and PC2, explained 73.4% and 12.8% of the total variance, respectively, with a cumulative contribution of 86.2%, effectively capturing the variation among treatments (Figure 5). Along the PC1 axis, treatments under different light intensity levels were clearly separated: high-light-level treatments (T400, T400FR, and T400UV-A) were mainly distributed on the negative side of PC1, whereas low-light treatments (T100, T100FR, and T100UV-A) were primarily located on the positive side. Under the T400 level, the T400FR treatment was strongly associated with leaf morphological traits (e.g., leaf thickness and petiole length), cell wall components (cellulose and hemicellulose), and the soluble sugar content, indicating its promotive effects on biomass accumulation and structural substance synthesis. In contrast, the T400UV-A treatment was closely related to vitamin C, Fv/Fm, and Pn, suggesting a greater contribution to photosynthetic efficiency and the antioxidant capacity. Under the T100 level, the T100UV-A treatment showed a positive correlation with vitamin C and a negative correlation with the nitrate content, indicating that UV-A supplementation helped enhance the antioxidant capacity and reduce nitrate accumulation.

4. Discussion

4.1. Supplemental FR or UV-A Enhanced Photosynthetic Performance via Multiple Aspects Independent of Photosynthetic Pigments

Photosynthesis is a fundamental physiological process in leaves and plays a central role in plant growth and development. Previous studies have reported both stimulatory and inhibitory effects of FR or UV-A radiation on photosynthetic performance, depending on the plant species and environmental context [29,30,31]. In the present study, supplementation with FR and UV-A significantly increased the Pn and Tr of pak choi under both low and high light intensities. The improvement in photosynthetic efficiency can be attributed to both stomatal and non-stomatal factors. According to the model proposed by Farquhar and Sharkey [32], a concurrent increase in the intercellular CO2 concentration (Ci) and decrease in Pn generally indicate non-stomatal limitations, such as impaired mesophyll function. In our results, Gs and Ci remained unchanged under the T100 level with FR or UV-A, but both decreased under the T400 level following FR or UV-A supplementation. This suggests that the observed increase in Pn was likely driven by non-stomatal factors, particularly the enhanced photosynthetic activity of mesophyll cells. This interpretation is supported by the elevated values of Y(II), qL, and NPQ under FR and UV-A treatments, indicating an improved photochemical efficiency and enhanced energy dissipation capacity. Furthermore, the Fv/Fm ratio was significantly increased under the T100 level after FR and UV-A supplementation, suggesting that FR or UV-A can alleviate PSII photoinhibition under suboptimal light conditions and thereby maintain photosynthetic efficiency.
It has been reported that FR supplementation under low light may enhance the proton conductivity of the thylakoid membrane, thereby stimulating photosystem I (PSI) activity and increasing the PSII quantum yield [33]. FR radiation primarily excites PSI and accelerates the re-oxidization of plastoquinone, which accepts electrons from the excited PSII, thereby rendering PSII more rapidly available for new reactions [34]. Furthermore, FR could be perceived by phytochromes to activate signaling cascades and trigger downstream transcriptional changes that affect the light-harvesting complex composition, chloroplast development, and stomatal patterning, ultimately modulating the photosynthetic efficiency [35]. The enhancement in photosynthetic efficiency by UV-A radiation has been correlated with several physiological reasons, including the UV-A-induced activation of heat dissipation via the xanthophyll cycle, the increased synthesis of UV-absorbing pigments and antioxidants, the augmentation of stomatal conductance, and the reduction in the functional size of PSII [31,36,37].
In contrast to the photosynthetic efficiency, the chlorophyll content did not change significantly after UV-A supplementation, while FR supplementation significantly reduced the chlorophyll content under both light levels. A similar trend has been reported in other species: lettuce and kale grown under FR-containing spectra showed reduced chlorophyll levels [38], and a negative correlation was observed between the chlorophyll content and FR intensity in different lettuce cultivars [39]. Additionally, UV-A-induced decreases in light-harvesting pigments have been documented in several species [31,40]. Notably, FR supplementation markedly increased the thickness of all leaf tissue layers, especially under the T400 level, with a notable expansion in the palisade and spongy mesophyll. The UV-A treatment also increased the leaf thickness, but only under the T400 level, primarily by increasing the thickness of the palisade layer and lower epidermis. Similar results have been reported by Victório et al. [41], who found that UV-A exposure enhanced the palisade parenchyma and abaxial epidermis thickness without affecting the spongy mesophyll or adaxial epidermis. Other studies have also shown that UV-A added to white light can significantly increase the thickness of the epidermal and spongy tissue layers [42]. Therefore, we can deduce that the increased leaf thickness, particularly in the palisade and spongy mesophyll layers, likely improves the internal light distribution and CO2 diffusion within the leaf, thereby compensating for the lower pigment concentration. In addition, the expansion of mesophyll cells may also generate mechanical tension on the epidermis, potentially affecting stomatal function through mechanosensitive channels, although this hypothesis requires further investigation.

4.2. Regulatory Modes of Supplemental FR or UV-A on Pak Choi Growth Depend on Light Intensity

Plant growth depends not only on the photosynthetic capacity but also on morphological traits such as the leaf area and orientation, which determine the canopy light interception. Numerous studies have demonstrated that supplementing FR radiation, which lowers the R/FR ratio, can enhance cell wall extensibility and thereby promote leaf expansion [31,43]. However, the role of UV-A radiation in morphological regulation remains less well understood and is known to be genotype- and context-dependent [31]. In the present study, under the T400 level, FR supplementation significantly promoted both leaf expansion and petiole elongation, thereby enhancing the plant’s capacity for light interception. In contrast, UV-A treatment primarily increased the leaf area but had little effect on the petiole length, indicating that FR was more effective than UV-A in improving the canopy structure for light capture. Under the T100 level, only the petiole length was enhanced by FR, whereas UV-A had minimal effects on morphological traits. The FR-induced increases in the leaf area and plant height likely contributed to improved light harvesting, consistent with previous findings that FR promotes a morphological adaptation to enhance light interception and thus boost the photosynthetic performance and yield [38,44]. Similarly, Yang et al. [45] reported that, although lower R/FR ratios reduced the chlorophyll content and photosynthetic rate, they significantly increased biomass accumulation and leaf expansion. Under low R:FR or supplemental FR, the inactivation of phyB stabilizes PIFs, which integrate auxin, GA, and BR signaling to transcriptionally activate cell-wall-loosening genes, thereby driving petiole elongation and leaf expansion [46,47]. In the present study, FR exhibited a more pronounced effect on biomass accumulation than UV-A. This may be partially attributed to petiole elongation, which enhances the spatial positioning of the leaves to capture the available light more efficiently. This indicates that the regulatory effects of FR and UV-A on plant morphology under a high light level play an indispensable role in promoting pak choi growth.

4.3. Divergent Regulatory Effects of Supplemental FR or UV-A on the Nutritional Quality of Pak Choi Under Different Light Intensity Conditions

Light quality plays a critical role in regulating leaf physiological and metabolic processes, thereby influencing the plant nutritional quality [48]. Previous studies have demonstrated that appropriate UV-A exposure enhances the accumulation of soluble sugars, anthocyanins, and other secondary metabolites, thereby improving the nutritional quality of crops such as lettuce. One of the most common metabolic responses to UV radiation is the biosynthesis of antioxidant compounds, including vitamin C, flavonoids, and phenolics [49]. Consistent with these findings, our study showed that UV-A supplementation significantly increased the contents of vitamin C and soluble sugars while reducing nitrate accumulation under both the T100 and T400 light intensity levels. Interestingly, the effect of UV-A on the soluble protein and dietary fiber contents varied depending on light intensity. Soluble protein was enhanced by UV-A under the T100 level, but decreased under the T400 light conditions. On the contrary, UV-A supplementation exhibited notable promotive effects on dietary fiber components only under the high light level. The role of UV-A in modulating cell expansion may underlie its effects on these components; previous research showed that UV-A exposure enhanced the adaxial epidermal thickness and cell length in multiple Mediterranean species [50], suggesting that UV-A may trigger a coordinated developmental response rather than acting solely as a stressor.
In contrast, FR radiation primarily modulated primary metabolism, particularly carbohydrate synthesis and allocation. A meta-analysis of 207 independent studies reported that FR supplementation increased the soluble sugar content by 19.12% while reducing soluble protein by 11.66% [30]. Our results support this trend: under a high light level, FR significantly increased soluble sugar levels and promoted the accumulation of dietary fiber contents, including cellulose, hemicellulose, pectin, and SDF, while concurrently decreasing the soluble protein content. These observations align with earlier findings that the accumulation of non-structural carbohydrates such as starch and sucrose is often accompanied by a relative decline in nitrogen-based compounds [51].

5. Conclusions

This study comprehensively evaluated the effects of supplementing far-red (FR) or UV-A radiation on the photosynthetic performance, morphological development, and nutritional quality of pak choi under different light intensity conditions. The results demonstrate that both FR and UV-A significantly enhance plant growth and comprehensive nutritional quality. At an equivalent supplemental intensity, FR exhibited a more pronounced promoting effect on the biomass accumulation, photosynthetic efficiency, leaf thickness, as well as the soluble sugar and cellulose content of pak choi compared with UV-A. Conversely, UV-A was more effective in reducing the nitrate content and increasing the vitamin C content. In addition, the specific regulatory modes of FR or UV-A in promoting growth were dependent on the light intensity. Under low-light conditions, both FR and UV-A exhibited more visible promotion effects on the photosynthetic activity of mesophyll photosystems, as indicated by Y(II), qL, and Fv/Fm, as well as the protein content. Under high-light conditions, improvements in the leaf area and anatomical traits—such as increased leaf thickness and spongy tissue expansion—contributed substantially to enhancing plant-level photosynthetic efficiency. Furthermore, from the perspective of energy consumption, supplementing FR or UV-A at high light intensity levels is beneficial for improving the efficiency of electricity utilization. Collectively, these findings underscore the differential roles of FR and UV-A in modulating the photosynthetic efficiency, morphological architecture, and nutritional composition in pak choi, and highlight the importance of tailoring FR or UV-A supplementation strategies to ambient light intensity for optimized crop production and quality enhancement in controlled environments.

Author Contributions

Conceptualization, J.Z.; methodology, L.Z. and Z.C.; validation, X.Z. and X.H.; formal analysis, X.Z.; investigation, L.Z.; resources, X.H. and L.L.; data curation, L.Z., X.Z., L.L. and Z.C.; writing—original draft preparation, L.Z. and X.Z.; writing—review and editing, J.Z., X.H. and L.L.; visualization, L.Z. and X.Z.; supervision, J.Z.; project administration, J.Z.; funding acquisition, J.Z. All authors have read and agreed to the published version of the manuscript.

Funding

This work was supported in part by the Shanghai Agricultural Science and Technology (Grant No. K2024-02-08-00-12-F00001), and the National Natural Science Foundation of China (Project No. 32401686). Any opinions, findings, conclusions, or recommendations expressed in this publication are those of the authors and do not necessarily reflect the view of Shanghai Municipal Agriculture and Rural Affairs Commission or National Natural Science Foundation of China.

Data Availability Statement

The original contributions presented in this study are included in the article. Further inquiries can be directed to the corresponding author.

Conflicts of Interest

Author Liping Liu is employed by the Shanghai Sunqiaoyijia Tech-agriculture Co., Ltd. The remaining authors declare that the research was conducted in the absence of any commercial or financial relationships that could be construed as a potential conflict of interest.

References

  1. Chen, M.; Chory, J.; Fankhauser, C. Light signal transduction in higher plants. Annu. Rev. Genet. 2004, 38, 87–117. [Google Scholar] [CrossRef] [PubMed]
  2. Wang, H.; Ma, L.; Li, J.; Zhao, H.; Deng, X. Direct interaction of arabidopsis cryptochromes with COP1 in light control development. Science 2001, 294, 154–158. [Google Scholar] [CrossRef] [PubMed]
  3. Smith, H. Phytochromes and light signal perception by plants—An emerging synthesis. Nature 2000, 407, 585–591. [Google Scholar] [CrossRef] [PubMed]
  4. Lichtenthaler, H.K.; Langsdorf, G.; Lenk, S.; Buschmann, C. Chlorophyll fluorescence imaging of photosynthetic activity with the flash-lamp fluorescence imaging system. Photosynthetica 2005, 43, 355–369. [Google Scholar] [CrossRef]
  5. Franklin, K.A.; Quail, P.H. Phytochrome functions in Arabidopsis development. J. Exp. Bot. 2010, 61, 11–24. [Google Scholar] [PubMed]
  6. Casal, J.J. Photoreceptor signaling networks in plant responses to shade. Annu. Rev. Plant Biol. 2013, 64, 403–427. [Google Scholar] [CrossRef] [PubMed]
  7. McCree, K.J. The action spectrum, absorptance and quantum yield of photosynthesis in crop plants. Agric. Meteorol. 1971, 9, 191–216. [Google Scholar] [CrossRef]
  8. Zhen, S.; Bugbee, B. Far-red photons have equivalent efficiency to traditional photosynthetic photons: Implications for redefining photosynthetically active radiation. Plant Cell Environ. 2020, 43, 1259–1272. [Google Scholar] [CrossRef] [PubMed]
  9. Li, J.; Li, Y.; Chen, Y.; Xu, S.; Wu, X.; Wu, C.; Zhang, N.; Cao, K. Quantifying the effects of far-red light on lettuce growth and morphology in indoor production systems using a 3D modelling approach. Front. Plant Sci. 2024, 15, 1492431. [Google Scholar] [CrossRef] [PubMed]
  10. Driesen, E.; Saeys, W.; Proft, M.D.D.; Lauwers, A.; Ende, W.V.D. Far-Red light mediated carbohydrate concentration changes in leaves of sweet basil, a stachyose translocating plant. Int. J. Mol. Sci. 2023, 24, 8378. [Google Scholar] [CrossRef] [PubMed]
  11. Jang, I.T.; Lee, J.H.; Shin, E.J.; Nam, S.Y. Evaluation of Growth, Flowering, and Chlorophyll Fluorescence Responses of Viola cornuta cv. Penny Red Wing according to Spectral Power Distributions. J. People Plants Environ. 2023, 26, 335–349. [Google Scholar] [CrossRef]
  12. Christopher, D. Separate photosensory pathways co-regulate blue light/ultraviolet-A-activated psbD-psbC transcription and light-induced D2 and CP43 degradation in barley (Hordeum vulgare) chloroplasts. Plant Physiol. 1994, 104, 1119–1129. [Google Scholar] [CrossRef] [PubMed]
  13. Tezuka, T.; Hotta, T.; Watanabe, I. Growth promotion of tomato and radish plants by solar UV radiation reaching the Earth’s surface. J. Photochem. Photobiol. B Biol. 1993, 19, 61–66. [Google Scholar] [CrossRef]
  14. Wang, F.; Yan, J.; Ahammed, G.J.; Wang, X.; Xin, B.; Xiang, H.; Li, Y.; Lu, J.; Liu, Y.; Qi, H.; et al. PGR5/PGRL1 and NDH mediated far-red light-induced photoprotection in response to chilling stress in tomato. Front. Plant Sci. 2020, 11, 669. [Google Scholar] [CrossRef] [PubMed]
  15. Holalu, S.V.; Reddy, S.K.; Finlayson, S.A. Low red light:far red light inhibits branching by promoting auxin signaling. J. Plant Growth Regul. 2020, 40, 2028–2036. [Google Scholar] [CrossRef]
  16. Chen, Z.; Yuan, Z.W.; Luo, W.X.; Wu, X.; Pan, J.L.; Yin, Y.Q.; Shao, H.C.; Xu, K.; Li, W.Z.; Hu, Y.L.; et al. UV-A radiation increases biomass yield by enhancing energy flow and carbon assimilation in the edible cyanobacterium Nostoc sphaeroides. Appl. Environ. Microbiol. 2024, 90, 21. [Google Scholar] [CrossRef]
  17. Li, Y.; Zheng, Y.; Zheng, D.; Zhang, Y.; Liu, H. Effects of supplementary blue and UV-A LED lights on morphology and phytochemicals of brassicaceae baby-leaves. Molecules 2020, 25, 5678. [Google Scholar] [CrossRef] [PubMed]
  18. Chen, Y.; Li, T.; Yang, Q.; Zhang, Y.; Wan, X. UVA radiation is beneficial for yield and quality of indoor cultivated lettuce. Front. Plant Sci. 2019, 10, 1563. [Google Scholar] [CrossRef] [PubMed]
  19. Lu, H.Y. The Key Cultivation of Non-Heading Chinese Cabbage in Plant Factory. Master’s Thesis, Nanjing Agricultural University, Nanjing, China, 2015. (In Chinese) [Google Scholar]
  20. Yu, J.H. Effects of Intermittent Light on the Growth and Development of Pak-Choi Microgreen and Its Analysis. Master’s Thesis, South China Agricultural University, Guangzhou, China, 2023. (In Chinese) [Google Scholar]
  21. Yang, Q.C.; Wei, L.L.; Liu, W.K.; Chen, R.F. Plant Factory Systems and Practices, 2nd ed.; Chemical Industry Press: Beijing, China, 2023; p. 167. (In Chinese) [Google Scholar]
  22. Kitajima, M.; Butler, W. Quenching of chlorophyll fluorescence and primary photochemistry in chloroplasts by dibromothymoquinone. Biochim. Biophys. Acta 1975, 376, 105–115. [Google Scholar] [CrossRef] [PubMed]
  23. Genty, B.; Briantais, J.M.; Baker, N.R. The relationship between the quantum yield of photosynthetic electron transport and quenching of chlorophyll fluorescence. Biochim. Biophys. Acta 1989, 990, 87–92. [Google Scholar] [CrossRef]
  24. Kramer, D.M.; Johnson, G.; Kiirats, O.; Edwards, G.E. New fluorescence parameters for the determination of QA redox state and excitation energy fluxes. Photosynth. Res. 2004, 79, 209–218. [Google Scholar] [CrossRef] [PubMed]
  25. Schreiber, U.; Klughammer, C.; Kolbowski, J. Assessment of wavelength-dependent parameters of photosynthetic electron transport with a new type of Multi-Color-PAM chlorophyll fluorometer. Photosynth. Res. 2012; in press.
  26. Cao, J.K.; Jiang, W.B.; Zhao, Y.M. Experiment Guidance of Postharvest Physiology and Biochemistry of Fruits and Vegetables; China Light Industry Press Ltd.: Beijing, China, 2017. (In Chinese) [Google Scholar]
  27. GB 5009.88-2023; National Food Safety Standard—Determination of Dietary Fiber in Food. Standards Press of China: Beijing, China, 2023. (In Chinese)
  28. Foster, C.E.; Martin, T.M.; Pauly, M. Comprehensive compositional analysis of plant cell walls (Lignocellulosic biomass) Part II: Carbohydrates. JoVE 2010, 37, e1837. [Google Scholar] [CrossRef]
  29. Carotti, L.; Pistillo, A.; Zauli, I.; Pennisi, G.; Martin, M.; Gianquinto, G.; Orsini, F. Far-red radiation management for lettuce growth: Physiological and morphological features leading to energy optimization in vertical farming. Sci. Hortic. 2024, 334, 113264. [Google Scholar] [CrossRef]
  30. Zhang, M.; Ju, J.; Hu, Y.; He, R.; Song, J.; Liu, H. Meta-analysis of the impact of far-red light on vegetable crop growth and quality. Plants 2024, 13, 2508. [Google Scholar] [CrossRef] [PubMed]
  31. Verdaguer, D.; Jansen, M.A.K.; Llorens, L.; Morales, L.O.; Neugart, S. UV-A radiation effects on higher plants: Exploring the known unknown. Plant Sci. 2017, 255, 72–81. [Google Scholar] [CrossRef] [PubMed]
  32. Farquhar, G.D.; Sharkey, T.D. Stomatal conductance and photosynthesis. Annu. Rev. Plant Physiol. 1982, 33, 317–345. [Google Scholar] [CrossRef]
  33. Masaru, K.; Hikaru, K.; Naoki, M.; Wataru, Y.; Yoshihiro, S.; Ichiro, T. Far-red light accelerates photosynthesis in the low-light Phases of fluctuating Light. Plant Cell Physiol. 2020, 61, 192–202. [Google Scholar]
  34. Zhen, S.; Van Iersel, M.W. Far-red light is needed for efficient photochemistry and photosynthesis. J. Plant Physiol. 2017, 209, 115–122. [Google Scholar] [CrossRef] [PubMed]
  35. Hu, C.; Nawrocki, W.J.; Croce, R. Long-term adaptation of Arabidopsis thaliana to far-red light. Plant Cell Environ. 2021, 44, 3004–3018. [Google Scholar] [CrossRef]
  36. Štroch, M.; Materová, Z.; Vrábl, D.; Karlický, V.; Šigut, L.; Nezval, J.; Špunda, V. Protective effect of UV-A radiation during acclimation of the photosynthetic apparatus to UV-B treatment. Plant Physiol. Biochem. 2015, 96, 90–96. [Google Scholar] [CrossRef] [PubMed]
  37. Joshi, P.N.; Ramaswamy, N.K.; Iyer, R.K.; Nair, J.S.; Pradhan, M.K.; Gartia, S.; Biswal, S.; Biswal, U.C. Partial protection of photosynthetic apparatus from UV-B-induced damage by UV-A radiation. Environ. Exp. Bot. 2007, 59, 166–172. [Google Scholar] [CrossRef]
  38. Meng, Q.; Kelly, N.; Runkle, E.S. Substituting green or far-red radiation for blue radiation induces shade avoidance and promotes growth in lettuce and kale. Environ. Exp. Bot. 2019, 162, 383–391. [Google Scholar] [CrossRef]
  39. Liu, J.; van Iersel, M.W. Far-red light effects on lettuce growth and morphology in indoor production are cultivar specific. Plants 2022, 11, 2714. [Google Scholar] [CrossRef] [PubMed]
  40. Soriano, G.; Del-Castillo-Alonso, M.; Monforte, L.; Tomás-Las-Heras, R.; Martínez-Abaigar, J.; Núñez-Olivera, E. Photosynthetically-active radiation, UV-A and UV-B, causes both common and specific damage and photoprotective responses in the model liverwort Marchantia polymorpha subsp. Ruderalis. Photochem. Photobiol. Sci. 2019, 18, 400–412. [Google Scholar] [CrossRef] [PubMed]
  41. Victório, C.P.; Leal-Costa, M.V.; Tavares, E.S.; Kuster, R.M.; Lage, C.L.S. Effects of supplemental UV-A on the development, anatomy, and metabolite production of Phyllanthus tenellus cultured in vitro. Photochem. Photobiol. 2011, 87, 685–689. [Google Scholar] [CrossRef] [PubMed]
  42. Constantino, L.; Nascimento, L.; Casanova, L.; Moreira, N.; Menezes, E.; Esteves, R.; Costa, S.; Tavares, E. Responses of crepis japonica induced by supplemental blue light and UV-A radiation. Photochem. Photobiol. Sci. 2017, 16, 238–245. [Google Scholar] [CrossRef] [PubMed]
  43. Shmarev, A.; Vereshagin, M.; Pashkovskiy, P.; Kreslavski, V.D.; Allakhverdiev, S.I. Influence of additional far-red light on the photosynthetic and growth parameters of lettuce plants and the resistance of the photosynthetic apparatus to high irradiance. Photosynthetica 2024, 62, 180–186. [Google Scholar] [CrossRef] [PubMed]
  44. Seavers, C.A.; Davey, M.R.; Scholefield, R.J. Effects of far-red light on photosynthesis and growth of tomato plants. J. Exp. Bot. 1991, 42, 123–132. [Google Scholar]
  45. Kozuka, T.; Kobayashi, J.; Horiguchi, G.; Demura, T.; Sakakibara, H.; Tsukaya, H.; Nagatani, A. Involvement of Auxin and Brassinosteroid in the Regulation of Petiole Elongation under the Shade. Plant Physiol. 2010, 153, 1608–1618. [Google Scholar] [CrossRef] [PubMed]
  46. Kurepin, L.V.; Walton, L.J.; Hayward, A.; Emery, R.J.N.; Pharis, R.P.; Reid, D.M. Interactions between Plant Hormones and Light Quality Signaling in Regulating the Shoot Growth of Arabidopsis thaliana Seedlings. Botany 2012, 90, 237–246. [Google Scholar] [CrossRef]
  47. Yang, F.; Liu, Q.; Cheng, Y.; Feng, L.; Wu, X.; Fan, Y.; Raza, M.A.; Wang, X.; Yong, T.; Liu, W.; et al. Low red/far-red ratio as a signal promotes carbon assimilation of soybean seedlings by increasing the photosynthetic capacity. BMC Plant Biol. 2020, 20, 148. [Google Scholar] [CrossRef] [PubMed]
  48. Darko, E.; Heydarizadeh, P.; Schoefs, B.; Sabzalian, M.R. Photosynthesis under artificial light: The shift in primary and secondary metabolism. Philos. Trans. R. Soc. Lond. 2014, 369, 20130243. [Google Scholar] [CrossRef]
  49. Taub, D.R.; Wang, X. Why are nitrogen concentrations in plant tissues lower under elevated CO2? A critical examination of the hypotheses. J. Integr. Plant Biol. 2010, 50, 1365–1374. [Google Scholar]
  50. Liakoura, V.; Bornman, J.F.; Karabourniotis, G. The ability of abaxial and adaxial epidermis of sun and shade leaves to attenuate UV-A and UV-B radiation in relation to the UV absorbing capacity of the whole leaf methanolic extracts. Physiol. Plant. 2010, 117, 33–43. [Google Scholar]
  51. He, R.; Zhang, Y.; Song, S.; Su, W.; Hao, Y.; Liu, H. UV-A and FR irradiation improves growth and nutritional properties of lettuce grown in an artificial light plant factory. Food Chem. 2021, 345, 128727. [Google Scholar] [CrossRef] [PubMed]
Figure 1. Spectral distribution of different light treatments.
Horticulturae 12 00933 g001
Figure 2. Effect of FR or UV-A supplementation under different light intensity levels on photosynthetic physiological characteristics of pak choi (mean ± SD, n = 5). Lowercase letters indicate significant difference among treatments at 0.05 level. For these ANOVA effects, * and ** indicate significance at p < 0.05 and p < 0.01 levels, respectively; NS indicates nonsignificance. Pn (net photosynthetic rate), Gs (stomatal conductance), Ci (intercellular CO2 concentration), Tr (transpiration rate), Fv/Fm (Maximum photochemical efficiency of PSII), Y(II) (Actual photochemical efficiency of PSII), qL (photochemical quenching coefficient), and ETR (relative electron transport rate).
Horticulturae 12 00933 g002
Figure 3. Effect of FR or UV-A supplementation under different light intensity levels on photosynthetic pigment contents of pak choi (mean ± SD, n = 3). Lowercase letters indicate significant difference among treatments at 0.05 level. For these ANOVA effects, * and ** indicate significance at p < 0.05 and p < 0.01 levels, respectively; NS indicates nonsignificance.
Horticulturae 12 00933 g003
Figure 4. Effect of FR or UV-A supplementation under different light intensity levels on anatomical characteristics of pak choi. UE (Upper Epidermis), PP (Palisade Parenchyma), SP (Spongy Parenchyma), and LE (Lower Epidermis).
Horticulturae 12 00933 g004
Figure 5. Principal component analysis of growth and physiological parameters in pak choi leaves under different light treatments. DW (dry weight), FW (fresh weight), Fv/Fm (Maximum photochemical efficiency of PSII), IDF (insoluble dietary fiber), Pn (net photosynthetic rate), SDF (soluble dietary fiber), and Y(II) (Actual photochemical efficiency of PSII).
Horticulturae 12 00933 g005
Table 1. Light spectral and intensity of each treatment.
Light TreatmentsLight Intensity/μmol·m−2·s−1DLI
mmol·m−2·d−1
Total Power/W
WFRUV-A
T100100//5.7622.0
T100FR10040/8.0637.7
T100UV-A100/408.0636.4
T400400//23.0493.4
T400FR40040/25.34109.1
T400UV-A400/4025.34107.8
Table 2. Effect of FR or UV-A supplementation under different light intensity levels on biomass and leaf morphology of pak choi.
Light TreatmentsFresh Weight
g·10 Plants−1
Dry Weight
g·10 Plants−1
Leaf Area cm2Leaf Length cmLeaf Width cmPetiole Length
cm
Relative
EUE
T10024 ± 1.4 b1.3 ± 0.04 c18.4 ± 0.5 c5.0 ± 0.2 b3.8 ± 0.2 bc3.7 ± 0.3 c100%
T100FR28 ± 1.7 a1.8 ± 0.11 a17.6 ± 0.4 c4.8 ± 0.3 b3.7 ± 0.3 c4.3 ± 0.2 b80.8%
T100UV-A26 ± 0.4 ab1.6 ± 0.01 b17.2 ± 0.4 c5.0 ± 0.1 b3.9 ± 0.2 bc3.5 ± 0.2 c74.4%
T40046 ± 3.5 c3.4 ± 0.11 c20.1 ± 0.7 b5.3 ± 0.4 ab4.6 ± 0.1 ab3.6 ± 0.4 c61.6%
T400FR67 ± 1.0 a5.6 ± 0.17 a25.1 ± 0.8 a4.8 ± 0.2 b4.2 ± 0.5 b4.9 ± 0.1 a86.9%
T400UV-A51 ± 0.9 b5.1 ± 0.24 b24.7 ± 1.9 a5.7 ± 0.2 a4.8 ± 0.1 a3.8 ± 0.2 bc80.1%
FLight quality74.7 **156.6 **4.5 *6.8 **4.1 *27.0 **/
FLight intensity1165.5 **2371.7 **113.7 **8.5 **36.3 **5.7 */
FLight quality×Light intensity35.9 **74.7 **14.1 **2.7 NS1.3 NS2.8 NS/
Note: Data are presented as means ± SD (n = 5/3). Lowercase letters indicate significant difference among treatments at 0.05 level. For these ANOVA effects, * and ** indicate significance at p < 0.05 and p < 0.01 levels, respectively; NS indicates nonsignificance.
Table 3. Effect of FR or UV-A supplementation under different light intensity levels on thickness of leaf anatomical layers of pak choi.
Light
Treatments
Thickness of Leaf Anatomical Layers/μm
BladeUpper EpidermisPalisade ParenchymaSpongy ParenchymaLower Epidermis
T100330.0 ± 7.2 cd20.8 ± 1.50 d125.7 ± 1.9 cd157.7 ± 5.6 bc25.8 ± 2.49 c
T100FR347.3 ± 9.5 c34.7 ± 1.32 b106.8 ± 3.5 d167.8 ± 8.3 b38.2 ± 2.60 a
T100UV-A319.1 ± 19.4 d19.8 ± 1.38 d124.5 ± 12.5 cd162.0 ± 9.5 b12.8 ± 0.80 d
T400328.2 ± 6.4 cd24.7 ± 1.14 c140.9 ± 4.9 c149.0 ± 6.3 c13.6 ± 1.19 d
T400FR475.2 ± 14.6 a41.7 ± 1.56 b219.7 ± 13.9 a190.3 ± 2.4 a23.5 ± 1.02 c
T400UV-A418.4 ± 16.8 b34.3 ± 1.57 a191.1 ± 16.4 b160.3 ± 3.8 bc32.8 ± 0.67 b
FLight quality57.7 **188.6 **13.9 **25.0 **71.8 **
FLight intensity144.5 **159.9 **172.6 **1.8 NS8.7 *
FLight quality×Light intensity39.6 **22.2 **13.9 **9.7 **203.3 **
Note: Data are presented as means ± SD (n = 3). Lowercase letters indicate significant difference among treatments at 0.05 level. For these ANOVA effects, * and ** indicate significance at p < 0.05 and p < 0.01 levels, respectively; NS indicates nonsignificance.
Table 4. Effect of FR or UV-A supplementation under different light intensity levels on nutrient and cellulose content of pak choi.
Light TreatmentsVatamin C
μg·g−1 FW
Soluble Protein
mg·g−1 FW
Soluble Sugar
mg·g−1 FW
Nitrate
mg·g−1 FW
Cellulose
mg·g−1
Hemicellulose
mg·g−1 CW
Pectin
mg·g−1 CW
Insoluble Dietary Fiber
g·100 g−1 FW
Soluble Dietary Fiber
g·100 g−1 FW
T100153 ± 5 c8 ± 0.2 c25 ± 2.1 c6.7 ± 0.27 a135 ± 2.7 e29.5 ± 2.43 b3.7 ± 0.11 a1.23 ± 0.07 d0.27 ± 0.01 c
T100FR158 ± 11 c14 ± 0.6 a37 ± 1.8 b6.3 ± 0.50 ab197 ± 7.6 a36.4 ± 0.9 a3.6 ± 0.27 a1.46 ± 0.1 c0.34 ± 0.02 b
T100UV-A247 ± 6 b13 ± 0.2 a40 ± 3.6 b5.8 ± 0.19 b196 ± 1.6 b32 ± 0.87 b3.4 ± 0.08 a1.35 ± 0.05 cd0.29 ± 0.03 c
T400243 ± 24 b14 ± 0.4 a43 ± 1.5 b5.0 ± 0.31 c145 ± 4.4 d33.8 ± 4.39 a5.4 ± 0.04 c1.53 ± 0.05 bc0.32 ± 0.02 bc
T400FR172 ± 6 c11 ± 1.0 b62 ± 3.0 a5.2 ± 0.45 bc202 ± 4.2 a41.6 ± 2.95 a6.8 ± 0.08 b1.7 ± 0.06 ab0.46 ± 0.02 a
T400UV-A327 ± 14 a11 ± 1.0 b57 ± 4.0 a3.9 ± 0.14 d161 ± 1.2 c38.7 ± 2.29 a9.7 ± 0.13 a1.84 ± 0.09 a0.49 ± 0.01 a
FLight quality143.1 **8.4 **27.4 **15.5 **308.8 **11.9 **320.4 **15.8 **57.1 **
FLight intensity102.0 **0.7 NS112.5 **99.7 **1.4 NS19.4 **3150.9 **98.5 **196.9 **
FLight quality × Light intensity15.6 **111.5 **1.6 NS3.3 NS8.1 **0.3 NS394.5 **4.8 **25.9 **
Note: Data are presented as means ± SD (n = 3). Lowercase letters indicate significant difference among treatments at 0.05 level. For these ANOVA effects, ** indicate significance at p < 0.01 level; NS indicates nonsignificance.
Disclaimer/Publisher’s Note: The statements, opinions and data contained in all publications are solely those of the individual author(s) and contributor(s) and not of MDPI and/or the editor(s). MDPI and/or the editor(s) disclaim responsibility for any injury to people or property resulting from any ideas, methods, instructions or products referred to in the content.