1. Introduction
Lettuce (
Lactuca sativa) is a major leafy vegetable cultivated worldwide [
1] and is rich in bioactive compounds, including polyphenols, carotenoids, and chlorophylls, which are associated with various health benefits [
2]. Because leaves constitute the primary harvestable organ, the number of leaves and leaf area are key indicators of developmental status and harvestable biomass [
3]. Leaf appearance reflects the progression of leaf development, whereas leaf expansion determines canopy radiation interception and contributes to biomass production [
4,
5]. Therefore, reliable prediction of the number of leaves and total leaf area (TLA) is essential for providing structural inputs to canopy photosynthesis and dry matter production models [
6,
7,
8].
Thermal time approaches based on growing degree days (GDD) have been widely used to quantify leaf development in various horticultural crops. GDD-based models have been applied to the growth analysis and modeling of lettuce, onion, and red beet [
9,
10], prediction of environmental effects on lettuce growth [
11], estimation of base temperature and thermal requirements in escarole [
12], and prediction of the number of leaves and leaf area in pak-choi [
13]. However, GDD-based approaches generally assume that the developmental rate increases linearly with temperature above a base temperature [
14,
15]. This assumption limits their ability to represent nonlinear temperature responses, particularly near the optimum temperature or under supra-optimal temperature conditions [
16,
17].
The beta function proposed by Yan and Hunt [
16] provides a simple mathematical framework for describing nonlinear temperature responses. This temperature response function has been used to describe leaf appearance rate in onion [
18] and incorporated into the process-based model MAIZSIM to simulate maize leaf development and growth on an individual-leaf basis [
19]. A process-based model for garlic has also been developed to track leaf initiation, appearance, maturation, and senescence on an individual-leaf basis [
20]. In lettuce, however, previous models have primarily focused on dry matter production using radiation, CO
2 concentration, and temperature as input variables, whereas leaf area has often been represented as an integrated plant-level variable through specific leaf area (SLA) or leaf area index (LAI) [
3,
21,
22]. Other studies on lettuce have described seasonal increases in fresh and dry weights using Gompertz or logistic growth functions, with accumulated GDD as the independent variable [
23,
24].
Approaches based on GDD accumulation, SLA- or LAI-based representations, and whole-plant growth functions share a common limitation in that they do not explicitly distinguish leaf appearance from leaf expansion, despite evidence that these processes may be governed by distinct temperature responses. Different temperature responses for leaf appearance and expansion have been reported in wheat [
25] and barley [
26]. Individual-leaf-based studies in maize [
27] and garlic [
20] have also shown that potential leaf length varies among leaf ranks, indicating that leaf position is an important determinant of leaf area formation. In addition, SLA- and LAI-related traits can vary with light conditions and developmental stage, even under similar mean temperatures [
28,
29]. These characteristics are difficult to represent using integrated plant-level variables alone but can be more explicitly incorporated into an individual-leaf-based modeling framework. Therefore, a modeling approach that combines nonlinear temperature responses with an individual-leaf-level structure is needed to account for dynamic environmental conditions. However, its application to the simultaneous prediction of leaf appearance and expansion in lettuce remains limited.
This study aimed to develop and evaluate a model for predicting leaf appearance and expansion in romaine lettuce (
L. sativa var.
longifolia) by separately simulating these processes at the individual-leaf level using the beta function proposed by Yan and Hunt [
16]. The model was calibrated using datasets collected from a temperature-gradient greenhouse (TGG) across the spring, summer, and autumn growing seasons and evaluated using independent datasets obtained from a commercial greenhouse. Furthermore, this study aimed to quantitatively describe leaf development in response to temperature and light conditions and to provide a structural framework for future integration with canopy photosynthesis and biomass production models.
2. Materials and Methods
2.1. Experimental Greenhouses and Plant Materials
Experiments for model calibration were conducted in a single-span polyolefin film greenhouse (35 × 6.5 × 3.5 m, length × width × height) at the experimental farm of the Jeonbuk State Agricultural Research and Extension Services in Iksan, Republic of Korea (35°56′29.5″ N, 126°59′33.7″ E). A temperature gradient was established along the longitudinal axis of the greenhouse using a temperature-gradient system (TGG-Soldan; Soldan Inc., Seoul, Republic of Korea) [
30]. During the summer growing season, a shading screen (Solarscreen, Seoul, Republic of Korea; nominal shading rate of 52%) was installed to prevent excessive solar heat accumulation inside the greenhouse.
Seeds of romaine lettuce (
L. sativa var.
longifolia ‘Claudius RZ’) were purchased from Rijk Zwaan (De Lier, The Netherlands). Seeds were germinated in 276-cell sheets of Oasis
® Horticubes
® foam propagation medium (No. 5820; Oasis
® Grower Solutions, Smithers-Oasis Co., Kent, OH, USA) under greenhouse conditions. At 21 days after sowing, uniform seedlings with three to four true leaves were transplanted into a nutrient film technique (NFT) hydroponic system at a spacing of 20 × 20 cm. The nutrient solution was prepared according to the Yamazaki lettuce nutrient solution formulation [
31]. The electrical conductivity and pH of the nutrient solution were maintained at 1.2 dS·m
−1 and 5.8–6.2, respectively. Plants were cultivated during the spring, summer, and autumn growing seasons.
2.2. Growth and Environmental Measurements
Growth measurements were conducted twice weekly from transplanting to commercial harvest throughout all growing seasons. At each measurement date, six plants were destructively sampled at each sampling position. For each plant, the number of leaves was recorded. Leaves longer than 1 cm, measured from the base to the tip, were considered emerged and counted. Leaf length was measured as the maximum distance from the base to the tip, and leaf area was determined using a leaf area meter (LI-3100; LI-COR Inc., Lincoln, NE, USA).
Air temperature and solar radiation outside the TGG were measured using a temperature sensor (TC-K3.2-60L; i-Sensor, Seoul, Republic of Korea) and a pyranometer (LI-200R; LI-COR Inc., Lincoln, NE, USA), respectively. Solar radiation outside the greenhouse was recorded as a reference for external meteorological conditions. Inside the TGG, air temperature was measured using temperature sensors (TC-K3.2-60L; i-Sensor) installed at distances of 7, 19, and 31 m from the air inlet, designated as T1, T2, and T3, respectively. Each sensor was positioned 1.6 m above ground level. Photosynthetic photon flux density (PPFD) was measured using a quantum sensor (LI-190; LI-COR Inc., Lincoln, NE, USA) installed at the T2 position in an unobstructed area. Daily light integral (DLI) was also determined only at the T2 position and used as a common light input for the T1, T2, and T3 positions. Environmental data were recorded at 10 min intervals using a data logger (CR1000X; Campbell Scientific Inc., Logan, UT, USA) and processed into hourly and daily mean values. DLI was calculated by integrating 10 min mean PPFD values over each day and converting the resulting values to mol·m−2·d−1.
For the independent evaluation dataset, air temperature inside the commercial greenhouse was monitored using an aspirated temperature and humidity sensor (Aspirator unit Pt500; Hoogendoorn Growth Management, Vlaardingen, The Netherlands). Photosynthetic photon flux density (PPFD) was recorded at 10 min intervals using a quantum sensor (LI-190; LI-COR Inc.) connected to a portable data logger (LI-1500; LI-COR Inc., Lincoln, NE, USA). Air temperature data were aggregated into hourly mean values, and DLI was calculated by integrating 10 min mean PPFD values over each day for use as model inputs.
2.3. Data Collection and Processing
Datasets for model calibration were collected from experiments conducted in the TGG. In total, 95, 127, and 215 datasets were collected during the spring, summer, and autumn growing seasons, respectively.
Independent datasets for model evaluation were obtained from experiments conducted in a commercial greenhouse at the Smart Farm Innovation Valley, Gimje, Republic of Korea. The same romaine lettuce cultivar used in the TGG experiments was cultivated in a deep flow technique (DFT) hydroponic system during the spring and summer growing seasons and in a perlite-based substrate system during the autumn growing season. Growth measurements were conducted following the same procedures used in the TGG experiments, whereas environmental measurements for the evaluation dataset were conducted as described in
Section 2.2. In total, 36, 30, and 66 datasets were collected during the spring, summer, and autumn growing seasons, respectively.
The cultivation periods, cultivation systems, mean air temperatures, and DLI values for the model calibration and evaluation datasets are summarized in
Table 1.
2.4. Model Structure
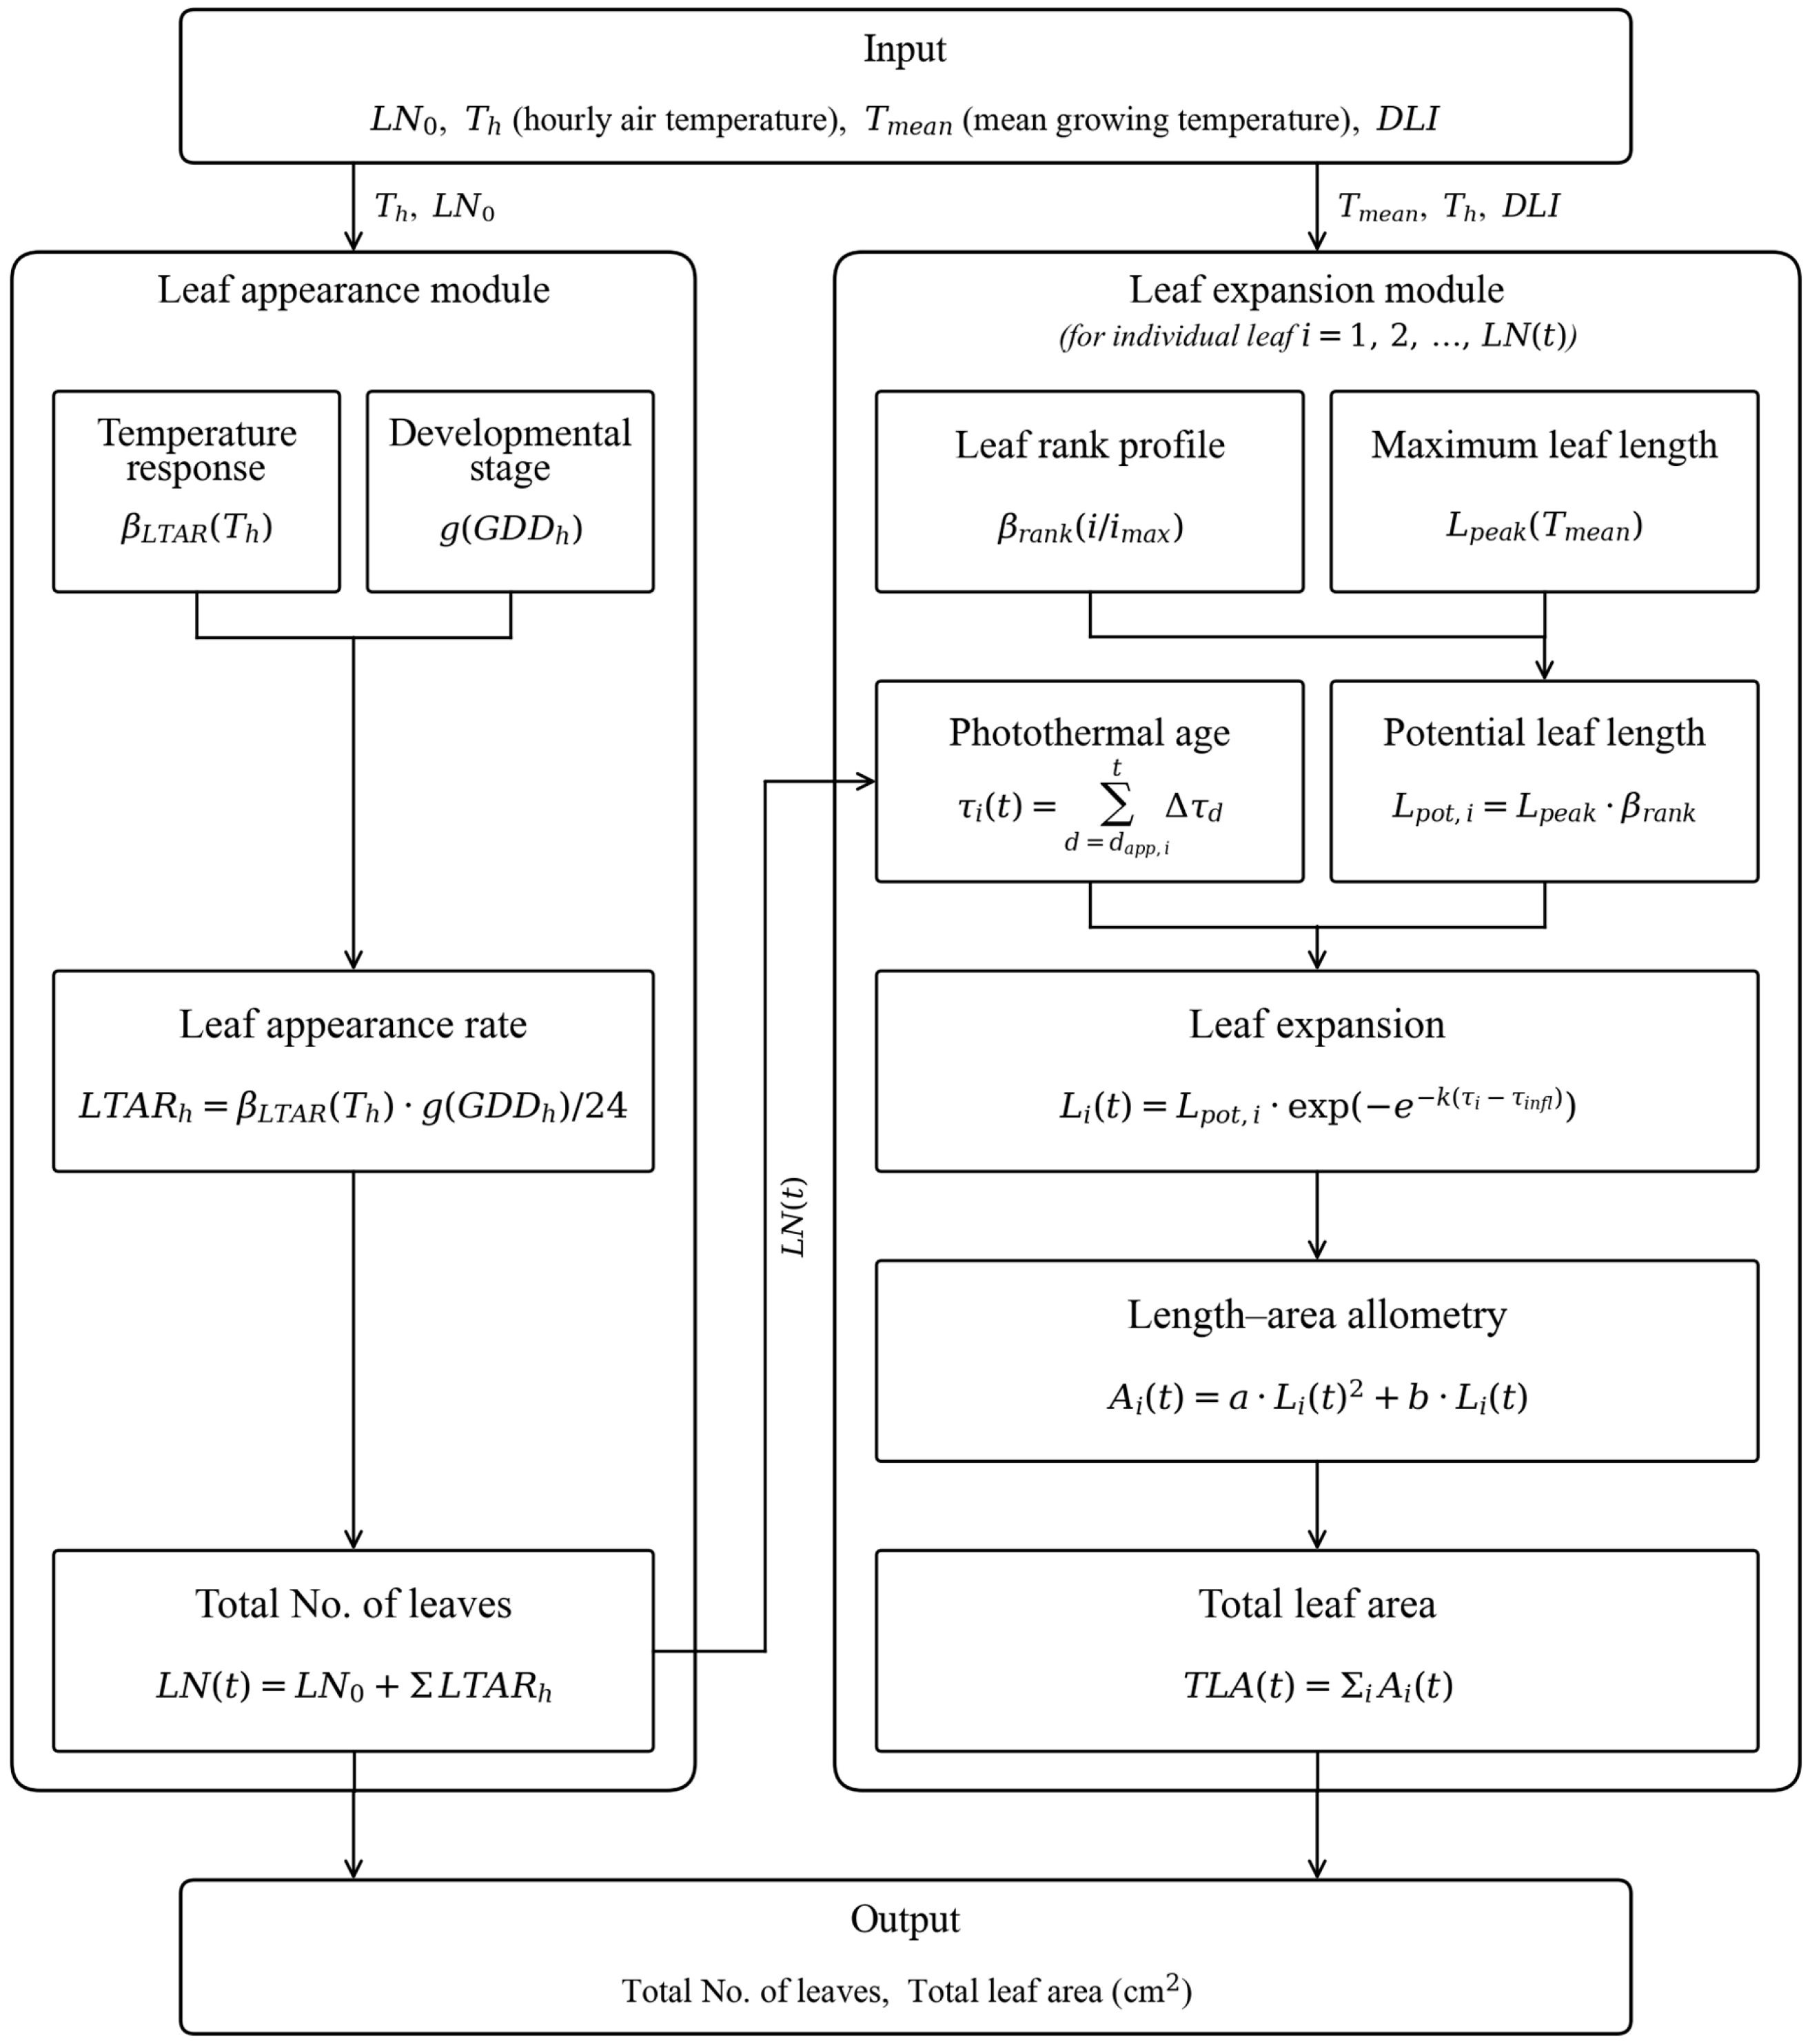
The model was developed to simultaneously predict the number of leaves and TLA in romaine lettuce by simulating the appearance and expansion of individual leaves (
Figure 1). The input variables included the initial number of leaves (LN
0), hourly air temperature (
Th), and DLI, from which mean growing temperature (
Tmean) and GDD were derived. The model consisted of two modules: a leaf appearance module and a leaf expansion module. The leaf appearance module predicted the timing of leaf emergence and the number of leaves by calculating the hourly leaf tip appearance rate (LTAR). The leaf expansion module estimated the area of each emerged leaf based on potential maximum leaf length, photothermal age, leaf expansion dynamics, and the leaf length–area relationship. TLA was calculated as the sum of the areas of all individual leaves.
2.5. Leaf Appearance Module
The leaf appearance module predicts the number of leaves by accumulating the hourly leaf tip appearance rate (LTARh). This module consists of a temperature response function, a developmental stage weighting function, and an hourly accumulation procedure.
The temperature response of LTAR was described using the beta function proposed by Yan and Hunt [
16],
βLTAR(
T) (Equation (1)).
In Equation (1), T represents the temperature input variable, whereas Topt and Tmax represent the optimum and maximum temperatures for LTAR, respectively. The function βLTAR(T) describes the nonlinear temperature response of leaf appearance. For hourly model calculations, T was replaced by the hourly air temperature, Th.
The developmental stage effect on LTAR was represented by a sigmoid function,
g(GDD
h) (Equation (2)). This function was included because the leaf appearance rate may vary with developmental stage or leaf appearance sequence [
32].
In Equation (2), GDD
h represents cumulative growing degree days up to hour h. GDD was calculated using a base temperature of 4 °C [
33]. The parameter
gmax represents the maximum developmental stage weighting factor (leaves·d
−1),
ksig is the slope coefficient of the sigmoid function ((°C·d)
−1), and GDD
m is the cumulative GDD at the inflection point (°C·d).
The hourly leaf appearance increment, LTAR
h, was calculated by multiplying
βLTAR(
Th), derived from hourly air temperature, by
g(GDD
h), and then dividing the product by 24 (Equation (3)).
In Equation (3), LTARh represents the hourly increment in leaf appearance. The division by 24 was applied to convert the daily rate to an hourly time step because the model was implemented using hourly air temperature data.
The number of leaves at time
t,
LN(
t), was predicted by cumulatively summing LTAR
h from the initial number of leaves at transplanting, LN
0 (Equation (4)).
In Equation (4), h represents the hourly time index, and H(t) denotes the total number of hourly calculation steps from transplanting to time t. Because hourly environmental data were used in this study, H(t) was calculated as 24t when t was expressed as days after transplanting. Thus, H(t) was retained to explicitly indicate that leaf appearance was accumulated at an hourly time step.
Here, Topt refers to the optimum temperature for the LTAR response after accounting for the developmental stage effect and does not represent the optimum temperature for overall romaine lettuce growth.
2.6. Leaf Expansion Module
The leaf expansion module estimates TLA per plant by sequentially simulating leaf appearance timing, temperature-dependent maximum leaf length, leaf rank-dependent potential maximum leaf length, photothermal age, individual leaf expansion, the leaf length–area allometric relationship, and the summation of individual leaf areas. The appearance timing and rank of each leaf were derived from LN(t), predicted by the leaf appearance module.
The maximum leaf length as a function of mean growing temperature,
Lpeak(
Tmean), was described using an empirical temperature response equation (Equation (5)).
In Equation (5), Lmax represents the maximum attainable leaf length in the Lpeak(Tmean) function, Tb is the base temperature, and Topt is the optimum temperature for Lpeak(Tmean). The intermediate variable r was defined as the normalized temperature term, (Tmean − Tb)/(Topt − Tb), and was not treated as an independently estimated parameter. Thus, Lpeak(Tmean) represents the temperature-dependent maximum leaf length before adjustment by leaf rank.
The relative distribution of potential maximum leaf length was described as a function of normalized leaf rank,
ri, using a beta-type leaf rank profile function,
βrank(
ri) (Equation (6)).
In Equation (6), i denotes leaf rank, imax represents the maximum leaf rank used for normalization, and ri is the normalized leaf rank calculated as i/imax. In this study, imax was set to the maximum number of leaves predicted by the leaf appearance module for each combination of growing season and sampling position. The parameters ropt and rmax represent the optimum normalized leaf rank at which relative leaf length is maximal and the upper normalized rank boundary at which βrank approaches zero, respectively. Thus, ri, ropt, and rmax correspond to T, Topt, and Tmax in Equation (1), respectively, but represent normalized leaf rank rather than temperature. The potential maximum leaf length of the ith leaf, Lpot,i, was then calculated by multiplying Lpeak(Tmean) by βrank(ri).
The progression of individual leaf expansion was represented by photothermal age,
τi(
t), which accumulated the combined effects of the hourly temperature response for leaf expansion and daily light availability after the appearance of each leaf (Equation (7)).
In Equation (7), dapp,i denotes the appearance date of the ith leaf, Td,h is the hourly air temperature at hour h on day d, DLId is the daily light integral on day d, and Km is the half-saturation constant for the DLI response. The function βexp(Td,h) has the same beta-function form as Equation (1) but was parameterized separately for leaf expansion. For t < dapp,i, τi(t) was set to zero; therefore, the summation in Equation (7) was performed only when t ≥ dapp,i. For example, if the ith leaf is predicted to appear on day 4, τi(t) is zero for t < 4, and no summation is performed before leaf appearance. For t ≥ 4, τi(t) accumulates the photothermal increments from day 4 to the target time t, and this value is used to simulate post-appearance leaf expansion with the Gompertz function.
The actual leaf length of the
ith leaf,
Li(
t), was calculated by multiplying the potential maximum leaf length,
Lpot,i, by a Gompertz expansion function (Equation (8)).
In Equation (8), k is the growth rate coefficient of the Gompertz function, and τinfl is the photothermal age at the inflection point. This function describes the post-appearance expansion trajectory of each leaf as a function of photothermal age.
Individual leaf area,
Ai(
t), was estimated from simulated leaf length using a quadratic allometric equation (Equation (9)).
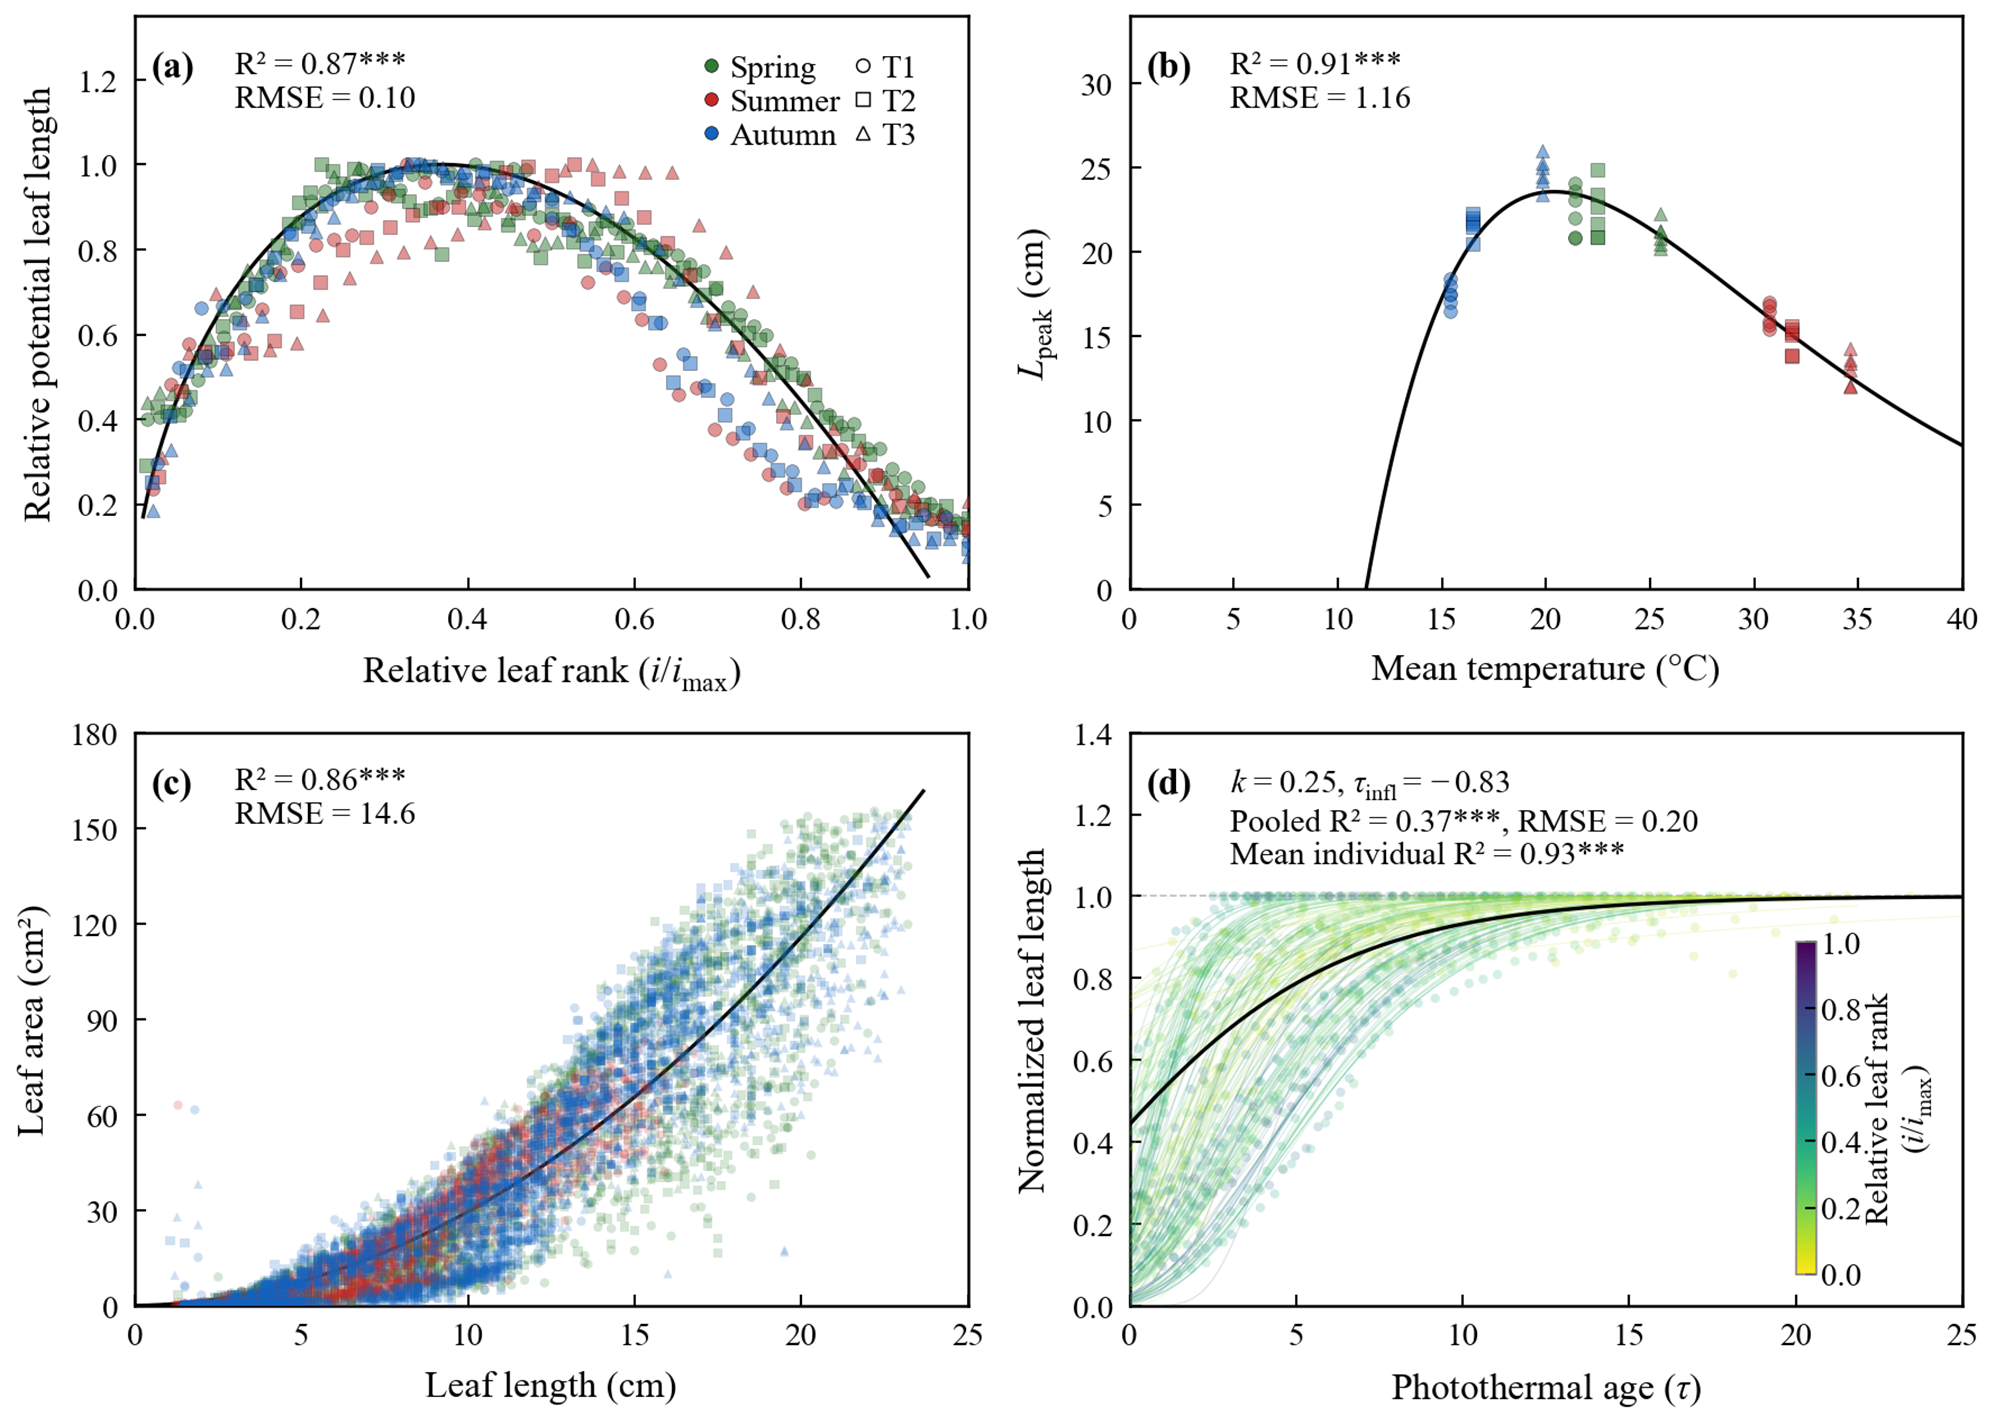
In Equation (9), a and b are regression coefficients describing the relationship between leaf length and leaf area. A quadratic equation was selected because it adequately described the observed length–area relationship (R2 = 0.86, RMSE = 14.6 cm2) while maintaining a parsimonious model structure. Higher-order polynomial terms were not included because they would introduce additional empirical parameters without direct biological interpretation for leaf area prediction.
Finally, TLA at time
t, TLA(
t), was calculated as the sum of the areas of all emerged leaves (Equation (10)).
In Equation (10), n(t) represents the number of emerged leaves at time t, as determined by the leaf appearance module. Thus, TLA(t) was calculated by summing individual leaf areas from leaf rank 1 to n(t), linking the leaf appearance and leaf expansion modules through leaf rank and leaf appearance timing.
2.7. Parameter Estimation
Model parameters were estimated separately for the leaf appearance and leaf expansion modules. The output of the leaf appearance module was used to provide leaf appearance timing and leaf rank information for the leaf expansion module; however, parameter estimation was conducted stepwise because the two modules described different components of leaf development and were calibrated using different response variables. This stepwise parameterization was adopted to preserve the biological interpretation of each submodel and to limit parameter compensation among submodules during calibration. In the leaf appearance module, the parameters of βLTAR(T) and g(GDDh) were estimated sequentially. In the first step, preliminary estimates of g(GDDh) were obtained by fitting the sigmoid function to the observed relationship between LTAR and cumulative GDD. The Topt and Tmax parameters of βLTAR(T) were then estimated by fitting the beta function to LTAR values normalized using these preliminary g(GDDh) estimates through nonlinear least-squares regression. In the second step, the parameters of g(GDDh) were re-estimated by fitting the sigmoid function to LTAR values normalized by the fitted βLTAR(T) using nonlinear least-squares regression.
The parameters of the leaf expansion module were estimated using the same calibration datasets (
Table 2). The parameters of the maximum leaf length function,
Lpeak(
Tmean) (Equation (5)), the leaf rank profile function,
βrank (Equation (6)), and the temperature response function for leaf expansion,
βexp(
T) (Equation (7)), were estimated using nonlinear least-squares regression. The parameters of the Gompertz function (Equation (8)) were derived as common parameters by pooling the fitting results across individual leaf ranks. To reduce parameter dimensionality, the half-saturation constant (
Km) in the DLI response term of Equation (7) was fixed at 5.0 mol·m
−2·d
−1 based on the observed saturating response of leaf expansion to DLI. This value was used as an empirical scaling coefficient for the DLI response, rather than as an independently optimized parameter.
Nonlinear regression analyses were performed using the SciPy library in Python 3.11, and the coefficients in Equation (9) were estimated using the least-squares method. The goodness of fit of the component functions was evaluated using the coefficient of determination (R2) and root mean square error (RMSE). The significance levels shown with R2 in the component-function figures indicate the statistical significance of the fitted relationships rather than that of R2 itself and are denoted as ns, *, **, and *** for not significant and significant at p < 0.05, p < 0.01, and p < 0.001, respectively.
2.8. Model Evaluation
Model performance was evaluated using model efficiency (EF) and RMSE (Equations (11) and (12)), which are commonly used metrics in process-based leaf development modeling [
20].
In these equations, yi is the observed value, ŷi is the predicted value, ȳ is the mean of the observed values, and n is the number of observations.
4. Discussion
The present results indicate that leaf appearance and individual leaf expansion in romaine lettuce exhibited distinct temperature responses. The optimum temperature of
βLTAR(
T) was estimated at 26.7 °C, approximately 6 °C higher than that of
Lpeak(
Tmean) (20.4 °C;
Table 2). This difference suggests that increases in the number of leaves and potential leaf length were not governed by a common temperature response.
Similar process-level separation has been adopted in crop models for maize [
19] and garlic [
20], in which leaf initiation, appearance, expansion, maturation, and senescence were represented as interconnected yet distinct processes. Process-specific temperature responses have also been reported in wheat [
25] and barley [
26], where optimum or cardinal temperatures differed among leaf emergence, leaf expansion, and culm elongation.
Therefore, separating leaf appearance from individual leaf expansion may be more appropriate for simultaneously predicting the number of leaves and TLA in romaine lettuce than applying a single temperature response function to both processes. In the present model, these two modules were not treated as fully independent processes; rather, they were separated to represent process-specific temperature responses and then sequentially linked through leaf appearance timing and leaf rank. The leaf appearance module determines leaf appearance timing and leaf rank, and this information is transferred to the leaf expansion module to estimate the potential size and expansion trajectory of individual leaves. Because TLA is determined by both the number of leaves and the size and expansion trajectory of individual leaves, the proposed model structure (
Figure 1) can capture situations in which leaf appearance is maintained while individual leaf expansion is constrained, resulting in limited TLA development.
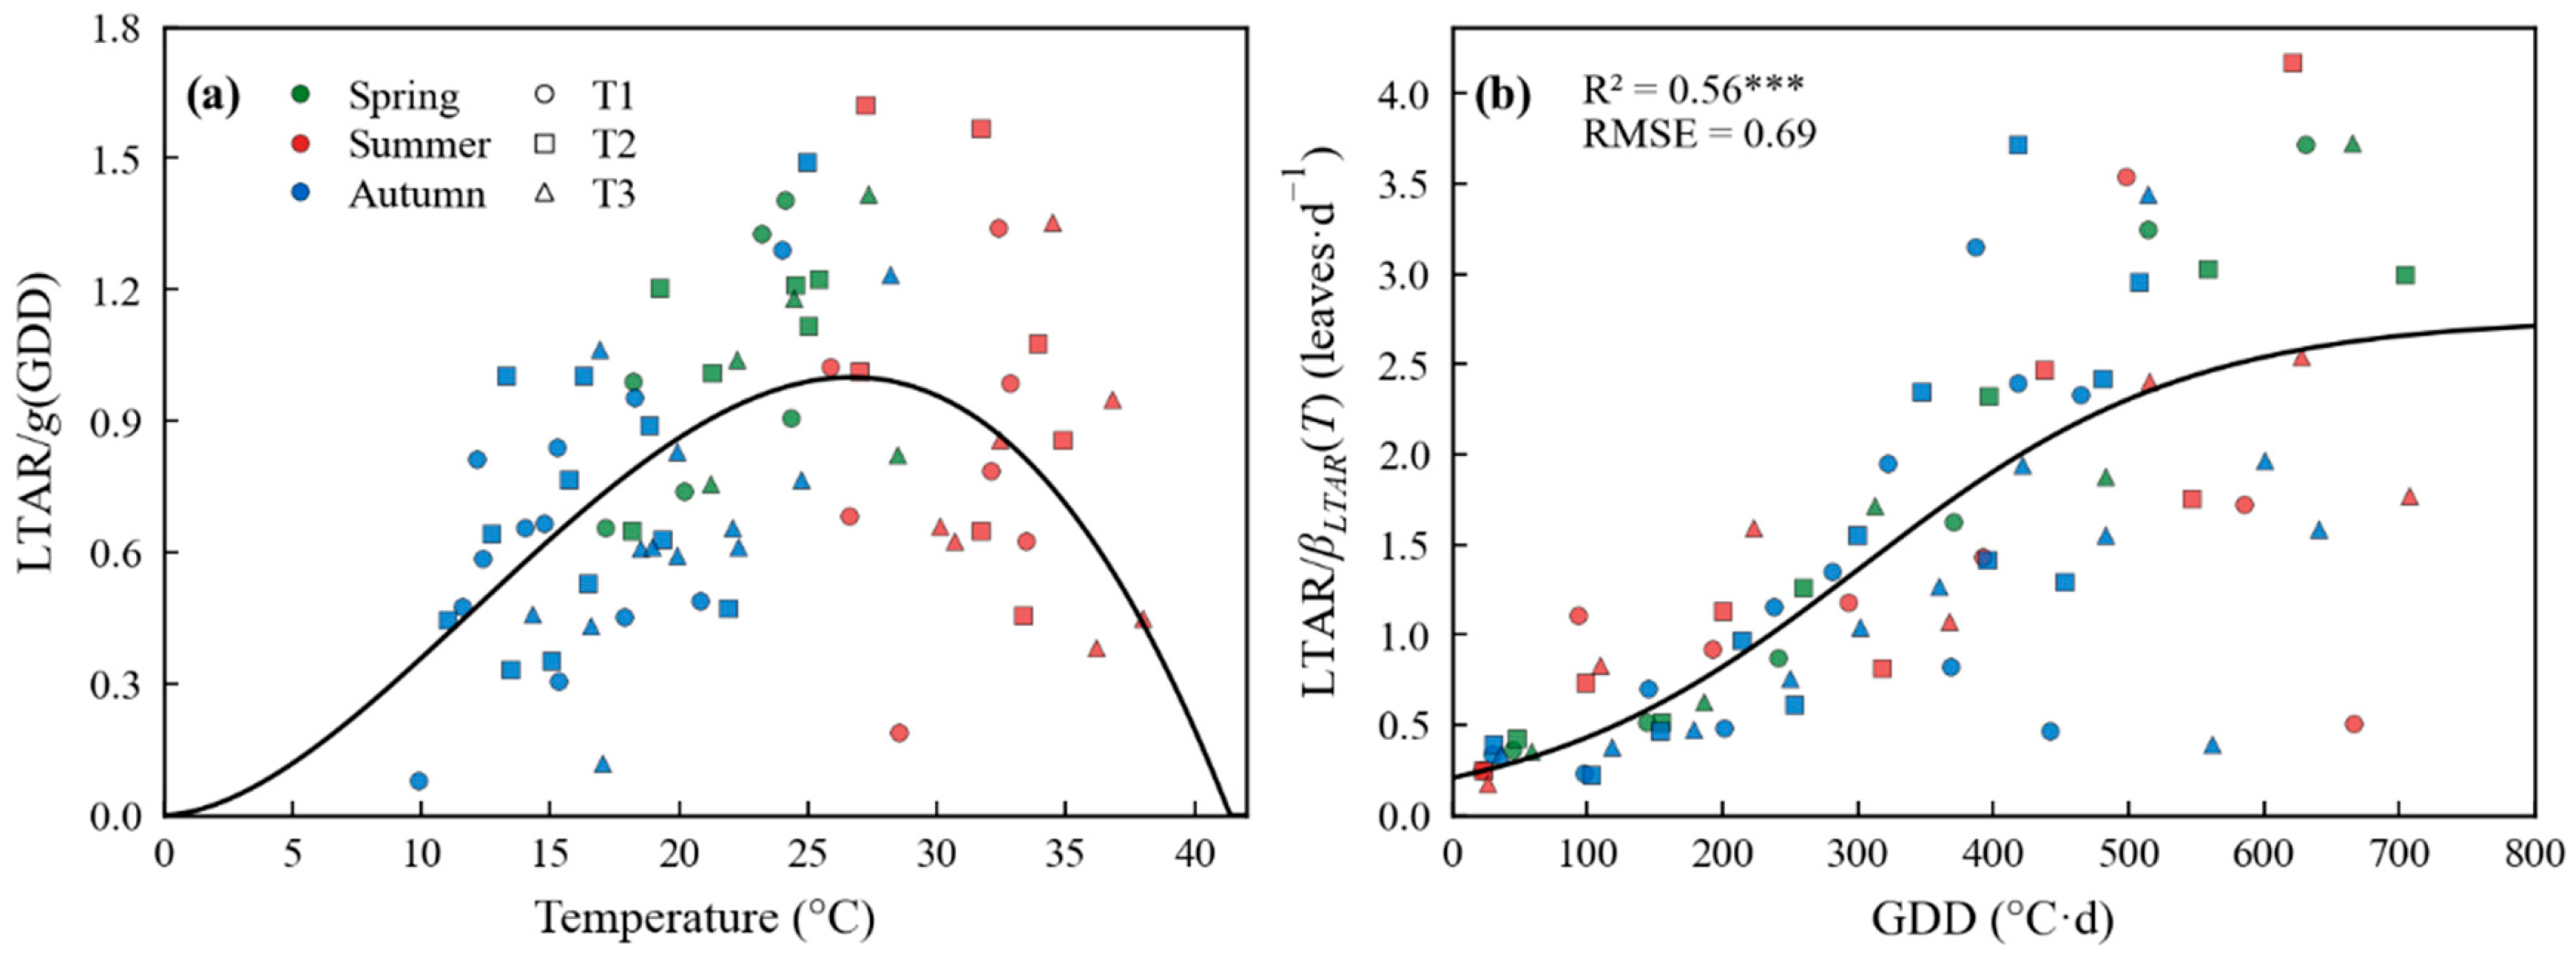
The developmental stage function,
g(GDD
h), was used as an empirical weighting function to represent changes in leaf appearance rate with accumulated thermal development and leaf appearance sequence. This function showed an R
2 of 0.56, indicating substantial variability around the fitted sigmoid curve (
Figure 2b). Such variability likely reflects inherent plant-to-plant differences in leaf appearance timing rather than structural model error. Similarly, Streck et al. [
32] reported substantial scatter in chronology-based leaf appearance rate data in wheat and attributed it to natural variability in daily leaf appearance. Nevertheless, the strong performance of the overall leaf appearance model (EF = 0.92;
Table 3) suggests that this empirical weighting function was sufficient to capture the cumulative pattern of leaf appearance despite variability in instantaneous leaf appearance rate.
The leaf rank profile of potential maximum leaf length showed that
ropt was 0.37, indicating that potential leaf length reached its maximum at approximately 37% of the normalized leaf rank position (
Figure 3a,
Table 2). When the Gompertz function was fitted separately to individual leaves, the mean R
2 was 0.93, whereas fitting a single expansion function across all leaf ranks resulted in a substantially lower R
2 of 0.37 (
Figure 3d,
Table 2). These results suggest that individual leaf expansion follows a Gompertz-type trajectory, whereas potential leaf length and expansion dynamics vary according to leaf rank and appearance timing. Therefore, the model represented leaf rank-specific potential leaf length and leaf appearance timing explicitly while simplifying post-appearance expansion as a common function of photothermal age. In this framework, photothermal age was used as an integrative variable to describe the progression of leaf expansion after leaf appearance by combining temperature-dependent expansion capacity with daily light availability.
This modeling strategy avoided assigning independent expansion parameters to individual leaves. Wallach et al. [
34] reported that an excessive number of adjustable parameters in crop models may lead to numerical instability and reduced predictive performance. Similarly, Fleisher and Timlin [
35] estimated leaf expansion parameters in potato by pooling leaves within specific node ranges and proposed a modeling structure linked to leaf appearance and canopy development models.
In lettuce, Tei et al. [
9,
10] quantified dry matter accumulation, light interception, and radiation use efficiency at the plant and canopy levels, providing a basis for growth analysis and growth modeling. Other mechanistic lettuce growth models have mainly focused on biomass accumulation, head weight, crop maturity, or LAI at the plant or canopy level. For example, van Henten [
21] simulated structural and non-structural dry weight using greenhouse climate inputs, whereas Pearson et al. [
11] described lettuce growth and maturity using structural and storage carbon pools. More recently, Sun et al. [
22] developed a greenhouse lettuce growth model in which crop dry weight was the main state variable and LAI was derived from dry matter accumulation and SLA-related relationships. These models provide important frameworks for greenhouse climate control and biomass prediction; however, leaf area or LAI is generally treated as a plant- or canopy-level variable associated with biomass accumulation.
In contrast, the present model explicitly separates leaf appearance from individual leaf expansion. The number of leaves is first predicted through the leaf appearance module, and the area of each emerged leaf is then estimated through the leaf expansion module based on leaf rank, potential leaf length, photothermal age, and the leaf length–area relationship. Thus, TLA is simulated as the cumulative outcome of individual leaf development rather than as a biomass-derived variable. This structure allows the model to distinguish whether variation in TLA is associated with leaf appearance, leaf rank-specific potential leaf size, or post-appearance expansion. Therefore, the present model should be regarded as a structural leaf development module that complements biomass-oriented lettuce growth models and can provide dynamic canopy information for subsequent canopy photosynthesis and dry matter production models.
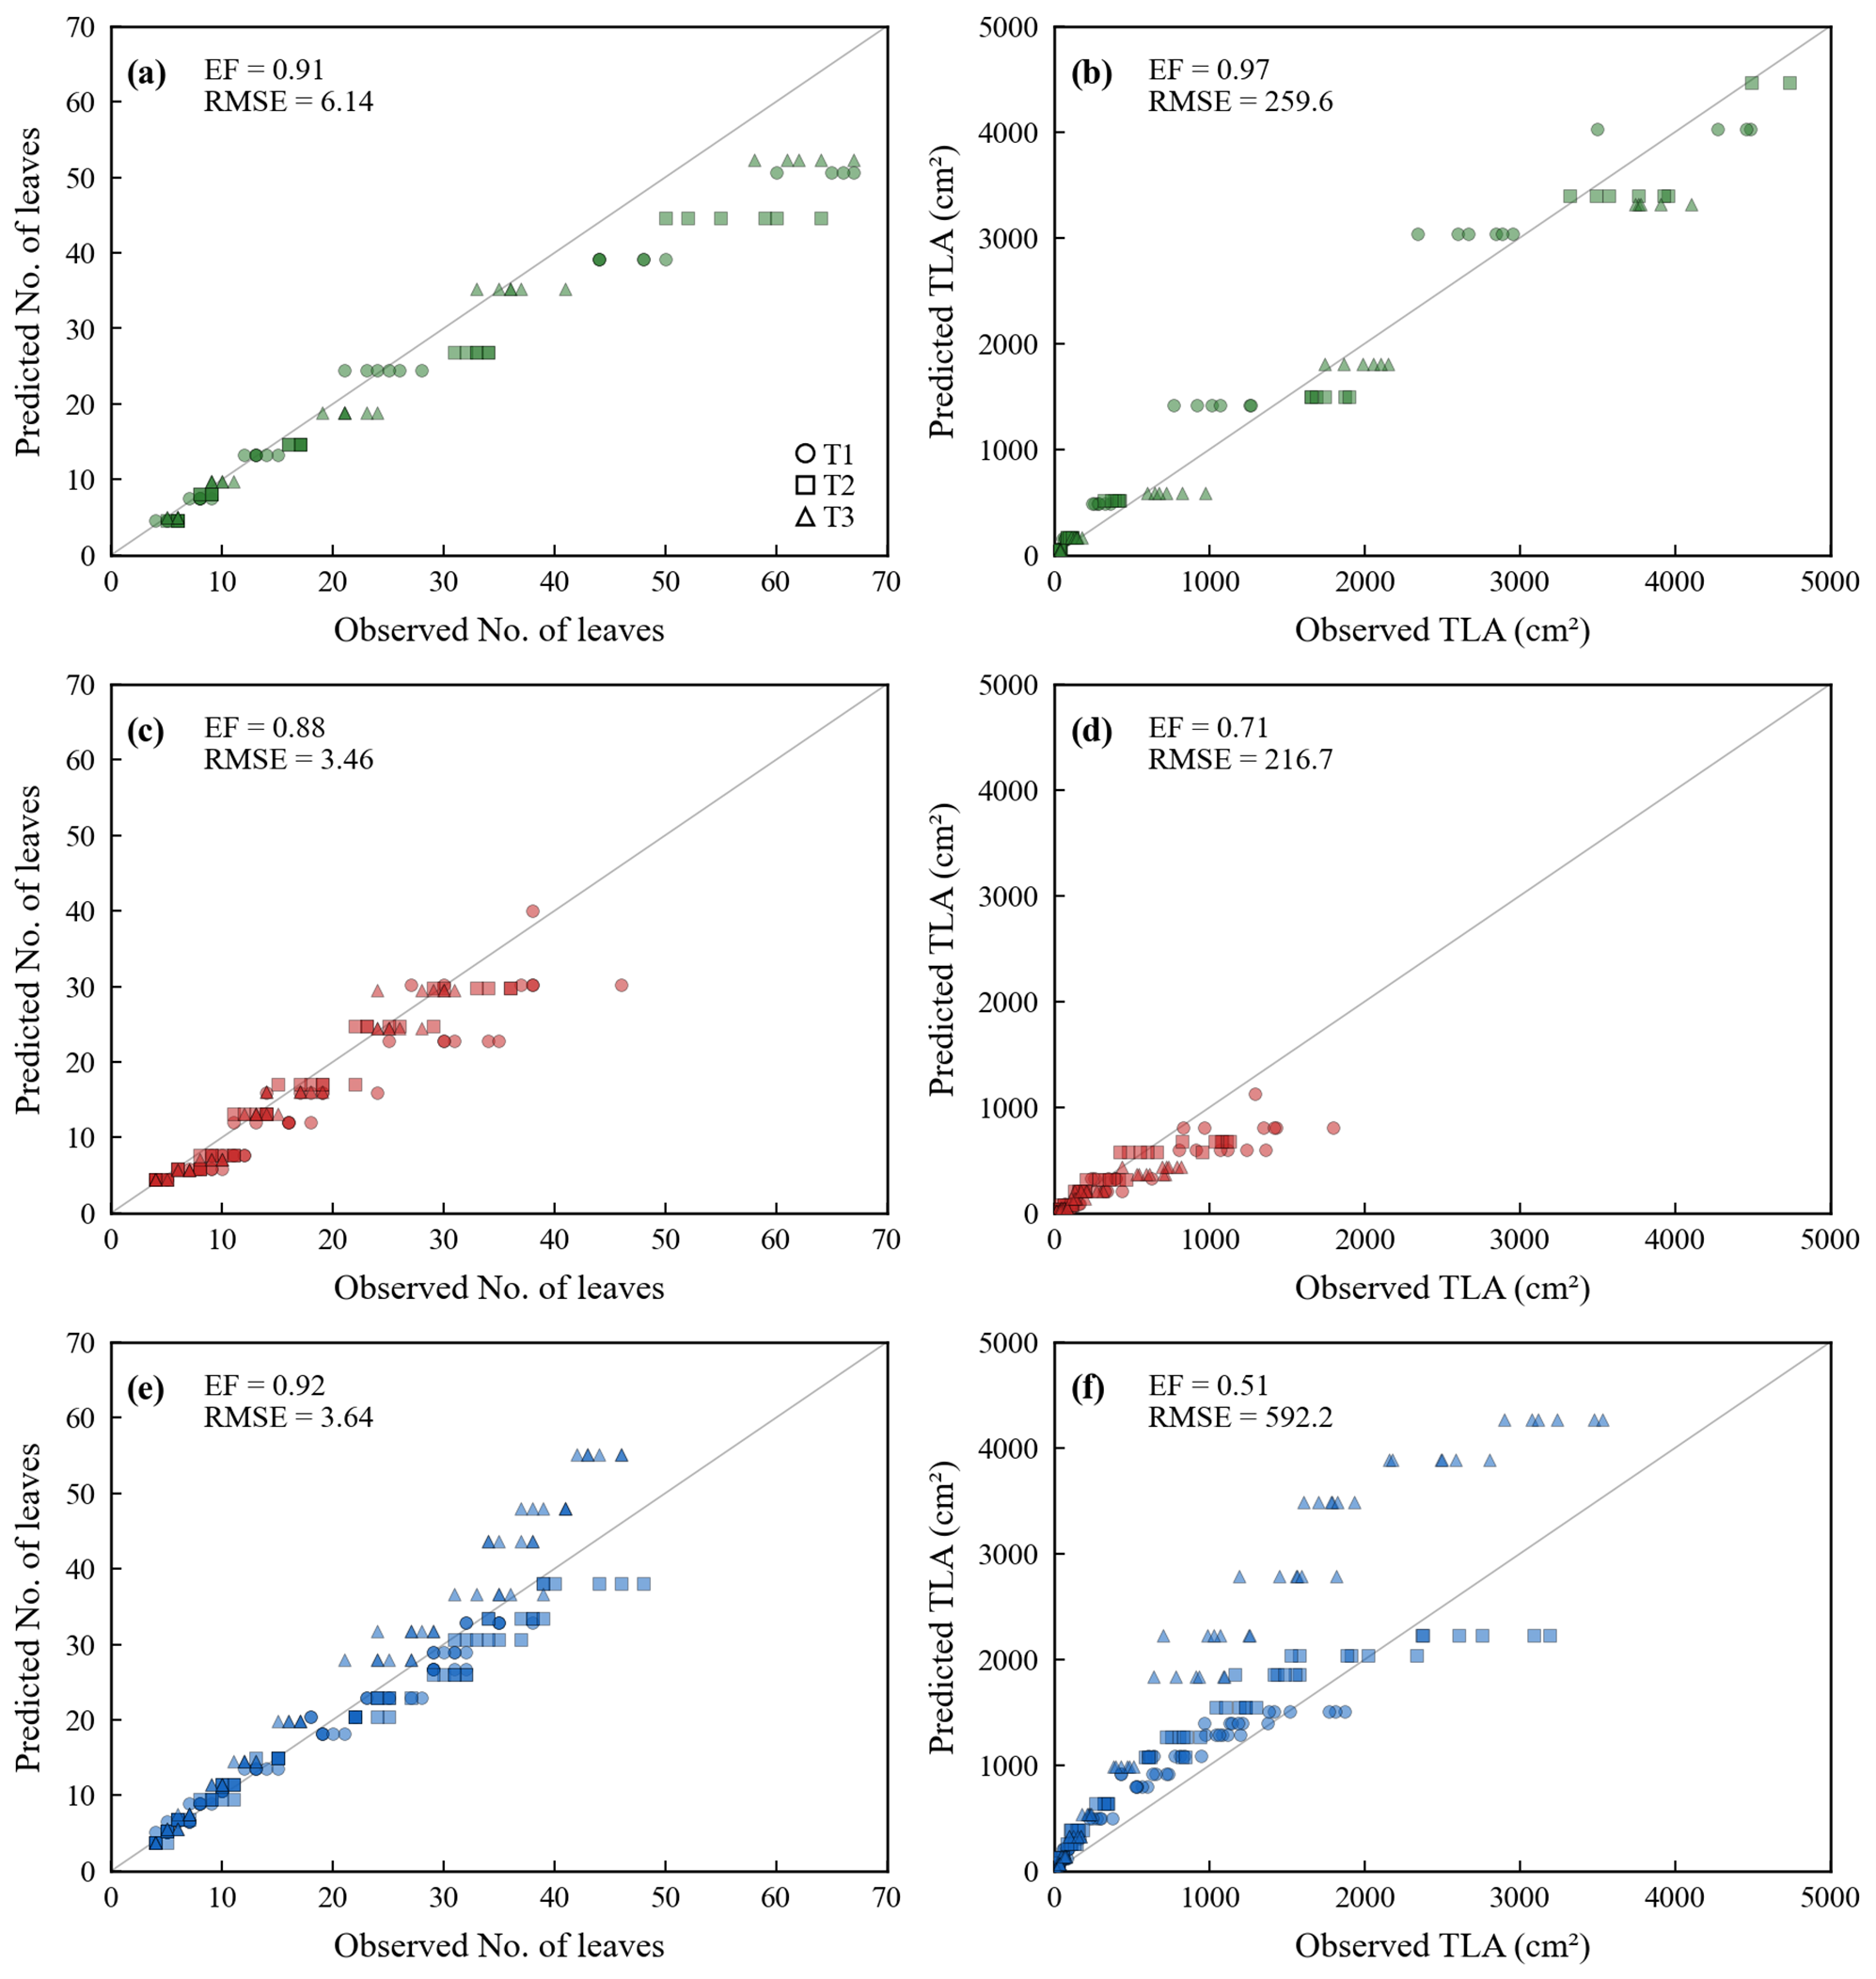
In spring, similar calibration performance was observed across all sampling positions in both the leaf appearance and leaf expansion modules (
Table 3). In summer and autumn, however, calibration performance was lower in the leaf expansion module than in the leaf appearance module (
Table 3), indicating that TLA prediction errors were more closely associated with the leaf expansion process than with prediction of the number of leaves. In summer, mean air temperature ranged from 30.7 to 34.6 °C (
Table 1), exceeding the optimum temperature of
Lpeak (20.4 °C;
Table 2). This finding suggests that potential leaf length or post-appearance expansion may have been constrained under high-temperature conditions.
In contrast, overprediction at the T3 sampling position in autumn occurred under a mean temperature close to the optimum of
Lpeak (
Table 1 and
Table 2) but with substantially lower DLI than at the T1 sampling position in spring (
Table 1), where TLA prediction accuracy was high. This result indicates that environmental factors beyond mean growing temperature, particularly light availability or its interaction with temperature, may have contributed to the reduced prediction accuracy at this position.
In addition to temperature, light has also been recognized as an important factor in modeling lettuce leaf development. Xu et al. [
29] reported that temperature and PAR do not always vary synchronously in greenhouses and that a photothermal approach improved predictions of the number of leaves, individual leaf length, and LAI. Hang et al. [
3] also developed a lettuce leaf area model based on thermal effectiveness and PAR. Furthermore, Zhou et al. [
36] demonstrated that lettuce leaf area and biomass varied depending on combinations of light intensity and temperature, whereas Carotti et al. [
37] reported that both light intensity and air temperature influenced leaf expansion-related traits, including SLA and leaf water content.
Unlike approaches that primarily relate leaf area or LAI to combined thermal and radiation variables, the present model separates potential leaf length from post-appearance expansion. In the proposed framework, DLI influenced post-appearance expansion through photothermal age (τi), whereas Lpeak and Lpot,i were determined by mean growing temperature and leaf rank.
Among the model calibration conditions, the lowest TLA prediction accuracy was observed at the T3 sampling position in autumn (EF = 0.16; RMSE = 941.7 cm
2) (
Table 3), with consistent overprediction throughout the growing period. The contrast between the two modules provides further insight into the source of this error. At this position, the leaf appearance module maintained moderate prediction performance (EF = 0.86), whereas the leaf expansion module showed the lowest performance among all calibration conditions (EF = 0.16;
Table 3). Because TLA was calculated as the cumulative sum of individual leaf areas, this contrast suggests that the reduced TLA performance was not primarily caused by errors in predicting the number of leaves but was more closely associated with error propagation in individual leaf expansion and leaf-area accumulation.
The observed mean maximum leaf length at the T3 sampling position in autumn was 24.7 cm, which was comparable to the model-estimated maximum leaf length parameter of 23.6 cm (
Table 2). In addition, the potential maximum leaf length calculated under the corresponding mean temperature condition was 23.5 cm. These results suggest that the potential leaf length function did not substantially overestimate the achievable maximum leaf size under this condition. Therefore, the persistent overprediction of TLA likely reflected systematic bias in post-appearance expansion dynamics or a small bias in leaf appearance timing amplified through the cumulative leaf-area summation structure, rather than a simple overestimation of potential leaf length or errors in predicting the number of leaves. This interpretation also supports the need to evaluate whether light availability, or its interaction with temperature, should be incorporated more explicitly into the estimation of potential leaf size or post-appearance expansion dynamics, as previous studies have shown that thermal and light conditions jointly influence lettuce leaf area development and leaf expansion-related traits [
3,
29,
36,
37].
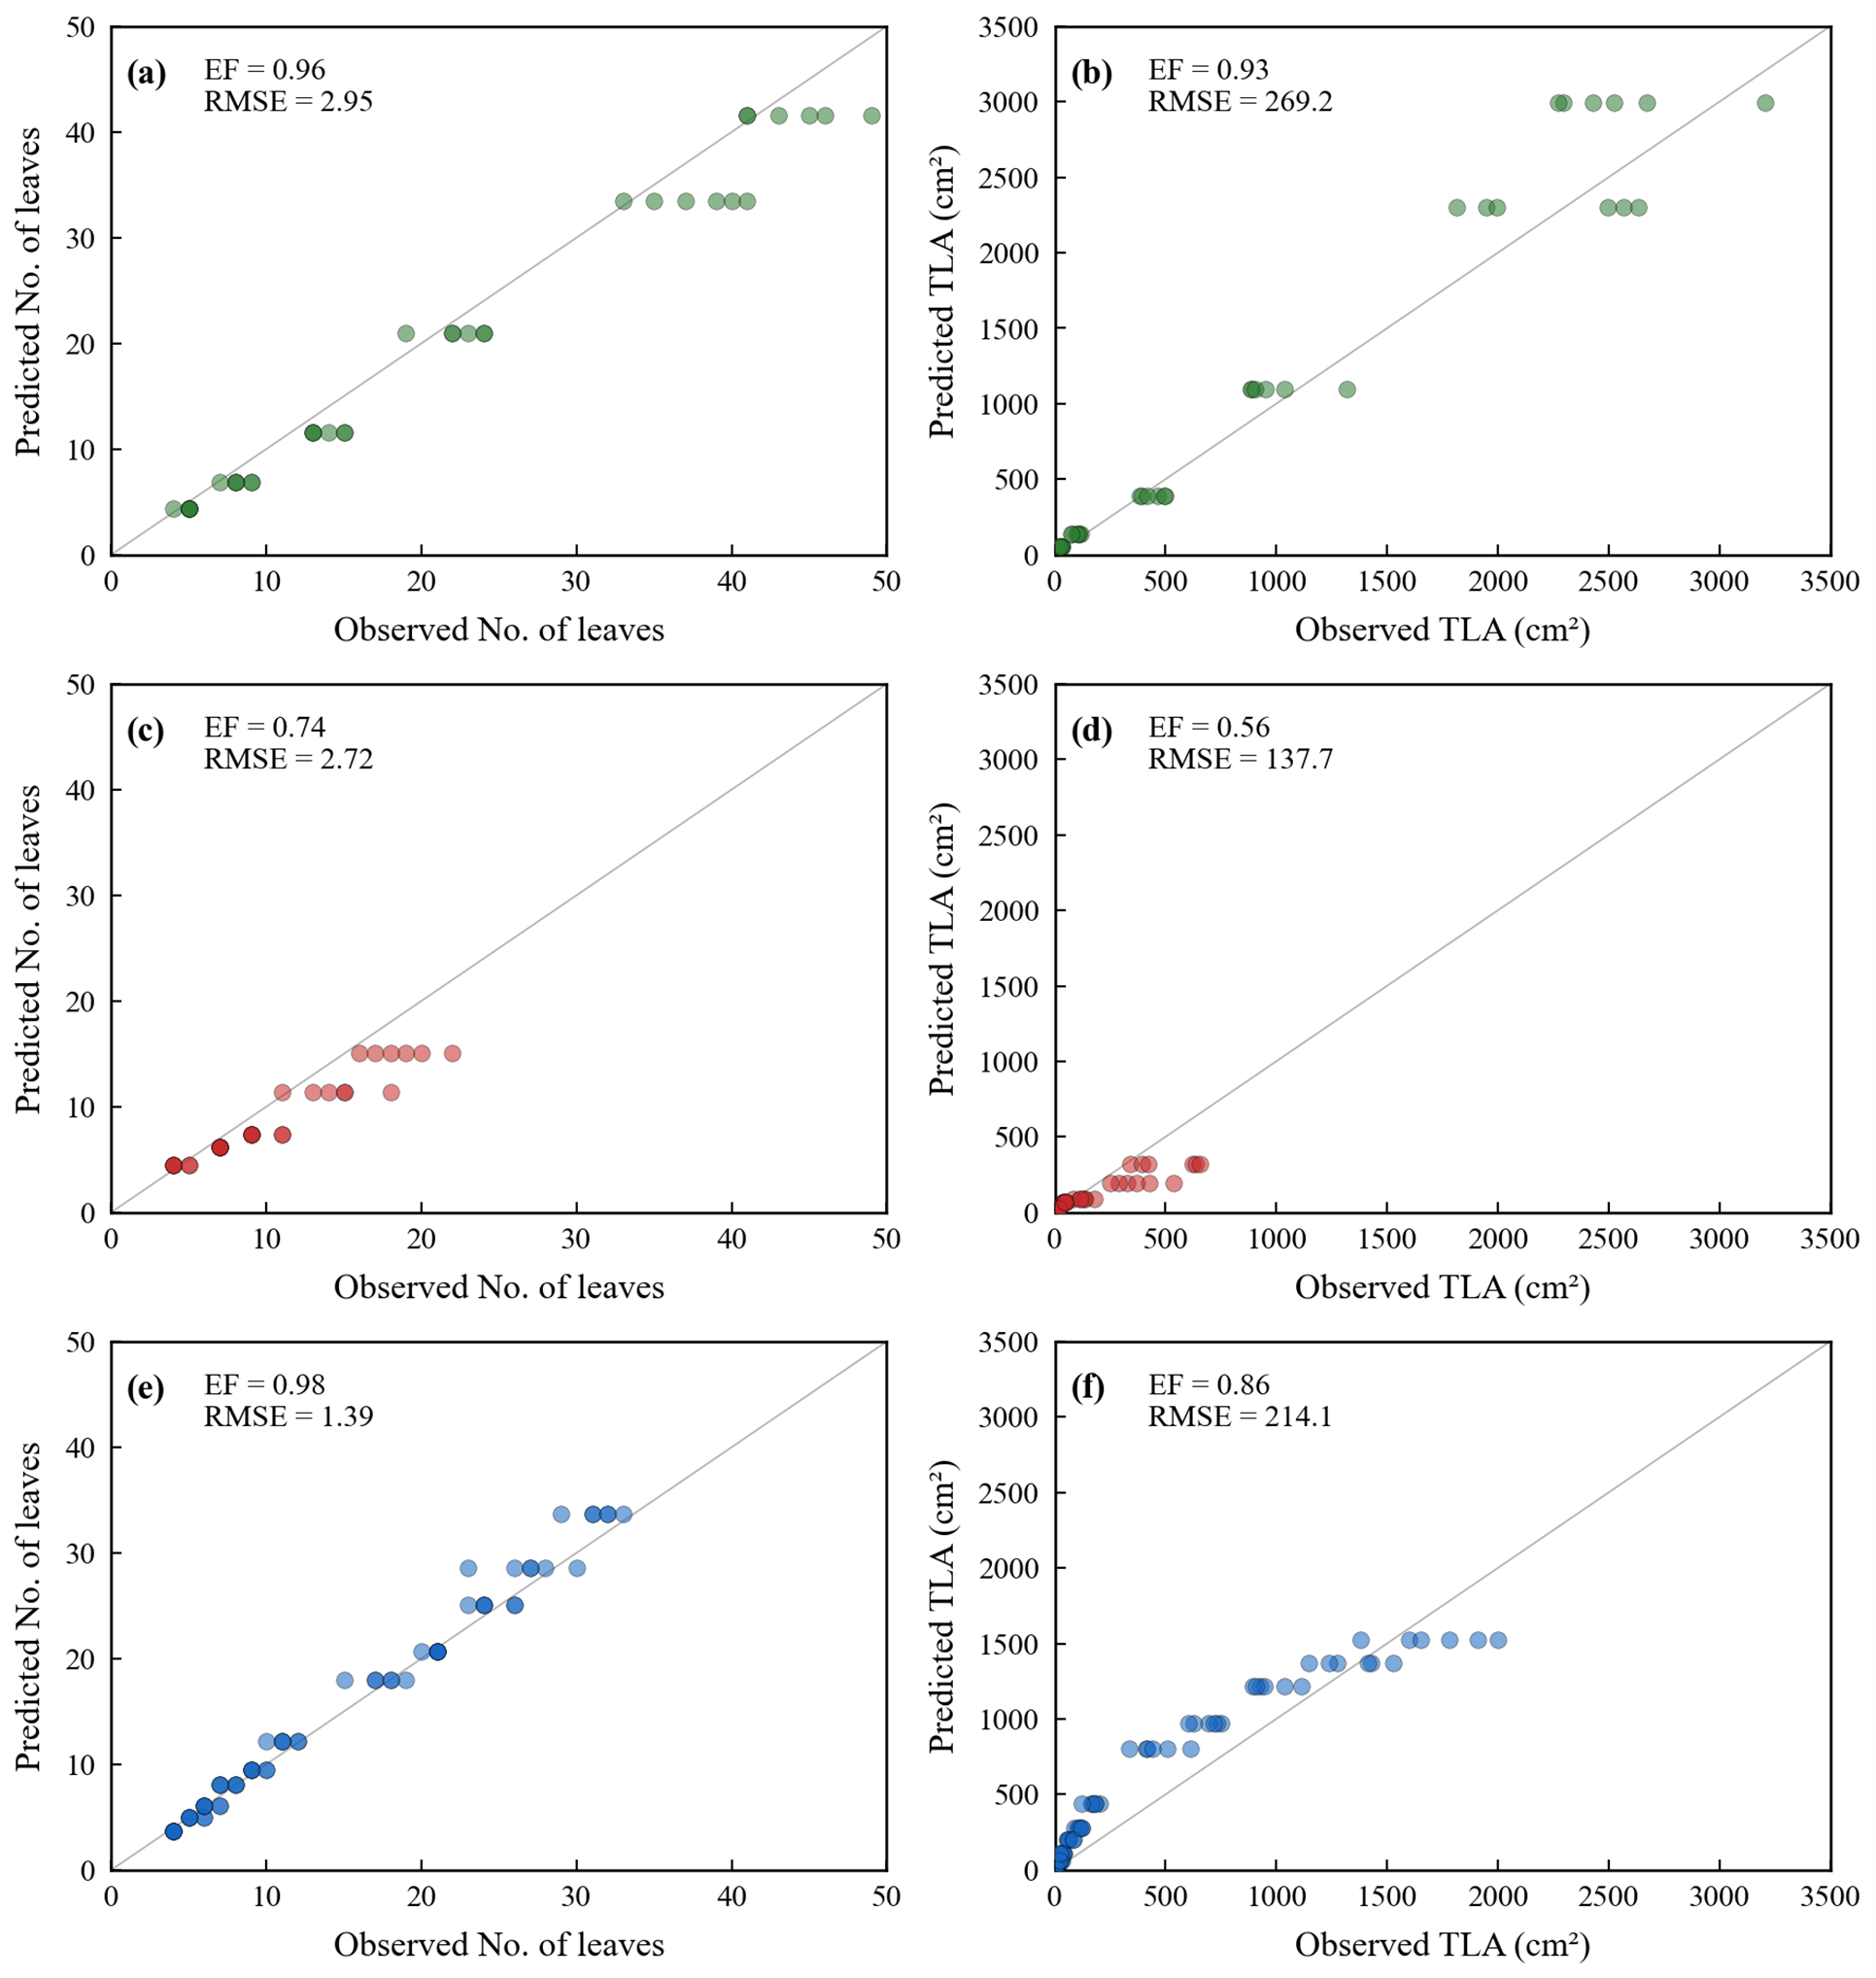
Independent evaluation of the model showed high prediction performance, with an EF of 0.96 and an RMSE of 2.24 leaves for leaf appearance and an EF of 0.92 and an RMSE of 216.8 cm
2 for leaf expansion (
Figure 5,
Table 4). These results indicate that the model reproduced leaf appearance and TLA in the independent evaluation dataset, although performance differed among growing seasons. The high overall evaluation metrics should be viewed in relation to the composition and environmental range of the evaluation dataset, rather than as a direct indication of better performance than calibration. Although the independent dataset provided an external evaluation under commercial greenhouse conditions, EF and RMSE can be influenced by the range and variability of observations as well as by the seasonal composition of the dataset. In particular, the summer evaluation dataset represented a short, high-temperature growing period and showed the lowest seasonal TLA performance (
Table 4), indicating that the overall evaluation metrics should be interpreted together with the seasonal results. Therefore, future studies should include formal uncertainty and sensitivity analyses to quantify how dataset composition, environmental range, and key model parameters influence EF, RMSE, and seasonal prediction performance.
Independent evaluation is essential for assessing whether model predictions remain reliable beyond the calibration data and for defining the range of model applicability [
38]. Similar evaluation procedures have been applied in leaf development models for other crops. For example, Lee et al. [
18] developed an onion leaf appearance model using datasets collected from a soil–plant-atmosphere-research chamber and evaluated the model using observations from a temperature-gradient chamber, whereas Hsiao et al. [
20] evaluated a garlic leaf development model using independent observations that were not included in model parameterization.
Among the model evaluation conditions, the lowest prediction accuracy for TLA was observed in summer (EF = 0.56; RMSE = 137.7 cm
2) (
Table 4). The mean DLI inside the greenhouse during summer (6.5 mol·m
−2·d
−1) was below the lower bound of the DLI range (9.1–21.1 mol·m
−2·d
−1) in the TGG, where model calibration was conducted (
Table 1), representing an extrapolation condition for the light-response component of the model. In addition, the mean air temperature (29.4 °C) substantially exceeded the optimum temperature of
Lpeak (20.4 °C) (
Table 2), potentially further limiting potential leaf length development. Because these concurrent environmental conditions were not sufficiently represented in the calibration datasets, they likely contributed to the reduced prediction accuracy under the summer evaluation condition.
The independent evaluation datasets included DFT hydroponic and perlite-based substrate systems, whereas the calibration datasets were obtained from an NFT hydroponic system. These cultivation systems may differ in root-zone conditions, including oxygen availability, water tension, nutrient distribution, and root-zone temperature. However, the present model was designed to predict potential leaf appearance and expansion using aerial environmental inputs under adequately managed soilless conditions, and root-zone processes were not explicitly represented. Therefore, the acceptable performance across the independent evaluation datasets suggests potential transferability under comparable greenhouse soilless cultivation conditions but not complete independence from root-zone effects. Future model extensions should incorporate root-zone water and nutrient status, oxygen availability, or root-zone temperature when applying the model to broader soilless production systems.
The model developed in this study provides a process-based framework for predicting leaf appearance and expansion in romaine lettuce using hourly air temperature and DLI as environmental inputs. Its main contribution lies in separating leaf appearance from individual leaf expansion and linking these processes through the accumulation of individual leaf area. In process-based crop models, leaf area is a major state variable connecting phenology and morphology to light interception, carbon acquisition, and dry matter production [
7,
20]. Therefore, the present model may serve as a leaf development module for integration with canopy photosynthesis and biomass accumulation models. This linkage is particularly relevant for romaine lettuce, in which canopy photosynthesis is influenced by light intensity, temperature, and growth stage [
39]. Nevertheless, the reduced TLA prediction performance under the summer evaluation condition and at the T3 sampling position in autumn indicates that further refinement is needed before extending the model to a broader range of greenhouse environments. In particular, additional datasets should be collected under high-temperature conditions above the optimum range for lettuce vegetative growth, especially at approximately 30–35 °C, and under low-light conditions near or below the lower bound of the present calibration range, such as 6–9 mol·m
−2·d
−1 DLI. Such datasets should include combinations of high temperature and low DLI because the summer evaluation condition suggested that these concurrent environmental constraints can reduce TLA prediction accuracy.
Future model development should also evaluate whether light availability should be incorporated more explicitly into the estimation of potential leaf size or into the leaf expansion module as a temperature–light interaction term. Previous studies have shown that lettuce leaf area, biomass, photosynthetic traits, and nutrient uptake can vary depending on combinations of light intensity and temperature [
36] and that air temperature, light intensity, and root-zone temperature jointly influence lettuce growth, leaf expansion-related traits, and fresh yield [
37]. Therefore, incorporating temperature–light interactions may improve the prediction of leaf expansion under conditions in which high temperature and low light occur simultaneously. In addition, because the present model does not explicitly represent root-zone processes, future extensions should consider root-zone temperature, water and nutrient status, and oxygen availability as stress modifiers or additional root-zone modules when applying the model to broader soilless cultivation systems. Overall, the proposed model may serve as a leaf development module for predicting romaine lettuce growth under comparable greenhouse cultivation conditions, while further refinement is required for extrapolation to high-temperature, low-light, or root-zone-limited conditions.




 ,
,