Article

Transcriptomic Analysis Reveals Candidate Genes Associated with Temperature-Dependent Leaf-Color Change in Pakchoi


State Key Laboratory of Vegetable Biobreeding, Institute of Vegetables and Flowers, Chinese Academy of Agricultural Sciences, Beijing 100081, China
*
Authors to whom correspondence should be addressed.
Horticulturae 2026, 12(4), 469; https://doi.org/10.3390/horticulturae12040469
Submission received: 21 February 2026 / Revised: 31 March 2026 / Accepted: 7 April 2026 / Published: 10 April 2026

Abstract

Leaf-color variation in plants should be associated with chlorophyll metabolism and chloroplast development. Here, we characterized a low-temperature-sensitive pakchoi DH line, 1197, which exhibited green leaves at 25 °C, but showed yellowing at 4 °C. Low temperature significantly reduced chlorophyll accumulation and disrupted chloroplast ultrastructure. After transfer from 4 °C to 25 °C for 7 days, yellow leaves partially regreened, and chlorophyll a content increased by 366.67%. RNA-seq analysis identified 3058 core DEGs associated with the yellowing–regreening transition, which were significantly enriched in photosynthesis–antenna proteins, photosynthesis, and porphyrin metabolism pathways. Leaf yellowing was characterized by repression of chlorophyll biosynthesis genes (e.g., CHLD, CHLM, PORC) and induction of degradation genes (SGR1, SGR2, NYC1, PAO), together with widespread downregulation of chloroplast function-related genes. In addition, GLK2, HBI1, NAC047, and NAC029 were identified as candidate regulators of temperature-dependent leaf-color conversion. This study provides candidate molecular insights into low-temperature-induced yellowing and regreening in pakchoi and offers candidate genes for future functional validation and Brassica breeding.

1. Introduction

Pakchoi (Brassica rapa L. ssp. Chinensis) is an important leafy vegetable in China, and its market value largely depends on leaf appearance and quality. Accordingly, leaf color is a key agronomic trait in pakchoi breeding.
Leaf-color variation has been widely reported in crops such as rice [1,2], wheat [3,4], tomato [5], cucumber [6,7], and cabbage [8]. Among these, leaf yellowing has attracted particular attention because yellow-leaf phenotypes typically exhibit reduced photosynthetic pigment contents and impaired photosynthetic capacity, which can ultimately result in yield loss or even plant death [9,10,11].
Leaf yellowing can be broadly classified into environmentally induced and genetically determined types. Environmentally induced yellowing is influenced by external factors such as leaf senescence. For example, chlorophyll levels decline during autumn in Norway birch [12]. Genetically determined yellowing is frequently caused by mutations in nuclear or cytoplasmic genes. These mutations disrupt chlorophyll metabolism or chloroplast development, ultimately resulting in leaf-color variation. Representative examples include ZmcpRF1 in maize [13], CsaCNGCs in cucumber [14], the chloroplast gene rps4 in Chinese cabbage [9], and EMB1923 in Chinese cabbage [10]. Notably, some mutants exhibit leaf-color changes in response to environmental conditions, such as the rice mutant OsV4 [15], the soybean mutant y24 [16], and the cotton mutant SD18-46 [17].
In higher plants, photosynthetic pigments mainly include chlorophylls and carotenoids [18]. Chlorophyll a is typically more abundant than chlorophyll b, and the chlorophyll a/b ratio is usually around 3:1 [19]. Chlorophyll biosynthesis involves a conserved series of enzymatic steps encoded by multiple genes [20,21,22]. The pathway begins with the reduction in glutamyl-tRNA to glutamate-1-semialdehyde and proceeds through several intermediates to chlorophyllide a [21], which is subsequently converted to chlorophyll a by chlorophyll synthase. The interconversion between chlorophyll a and chlorophyll b forms the chlorophyll cycle, which is mediated by chlorophyll a oxygenase, chlorophyll b reductase, and 7-hydroxymethyl chlorophyll a reductase [23]. Chlorophyll degradation is also a multistep enzymatic process. Chlorophyll b is first converted to chlorophyll a, which is then catabolized into non-fluorescent chlorophyll catabolites through the pheophorbide a oxygenase (PAO) pathway [24,25,26,27]. Therefore, leaf color is tightly controlled by the dynamic balance between chlorophyll biosynthesis and degradation.
Alterations in chloroplast structure can also cause changes in leaf color. The chlorophyll biosynthesis occurs in chloroplasts [23], which are highly sensitive organelles to environmental stress in plant cells [28]. Low-temperature stress can directly damage chloroplasts [29], particularly the thylakoid membrane system [28], potentially leading to disorganization of the entire chloroplast structure and impaired chlorophyll biosynthesis [30]. Moreover, photosynthetic pigments not only capture and transfer light energy [31], but also contribute to the assembly of pigment–protein complexes, including photosystem I (PSI), photosystem II (PSII), and light-harvesting complexes (LHCs). These complexes are essential for maintaining chloroplast structural stability [32,33].
In this study, we characterized a low-temperature-sensitive pakchoi DH line, 1197. Under normal temperatures (25 °C), line 1197 developed normal green leaves. Continuous low temperature (4 °C) induced a reversible yellowing phenotype that recovered after return to normal temperature. This unique material provides an ideal system for investigating how low temperature modulates chlorophyll metabolism and chloroplast development in Brassica leafy vegetables. The aim of this study was to clarify the physiological and transcriptomic basis of low-temperature-induced yellowing and regreening in pakchoi line 1197. We hypothesized that low temperature disrupts leaf color by altering chlorophyll metabolism and chloroplast-related processes, and that these changes are at least partly reversed after transfer back to normal temperature.

2. Results

2.1. Phenotypes and Photosynthetic Pigment Content of G1197, Y1197 and RG1197

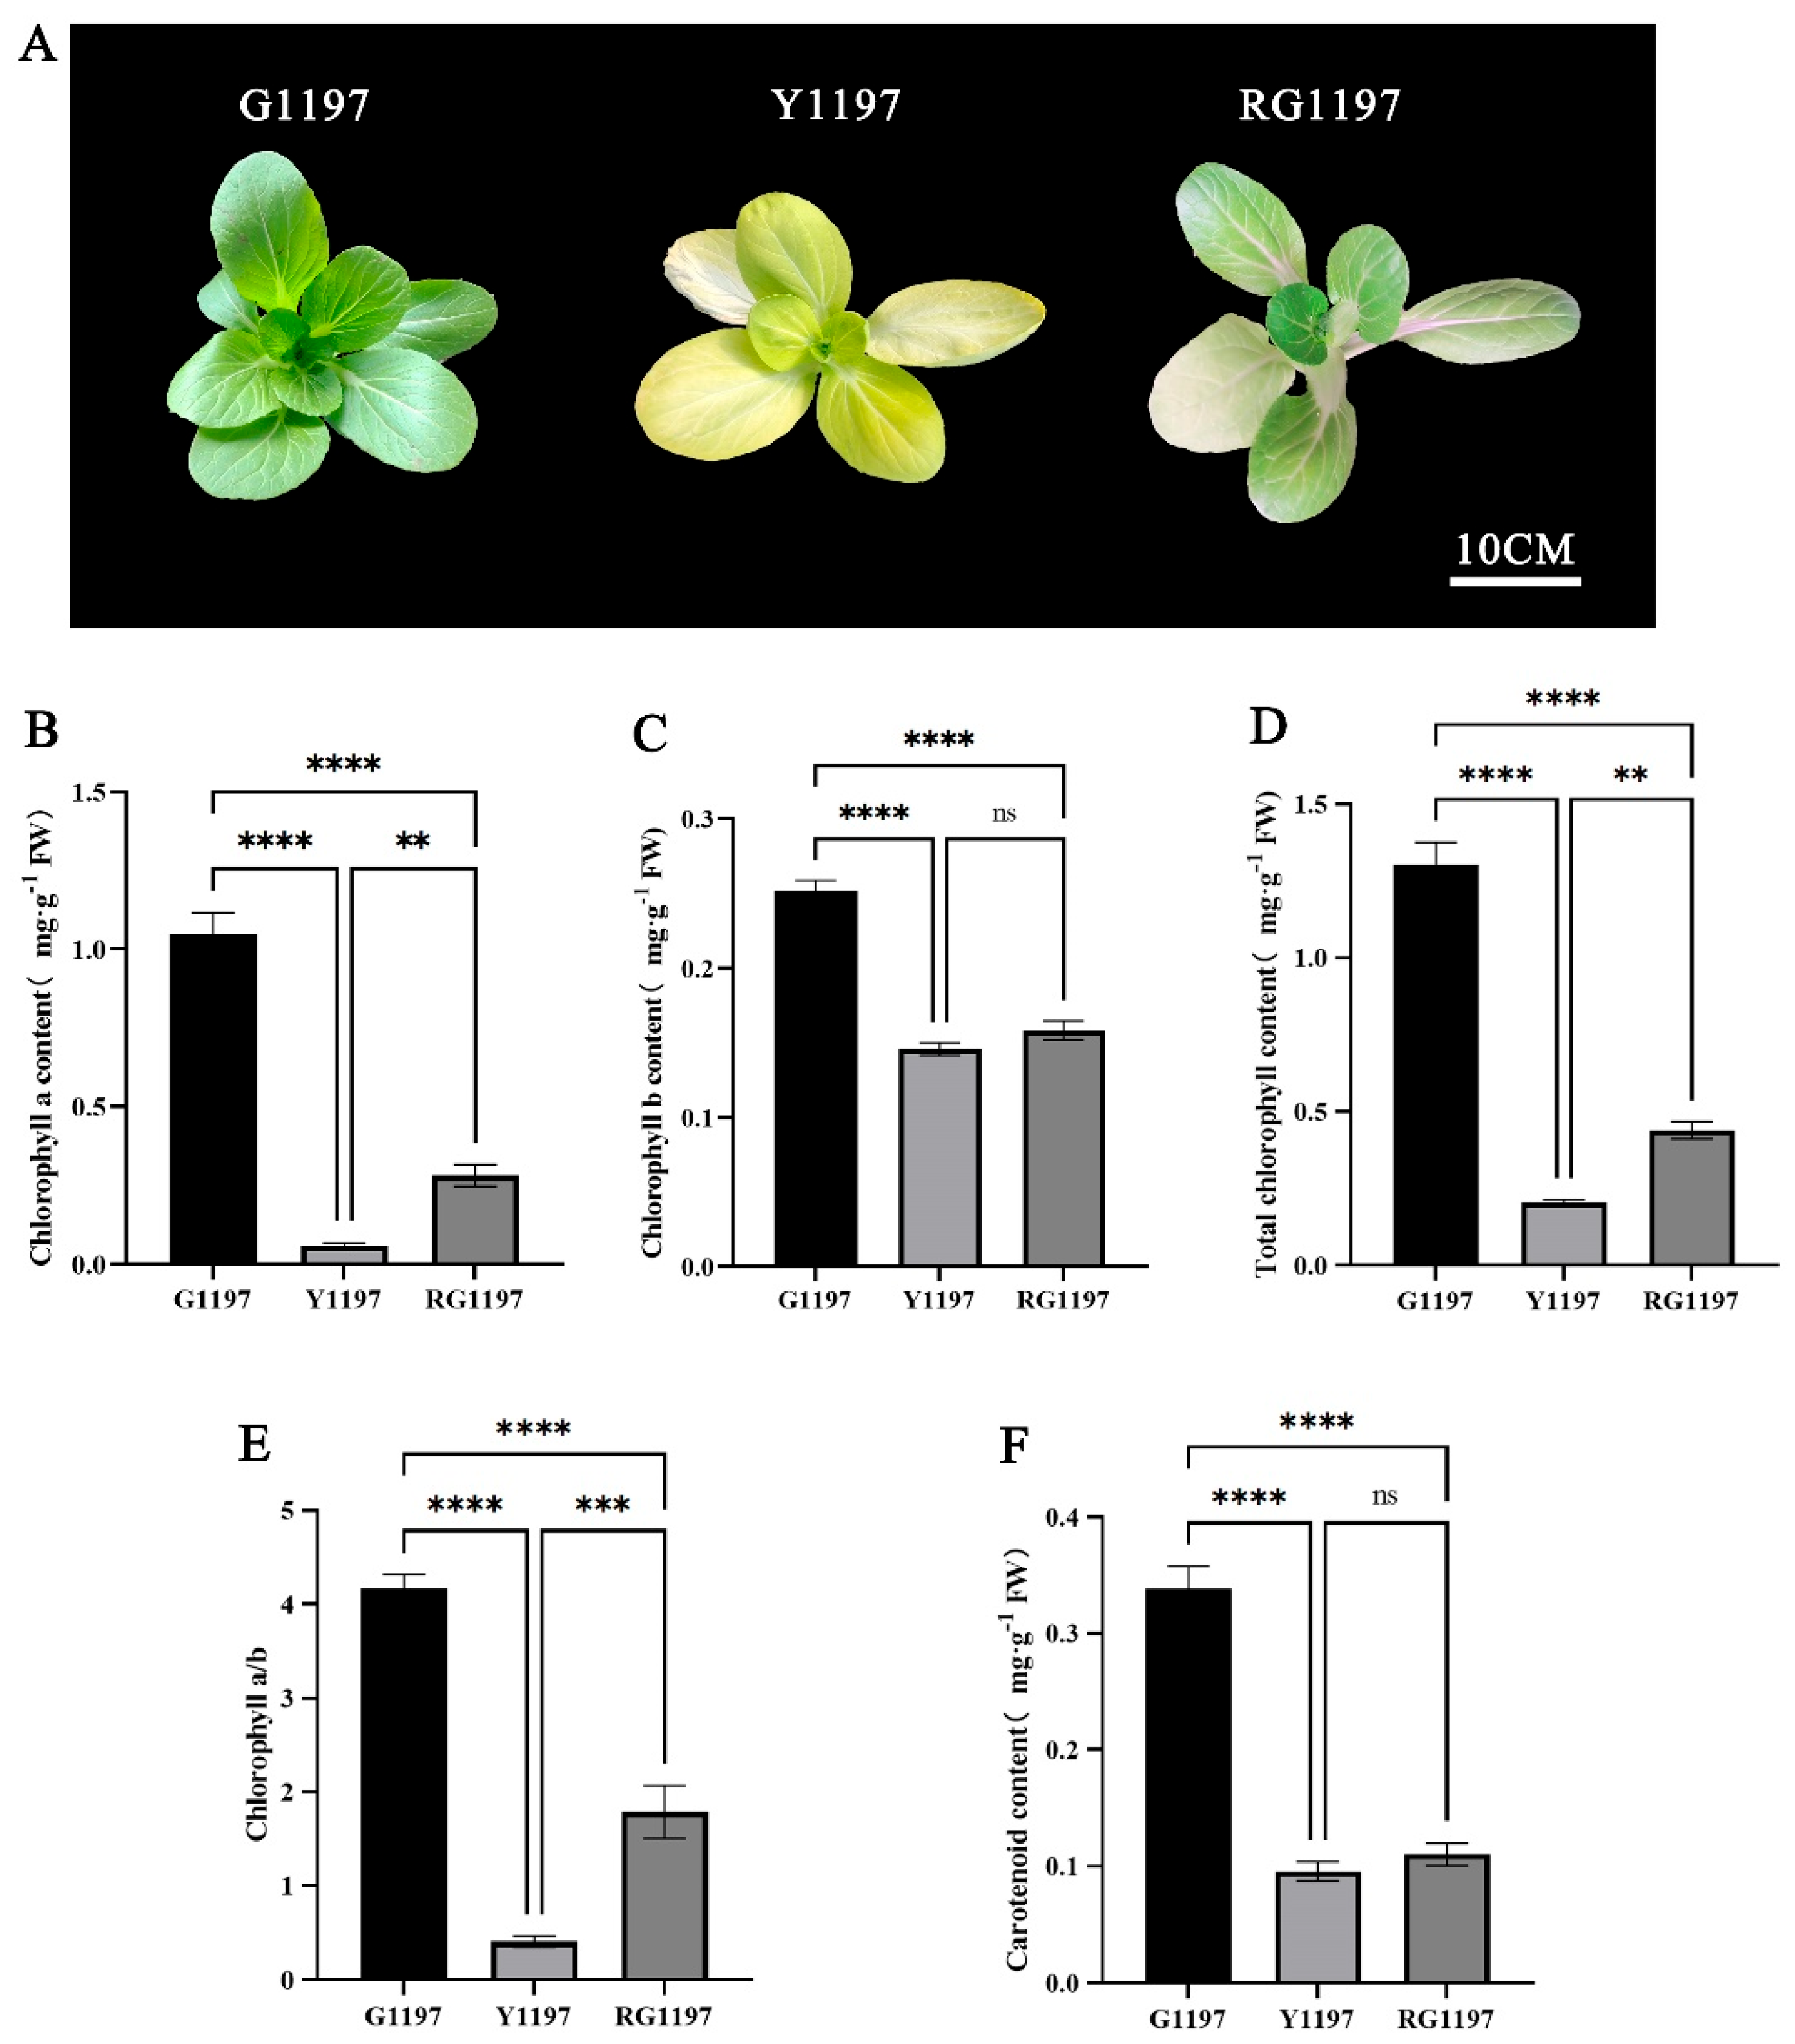
The phenotypes of the pakchoi line 1197 were observed at the seedling stage (Figure 1A). Plants grown under normal temperature (25 °C) displayed normal green leaves and were designated G1197. Plants developed a yellow-leaf phenotype at low temperature (4 °C) and were designated Y1197. When Y1197 plants were transferred to the normal temperature range for 7 days, leaf color partially recovered, producing the regreened phenotype, designated RG1197.
Photosynthetic pigment analysis showed that, relative to G1197, Y1197 leaves contained significantly lower levels of chlorophyll a, chlorophyll b, total chlorophyll, and carotenoids, with reductions of 94.29%, 40.00%, 70.59%, and 71.43%, respectively. Notably, the chlorophyll a/b ratio in Y1197 was <1. After temperature recovery, pigment contents increased in RG1197 compared with Y1197. Chlorophyll a exhibited the most pronounced restoration, increasing by 366.67%, and the chlorophyll a/b ratio increased to >1.

2.2. Effects of Low-Temperature Stress on Chloroplast Ultrastructure in Line 1197

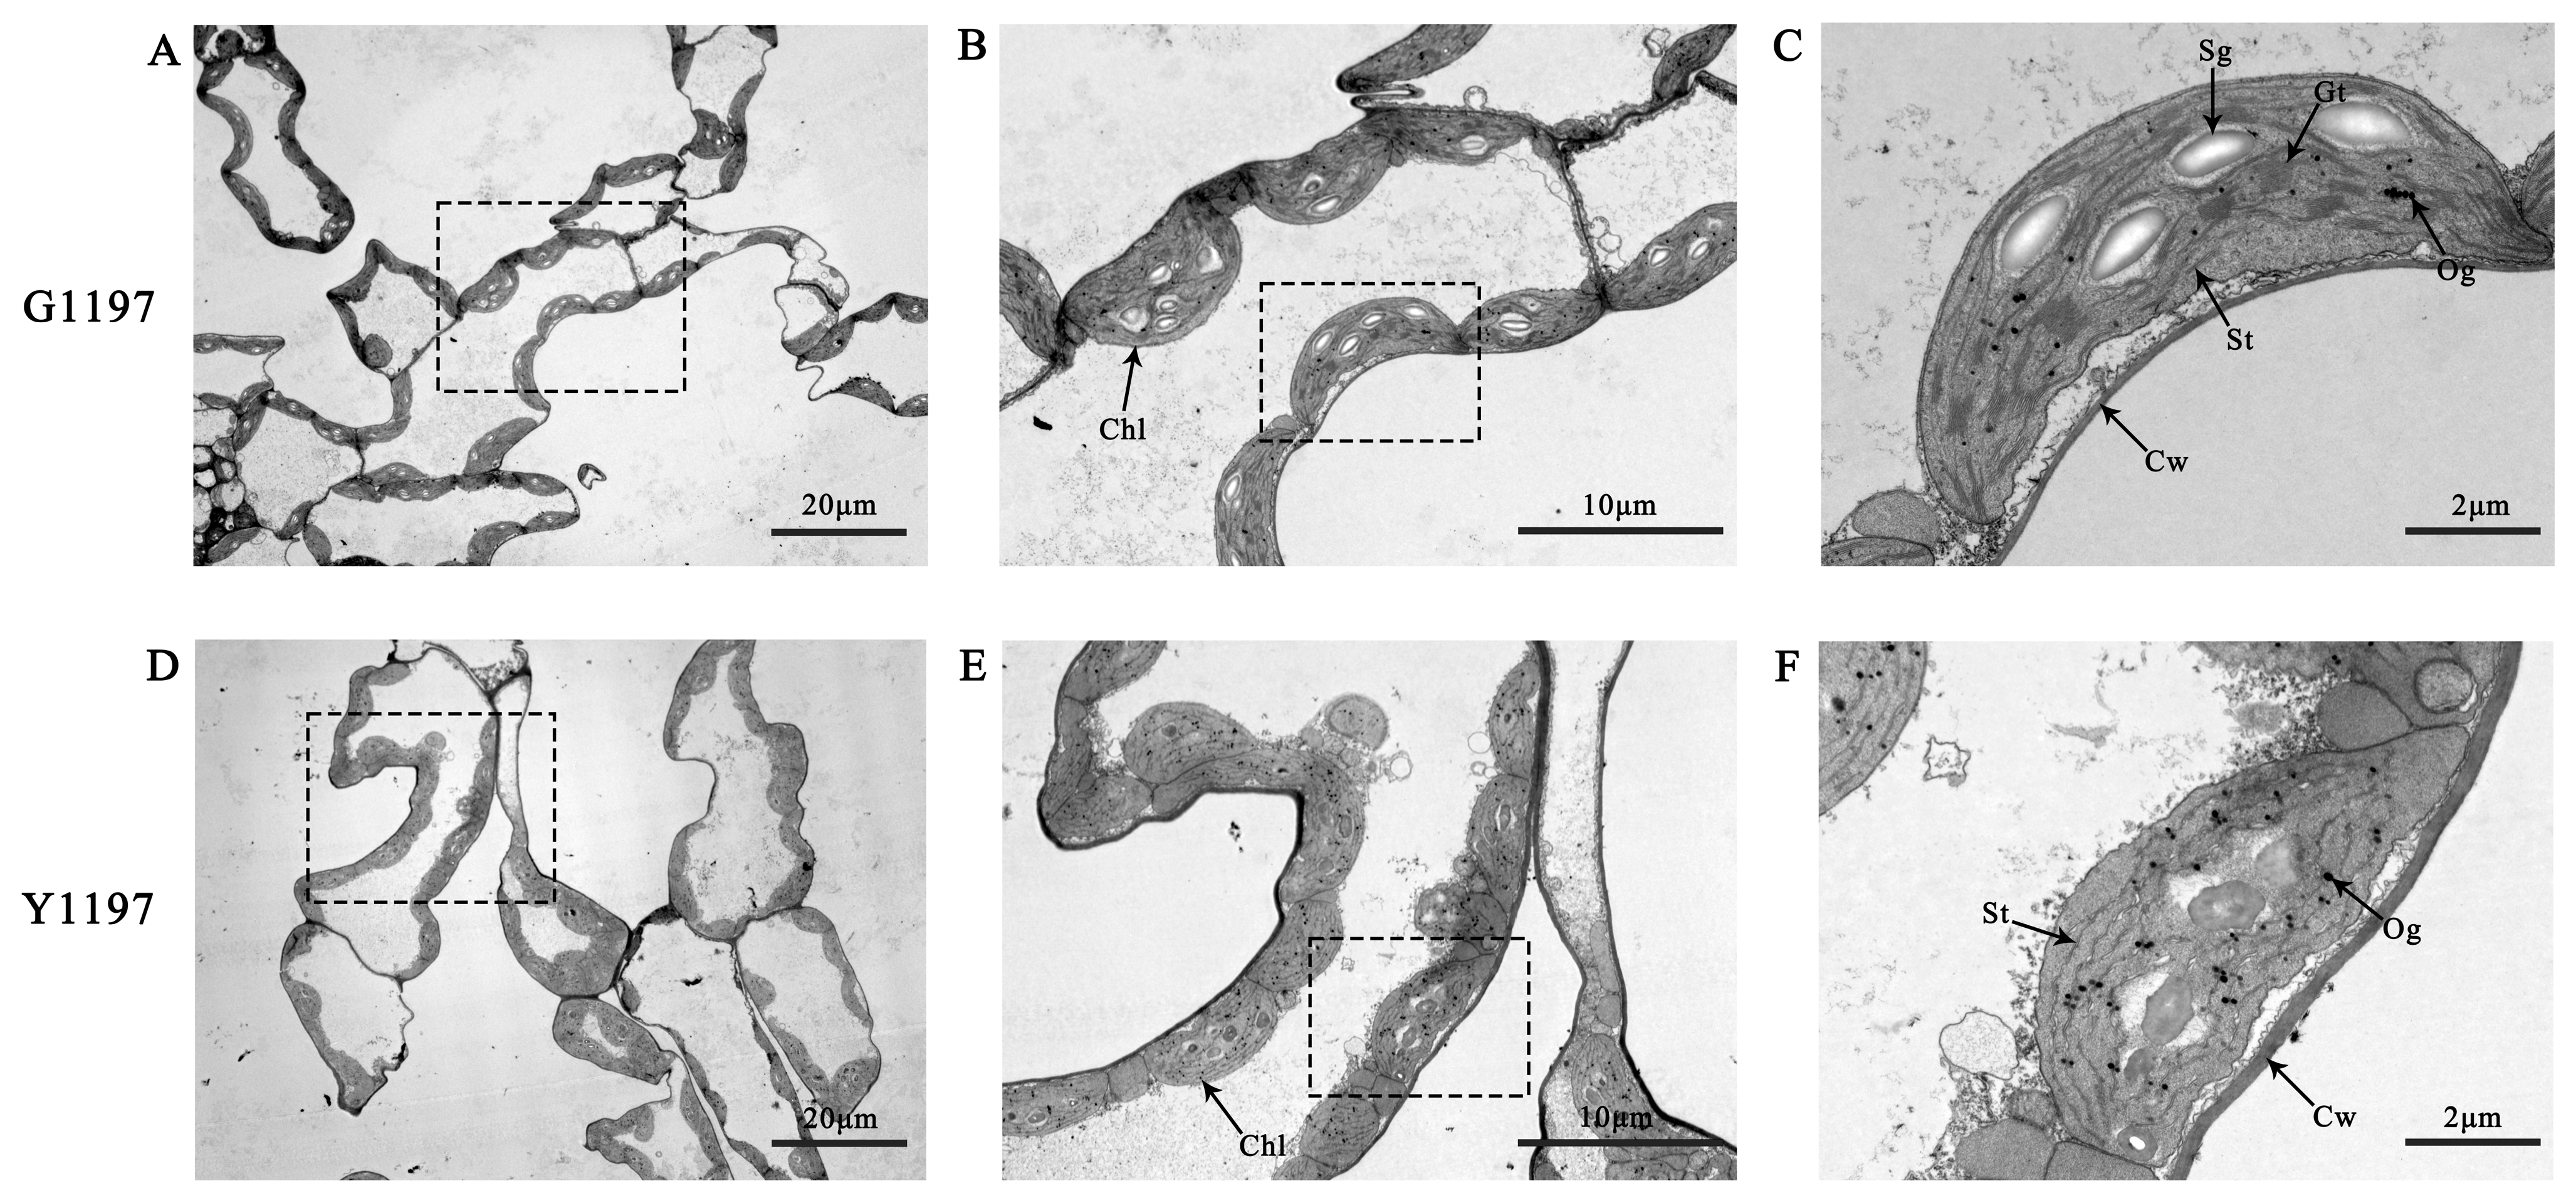
Chloroplast ultrastructure was examined in leaves of G1197 and Y1197. In G1197, mesophyll cells exhibited intact cellular organization (Figure 2A). Chloroplasts were aligned in a single, orderly layer along the cell wall and showed an oblong to fusiform morphology (Figure 2B). Well-developed grana with tightly stacked thylakoid membranes were clearly observed, and 1–5 starch grains were evenly distributed within each chloroplast (Figure 2C).
In contrast, chloroplasts in Y1197 displayed marked aggregation (Figure 2D) and became rounded or nearly spherical, accompanied by severe disruption of internal structures (Figure 2E). Thylakoid membranes were largely disorganized, with grana thylakoids poorly absent. Starch grains were substantially degraded, whereas osmiophilic globules increased in both number and size. Additionally, slight thickening of the cell wall was observed (Figure 2F).

2.3. Preliminary Analysis of Transcriptome Data

RNA-seq generated a total of 53.75 GB of raw data. Quality assessment showed that all libraries had Q20 > 98% and Q30 > 96% (Table S1). After quality filtering, 84.40–87.61% of clean reads from each sample were successfully mapped to the Chinese cabbage reference genome (Table S2). In total, 47,886 expressed genes were detected across the three phenotypic groups.
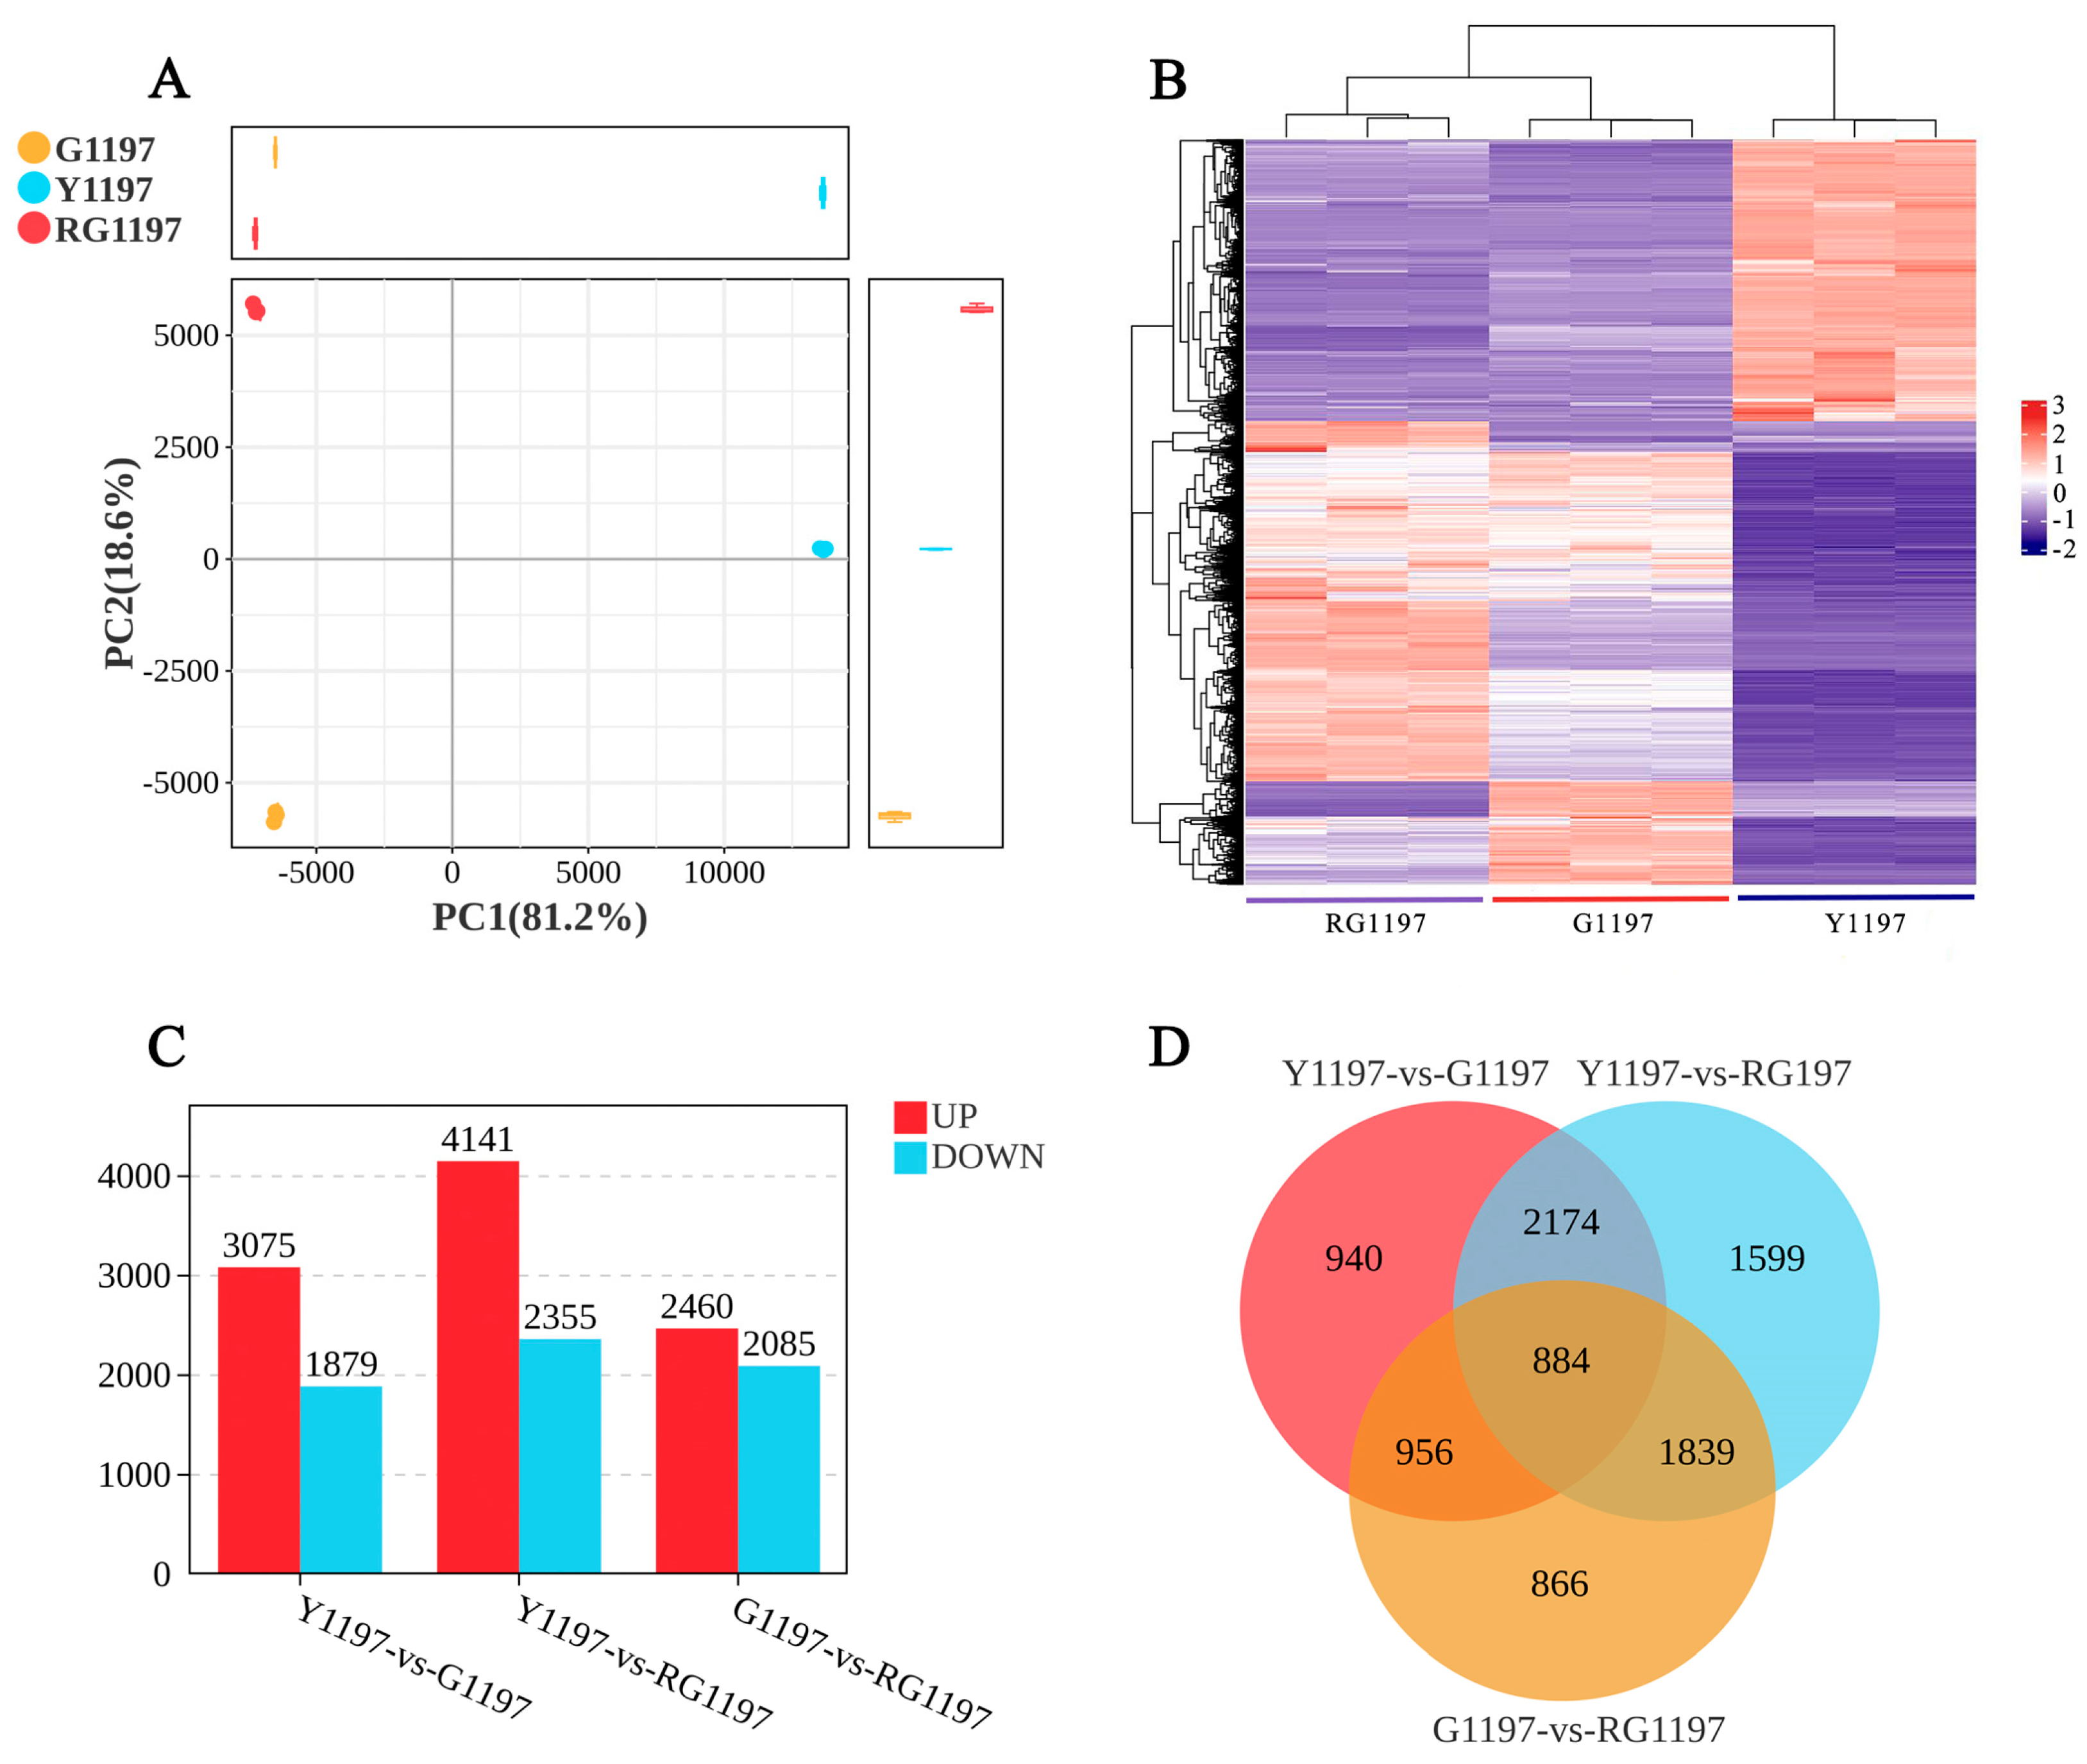
PCA demonstrated high reproducibility among biological replicates within each group and clear separation among the three treatments (Figure 3A). Differential expression analysis was performed for three pairwise comparisons (Y1197 vs. G1197, Y1197 vs. RG1197, and G1197 vs. RG1197).
In the Y1197 vs. G1197 comparison, 4954 DEGs were identified, including 3075 upregulated and 1879 downregulated genes. The Y1197 vs. RG1197 comparison yielded 6496 DEGs (4141 upregulated and 2355 downregulated), while 4545 DEGs were detected in G1197 vs. RG1197 (2460 upregulated and 2085 downregulated) (Figure 3C). The intersection analysis of DEGs from Y1197 vs. G1197 and Y1197 vs. RG1197 identified 3058 core DEGs (Figure 3B,D). These genes are likely associated with low-temperature-induced leaf yellowing and subsequent regreening in pakchoi line 1197 and were therefore used for downstream functional enrichment analyses.

2.4. Functional Enrichment of Core DEGs Highlighted Chloroplast- and Photosynthesis-Related Processes

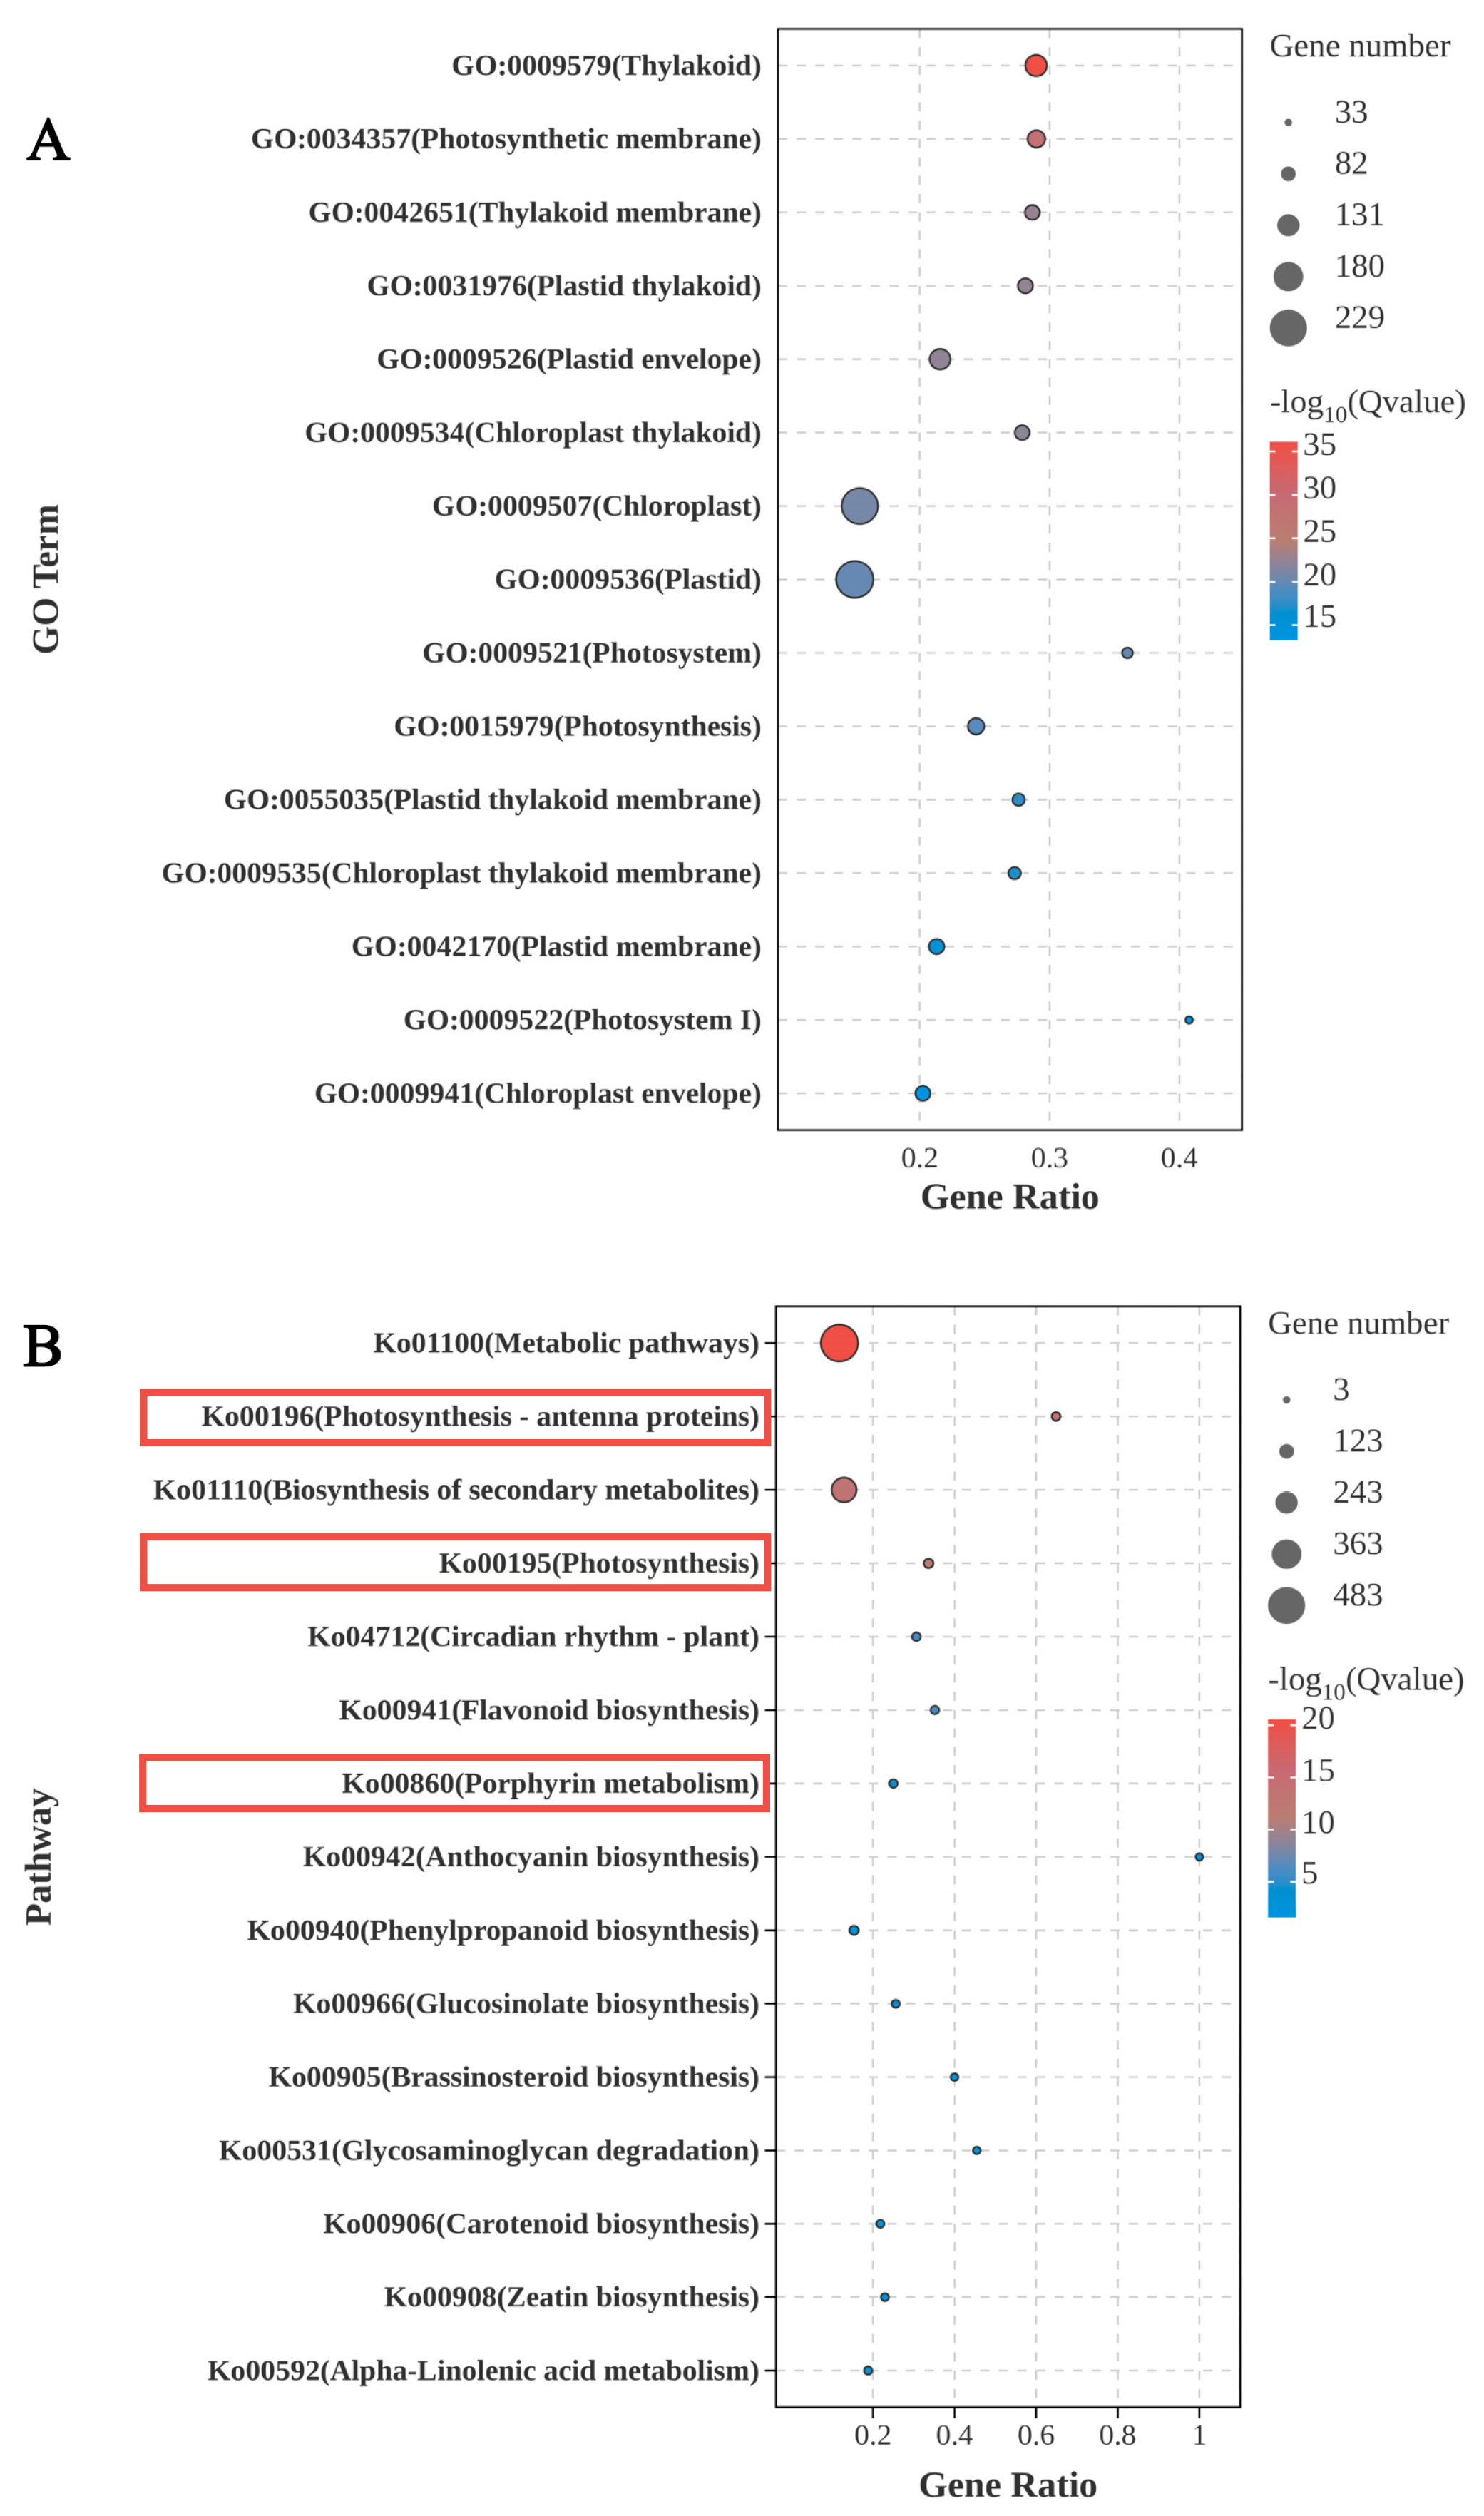
GO and KEGG enrichment analysis were performed on the 3058 core DEGs. GO enrichment analysis (Figure 4A) revealed that, within the biological process category, the DEGs were most significantly enriched in photosynthesis (GO:0015979) (Figure 4A). For molecular function, the most significantly enriched term was oxidoreductase activity (GO:0016491). Notably, the top enriched GO terms were predominantly chloroplast-related, including thylakoid (GO:0009579), photosynthetic membrane (GO:0034357), thylakoid membrane (GO:0042651), plastid thylakoid (GO:0031976), plastid envelope (GO:0009526), chloroplast thylakoid (GO:0009534), chloroplast (GO:0009507), and plastid (GO:0009536). These results suggest that the core DEGs are mainly involved in chloroplast organization and photosynthetic regulation.
KEGG pathway analysis identified the top significantly enriched pathways as metabolic pathways (ko01100), photosynthesis–antenna proteins (ko00196), biosynthesis of secondary metabolites (ko01110), photosynthesis (ko00195), circadian rhythm-plant (ko04712), flavonoid biosynthesis (ko00941), porphyrin metabolism (ko00860), and anthocyanin biosynthesis (ko00942) (Figure 4B). Importantly, chlorophyll metabolism is a major branch of the porphyrin metabolic pathway, while both photosynthesis–antenna proteins and photosynthesis are directly related to chloroplast function. Collectively, these enrichment results indicated that the low-temperature-responsive yellowing and regreening phenotypes were closely associated with chlorophyll metabolism and chloroplast-related processes.

2.5. Transcriptional Regulation of Chlorophyll Content via Porphyrin Metabolism

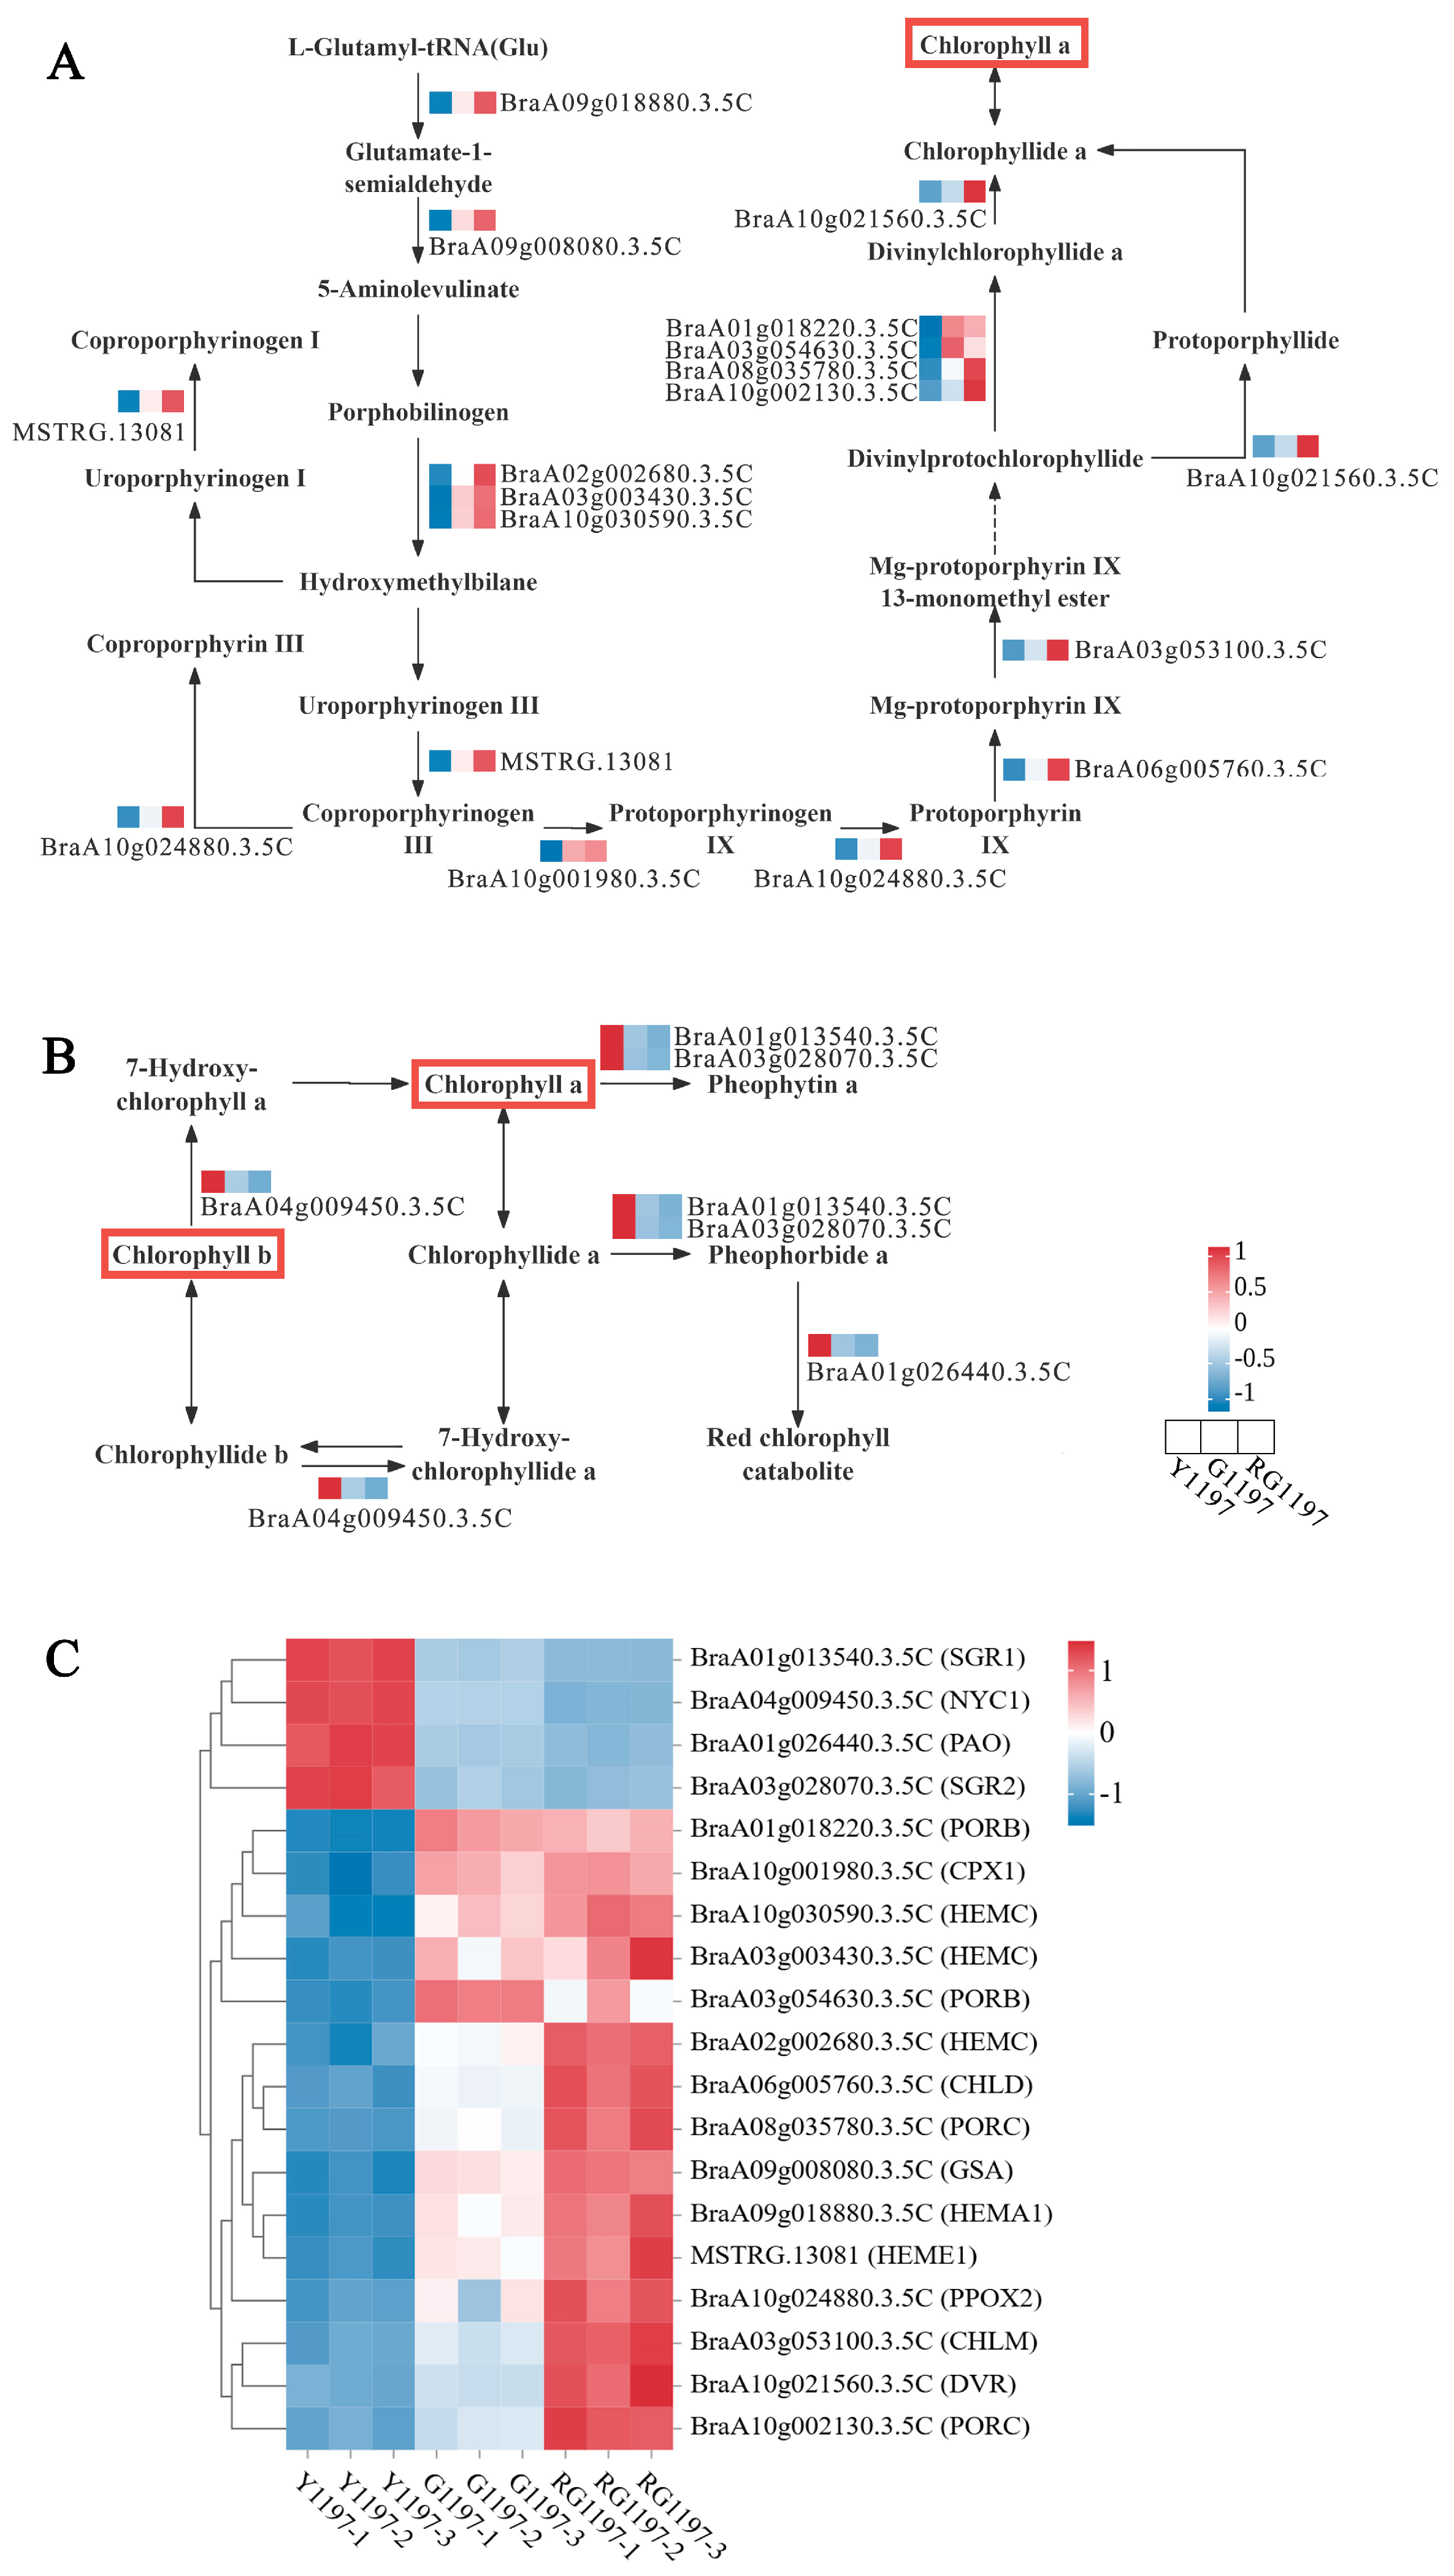
Chlorophyll biosynthesis and degradation constitute a major branch of porphyrin metabolism. To explore transcriptional regulation of chlorophyll metabolism during low-temperature-induced leaf yellowing in Y1197, we examined 21 DEGs enriched in the porphyrin metabolism pathway (ko00860). Among them, 19 genes were involved in chlorophyll biosynthesis or degradation (Figure 5C), whereas 2 genes were associated with the heme branch. Notably, we identified a novel transcript (MSTRG.13081) homologous to uroporphyrinogen decarboxylase 1 in the porphyrin metabolism pathway. This novel gene may contribute to the temperature-dependent regulation of chlorophyll biosynthesis in line 1197.
Compared with G1197, several key chlorophyll biosynthesis genes were significantly downregulated in Y1197, including CHLD, PORB, and PORC (Figure 5A). In contrast, chlorophyll degradation genes were strongly induced. The expression levels of SGR1, SGR2, NYC1, and PAO were upregulated by 2- to 4-fold relative to G1197 (Figure 5B).
After 7 days of regreening, these expression patterns were largely reversed in RG1197. Chlorophyll biosynthesis genes were significantly upregulated and, in many cases, exceeded the expression levels observed in G1197. Notably, CHLD, CHLM, and PORC showed the most pronounced increases among the biosynthesis-related genes (Figure 5A). Conversely, chlorophyll degradation genes (SGR1, SGR2, NYC1, and PAO) were significantly downregulated after recovery and fell below the levels in G1197 (Figure 5B).

2.6. Expression Changes in Chloroplast Function-Related Genes

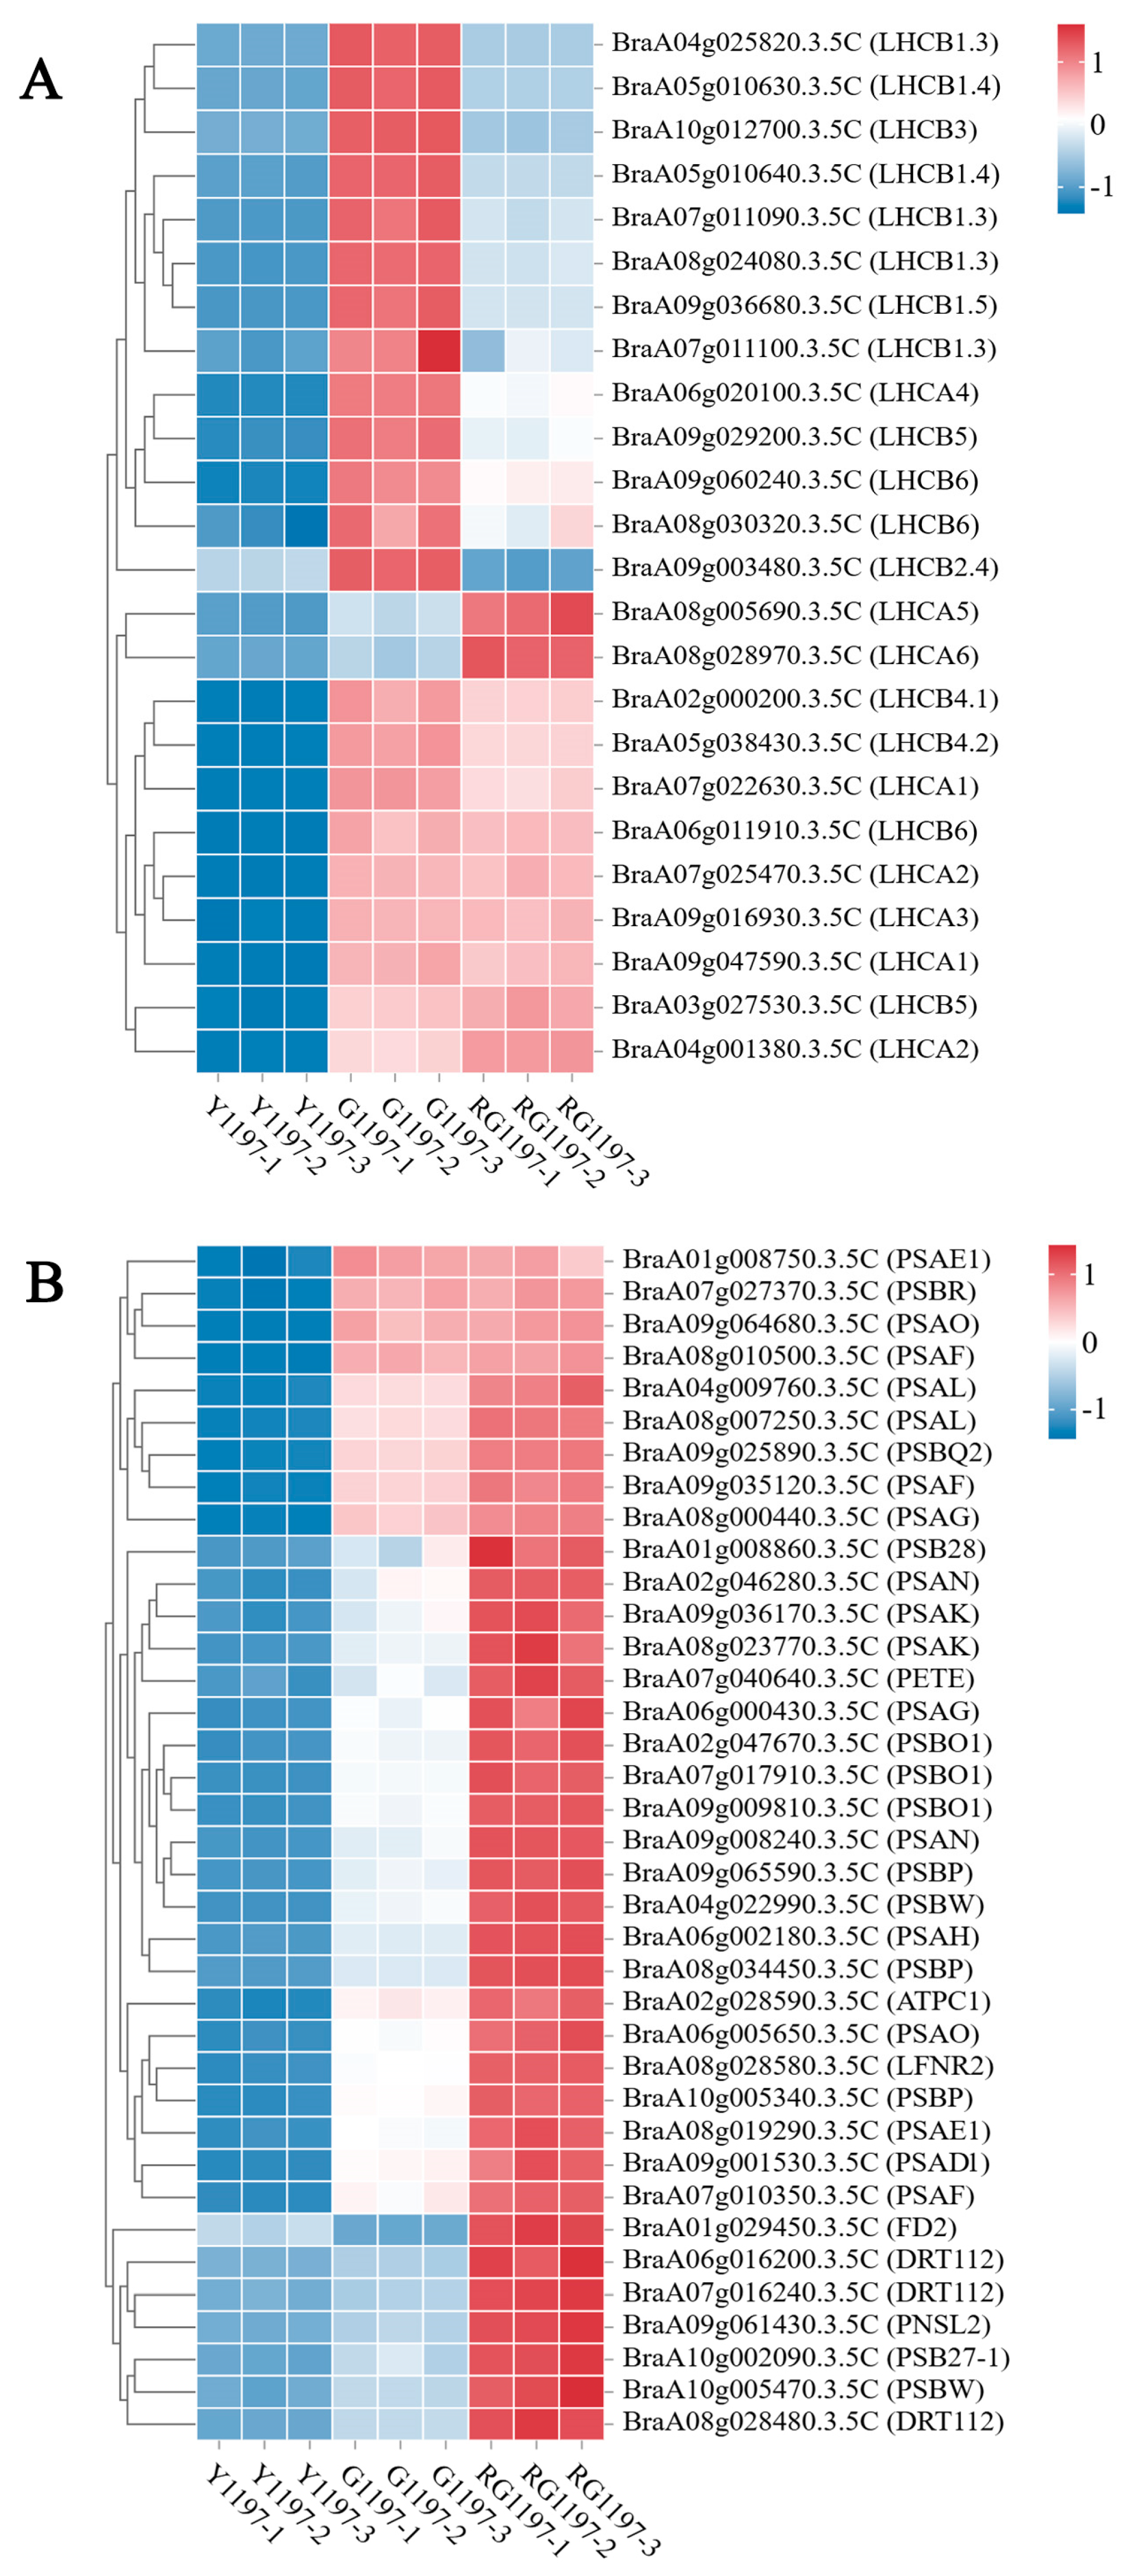
KEGG enrichment analysis showed that the pathways “photosynthesis–antenna proteins” (ko00196) and “photosynthesis” (ko00195) were significantly enriched, containing 24 and 37 DEGs, respectively. These genes encode key components involved in light harvesting, photochemical reactions, and electron transport, suggesting that transcriptional regulation of photosynthesis-related genes contributes to low-temperature-induced leaf yellowing in Y1197.
Under low-temperature stress, expression of genes encoding light-harvesting complex proteins, including LHCB1-LHCB6 and LHCA1-LHCA5, was markedly suppressed in Y1197 leaves (Figure 6A). Similarly, genes encoding core components of photosystem reaction centers, the electron transport chain, and ATP synthase in the photosynthesis pathway were broadly downregulated (Figure 6B). These transcriptional changes were consistent with the chloroplast ultrastructural damage observed in Y1197 and likely underlie the impaired photosynthetic function.
After 7 days of regreening, these genes were broadly upregulated in RG1197. Notably, LHCA5 and LHCA6 were significantly upregulated, reaching expression levels approximately 8-fold and 2.5-fold higher, respectively, than those in G1197. In contrast, most LHCB genes showed a more limited recovery, and LHCB2.4 remained significantly lower in RG1197 than in G1197.

2.7. Analysis of Differentially Expressed Transcription Factors

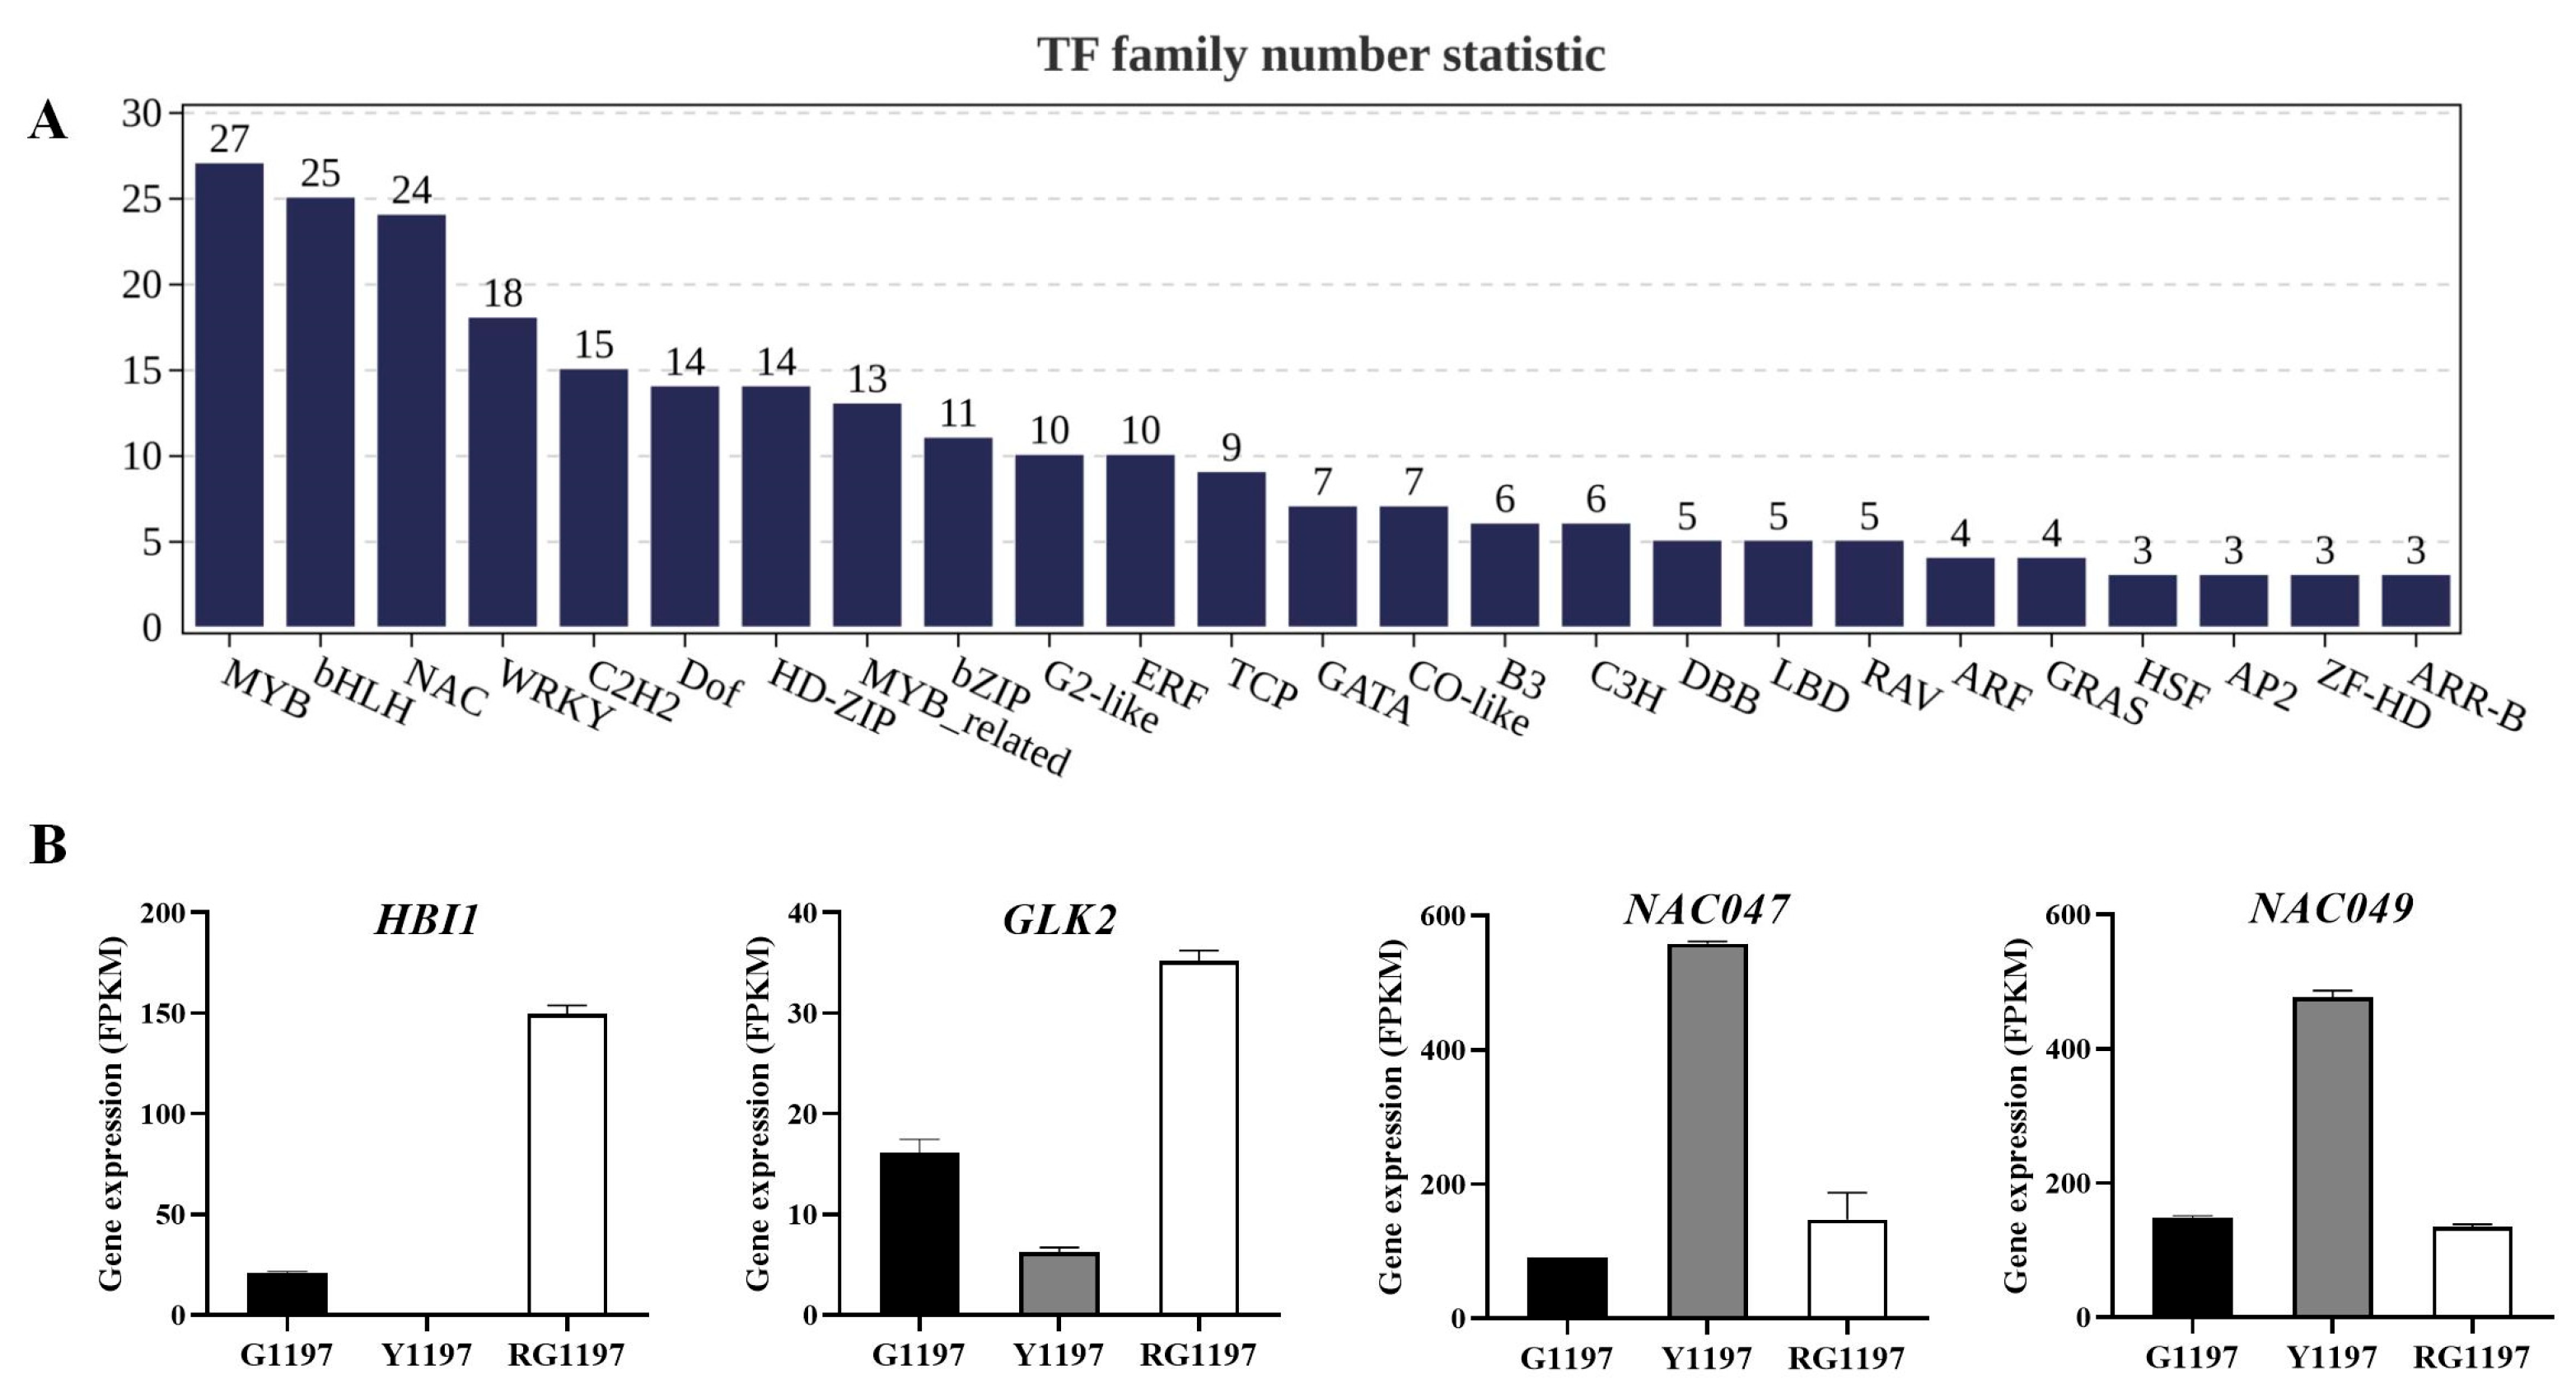
A total of 273 transcription factors (TFs) belonging to 42 families were identified among the 3058 core DEGs. The MYB, bHLH, and NAC families contained the largest numbers of differentially expressed TFs (Figure 7A).
Notably, HBI1 (BraA06g031010.3.5C), a reported integrator of light and hormone signaling [34], showed more than sevenfold higher expression in RG1197 than in G1197, while its expression was nearly undetectable in Y1197. This expression pattern suggested that HBI1 may be associated with the regreening process. GLK2 (BraA06g044680.3.5C), a key regulator of chloroplast development [35,36], exhibited an expression trend closely associated with chlorophyll biosynthesis genes, implying that it may participate in regulating the change between leaf yellowing and regreening. In contrast, NAC047 (BraA01g044450.3.5C) and NAC029 (BraA07g035410.3.5C), which have been reported as potential growth-related regulators [37], were strongly induced in Y1197, suggesting their possible involvement in the low-temperature stress response of line 1197 (Figure 7B).

2.8. RT-qPCR Validation of RNA-Seq Data

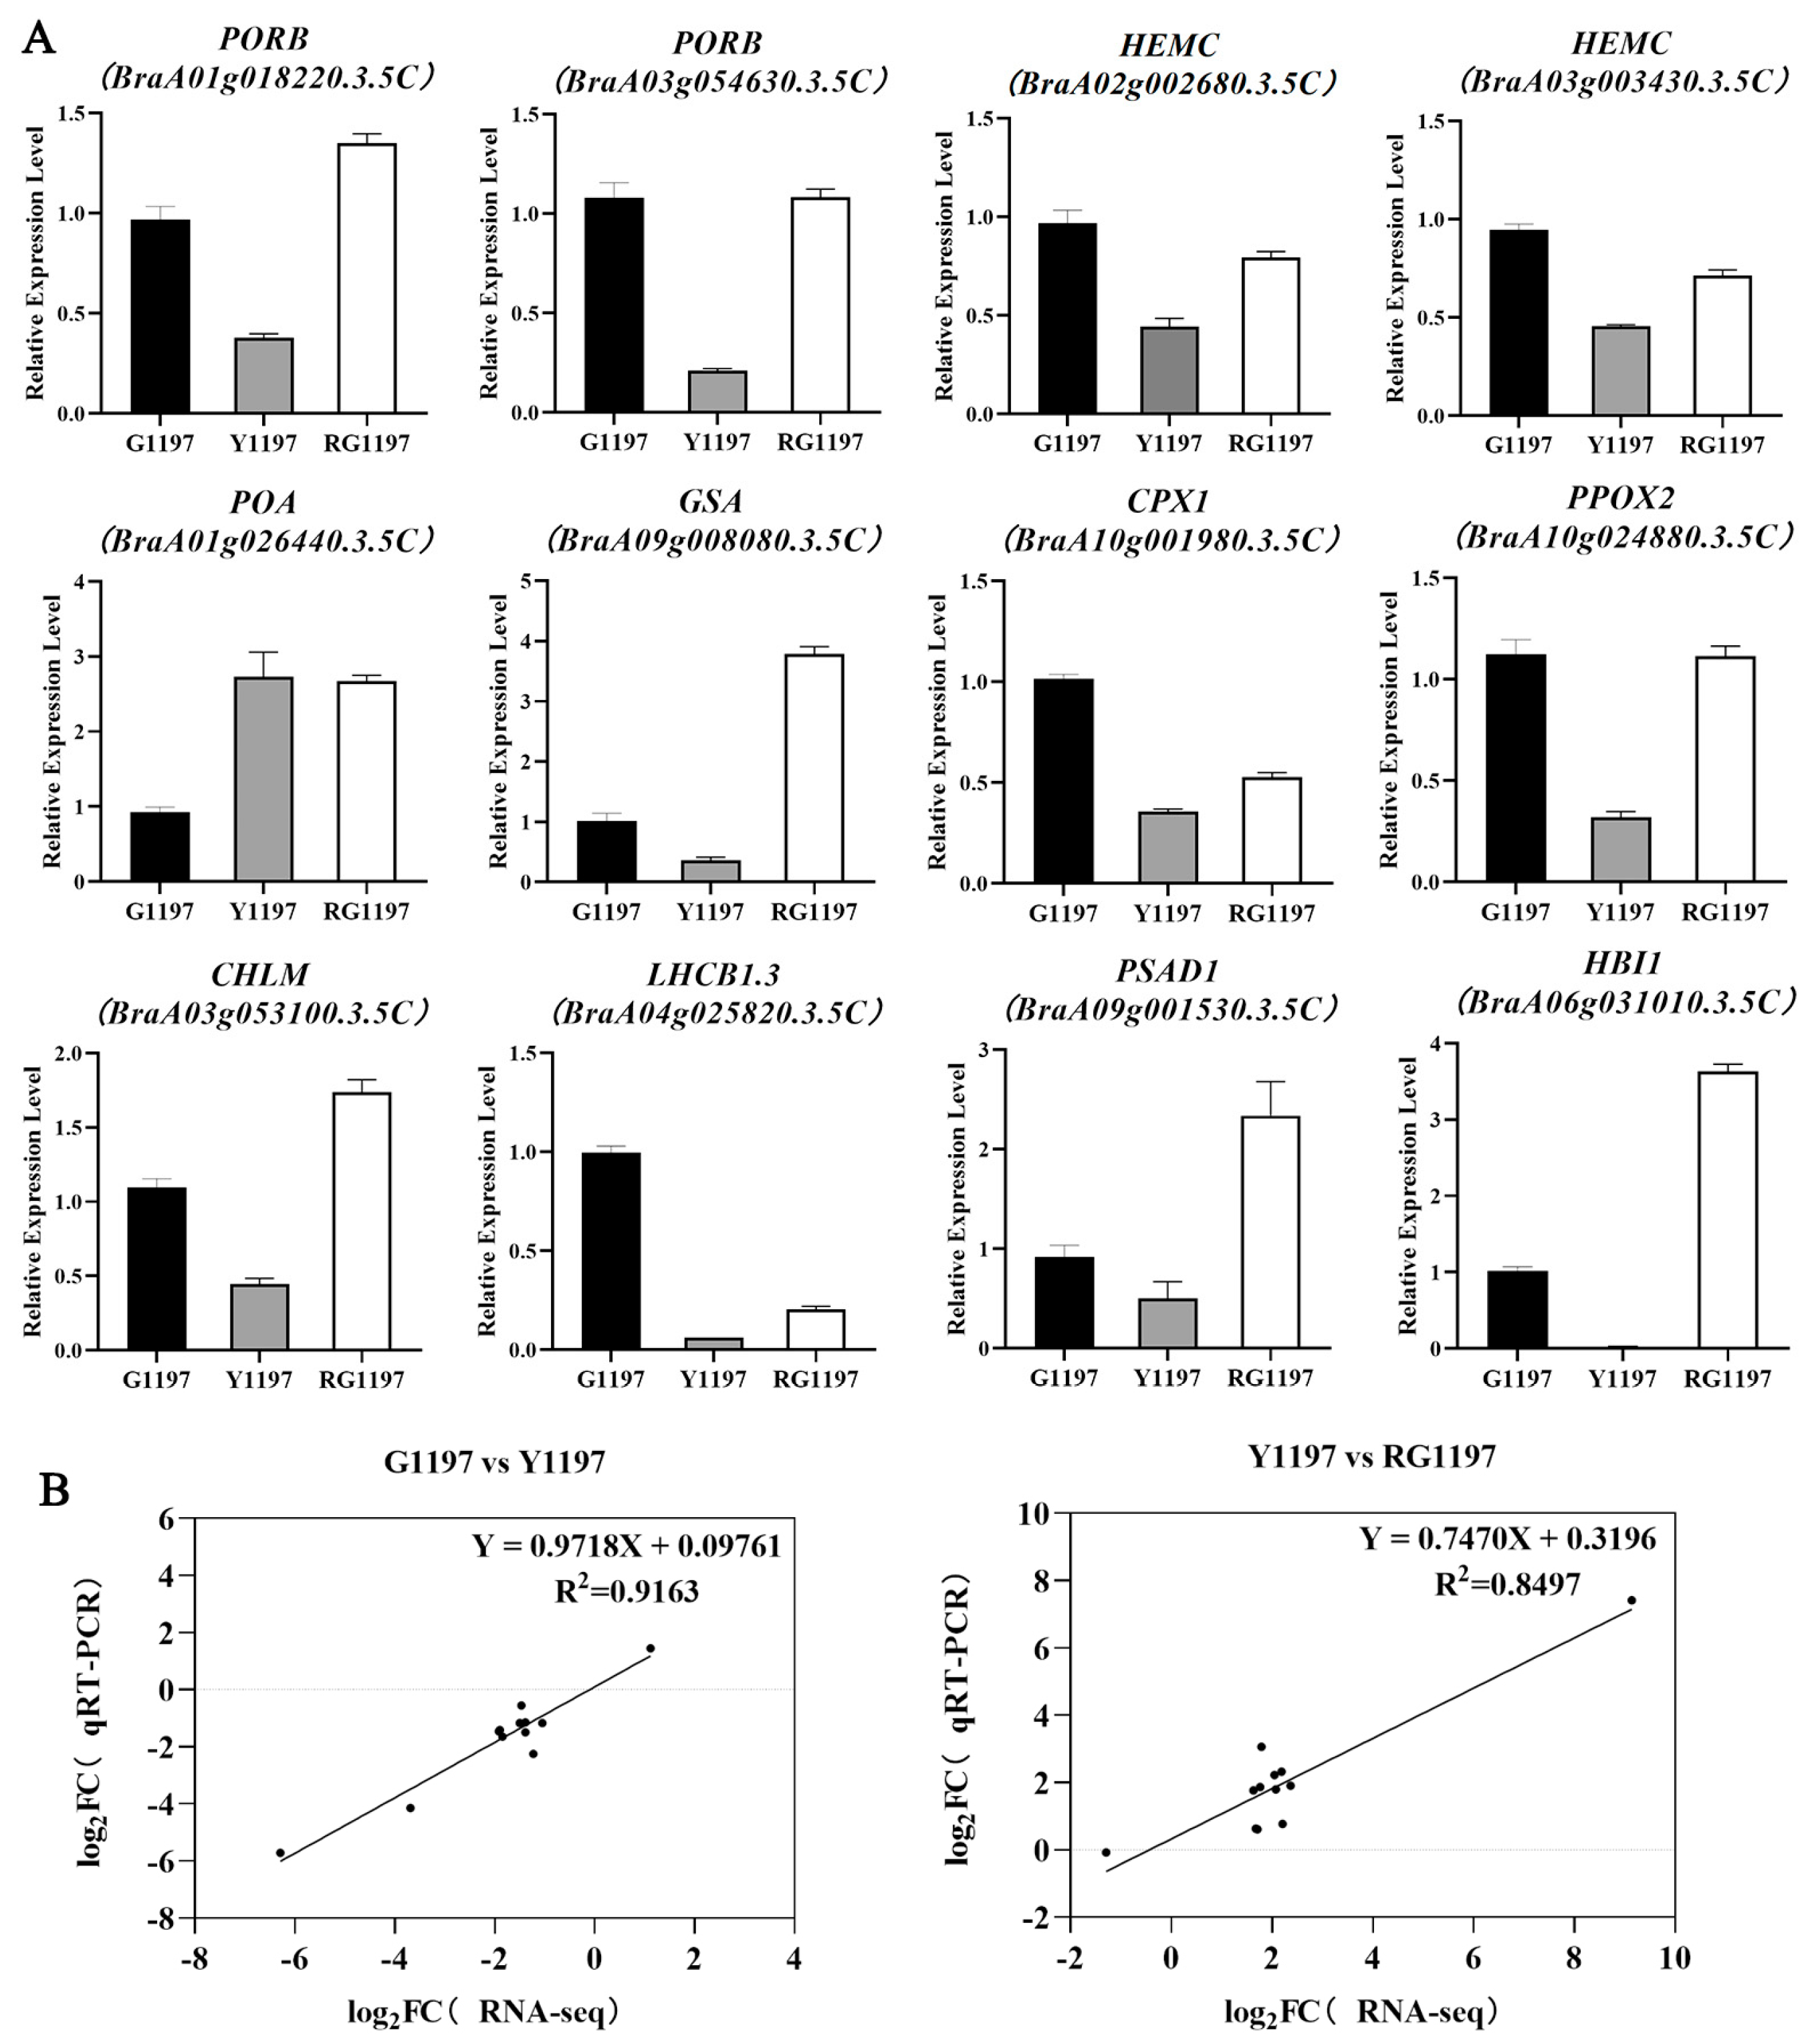
To validate the reliability of the RNA-seq results, 12 DEGs were selected for RT-qPCR analysis (Figure 8A). These genes included those involved in porphyrin metabolism (PORB, HEMC, PAO, GSA, CPX1, PPOX2, and CHLM), chloroplast function-related genes (LHCB1.3 and PSAD1), and a representative transcription factor (HBI1). The expression patterns obtained by RT-qPCR (calculated using the 2−ΔΔCt method) were highly consistent with the RNA-seq results, indicating strong agreement between the two datasets and supporting the reliability of the transcriptome analysis (Figure 8B).

3. Discussion

Previous studies in Brassica and other crops have mainly focused on mutants with stable leaf-color defects, such as the Chinese cabbage mutant pem [10] and the cabbage napus mutant cde1 [38]. In contrast, line 1197 displays a temperature-dependent and partially reversible phenotype, allowing the molecular events associated with both yellowing and regreening to be examined in the same line.
In this study, we used the low-temperature-sensitive pakchoi line 1197 as a model and integrated physiological measurements with transcriptome profiling under three temperature treatments. By staggering the sowing dates, all treatments were sampled at the same growing stage, minimizing growth variations between treatments. However, because the three phenotypic groups were established through staggered sowing and temperature treatments, potential batch effects or age-related influences cannot be completely excluded. Thus, although this design improved developmental comparability at sampling, it also represents a limitation of the present study.
Previously, mutants, including wheat SN288-2 [39], Chinese cabbage byl [40], and rice ygl18 [41], exhibited reduced chlorophyll accumulation due to defects in chlorophyll biosynthesis genes. In the degradation branch, NYC1 encodes chlorophyll b reductase, which catalyzes the conversion of chlorophyll b to chlorophyll a [42]. Stay green proteins (SGRs) interact specifically with light-harvesting complex II (LHCII) subunits of photosystem II [43,44], and loss-of-function mutations in SGR1 suppress chlorophyll breakdown and lead to a stay green phenotype, as reported in rice sgr [43], tomato cl [45], and alfalfa NF2089 [46].
In RG1197, CHLD, CHLM, and PORC displayed an overcompensatory expression pattern that promoted chlorophyll a synthesis and accumulation (Figure 5A). Meanwhile, downregulation of NYC1 limited chlorophyll b production in the chlorophyll cycle, and strong suppression of SGR1, SGR2, and PAO inhibited chlorophyll a degradation (Figure 5B). These transcriptional shifts explained why RG1197 leaves preferentially accumulated chlorophyll a and partially regained green pigmentation after transfer to normal temperature (Figure 1A,B). This pattern is broadly consistent with previous studies showing that low temperature disturbs chlorophyll metabolism by suppressing biosynthesis and promoting degradation. After transfer back to normal temperature, the partial recovery of leaf color was accompanied by the opposite trend, suggesting that chlorophyll metabolism responded dynamically to temperature change rather than remaining in a fixed defective state.
In Y1197, we observed abnormal chloroplast aggregation and disorganized thylakoid membranes (Figure 2F), consistent with the widespread downregulation of chloroplast function-related genes revealed by RNA-seq. Notably, LHCA5 and LHCA6, encoding PSI antenna proteins [47,48], displayed strong induction in RG1197, whereas most PSII-associated LHCB genes [49] showed a more limited increase in expression. Because PSI has been reported to be particularly vulnerable to photoinhibition under low temperature [50,51], we suggested that enhanced transcriptional recovery of PSI antenna components may compensate for PSI impairment, contributing to the restoration of chloroplast function.
Several TFs, including GLK2, HBI1, NAC047, and NAC029, were proposed as potential regulators mediating the temperature-dependent leaf-color change. However, the present evidence is based on transcript abundance. These TFs should be prioritized for future functional validation. Similarly, MSTRG.13081 is currently only a candidate transcript that showed homology to uroporphyrinogen decarboxylase 1. Because the current evidence is limited to sequence homology and expression context, MSTRG.13081 should be regarded as a candidate transcript potentially related to porphyrin metabolism rather than a validated regulator. Further functional characterization is required to determine its precise biological role. Overall, this research identified candidate genes and regulatory factors associated with temperature-dependent yellowing and regreening transitions. It also provides genetic resources and may support breeding Brassica leafy crops with improved stress tolerance and stable leaf color under winter cultivation conditions. However, because only one DH line, 1197, was examined, the present results mainly reflect the response of this line to low temperature. Further work in additional pakchoi genotypes or segregating populations will be needed to determine whether these transcriptional patterns are more broadly conserved.

4. Materials and Methods

4.1. Plant Materials

The plant material used in this study was a doubled haploid (DH) line (1197) derived from an isolated microspore culture of the F1 pakchoi cultivar ‘Liangpin Chun’. Field observations indicated that leaf color in this DH line is low-temperature-sensitive.

4.2. Plant Cultivation and Different Temperature Treatments

Pakchoi line 1197 was grown in an artificial climate chamber at the South Field Station, Institute of Vegetables and Flowers, CAAS (Beijing, China). All growth conditions were kept uniform across treatments, with plants maintained under a 10 h light/14 h dark photoperiod and a light intensity of 300 μmol·m−2·s−1. To generate distinct leaf-color phenotypes, three temperature treatments were applied:
G1197 (green leaves): plants grown under normal temperature (25 °C).
Y1197 (yellow leaves): plants grown under low temperature (4 °C).
RG1197 (regreened leaves): Y1197 plants transferred to the normal temperature for 7 days, resulting in partial regreening.
To ensure developmental consistency, a staggered sowing strategy was adopted, whereby G1197 was sown approximately two to four weeks later than Y1197. RG1197 was obtained by transferring a portion of the Y1197 plants to a room-temperature environment for seven days. Consequently, the seedlings in the three treatment groups exhibited consistent growth, allowing leaves at the same developmental stage to be harvested simultaneously from all three groups.

4.3. Determination of Photosynthetic Pigment Content in Leaves

At the ten-leaf stage, the sixth fully expanded leaf was harvested from G1197, Y1197, and RG1197, with three replicates taken for each treatment. Photosynthetic pigment contents were determined using the ethanol extraction method [7,52]. Leaf tissues were cut into small pieces. For each sample, 0.1 g of fresh tissue was weighed, immersed in 12 mL of 95% ethanol, and extracted in darkness at 4 °C for 24 h. Absorbance of the extracts was measured at 665, 649, and 470 nm. Pigment concentrations were calculated using standard equations. Statistical analyses were performed using GraphPad Prism 9. Each treatment included three biological replicates. Data were presented as the mean ± standard deviation (SD), and statistical significance was evaluated using one-way analysis of variance (ANOVA).

4.4. Chloroplast Ultrastructure Observation

For ultrastructural analysis, the third fully expanded true leaves of Y1197 and G1197 were collected at the five-leaf stage. Each treatment group was set up with three biological replicates. Leaf segments (1 mm × 2 mm) were vacuum-infiltrated and fixed overnight in 2.5% glutaraldehyde. After thorough rinsing, samples were post-fixed in 1% osmium tetroxide. Tissues were dehydrated through a graded ethanol series at room temperature, followed by stepwise infiltration and embedding in epoxy resin. Ultrathin sections were prepared using a Leica UC7 ultramicrotome (Leica Microsystems, Wetzlar, Germany), double-stained with 2% uranyl acetate (saturated in ethanol) and 2.6% lead citrate, and examined using a Hitachi HT7700 transmission electron microscope (Hitachi High-Tech Corporation, Tokyo, Japan) for image acquisition.

4.5. RNA Extraction, Library Construction and Sequencing

At the ten-leaf stage, the sixth fully expanded leaf was harvested from G1197, Y1197, and RG1197, with three replicates taken for each treatment. All tissues were immediately frozen in liquid nitrogen and stored at −80 °C. Total RNA was extracted using the Omega Plant RNA Kit (Omega, Beijing, China). RNA integrity was assessed using an Agilent 2100 Bioanalyzer (Agilent Technologies, Palo Alto, CA, USA). mRNA was then enriched and fragmented for double-stranded cDNA synthesis, followed by end repair and A-tailing. Target fragments were size-selected using Hieff NGS® DNA Selection Beads, and cDNA libraries were generated by PCR amplification. Sequencing was performed on the Illumina NovaSeq X Plus platform, with library preparation and sequencing services provided by Gidio Biotechnology (Guangzhou, China).

4.6. RNA-Seq Data Analysis

Raw reads were filtered using fastp (default parameters) [53] to obtain clean reads. Clean reads were aligned to the Chinese cabbage reference genome Brara Chiifu V3.5 (BRAD) using HISAT2 (default parameters) [54]. Transcripts were assembled with StringTie [55], and gene expression levels were quantified using RSEM, with results reported as FPKM values and raw read counts. Downstream analyses were performed using the Omicsmart platform. Principal component analysis (PCA) was conducted to assess sample relationships. Differentially expressed genes (DEGs) were identified using DESeq2, with thresholds of the fold changes (FCs) of RPKM (|log2 Fold Change|) > 1 and the false discovery rate (FDR) < 0.01. Gene annotation information was also obtained from the BRAD database (Brara Chiifu V3.5). Functional enrichment analyses of DEGs were performed using the GO and KEGG databases (https://www.geneontology.org/; https://www.kegg.jp/kegg/; accessed on 21 February 2026).

4.7. RT-qPCR Validation of Transcriptome Data

The cabbage Actin gene was used as an internal control. RT-qPCR was performed using 2× WenPro SYBR qPCR Mix (WEIERNUO, Beijing, China) on a CFX96 Touch Real-Time PCR Detection System (Bio-Rad Laboratories, Hercules, CA, USA). Each sample included three biological replicates and three technical replicates. Relative gene expression levels were calculated using the 2−ΔΔCt method [56] to validate the reliability of the RNA-seq data.

5. Conclusions

This study showed that low-temperature-induced yellowing and subsequent regreening in pakchoi line 1197 were associated with coordinated changes in chlorophyll metabolism, chloroplast structure, and photosynthesis-related pathways. Low temperature suppressed chlorophyll accumulation, disrupted chloroplast ultrastructure, and altered the expression of genes involved in porphyrin metabolism and photosynthetic function, whereas many of these changes were partly reversed after transfer back to normal temperature. These results provide a useful framework for understanding temperature-dependent leaf-color change in pakchoi and identify candidate genes for future functional studies. Further work will be needed to verify the functions of these candidate genes and to clarify their roles in the regulation of low-temperature-induced leaf-color change.

Supplementary Materials

The following supporting information can be downloaded at: https://www.mdpi.com/article/10.3390/horticulturae12040469/s1, Table S1: quality control of raw transcriptome data; Table S2: transcriptome data alignment statistics.

Author Contributions

Conceptualization, F.L., G.L. and R.S.; methodology, X.T., S.Z. (Shuya Zhang) and Y.D.; software, S.Z. (Shuya Zhang), Y.D. and Z.L.; validation, Z.L. and S.Z. (Shujiang Zhang); formal analysis, X.T.; investigation, S.Z. (Shujiang Zhang), S.Z. (Shifan Zhang) and H.Z.; resources, S.Z. (Shifan Zhang) and R.S.; data curation, X.T.; writing—original draft preparation, X.T.; writing—review and editing, F.L., G.L. and R.S.; visualization, X.T.; supervision, H.Z., G.L. and R.S.; project administration, X.T.; funding acquisition, F.L. and G.L. All authors have read and agreed to the published version of the manuscript.

Funding

This work was funded by the National Key Research and Development Program of China (2023YFD1200101); the Beijing Rural Revitalization Agricultural Science and Technology Project (NY2401140326); the China Agriculture Research System (CARS-23-A-14); and the Agricultural Science and Technology Innovation Program of the Chinese Academy of Agricultural Sciences (CAAS-ASTIP-IVFCAAS).

Data Availability Statement

The original data presented in the study are openly available in Genome Sequence Archive at https://ngdc.cncb.ac.cn/gsub/submit/gsa/list (accessed on 21 February 2026), reference number PRJCA058291.

Acknowledgments

This work was performed at the State Key Laboratory of Vegetable Biobreeding, Institute of Vegetables and Flowers, Chinese Academy of Agricultural Sciences, Beijing, China, and the Key Laboratory of Biology and Genetic Improvement of Horticultural Crops, Ministry of Agriculture, Beijing, China.

Conflicts of Interest

The authors declare that they have no conflicts of interest.

Abbreviations

The following abbreviations are used in this manuscript:
ANOVAAnalysis of variance
cDNAComplementary DNA
mRNAMessenger RNA
CtCycle threshold
DEGsDifferentially expressed genes
DHDoubled haploid
GOGene Ontology
KEGGKyoto Encyclopedia of Genes and Genomes
TFsTranscription factors
PCAPrincipal component analysis
PSIPhotosystem I
PSIIPhotosystem II
RT-qPCRReverse-transcription quantitative PCR

References

  1. Zhou, K.; Ren, Y.; Lv, J.; Wang, Y.; Liu, F.; Zhou, F.; Zhao, S.; Chen, S.; Peng, C.; Zhang, X.; et al. Young Leaf Chlorosis 1, a Chloroplast-Localized Gene Required for Chlorophyll and Lutein Accumulation during Early Leaf Development in Rice. Planta 2013, 237, 279–292. [Google Scholar] [CrossRef] [Scilit] [PubMed]
  2. Liu, C.; Zhu, H.; Xing, Y.; Tan, J.; Chen, X.; Zhang, J.; Peng, H.; Xie, Q.; Zhang, Z. Albino Leaf 2 Is Involved in the Splicing of Chloroplast Group I and II Introns in Rice. J. Exp. Bot. 2016, 67, 5339–5347. [Google Scholar] [CrossRef] [Scilit] [PubMed]
  3. Wu, H.; Shi, N.; An, X.; Liu, C.; Fu, H.; Cao, L.; Feng, Y.; Sun, D.; Zhang, L. Candidate Genes for Yellow Leaf Color in Common Wheat (Triticum aestivum L.) and Major Related Metabolic Pathways According to Transcriptome Profiling. Int. J. Mol. Sci. 2018, 19, 1594. [Google Scholar] [CrossRef] [Scilit]
  4. Wang, Z.; Xu, H.; Wang, F.; Sun, L.; Meng, X.; Li, Z.; Xie, C.; Jiang, H.; Ding, G.; Hu, X.; et al. EMS-Induced Missense Mutation in TaCHLI-7D Affects Leaf Color and Yield-Related Traits in Wheat. Theor. Appl. Genet. 2024, 137, 223. [Google Scholar] [CrossRef] [Scilit]
  5. Cheng, M.; Meng, F.; Mo, F.; Qi, H.; Wang, P.; Chen, X.; Liu, J.; Ghanizadeh, H.; Zhang, H.; Wang, A. Slym1 Control the Color Etiolation of Leaves by Facilitating the Decomposition of Chlorophyll in Tomato. Plant Sci. 2022, 324, 111457. [Google Scholar] [CrossRef] [Scilit]
  6. Hu, L.; Zhang, H.; Xie, C.; Wang, J.; Zhang, J.; Wang, H.; Weng, Y.; Chen, P.; Li, Y. A Mutation in CsHD Encoding a Histidine and Aspartic Acid Domain-Containing Protein Leads to Yellow Young Leaf-1 (Yyl-1) in Cucumber (Cucumis sativus L.). Plant Sci. 2020, 293, 110407. [Google Scholar] [CrossRef] [Scilit]
  7. Zha, G.; Yin, J.; Cheng, F.; Song, M.; Zhang, M.; Obel, H.O.; Wang, Y.; Chen, J.; Lou, Q. Fine Mapping of CscpFtsY, a Gene Conferring the Yellow Leaf Phenotype in Cucumber (Cucumis sativus L.). BMC Plant Biol. 2022, 22, 570. [Google Scholar] [CrossRef] [Scilit]
  8. Zhang, B.; Wu, Y.; Li, S.; Ren, W.; Yang, L.; Zhuang, M.; Lv, H.; Wang, Y.; Ji, J.; Hou, X.; et al. Chloroplast C-to-U Editing, Regulated by a PPR Protein BoYgl-2, Is Important for Chlorophyll Biosynthesis in Cabbage. Hortic. Res. 2024, 11, uhae006. [Google Scholar] [CrossRef] [Scilit] [PubMed]
  9. Tang, X.; Wang, Y.; Zhang, Y.; Huang, S.; Liu, Z.; Fei, D.; Feng, H. A Missense Mutation of Plastid RPS4 Is Associated with Chlorophyll Deficiency in Chinese Cabbage (Brassica campestris ssp. pekinensis). BMC Plant Biol. 2018, 18, 130. [Google Scholar] [CrossRef] [Scilit] [PubMed]
  10. Li, X.; Huang, S.; Liu, Z.; Hou, L.; Feng, H. Mutation in EMB1923 Gene Promoter Is Associated with Chlorophyll Deficiency in Chinese Cabbage (Brassica campestris ssp. pekinensis). Physiol. Plant. 2019, 166, 909–920. [Google Scholar] [CrossRef] [Scilit]
  11. Fu, W.; Ye, X.; Ren, J.; Li, Q.; Du, J.; Hou, A.; Mei, F.; Feng, H.; Liu, Z. Fine Mapping of Lcm1, a Gene Conferring Chlorophyll-Deficient Golden Leaf in Chinese Cabbage (Brassica rapa ssp. pekinensis). Mol. Breed. 2019, 39, 52. [Google Scholar] [CrossRef] [Scilit]
  12. Keskitalo, J.; Bergquist, G.; Gardeström, P.; Jansson, S. A Cellular Timetable of Autumn Senescence. Plant Physiol. 2005, 139, 1635–1648. [Google Scholar] [CrossRef] [Scilit]
  13. Chen, H.; Dong, H.; Shan, X.; Jiang, Y.; Li, S.; Liu, H.; Su, S.; Yuan, Y. Mutation in Maize Chloroplastic Polypeptide Chain Release Factor (ZmcpRF1) Affects Chloroplast Development and Leaf Color. Planta 2025, 262, 63. [Google Scholar] [CrossRef] [Scilit]
  14. Miao, H.; Zhang, S.; Wang, M.; Wang, Y.; Weng, Y.; Gu, X. Fine Mapping of Virescent Leaf Gene V-1 in Cucumber (Cucumis sativus L.). Int. J. Mol. Sci. 2016, 17, 1602. [Google Scholar] [CrossRef] [Scilit]
  15. Gong, X.; Su, Q.; Lin, D.; Jiang, Q.; Xu, J.; Zhang, J.; Teng, S.; Dong, Y. The Rice OsV4 Encoding a Novel Pentatricopeptide Repeat Protein Is Required for Chloroplast Development during the Early Leaf Stage under Cold Stress. J. Integr. Plant Biol. 2014, 56, 400–410. [Google Scholar] [CrossRef] [Scilit]
  16. Hancock, C.N.; Germany, T.; Redd, P.; Timmons, J.; Lipford, J.; Burns, S.; Cervantes-Perez, S.A.; Libault, M.; Shen, W.; An, Y.C.; et al. A Strategy for Identification and Characterization of Genic Mutations Using a Temperature-Sensitive Chlorotic Soybean Mutant as an Example. Plant Direct 2024, 8, e70011. [Google Scholar] [CrossRef] [Scilit]
  17. Feng, X.; Ma, Y.; Liang, Q.; Jin, Y.; Wang, X.; Wang, J.; Liu, F.; Zhang, X.; Shao, D.; Sun, J.; et al. Deletion of GhSCY2D Causes Impaired Chloroplast Development and Temperature-Dependent Leaf Yellowing in Cotton (Gossypium hirsutum L.). Plant Cell Environ. 2025, 48, 4902–4917. [Google Scholar] [CrossRef] [Scilit]
  18. Mirkovic, T.; Ostroumov, E.E.; Anna, J.M.; van Grondelle, R.; Govindjee; Scholes, G.D. Light Absorption and Energy Transfer in the Antenna Complexes of Photosynthetic Organisms. Chem. Rev. 2017, 117, 249–293. [Google Scholar] [CrossRef] [Scilit]
  19. Kang, Y.-R.; Park, J.; Jung, S.K.; Chang, Y.H. Synthesis, Characterization, and Functional Properties of Chlorophylls, Pheophytins, and Zn-Pheophytins. Food Chem. 2018, 245, 943–950. [Google Scholar] [CrossRef] [Scilit]
  20. Meskauskiene, R.; Nater, M.; Goslings, D.; Kessler, F.; op den Camp, R.; Apel, K. FLU: A Negative Regulator of Chlorophyll Biosynthesis in Arabidopsis thaliana. Proc. Natl. Acad. Sci. USA 2001, 98, 12826–12831. [Google Scholar] [CrossRef] [Scilit]
  21. Tanaka, R.; Tanaka, A. Tetrapyrrole Biosynthesis in Higher Plants. Annu. Rev. Plant Biol. 2007, 58, 321–346. [Google Scholar] [CrossRef] [Scilit]
  22. Tanaka, R.; Kobayashi, K.; Masuda, T. Tetrapyrrole Metabolism in Arabidopsis thaliana. Arab. Book 2011, 9, e0145. [Google Scholar] [CrossRef] [Scilit] [PubMed]
  23. Tanaka, R.; Tanaka, A. Chlorophyll Cycle Regulates the Construction and Destruction of the Light-Harvesting Complexes. Biochim. Biophys. Acta (BBA)—Bioenerg. 2011, 1807, 968–976. [Google Scholar] [CrossRef] [Scilit] [PubMed]
  24. Scheumann, V.; Schoch, S.; Rüdiger, W. Chlorophyll a Formation in the Chlorophyll b Reductase Reaction Requires Reduced Ferredoxin. J. Biol. Chem. 1998, 273, 35102–35108. [Google Scholar] [CrossRef] [Scilit]
  25. Pruzinská, A.; Tanner, G.; Anders, I.; Roca, M.; Hörtensteiner, S. Chlorophyll Breakdown: Pheophorbide a Oxygenase Is a Rieske-Type Iron-Sulfur Protein, Encoded by the Accelerated Cell Death 1 Gene. Proc. Natl. Acad. Sci. USA 2003, 100, 15259–15264. [Google Scholar] [CrossRef] [Scilit]
  26. Harpaz-Saad, S.; Azoulay, T.; Arazi, T.; Ben-Yaakov, E.; Mett, A.; Shiboleth, Y.M.; Hörtensteiner, S.; Gidoni, D.; Gal-On, A.; Goldschmidt, E.E.; et al. Chlorophyllase Is a Rate-Limiting Enzyme in Chlorophyll Catabolism and Is Posttranslationally Regulated. Plant Cell 2007, 19, 1007–1022. [Google Scholar] [CrossRef] [Scilit]
  27. Christ, B.; Hörtensteiner, S. Mechanism and Significance of Chlorophyll Breakdown. J. Plant Growth Regul. 2014, 33, 4–20. [Google Scholar] [CrossRef] [Scilit]
  28. Kratsch, H.; Wise, R. The Ultrastructure of Chilling Stress. Plant Cell Environ. 2000, 23, 337–350. [Google Scholar] [CrossRef] [Scilit]
  29. Kusumi, K.; Iba, K. Establishment of the Chloroplast Genetic System in Rice during Early Leaf Development and at Low Temperatures. Front. Plant Sci. 2014, 5, 386. [Google Scholar] [CrossRef] [Scilit]
  30. Yang, C.; Liu, M.; Du, S.; Zhang, D.; Li, X.; Wu, L.; Shi, Y.; Fang, B.; Yan, G.; Wei, F. Photosynthetic Electron Transport in Winter Wheat: Responses to Low-Temperature and Weak-Light Condition. Cells 2025, 14, 1275. [Google Scholar] [CrossRef] [Scilit]
  31. Johnson, M.P. Structure, Regulation and Assembly of the Photosynthetic Electron Transport Chain. Nat. Rev. Mol. Cell Biol. 2025, 26, 667–690. [Google Scholar] [CrossRef] [Scilit]
  32. Wang, P.; Grimm, B. Organization of Chlorophyll Biosynthesis and Insertion of Chlorophyll into the Chlorophyll-Binding Proteins in Chloroplasts. Photosynth. Res. 2015, 126, 189–202. [Google Scholar] [CrossRef] [Scilit]
  33. Sandmann, G. Diversity and Origin of Carotenoid Biosynthesis: Its History of Coevolution towards Plant Photosynthesis. New Phytol. 2021, 232, 479–493. [Google Scholar] [CrossRef] [Scilit]
  34. Wang, S.; Li, L.; Xu, P.; Lian, H.; Wang, W.; Xu, F.; Mao, Z.; Zhang, T.; Yang, H. CRY1 Interacts Directly with HBI1 to Regulate Its Transcriptional Activity and Photomorphogenesis in Arabidopsis. J. Exp. Bot. 2018, 69, 3867–3881. [Google Scholar] [CrossRef] [Scilit] [PubMed]
  35. Cortleven, A.; Schmülling, T. Regulation of Chloroplast Development and Function by Cytokinin. J. Exp. Bot. 2015, 66, 4999–5013. [Google Scholar] [CrossRef] [Scilit]
  36. Wei, Y.; Yang, H.; Wang, Y.; Shen, H.; Zhang, S.; Yang, Z.; Yuan, L.; Wang, X. PGA37 Overexpression Promotes Chloroplast Development in Arabidopsis Roots Through Direct Transcriptional Activation of GLK2, ARR13, and ARR21. Plants 2025, 14, 1270. [Google Scholar] [CrossRef] [Scilit]
  37. Li, X.-D.; Zhuang, K.-Y.; Liu, Z.-M.; Yang, D.-Y.; Ma, N.-N.; Meng, Q.-W. Overexpression of a Novel NAC-Type Tomato Transcription Factor, SlNAM1, Enhances the Chilling Stress Tolerance of Transgenic Tobacco. J. Plant Physiol. 2016, 204, 54–65. [Google Scholar] [CrossRef] [Scilit] [PubMed]
  38. Yang, M.; Wan, S.; Chen, J.; Chen, W.; Wang, Y.; Li, W.; Wang, M.; Guan, R. Mutation to a Cytochrome P450-like Gene Alters the Leaf Color by Affecting the Heme and Chlorophyll Biosynthesis Pathways in Brassica napus. Plant J. 2023, 116, 432–445. [Google Scholar] [CrossRef] [Scilit]
  39. Qi, F.; Xing, P.; Sun, Y.; Bao, Y.; Wang, H.; Li, X. Deletion of the Gene Encoding the Magnesium Chelatase I Subunit Resulted in a Novel Wheat Leaf Colour Mutant. Plant Biotechnol. J. 2025, 23, 4290–4301. [Google Scholar] [CrossRef] [Scilit]
  40. Liu, C.; Chai, Y.; Tan, C.; Shi, F.; Zhang, Y.; Liu, Z. Brchli1 Mutation Induces Bright Yellow Leaves by Disrupting Magnesium Chelatase I Subunit Function in Chinese Cabbage (Brassica rapa L. ssp. pekinensis). Front. Plant Sci. 2024, 15, 1450242. [Google Scholar] [CrossRef] [Scilit]
  41. Wang, Z.; Hong, X.; Hu, K.; Wang, Y.; Wang, X.; Du, S.; Li, Y.; Hu, D.; Cheng, K.; An, B.; et al. Impaired Magnesium Protoporphyrin IX Methyltransferase (ChlM) Impedes Chlorophyll Synthesis and Plant Growth in Rice. Front. Plant Sci. 2017, 8, 1694. [Google Scholar] [CrossRef] [Scilit]
  42. Sato, Y.; Morita, R.; Katsuma, S.; Nishimura, M.; Tanaka, A.; Kusaba, M. Two Short-Chain Dehydrogenase/Reductases, NON-YELLOW COLORING 1 and NYC1-LIKE, Are Required for Chlorophyll b and Light-Harvesting Complex II Degradation during Senescence in Rice. Plant J. 2009, 57, 120–131. [Google Scholar] [CrossRef] [Scilit]
  43. Park, S.-Y.; Yu, J.-W.; Park, J.-S.; Li, J.; Yoo, S.-C.; Lee, N.-Y.; Lee, S.-K.; Jeong, S.-W.; Seo, H.S.; Koh, H.-J.; et al. The Senescence-Induced Staygreen Protein Regulates Chlorophyll Degradation. Plant Cell 2007, 19, 1649–1664. [Google Scholar] [CrossRef] [Scilit] [PubMed]
  44. Sakuraba, Y.; Schelbert, S.; Park, S.-Y.; Han, S.-H.; Lee, B.-D.; Andrès, C.B.; Kessler, F.; Hörtensteiner, S.; Paek, N.-C. STAY-GREEN and Chlorophyll Catabolic Enzymes Interact at Light-Harvesting Complex II for Chlorophyll Detoxification during Leaf Senescence in Arabidopsis. Plant Cell 2012, 24, 507–518. [Google Scholar] [CrossRef] [Scilit] [PubMed]
  45. Barry, C.S.; McQuinn, R.P.; Chung, M.-Y.; Besuden, A.; Giovannoni, J.J. Amino Acid Substitutions in Homologs of the STAY-GREEN Protein Are Responsible for the Green-Flesh and Chlorophyll Retainer Mutations of Tomato and Pepper. Plant Physiol. 2008, 147, 179–187. [Google Scholar] [CrossRef] [Scilit] [PubMed]
  46. Zhou, C.; Han, L.; Pislariu, C.; Nakashima, J.; Fu, C.; Jiang, Q.; Quan, L.; Blancaflor, E.B.; Tang, Y.; Bouton, J.H.; et al. From Model to Crop: Functional Analysis of a STAY-GREEN Gene in the Model Legume Medicago truncatula and Effective Use of the Gene for Alfalfa Improvement. Plant Physiol. 2011, 157, 1483–1496. [Google Scholar] [CrossRef] [Scilit]
  47. Storf, S.; Jansson, S.; Schmid, V.H.R. Pigment Binding, Fluorescence Properties, and Oligomerization Behavior of Lhca5, a Novel Light-Harvesting Protein. J. Biol. Chem. 2005, 280, 5163–5168. [Google Scholar] [CrossRef] [Scilit]
  48. Lucinski, R.; Schmid, V.H.R.; Jansson, S.; Klimmek, F. Lhca5 Interaction with Plant Photosystem I. FEBS Lett. 2006, 580, 6485–6488. [Google Scholar] [CrossRef] [Scilit]
  49. Liu, R.; Xu, Y.-H.; Jiang, S.-C.; Lu, K.; Lu, Y.-F.; Feng, X.-J.; Wu, Z.; Liang, S.; Yu, Y.-T.; Wang, X.-F.; et al. Light-Harvesting Chlorophyll a/b-Binding Proteins, Positively Involved in Abscisic Acid Signalling, Require a Transcription Repressor, WRKY40, to Balance Their Function. J. Exp. Bot. 2013, 64, 5443–5456. [Google Scholar] [CrossRef] [Scilit]
  50. Terashima, I.; Funayama, S.; Sonoike, K. The Site of Photoinhibition in Leaves of Cucumis sativus L. at Low Temperatures Is Photosystem I, Not Photosystem II. Planta 1994, 193, 300–306. [Google Scholar] [CrossRef] [Scilit]
  51. Tjus, S.E.; Møller, B.L.; Scheller, H.V. Photosystem I Is an Early Target of Photoinhibition in Barley Illuminated at Chilling Temperatures. Plant Physiol. 1998, 116, 755–764. [Google Scholar] [CrossRef] [Scilit]
  52. Lichtenthaler, H.K.; Buschmann, C. Chlorophylls and Carotenoids: Measurement and Characterization by UV-VIS Spectroscopy. Curr. Protoc. Food Anal. Chem. 2001, 1, F4.3.1–F4.3.8. [Google Scholar] [CrossRef] [Scilit]
  53. Chen, S.; Zhou, Y.; Chen, Y.; Gu, J. Fastp: An Ultra-Fast All-in-One FASTQ Preprocessor. Bioinformatics 2018, 34, i884–i890. [Google Scholar] [CrossRef] [Scilit] [PubMed]
  54. Kim, D.; Langmead, B.; Salzberg, S.L. HISAT: A Fast Spliced Aligner with Low Memory Requirements. Nat. Methods 2015, 12, 357–360. [Google Scholar] [CrossRef] [Scilit] [PubMed]
  55. Pertea, M.; Pertea, G.M.; Antonescu, C.M.; Chang, T.-C.; Mendell, J.T.; Salzberg, S.L. StringTie Enables Improved Reconstruction of a Transcriptome from RNA-Seq Reads. Nat. Biotechnol. 2015, 33, 290–295. [Google Scholar] [CrossRef] [Scilit]
  56. Livak, K.J.; Schmittgen, T.D. Analysis of Relative Gene Expression Data Using Real-Time Quantitative PCR and the 2−ΔΔCT Method. Methods 2001, 25, 402–408. [Google Scholar] [CrossRef] [Scilit] [PubMed]
Figure 1. Leaf-color phenotypes and photosynthetic pigment content of pakchoi line 1197 under different temperature treatments. (A) Leaf−color phenotypes of G1197, Y1197, and RG1197. (BF) Chlorophyll a, chlorophyll b, total chlorophyll, chlorophyll a/b ratio and carotenoid content in the sixth true leaves of G1197, Y1197, and RG1197. Statistical significance was determined by one-way ANOVA. ns, p > 0.05; **, p < 0.01; ***, p < 0.001; ****, p < 0.0001.
Horticulturae 12 00469 g001
Figure 2. Comparison of chloroplast ultrastructure between G1197 and Y1197. (AC) Transmission electron micrographs of chloroplasts in G1197 at increasing magnifications. (DF) Transmission electron micrographs of chloroplasts in Y1197 at increasing magnifications. Scale bars: (A,D) 20 μm; (B,E) 10 μm; (C,F) 2 μm. Chl, chloroplast; Sg, starch grain; Gt, grana thylakoid; St, stroma thylakoid; Og, osmophilic globule; Cw, cell wall. Dash frames indicated regions that were shown enlarged in the figure.
Horticulturae 12 00469 g002
Figure 3. Transcriptome analysis of leaves from Y1197, G1197, and RG1197. (A) PCA based on global gene expression profiles, showing intra−group reproducibility and inter−group separation. (B) Hierarchical clustering heatmap of the 3058 core DEGs. (C) Numbers of upregulated and downregulated DEGs in each pairwise comparison. (D) Venn diagram showing overlap of DEGs among comparisons. The 3058 genes shared by both Y1197 vs. G1197 and Y1197 vs. RG1197 were defined as core DEGs.
Horticulturae 12 00469 g003
Figure 4. GO and KEGG enrichment analyses of the 3058 core DEGs. (A) Top 15 significantly enriched GO terms. (B) Top 15 significantly enriched KEGG pathways. Each bubble represented a GO term or KEGG pathway. The y-axis indicated the term/pathway name, and the x-axis indicated the gene ratio (number of DEGs mapped to the term/pathway divided by the total number of genes annotated to that term/pathway). Bubble size corresponded to the number of DEGs, and bubble color reflected the significance of enrichment. The red frames highlighted the key pathways.
Horticulturae 12 00469 g004
Figure 5. Expression profiles of 19 key genes involved in porphyrin metabolism during leaf yellowing and regreening. (A) Schematic diagram of chlorophyll biosynthesis with expression changes in related DEGs. (B) Schematic diagram of chlorophyll degradation with expression changes in related DEGs. (C) Z-score-normalized heatmap showing expression patterns of the 19 chlorophyll metabolism-related DEGs. Columns represent samples, and color intensity indicates relative expression levels. The red frames highlighted the key metabolites in the pathway.
Horticulturae 12 00469 g005
Figure 6. Expression patterns of photosynthesis-related genes during leaf yellowing and regreening. (A) Heatmap showing expression profiles of 24 DEGs enriched in the photosynthesis−antenna proteins pathway (ko00196). (B) Heatmap showing expression profiles of 37 DEGs enriched in the photosynthesis pathway (ko00195). Gene IDs and corresponding symbols were shown on the right. Color intensity indicated the relative expression level.
Horticulturae 12 00469 g006
Figure 7. Analysis of differentially expressed transcription factors. (A) Distribution of differentially expressed TFs among the 3058 core DEGs. The bar chart shows the top 25 TF families ranked by the number of DEGs. (B) Expression levels (FPKM) of selected TFs (HBI1, GLK2, NAC047, and NAC029) across the three phenotypic groups.
Horticulturae 12 00469 g007
Figure 8. RT-qPCR validation of RNA-seq data. (A) Relative expression levels of 12 selected DEGs determined by RT−qPCR. (B) Correlation analysis between log2 fold changes obtained from RT−qPCR and RNA−seq. G1197 vs. Y1197: R2 = 0.9163, p < 0.0001; Y1197 vs. RG1197: R2 = 0.8497, p < 0.0001.
Horticulturae 12 00469 g008
Disclaimer/Publisher’s Note: The statements, opinions and data contained in all publications are solely those of the individual author(s) and contributor(s) and not of MDPI and/or the editor(s). MDPI and/or the editor(s) disclaim responsibility for any injury to people or property resulting from any ideas, methods, instructions or products referred to in the content.