Article

Hybridization Efficiency and Genetic Diversity in Cut Chrysanthemum: Integration of Morphological and iPBS Marker Analysis

1
Ataturk Health Services Vocational School, Afyonkarahisar Health Sciences University, 03030 Afyonkarahisar, Türkiye
2
Department of Horticulture, Faculty of Agriculture, Ankara University, 06135 Ankara, Türkiye
3
Department of Horticulture, Faculty of Agriculture, Bingol University, 12000 Bingol, Türkiye
4
Department of Horticulture, Faculty of Agriculture, Erciyes University, 38030 Kayseri, Türkiye
*
Author to whom correspondence should be addressed.
Horticulturae 2025, 11(9), 1101; https://doi.org/10.3390/horticulturae11091101
Submission received: 25 July 2025 / Revised: 4 September 2025 / Accepted: 9 September 2025 / Published: 11 September 2025

Abstract

The increasing demand for novel cut chrysanthemum cultivars has underscored the significance of precision breeding techniques, with particular emphasis on hybridization and molecular tools. This study aimed to assess the cross-compatibility of selected chrysanthemum cultivars and to evaluate the genetic, quantitative, and qualitative diversity among the resulting F1 progenies. A total of six hybrid combinations were generated using five commercial parental cultivars. Ploidy levels were determined via flow cytometry and chromosome counting, confirming that all parents were allohexaploid (2n = 6x = 54). Pollen viability and germination rates varied significantly among male parents, influencing hybridization success. A total of 30,391 seeds were obtained, with germination rates ranging from 2.69% to 10.73%, depending on the cross combination. F1 progenies showed considerable phenotypic variability in flowering time, flower stalk length, flower diameter, and branch weight. Molecular characterization using eight iPBS primers revealed a high polymorphism rate (93%) with a mean Polymorphism Information Content (PIC) value of 0.614, confirming substantial genetic diversity among genotypes. Cluster and principal coordinate analyses demonstrated that most F1 genotypes grouped closely with their maternal parents, although unique genomic variations were also detected. The integration of morphological and molecular data provides valuable insights for selecting superior genotypes and optimizing breeding strategies. This study highlights the importance of evaluating hybridization potential and genetic diversity in the development of commercially viable cut chrysanthemum cultivars.

1. Introduction

Chrysanthemums are one of the most popular ornamental flowers globally, with a wide range of cultivars exhibiting diverse morphological and agronomic characteristics [1]. It is widely recognized by titles such as “Guldaudi,” “Queen of the East,” and “Glory of the East” [2]. It comes second after roses in the commercial flower sector [3]. The share of fresh-cut chrysanthemum exports in the EU countries is 14.7 million EUR [4]. Assessing cut chrysanthemum varieties’ genetic diversity and crossability is crucial for developing superior hybrids with improved traits [1,5]. Genetic resources are essential for all plant breeding initiatives [6].
The growing demand for novel chrysanthemum cultivars has underscored the importance of precision breeding strategies. Contemporary breeding objectives encompass a range of traits, including fragrance, dwarf growth habit, pest resistance, extended flowering duration, tolerance to temperature extremes, floral morphology, and flowering time [7,8]. However, these agronomically important traits in chrysanthemum are predominantly governed by polygenic inheritance and are substantially influenced by environmental conditions [9]. In this context, interspecific and intraspecific hybridization remain pivotal breeding methods, enabling the combination of desirable traits from genetically diverse parents to create superior genotypes. The success of hybridization-based breeding is highly dependent on cross-compatibility (hybridizability) between parental lines, which determines the feasibility of obtaining viable and fertile offspring. Therefore, assessing the hybridization potential of candidate parents is essential for ensuring effective gene transfer and maximizing breeding efficiency.
Increasing the genetic variability among progenies can be effectively achieved by selecting genetically divergent parental lines originating from distinct genetic clusters, which represents a strategic approach in the design of hybridization programs [10]. Accordingly, the integration of genetic data with phenotypic evaluations is essential. DNA-based molecular marker technologies serve as effective tools for assessing genetic diversity independently of environmental effects. PCR-based marker systems function by amplifying specific DNA regions flanked by primer-binding sites, which are tailored to the target species or cultivar, thereby facilitating the characterization of individual genotypes. Several molecular marker techniques have been employed to evaluate genetic diversity among chrysanthemum accessions, including Simple Sequence Repeats (SSR) [11,12,13], Random Amplified Polymorphic DNA (RAPD) [14,15,16], Sequence-Related Amplified Polymorphism (SRAP) [17], and inter-Primer Binding Site (iPBS) markers [18]. Among these, the iPBS marker system, which is based on retrotransposon-derived primer-binding sites, has gained prominence due to its reliability in revealing genomic variation [19]. This technique exploits the ubiquitous distribution and structural conservation of retrotransposons, as well as their role in genome reorganization [20]. In the present study, emphasis was placed on the necessity of integrating molecular marker technologies with morphological evaluations to enhance the efficiency of chrysanthemum breeding programs. Such an approach not only facilitates the accurate assessment of genetic diversity but also supports the identification of promising parental lines for hybridization. Therefore, evaluating both cross-compatibility and genetic variability in cultivated chrysanthemum is expected to provide a strong basis for the development of superior commercial cultivars with improved ornamental and agronomic traits.
The objective of this study was to evaluate the hybridization potential (crossability) of various cut chrysanthemum cultivars and to characterize the genetic diversity and phenotypic performance of their F1 progenies through the integration of molecular marker analysis and morphological trait assessment.

2. Materials and Methods

2.1. Plant Material

Hybridization research was performed in the contemporary chrysanthemum breeding greenhouse at the Department of Horticulture, Faculty of Agriculture, Ankara University. Ploidy level and chromosomal number analysis of chrysanthemum genotypes were conducted at the Plant Genetics and Cytogenetics Laboratory of Namık Kemal University, while molecular analyses were executed at Erciyes University from 2021 to 2024. In the study, two chrysanthemum varieties with spray-type single-layer flowers were used as the maternal parent (Together and Stylist Pink Dark), and three chrysanthemum varieties with spray-type single-layer flowers were used as the paternal parent (Barolo, Chic, Raisa Dark). Some qualitative and quantitative traits of parents were given in Table 1. Two chrysanthemum cultivars (Together and Stylist Pink Dark) were selected as maternal parents owing to their favorable morphological traits, commercial relevance, and established compatibility with the chosen paternal lines. Moreover, preliminary trials demonstrated that these cultivars performed more efficiently as maternal parents compared to other tested genotypes, thereby increasing the probability of obtaining viable and genetically diverse F1 progenies. For the paternal parents, cultivars with satisfactory pollen viability and germination performance were selected to ensure adequate fertility and maximize the efficiency of hybridization.

2.2. Method

2.2.1. Ploidy Levels, Pollen Viability and Germination

The ploidy levels were determined using a CyFlow Space flow cytometer device (Partec, Münster, Germany), and the results were validated through the classical method of chromosome counting. In the flow cytometry analysis, the nuclear DNA content of the plants was first measured. Subsequently, the chromosomes of one plant with a distinct DNA content were counted to establish a correlation between DNA content, chromosome number, and ploidy level. In nuclear DNA analyses, a Barley plant with 10.65 pg nuclear DNA content was used as a standard. PI ready kits (CyStain PI Precise P) from the PARTEC (Münster, Germany) company were used in the analyses, and the protocol of the manufacturer was followed [21].
Prior to hybridization, the male parental lines were evaluated for pollen viability and in vitro germination capacity. Pollen grains were collected during the full anthesis stage, at the time of anther dehiscence and maximum pollen release. Using a fine samur brush, the pollen was carefully transferred into sterile Petri dishes and subsequently transported to the laboratory for analysis. The pollen viability was examined using the TTC (2,3,5 Triphenyl Tetrazolium Chloride) test (1% solution of 10 mL TTC and 5.4 g of saccharose) [22,23,24]. Pollen grains were spread on a drop of the solution on a coverslip. Four replicates and five randomly chosen fields were counted with a light microscope (×100). In vitro pollen germination of the cultivars was assessed using the hanging drop method. The modified liquid monnier medium, ME3 + 20% PEG 4000 medium, was prepared, and a drop was placed on a hollow slide [24,25]. Pollen was sprinkled on the drop with a sable brush. The pollen-sprinkled slides were placed in Petri dishes. Then Petri dishes were kept in a climate cabinet at 20 °C and 60% humidity for 24 h. At the end of 24 h, they were counted under a microscope. Pollen grains were screened on each slide under 40× and 100× microscope magnification (Leica DM1000, Wetzlar, Germany), and pollen tubes longer than 1.5 times the pollen diameter were evaluated for germination [24,25]. Four replicates were performed for each of the three pollen parents.

2.2.2. Hybridization

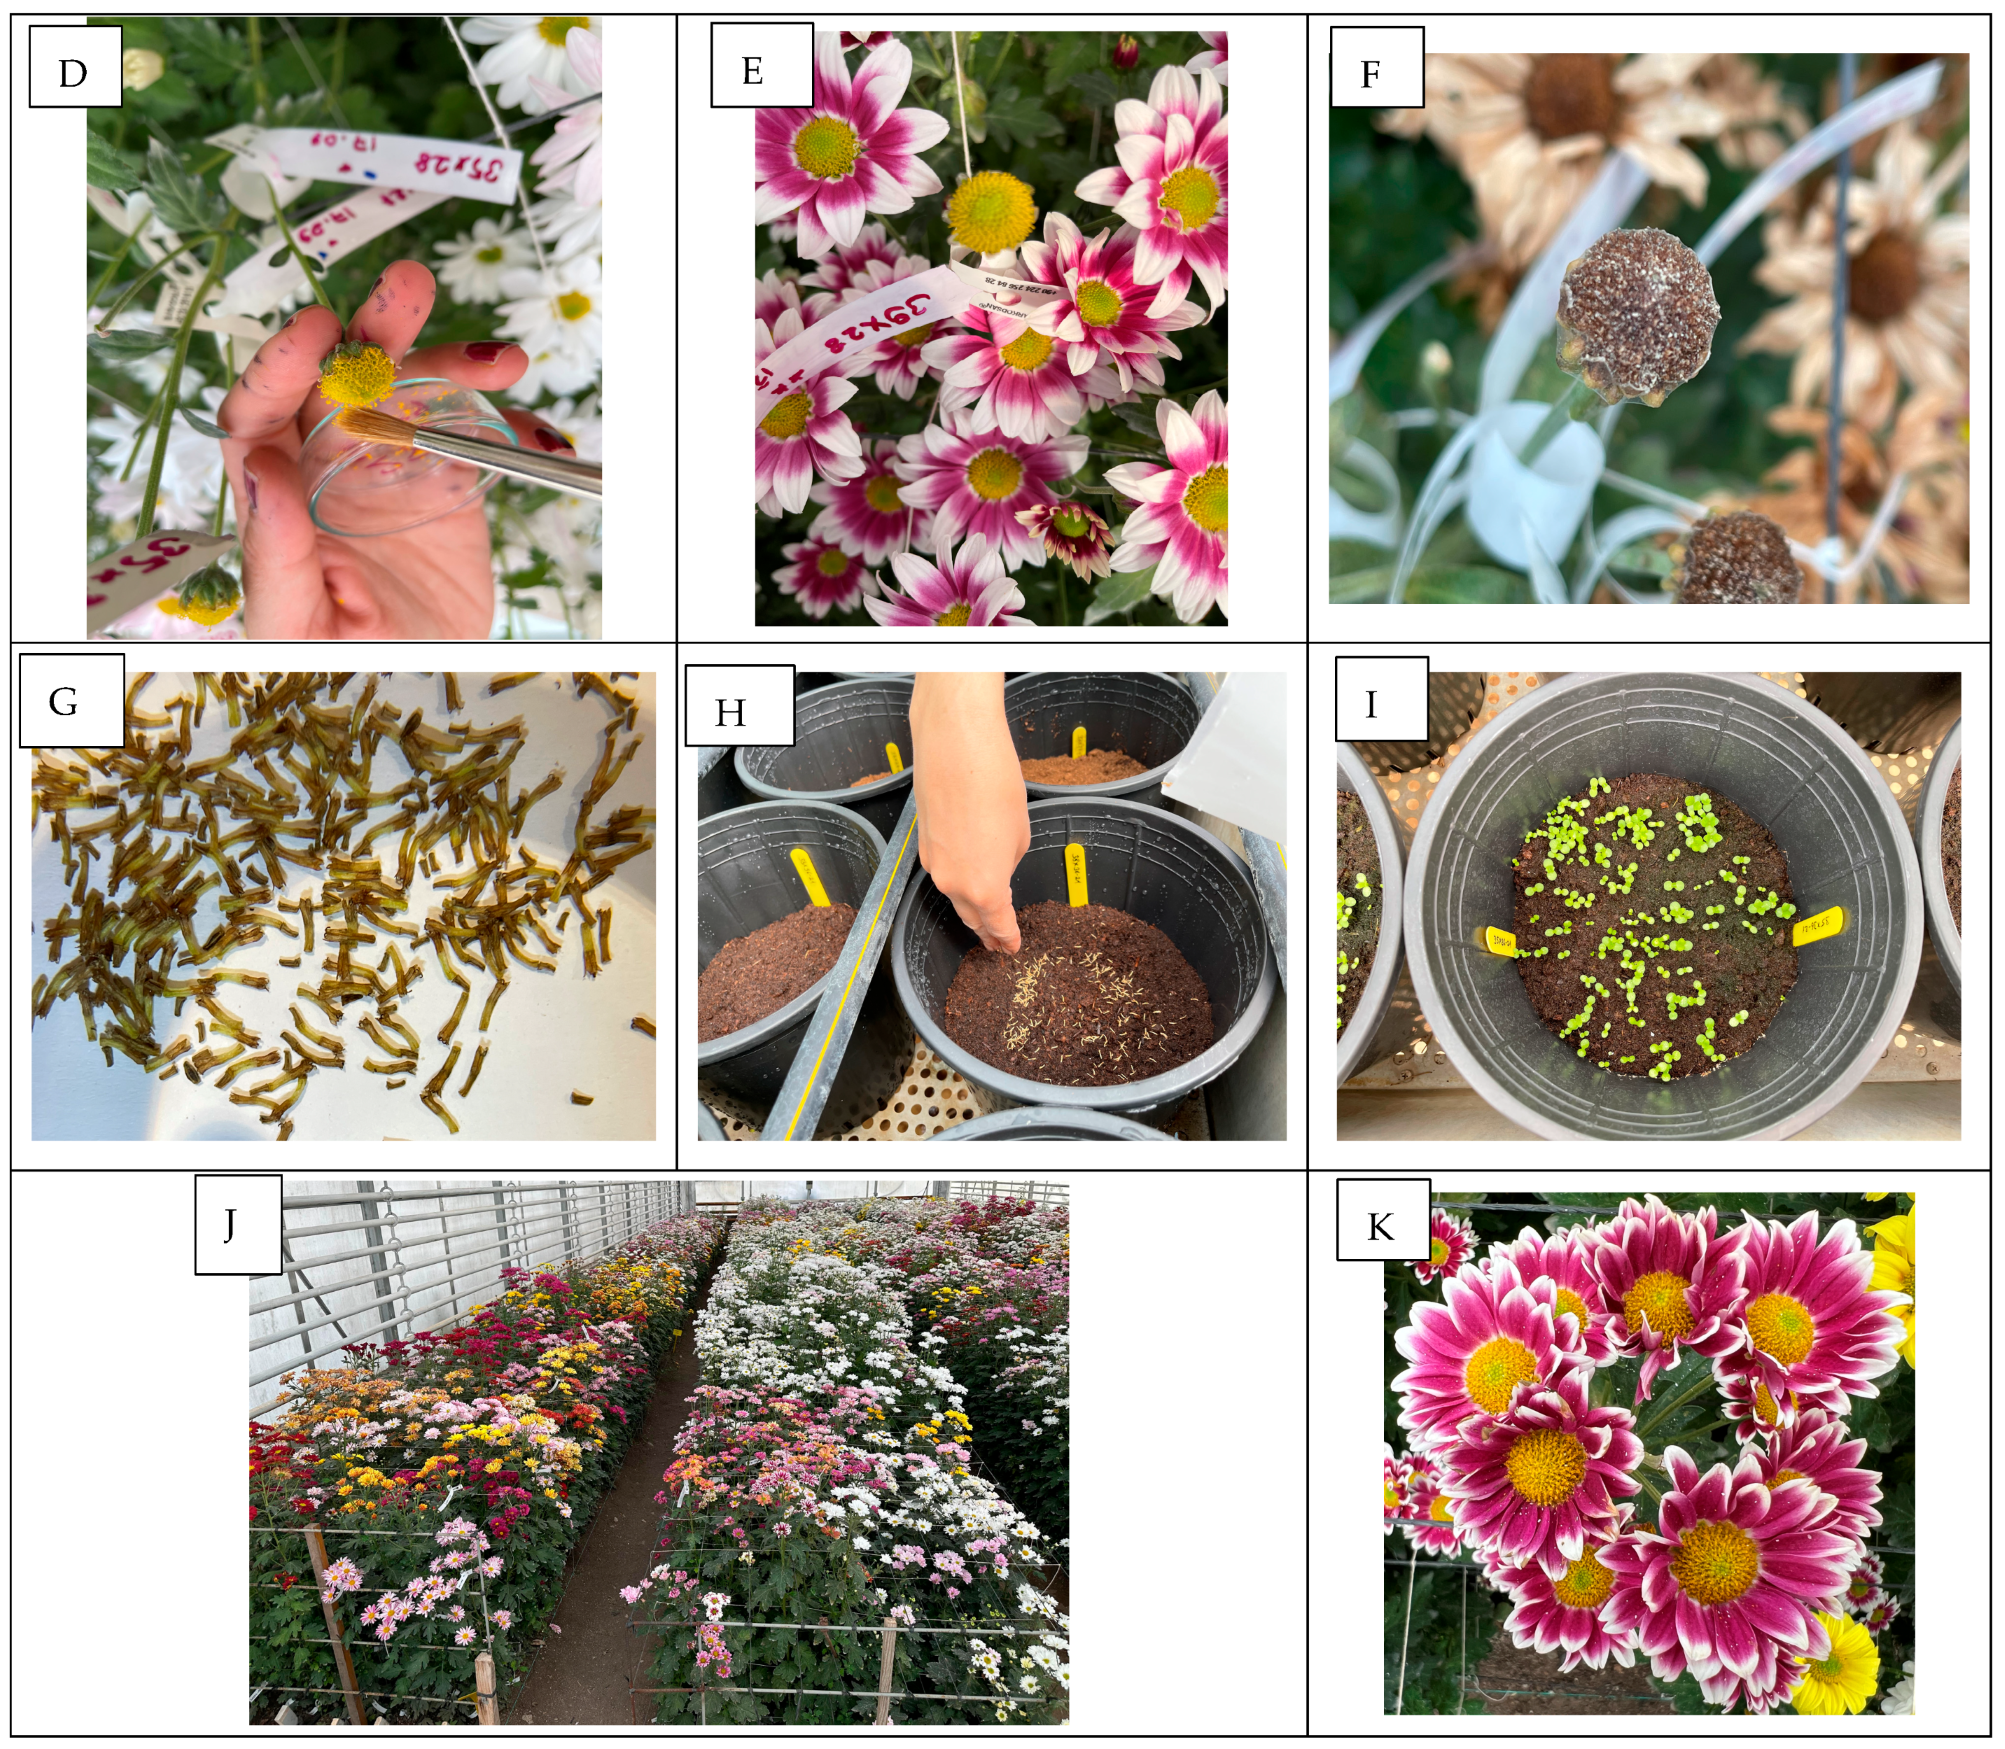
A total of 6 combinations were formed, and each combination was pollinated 25 times. The pollen of commercial cut varieties (Barolo, Chic, Raisa Dark) was collected daily during the period when flowers were fully open, and 2–3 rows of tubular flowers began opening from the outside to the center. Fresh pollen was used without storage. Pollen was collected using a sable brush or by tilting flowers downward (Figure 1). In single-layer chrysanthemum flowers, there are 1–5 rows of ray flowers, and the tubular flowers in the center are visible [26]. The ray flowers are female (20–30), while the tubular flowers are hermaphroditic (100–200) [27]. Only tubular flowers produce pollen in single-layer chrysanthemums. These flowers open gradually from the outside to the center (Figure 1), making pollination suitable at 2–3 day intervals. The optimal pollination period is when 4–5 rows of tubular flowers are open [28,29]. In this study, pollination was performed with a sable brush when 4–5 rows of tubular flowers opened. Each flower was pollinated three times at 2–3 day intervals. The stigma is receptive when it forms a ‘Y’ shape [28,29]. After pollination, labels indicating the hybrid combination (mother × father) and the pollination date were attached to each flower (Figure 1). After pollination, the flower clusters matured approximately 6–8 weeks later, depending on genotype and environmental conditions.

2.2.3. Seed Set and Assessment of Qualitative and Quantitative Characteristics

Following successful pollination, flowers developed into fruits, and seeds were extracted from the matured fruits rather than directly from the flowers. The mature flower clusters (capitula containing seeds) were manually harvested on 4–5 December 2021 and taken to the laboratory. After removing the seeds from the flower trays, they were dried at room temperature (20–22 °C) for one week and then counted. F1 seeds were sown on 3 April 2022 by sprinkle sowing in 5 L pots containing peat. Seeds germinated within 3–12 days. The germinated seeds were counted, and their % ratios were calculated. When the hybrid individuals reached the 4–5 leaf stage, they were planted in the soil at a distance of 10.5 × 12 cm between 6 and 10 June 2022. No pinching was performed on hybrid plants. When the F1 genotypes reached a height of 25–30 cm, blackout application was started (27 June 2022) and blackout application was terminated when the flower buds started to show colour (21 August 2022). In hybrid plants, flower buds started to form on 16 July 2022, and flower buds started to show colour on 21 August 2022. To prevent damage to the plants inside the greenhouse from high light intensity, shade dust was applied to the roof and lateral surfaces of the greenhouse, and shading was provided with a thermal curtain inside the greenhouse. Water and nutrients [29] were supplied to the plants by a drip irrigation system, and the system was automatically controlled by a fertigation computer. In chrysanthemums, which are short-day plants, blackout was also carried out in the summer period (between 17:30 and 08:30) [30].
Morphological characterizations of F1 genotypes were determined during the flowering period (between 25 August 2022 and 17 September 2022). The flowering period of chrysanthemums was expressed in days as the time from planting to the date when 50% of the flowers in the plot were harvested. The response time of chrysanthemums was expressed in days as the period from the start of the short-day treatment (blackout) to the stage when at least four flowers were fully open on 50% of the plants [26,31]. The number of rows of flowers was expressed as rows/flower by counting the number of rows (layers) of flowers in fully opened flowers. The number of ray flowers in the plate was counted and expressed as number/flower. The number of rows of ray flowers in the fully bloomed flowers and the visible/invisible center of the flower plate were defined as flower types (Lean fold, semi-folded, daisy-eyed folded, folded, decorative, and anemone type) [26,31]. The length of the flower stalk was measured with a meter from the cutting point of the stems of the flowering branches harvested 5 cm above the soil level to the endpoint of the flower stalk and stated in cm. Flower stalk thickness was measured with a digital caliper 5 cm below the lowest bud on the branch and 5 cm above the branch’s base on the harvested flowers, and the stem thickness was expressed in mm as the average of both measurements. The width of the bud in four fully opened flowers on a branch was measured with a digital caliper, and the flower diameter was expressed in cm as the average of all four measurements. The number of flowers was determined by counting the number of flowering and non-blooming buds on a branch and expressed as the number/branch. Branch weight was determined by weighing the stem + branch + flower weight of the flowers harvested at commercial harvest maturity (when the lingual flowers were fully opened) and expressed as g/branch. The number of leaves on each branch was counted on the branches harvested 5 cm above the soil level and expressed as number/branch.
The experiment assessing pollen viability and germination was arranged in a randomized plot design with four replications. For each replication, approximately 250 pollen grains were evaluated across five randomly selected microscopic fields. Similarly, crossbreeding experiments were performed using the same experimental design, with five flowers pollinated per replication, resulting in a total of 25 crosses per hybrid combination. Data derived from both pollen quality assessments and crossbreeding trials were analyzed using IBM SPSS Statistics 26. Mean comparisons were conducted with Duncan’s multiple range test, and significant differences were determined through analysis of variance (ANOVA).

2.3. Molecular Characterization Analysis

Genomic DNA was extracted from young leaves of genotypes belonging to chrysanthemum 5 parents and 42 F1 populations using the modified CTAB method [32], followed by purification procedures described by Dalda-Sekerci [18]. The primers used in this study were selected from those previously identified as exhibiting high amplification in ornamental plants [18]. Following this, the genomic DNA was subjected to PCR amplification using eight iPBS primers. 1.5 μL of Taq buffer, 0.33 μL of 2.5 mM dNTPs, 1 μL (5 pM) of each iPBS primer, 0.2 μL of Taq DNA polymerase, and 2.0 μL (20 ng) of template genomic DNA were used in the 15 μL PCR process. PCR reactions were conducted using a thermocycler (C1000 Touch TM, Bio-Rad, Hercules, CA, USA).
The PCR cycling conditions were as follows: a four-minute initial denaturation at 95 °C, 35 cycles of 1 min at 95 °C, 1 min at 52–56 °C, and 1 min at 72 °C, and a final extension step of 7 min at 72 °C. Using TBE (Tris-Boric acid-EDTA) buffer, the amplified products were separated on a 1.5% agarose gel at 110 V for four hours. After staining with ethidium bromide, visualization was carried out under UV light, and the outcomes were recorded using a gel documentation system (Bio-Rad, GelDoc Go Imaging System, Waltham, MA, USA). DNA fragments were recorded as a binary data matrix (1–0), indicating the presence and absence of a band, respectively. Dice’s similarity coefficient [33] and the unweighted pair-group with arithmetic average method (UPGMA) SAHN clustering algorithm were used to conduct cluster analysis among the 5 parents and 42 F1 genotypes of chrysanthemum. The analyses were conducted using NTSYS-pc (Numerical Taxonomy Multivariate Analysis System, NTSYS, 2.11, New York, NY, USA). The number of fragments overall, the number of polymorphic fragments, mean polymorphism, allele frequency, the number of effective alleles, Shannon’s information index, expected heterozygosity, and the ratio of unbiased expected heterozygosity were among the characteristics that were ascertained. A Mantel test was conducted between the Dice and Jaccard similarity matrices. Principal Component Analysis (PCA) was conducted based on the variance-covariance matrix. For PCA, the correlation matrix was initially created using the SIMINT module. Subsequently, eigenvectors were calculated using the EIGEN module based on this matrix. Two-dimensional and three-dimensional graphics were generated utilizing the eigenvectors in the PROJ module.

3. Results and Discussion

3.1. Ploidy Levels, Pollen Viability and Germination Rates

The nuclear DNA contents of chrysanthemum genotypes used as parents in the study varied between 18.3 pg/2C and 19.91 pg/2C. The ploidy levels of all chrysanthemum genotypes were found 2n = 6x = 54 (Table 2).
Aneuploidy variation in chrysanthemums is widely known and inconsistent chromosome numbers can often be observed in different root tip cells of the same individual [34]. Guo et al. [34] found that the ploidy levels of different chrysanthemum cultivars were triploid (3x), tetraploid (4x), pentaploid (5x), hexaploid (6x) and heptaploid (7x) and 48 randomly selected cultivars were aneuploid by chromosome counting. Chang et al. [35] analyzed 30 different chrysanthemum cultivars by karyotypic methods and reported that the somatic chromosome number of 30 cultivars varied between 49 and 62, mostly between 51–56. It was reported that the ploidy level of 48 F1 genotypes obtained by artificial hybridization between Chrysanthemum shiwogiku Kitam. and C. vestitum (Hemsl.), a Chinese species, varied between 2n = 63 − 81 and very small chromosomes were observed in some individuals [36]. The results obtained in our study are similar to these studies and it has been reported that most of the chrysanthemum cultivars traded are allohexaploid (2n = 6x = 54) but aneuploids are also found [26,37,38,39].
Aneuploidy represents a significant factor in chrysanthemum breeding, influencing genetic diversity, trait variability, and the complexities surrounding breeding programs. Chrysanthemums are predominantly hexaploids (2n = 6x = 54) but frequently display multiple aneuploid forms, complicating genetic analysis and breeding efforts due to chromosomal variations. This genetic complexity is essential for understanding the variation in traits among different cultivars, such as flower color and morphology, which have been extensively documented [40,41,42]. The phenomenon of aneuploidy results from the gain or loss of chromosomes, leading to alterations in genetic dosage that may affect gene expression and phenotypic characteristics. Research indicates that genomic imbalances due to aneuploidy can lead to significant morphological, physiological, and biochemical variations within chrysanthemum cultivars [41,42,43]. For instance, such genetic variations can influence visual characteristics, contributing to the diverse floral architecture cherished in ornamental varieties. Given that cultivated chrysanthemums originate primarily from hybridizations between various wild species, aneuploidy both arises from this complex breeding history and contributes to the remarkable diversity observed today [44]. In our study, although the majority of parental cultivars were determined to be allohexaploid (2n = 6x = 54), minor deviations in chromosome number are likely to have contributed to the relatively low pollen germination and seed viability observed in certain cross combinations. Such irregularities are consistent with previous reports that aneuploid individuals often display reduced fertility and irregular meiotic segregation, thereby limiting crossability and the uniformity of progenies. While aneuploidy presents a challenge in chrysanthemum breeding by reducing hybridization efficiency, it also provides a valuable source of novel genetic variation that can be exploited to develop unique ornamental traits.
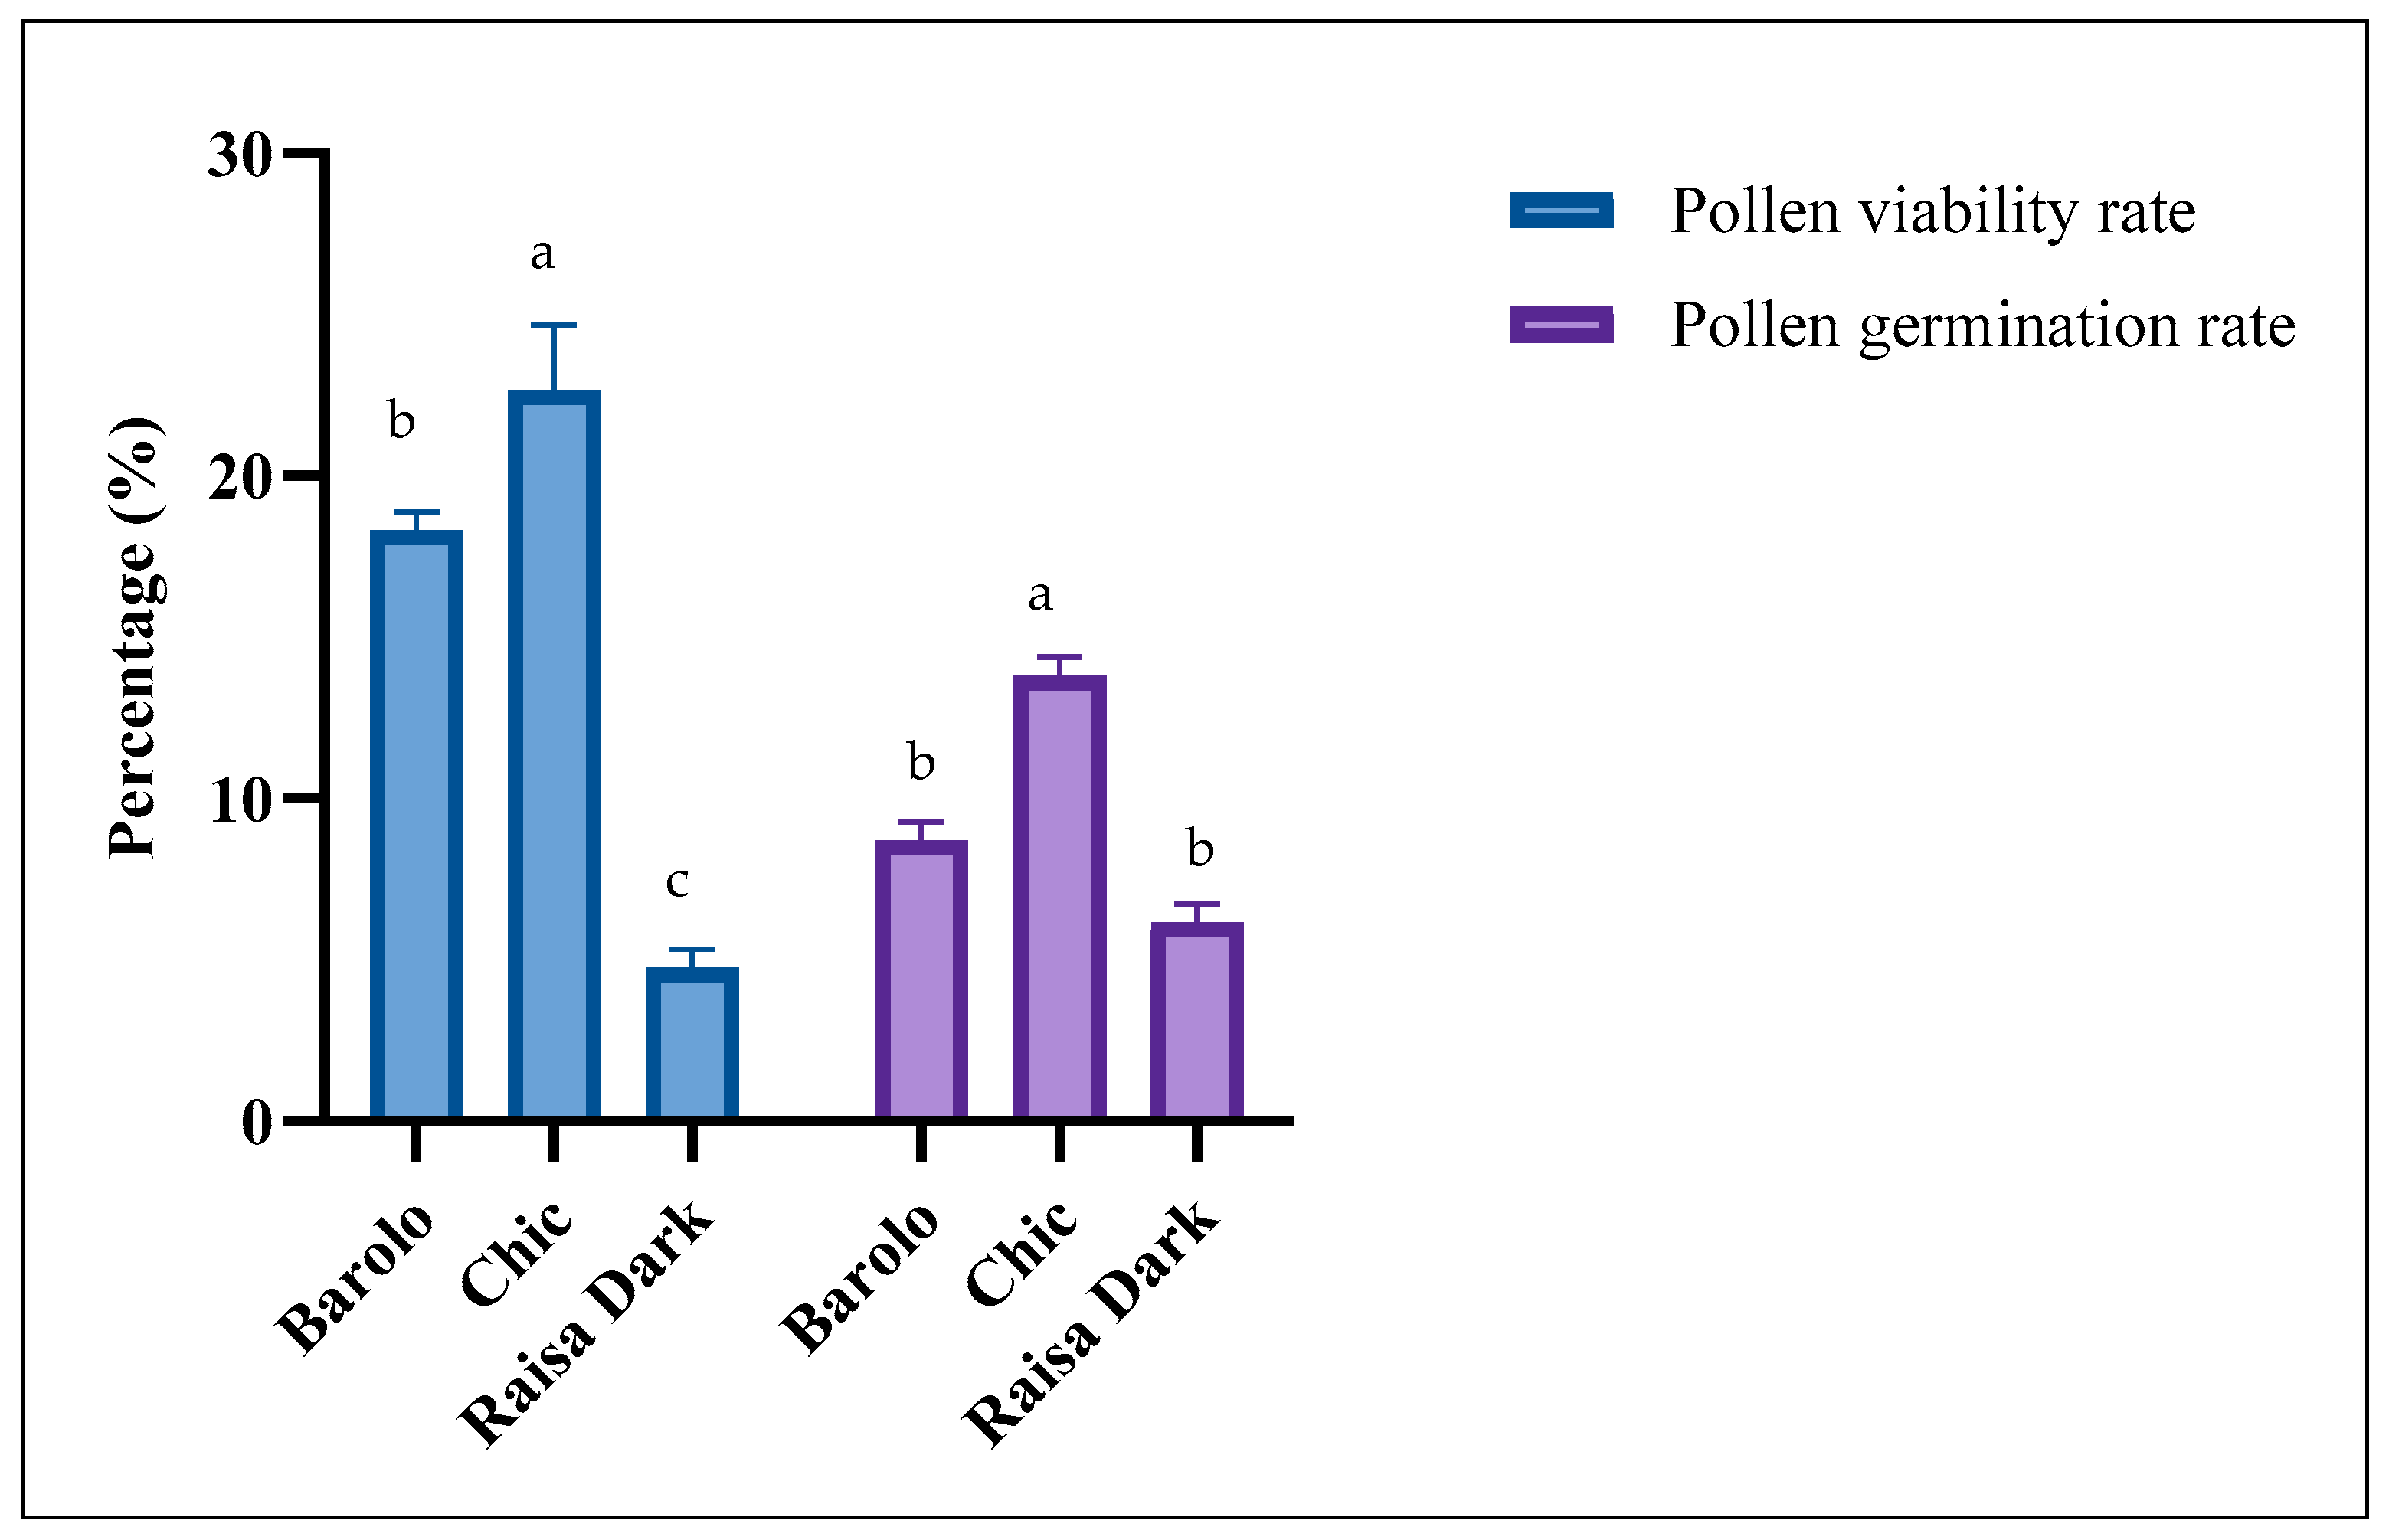
Chrysanthemum varieties showed significant differences in pollen viability and germination (p < 0.05). Chic had the highest viability (36.04%) and germination (13.81%), followed by Barolo (18.30%, 8.71%) and Raisa Dark (4.75%, 6.17%), with no significant difference between Barolo and Raisa Dark in germination (Figure 2).
In breeding studies, the fertility of the parents is one of the main factors affecting the success. The pollen yield and quality of the paternal parents used as pollinators directly affect fertilization and, thus, the success of hybridization. Yang and Endo [25] reported that pollen viability rates of three different chrysanthemum species belonging to the genus Dendranthema varied between 83.5% and 96.3% and pollen germination rates varied between 69.4% and 76.4%, Zhao et al. [45] reported pollen germination rates of D. indicum, D. vestitum species and two different chrysanthemum varieties as 46–54% for chrysanthemum species and 23–25% for chrysanthemum varieties. Wang et al. [46] found that pollen germination rates of different chrysanthemum genotypes varied between 15% and 34% and genetic variation was effective on germination performance. Dursun et al. [47] reported fresh pollen viability rates of different spray chrysanthemum varieties as 8.82% and 19.24%, and fresh pollen germination rates as 5.18% and 7.58%, respectively. Kazaz et al. [48] reported pollen viability rates of commercial chrysanthemum varieties between 22.1 and 11.0%, pollen viability rates of natural chrysanthemum species (C. coranarium and C. segetum) varied between 35.2 and 9.1%, commercial cut chrysanthemum pollen germination rates varied between 15.8 and 4.0%, and natural chrysanthemum species varied between 12.7 and 8.9%. Meral et al. [24] determined fresh pollen viability rates varied 12.83% to 32.04%, and pollen germination rates varied between 16.76 and 3.45%. These studies reported varying pollen viability and germination rates in chrysanthemum species and varieties due to factors like genetic variation, environmental conditions, storage, and methods used. Our findings align with these studies but show differing lower and upper limits, which are likely influenced by species and cultivar [48,49], the climatic conditions (temperature, light, humidity, day length) under which the plant material was grown [48], the method used to determine pollen viability and germination rates (chemical or biological) [25], the season and time of pollen collection [50] and storage and preservation conditions [47,51].

3.2. Total Seed Number, Total Seed Weight, Average Seed Number per Flower Head, Germinating Seed Number

In the study, six different hybrid combinations were formed, and a total of 150 crosses were made, at least 25 for each combination. Total number of seeds, average number of seeds per flower tray/capsule, number of seed germination, seed germination rates (%) for each hybrid combination are presented in Table 3. It was found that the number of seeds obtained per hybrid combination varied greatly according to the combinations and 30,391 hybrid seeds were obtained in total. According to the hybrid combinations, the number of seeds varied between 3680 (Together × Raisa Dark) and 7226 (Stylist Pink Dark × Barolo). The highest average number of seeds per flower tray was determined in Stylist Pink Dark × Barolo hybrid combination with 289 and the lowest average number of seeds was determined in Together × Raisa Dark hybrid combination with 147. It was determined that the average number of seeds per flower tray varied between 91 and 198, 88–289 and 80–181 in the combinations in which Chic variety was used as the paternal parent, Barolo variety was used as the paternal parent and Raisa Dark variety was used as the paternal parent, respectively. According to the hybrid combinations, total seed weights varied between 2.13 g (Stylist Pink Dark × Barolo) and 3.39 g (Together × Barolo) (Table 3). Among all hybrid combinations, the highest seed germination rates were observed in Stylist Pink Dark × Chic (10.73%), Stylist Pink Dark × Raisa Dark (9.58%), First White × Raisa Dark (7.57%), and Stylist Pink Dark × Barolo (6.38%), while the lowest germination rate was recorded in Together × Barolo (2.69%) (Table 3).
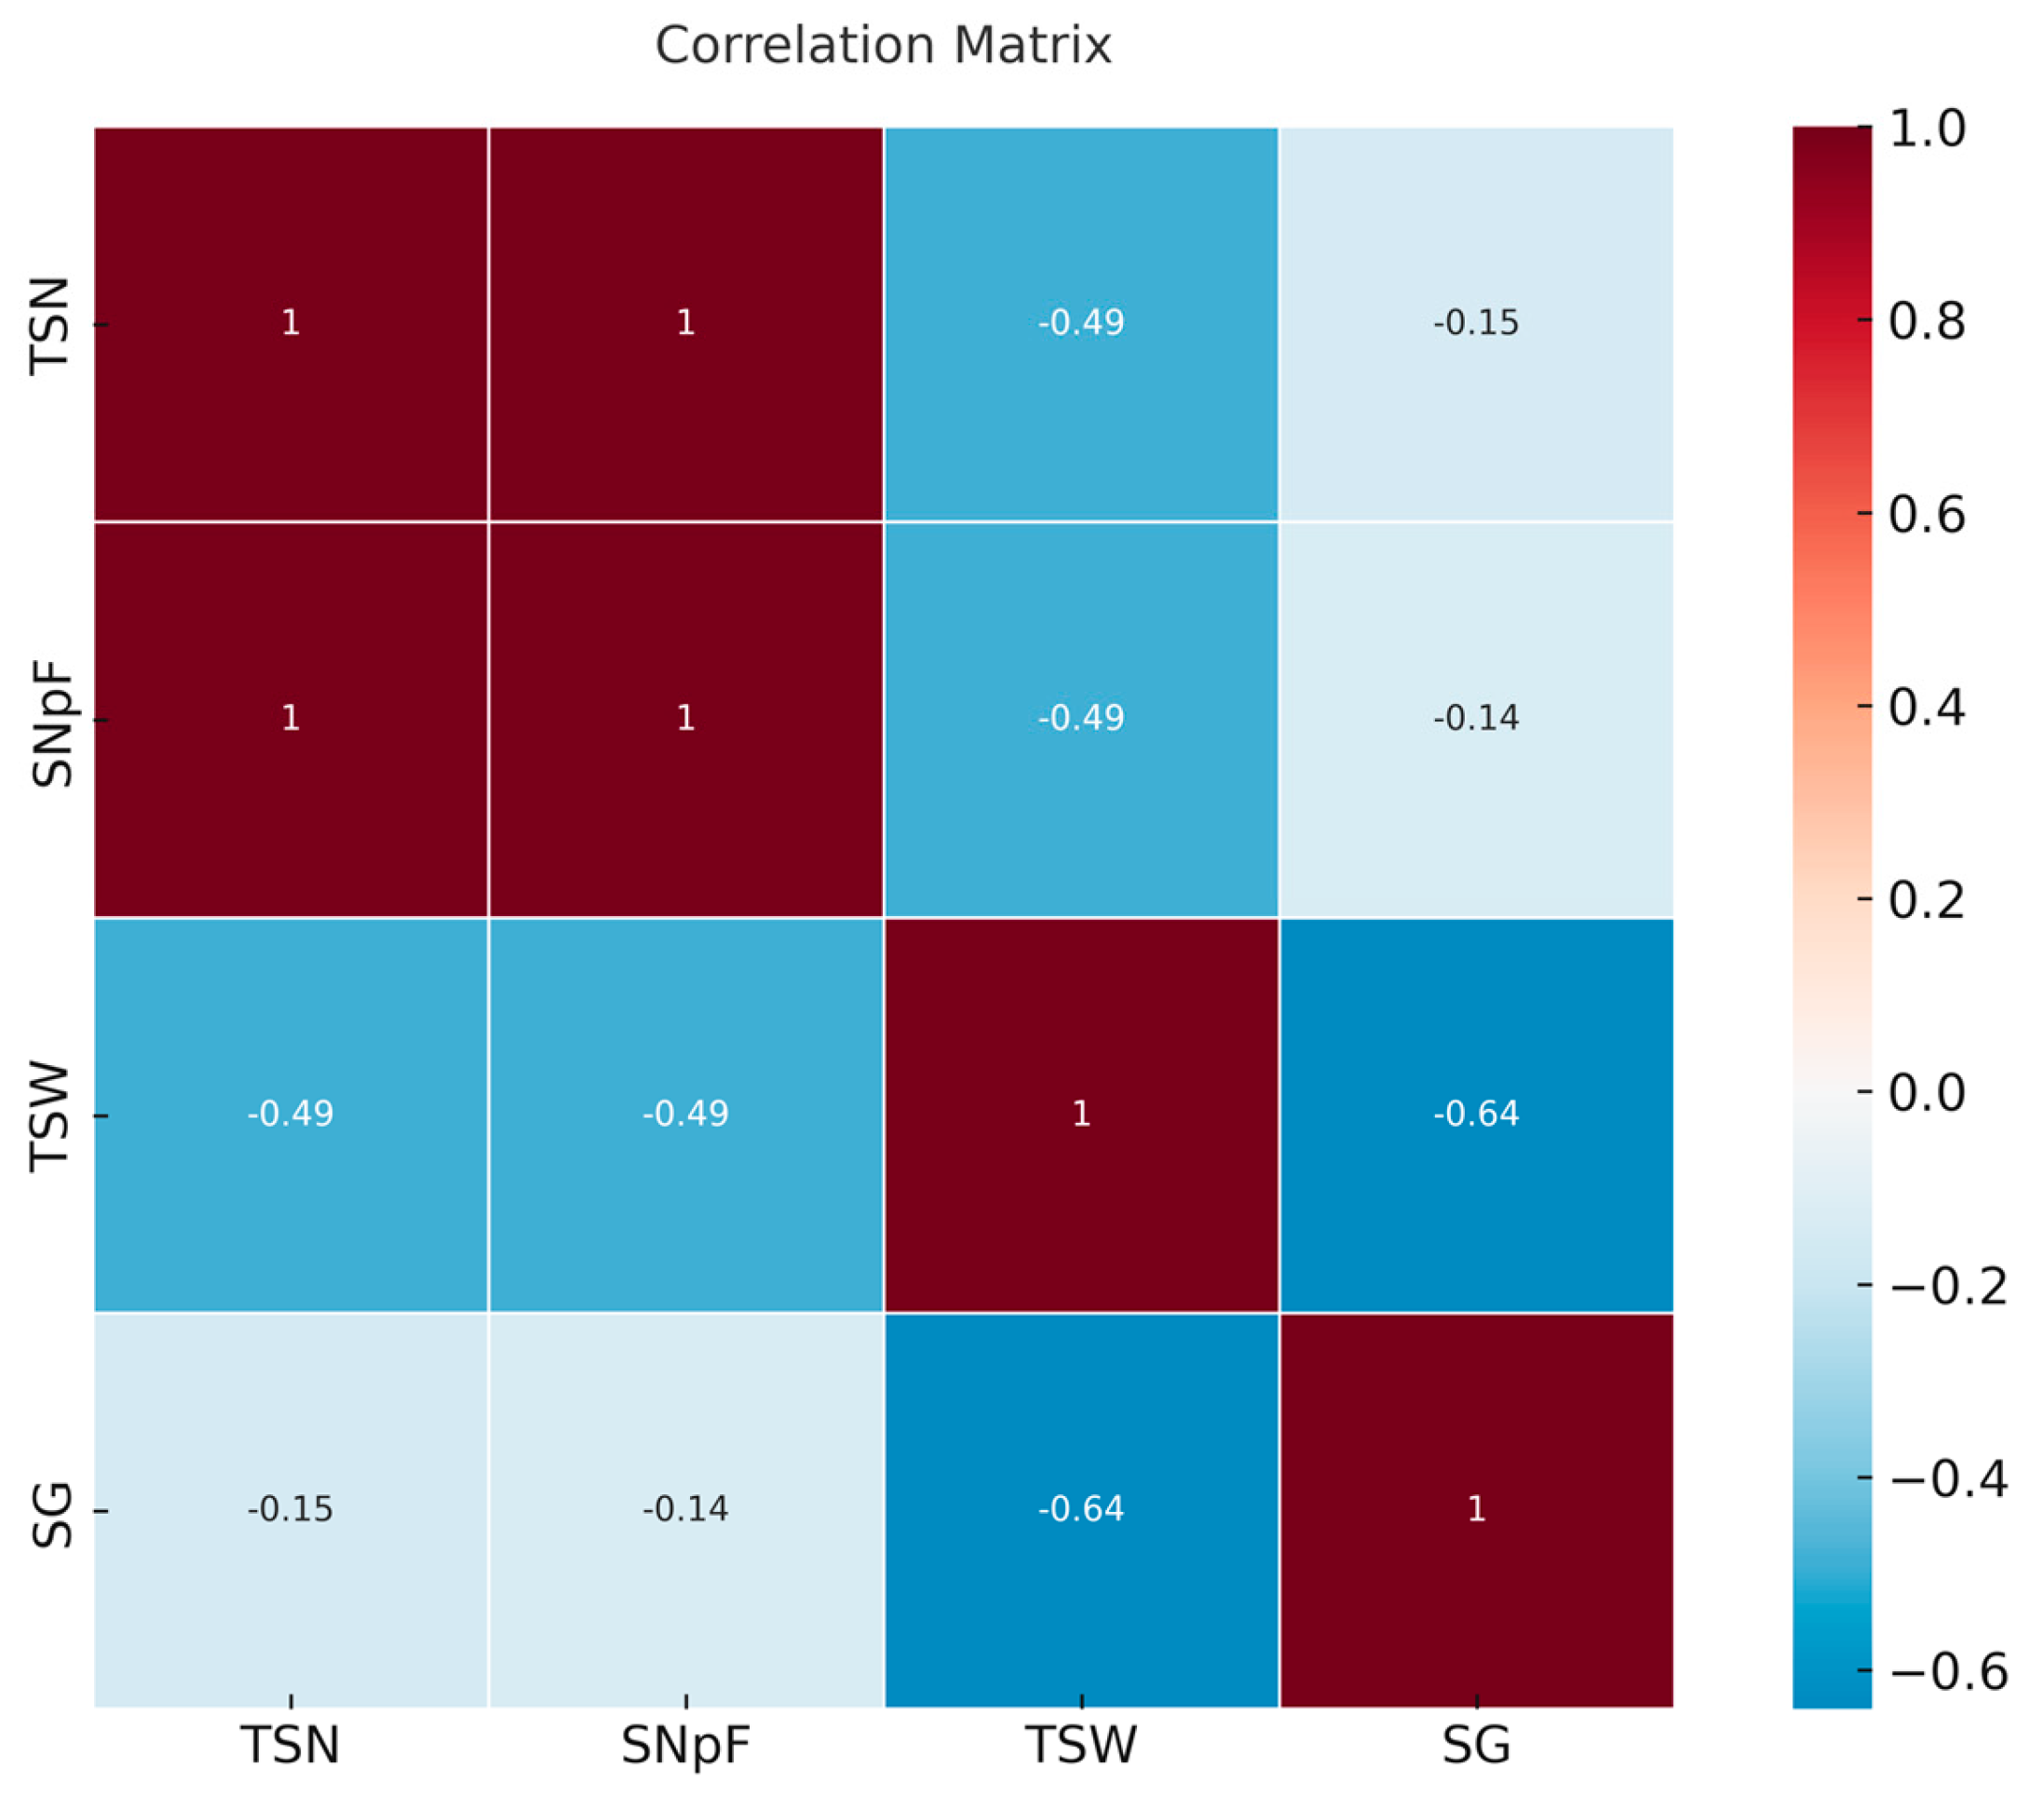
There is an exceptionally strong positive correlation between the total seed number and average seed number per flower head (0.999). Conversely, total seed number shows a moderate negative correlation with total seed weight (−0.49) and a weak negative correlation with seed germination (−0.15). Notably, the significant negative correlation between total seed weight and germination (Figure 3). Correlation coefficients among total seed number, average seed number per capitulum, total seed weight, and seed germination rate were calculated using IBM SPSS Statistics 26. The graphical representation of these correlations was used to generate Figure 3.
In hybridization studies in plant breeding, seed number and germination rates are important parameters for the successful development of new plant varieties and the commercial utilization of these varieties. It has been determined that seed set and germination rates show great variability depending on factors such as parental combinations, pollination conditions, pollen quality and self-incompatibility in chrysanthemum breeding studies conducted by hybridization. Jie et al. [52] reported that the seed formation rate varied between 0.0 and 32.4% in chrysanthemum breeding by hybridization, Anderson and Ascher [53] reported that the seed set rates of self-fertilized hybrid individuals varied between 0 and 8%, wild pollinated hybrid individuals varied between 0 and 92%, and the average seed germination rate was 64%, Wang et al. [46] reported that seed formation rate ranged between 0.0 and 37.23% depending on hybrid combinations in crosses between self-fertilized chrysanthemum varieties. The study determined the average seed germination rate for all hybrid combinations as 6.53%. Kazaz et al. [48] found that seed germination rates varied between 0.03% and 84.21% in hybrid combinations from which seeds were obtained. Miler and Kulus [54] as a result of hybridization, 93 seeds were obtained in a total of 120 main flower trays and the average number of seeds per flower tray was determined as 0.8 seeds. Miler and Wonzy [51] reported that seed set rates in hybrid combinations were 17.57%, 1.34%, and 0.39%, and the average number of seeds per flower tray was 2.25%, 0.20%, and 0.05%, respectively. Although the results obtained in the study agree with the lower limit values of the above studies, the upper limit values differ. These differences may be related to factors such as parental fertility (pollen-pistil interaction), self-depression, self-incompatibility, pollination conditions, pollination time, pollination frequency, pollen quality, and seed storage conditions [48,51,53,54,55].
Germination rates play a decisive role in the establishment of hybrid chrysanthemum populations, as they directly influence the efficiency of selecting superior genotypes and, consequently, the overall success of breeding programs. High germination rates are essential for ensuring a smooth transition from hybridization and seed formation to seedling establishment, thereby increasing the probability of obtaining vigorous progenies. Previous studies have demonstrated that the in vitro germination capacity of chrysanthemum pollen varies widely depending on cultivar, temperature, and pollen storage conditions, with germination rates reported to range from as low as 2.97% to as high as 25.6% [51]. Such variability highlights the critical role of genotype selection in breeding programs, where higher germination performance enhances the efficiency of hybrid establishment and facilitates the propagation of desirable traits.
In addition, the genetic background of chrysanthemum cultivars strongly influences germination success, particularly in interspecific hybridization. Differences in ploidy levels and genetic compatibility among donor species often result in variable pollen germination and embryo development patterns. Successful hybridization is more likely when parental species share similar ploidy levels, as chromosomal balance is required for stable fertilization and embryo formation [56,57]. Moreover, pollen viability, which reflects both quality and integrity, is closely correlated with germination capacity and hybridization success. Inadequate pollination management or poor pollen quality can further reduce germination rates, thereby limiting the number of progenies available for evaluation [47].

3.3. Qualitative and Quantitative Traits of F1 Progenies

A total of 239 F1 progenies were obtained and evaluated for their morphological and agronomic traits. F1 progenies showed the earliest flowering in Stylist Pink Dark × Chic (progeny 45) (56 days) and the latest in Together × Raisa Dark (progeny 41) (98 days). The seed parents flowered between 63 and 76 days (Together) and 56–74 days (Stylist Pink Dark), while pollen parents had flowering times of 56–76 days (Chic), 56–74 days (Barolo), and 55–78 days (Raisa Dark). Kim et al. [58] reported a chrysanthemum flowering time of 57 days, while other studies found 57–71 days [59,60,61], Kazaz et al. [48] observed 65–80 days. Our results (56–78 days) align with these findings and commercial cultivars. Chrysanthemums, being short-day plants, require a certain period of darkness and temperature changes can affect flowering time [62,63]. In addition, genetic variation and practices such as fertilization, irrigation and pruning also play a decisive role in development time [64,65].
Chrysanthemum response time, the period from short-day initiation to flowering, typically ranges from 42 to 77 days. Major breeding companies report response times of 45–55 days, varying by product group, flower type, and cultivar [66,67,68,69]. The period between the beginning of the short-day period and flowering in chrysanthemums is called response time [26]. As they are short-day plants, flowering starts when the dark period is sufficient, but temperature changes can accelerate or slow down this process [63]. Furthermore, the genetic make-up of different chrysanthemum species determines the response time, growing and cultivation conditions (e.g., high or low temperatures within the greenhouse) can also influence this time [48,64,70,71].
The most important quality parameters sought in the marketing of commercial chrysanthemum cultivars are flower stalk length, branch weight and number of flowers per branch. It was determined that the flower stalk length values of the F1 plants showed a wide range, varying from 66.00 cm (Stylist Pink Dark × Barolo hybrid combination, genotype 67) to 122.10 cm (Stylist Pink Dark × Barolo hybrid combination, genotype 37), while the mean values across different hybrid combinations ranged between 90.09 cm and 111.54 cm (Table 4). Jie et al. [52] reported that the hybrid individuals obtained as a result of reciprocal hybridization of 164 cut chrysanthemum varieties had thick and strong branches and flower stalk lengths above 80 cm, Kazaz et al. [48] reported that the flower stalk lengths of the genotypes in their chrysanthemum hybridization studies varied between 70.30 and 125.13 cm. In our study, it is seen that the flower stalk lengths of F1 plants are similar to the findings of Jie et al. [52] and Kazaz et al. [48]. The results obtained in our study are also in agreement with the findings of researchers who reported that the flower stalk lengths of the genotype obtained by crossing 2 different chrysanthemum cultivars were 93.1 cm [61], 105.5 cm [59], 105.1 cm [60] and 89.7 cm [72], respectively. The differences in the lower limit values of flower stalk lengths may be due to genotype, climatic conditions in the greenhouse, season, soil structure and maintenance conditions. Carvalho and Heuvelink [73] indicated that greenhouse climatic factors, especially temperature and daily light accumulation, significantly affect chrysanthemum stem length, with higher light levels associated with enhanced stem elongation.
In chrysanthemums, the thickness of the flower stalk is important for the resistance and weight of the branch. Flower stems should be neither too thin nor too thick. While the resistance of the branch decreases in very thin flower stems, very thick flower stems are not preferred in terms of aesthetic appearance. The flower stalk thickness of the F1 plants obtained in the study ranged from 3.29 mm to 7.25 mm, while the mean values across different hybrid combinations varied between 4.78 mm and 5.57 mm (Table 4). Hwang et al. [59,60] reported the flower stalk thickness of hybrid genotypes obtained as a result of hybridization as 3.8 mm and 9.22 mm, respectively, while Kazaz et al. [48] reported that the flower stalk thickness of hybrid individuals obtained as a result of hybridization of both commercial and natural chrysanthemum varieties varied between 3.86 and 7.25 mm. These results are similar to the findings obtained in this study. Moreover, Zhang et al. [74] showed that climatic conditions substantially influenced flower diameter in chrysanthemum cultivars. The data indicates that the differences in bloom width seen among genotypes in our study may stem from the interaction of environmental variables and genetic factors.
A characteristic that has a significant effect on the visual quality of chrysanthemums is flower diameter. The average flower diameter of F1 plants varied between 4.85 cm and 6.13 cm. The combination with the highest mean flower diameter was Stylist Pink Dark x Chic. Previous studies have shown that the flower diameter of hybrid chrysanthemum genotypes varies depending on the parent varieties, ranging from 3.81 cm to 8.88 cm [48,58,60,61,72]. These findings align with our study and highlight the genetic diversity in hybrid chrysanthemums. Additionally, the results are consistent with commercial chrysanthemum varieties, as leading breeding companies report that the flower diameter of single-flower-type spray chrysanthemums ranges between 6.0 and 8.0 cm [66,67,68,69].
In the cut chrysanthemum trade, the number of flowers per branch and branch weight are important characteristics that affect visual quality and price. In the study, the average number of flowers per branch varied between 9.42 and 11.77. The average branch weight varied between 54.58 g and 66.10 g (Table 4). Studies on the number of flowers per branch of chrysanthemum hybrid genotypes obtained as a result of hybridization show that the values obtained from different studies are in a wide range. Kim et al. [58], 7.4, Lim et al. [61], 11.0, Jung et al. [72], 11.1, Hwang et al. [59], 15.9, Hwang et al. [60], 19.1 flowers per branch. In commercial spray-type chrysanthemums, it is an important quality indicator that there are 5 or more (between 5 and 10) fully opened flowers in the first 10–15 cm from the end of the branch downwards and that these flowers are in the same line in length. In the study, it was determined that the number of flowers on the branch was compatible with commercial chrysanthemums. In commercial chrysanthemums, a branch of 1 cm length should weigh 1 g and a branch of 70 cm length should weigh 70 g. Branch weights are lower in Santini and Madiba-type flowers. In the market, flowers with a branch weight of 70 g and above are defined as 1st quality (A quality) and sold at higher prices. Kazaz et al. [48] reported that the branch weights of hybrid individuals obtained in hybridization studies varied between 26.0 and 193.0 g. Although the results of our study are similar to the findings of Kazaz et al. [48], it is thought that there is low branch weights observed in some hybridization combinations in the study and this situation may be caused by verticillium (Verticillium dahliae).

3.4. Heat Map of the Examined Traits with Hierarchical Clustering

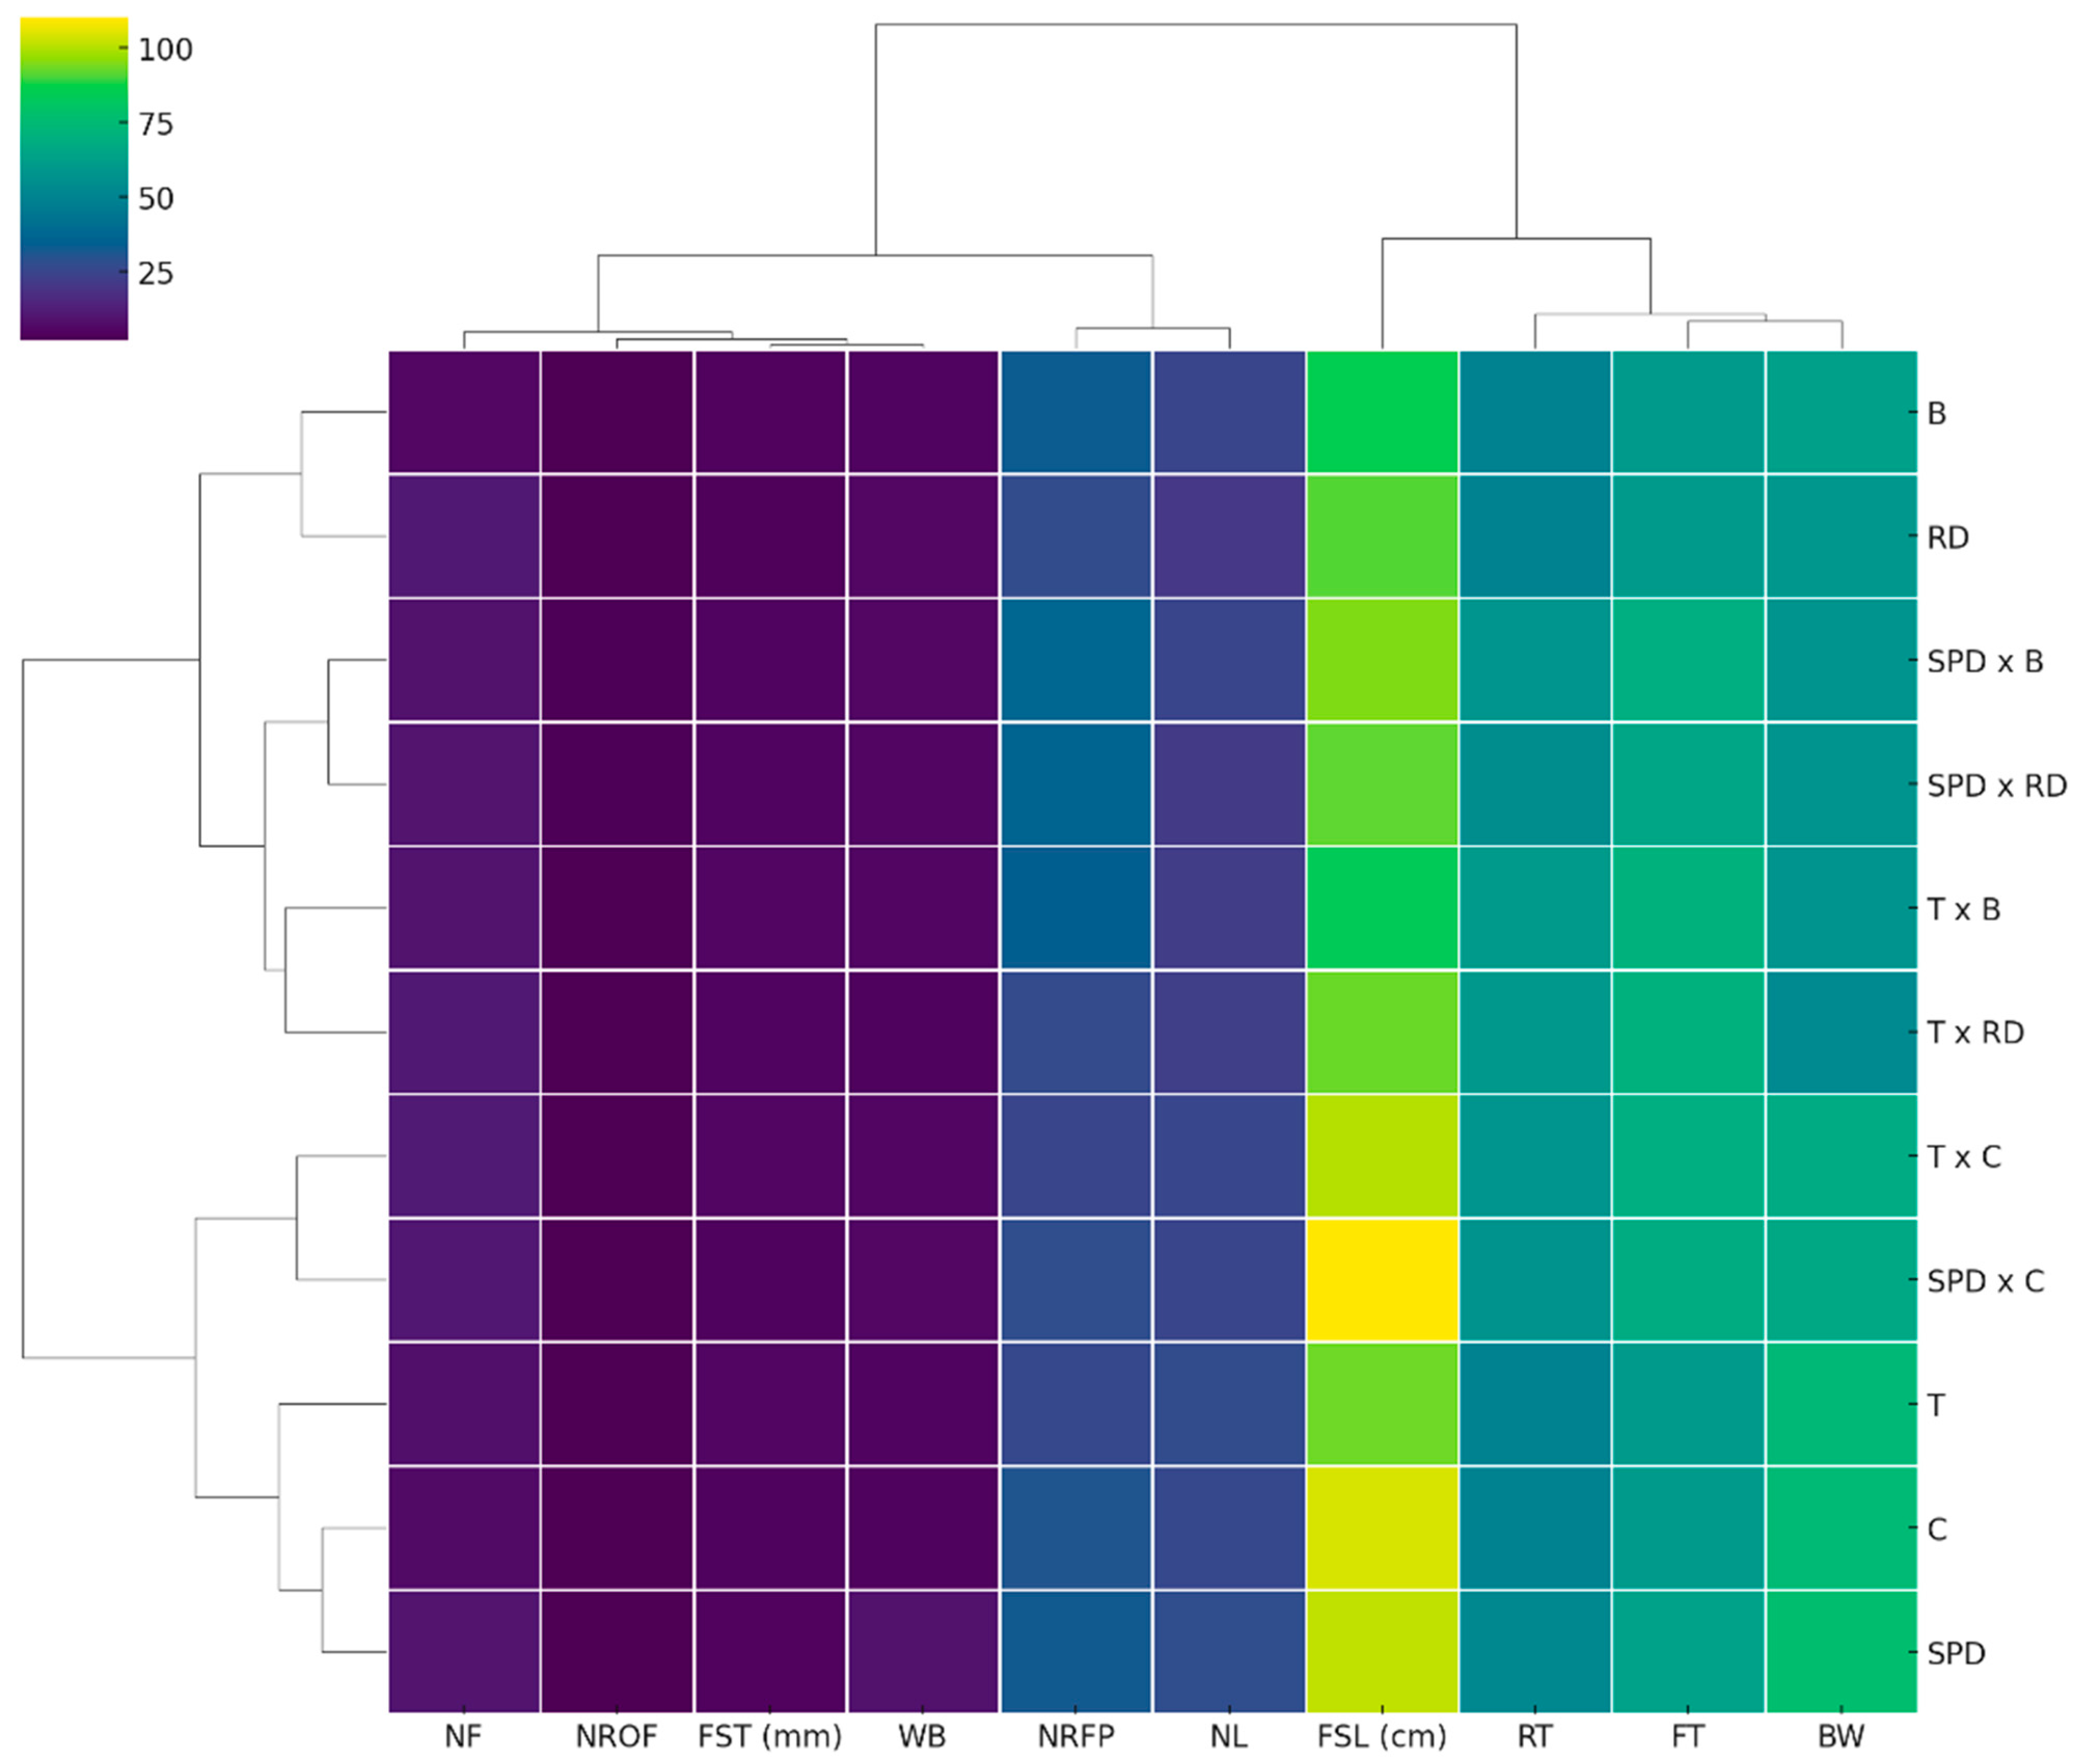
This dendrogram shows the hierarchical clustering results generated using the Ward method. In the dendrogram, the expression ‘Rescaled Distance Cluster Combine’ on the horizontal axis shows the merging distances of the clusters (Figure 4). The colour scale indicates the magnitude of the respective value (increasing values from dark purple to green). On the vertical axis are combinations and parents and on the horizontal axis are traits. The dendrogram structure shows the clustering of combinations according to their similarity. As seen in the dendrogram, two main clusters were formed. The first main cluster consists of individuals that are genetically closer to each other and includes individuals such as Stylist Pink Dark × Barolo, Stylist Pink Dark × Raisa Dark, Together × Barolo, Together × Raisa Dark and Barolo. This clustering indicates that these individuals are genetically very close to each other. The second main cluster consists of other individuals and it is observed that especially Together × Chic, Stylist Pink Dark × Chic, Chic, Stylist Pink Dark and Together, individuals come together. The fact that Together × Barolo and Barolo individuals are in the same main cluster shows that this hybrid shows high genetic similarity with its parent. Similarly, the fact that Together × Chic and Chic individuals are in the same cluster shows that the genetic similarity is strong. The presence of Stylist Pink Dark × Raisa Dark and Stylist Pink Dark × Barolo individuals in the same subcluster indicates the similarity to the Stylist Pink Dark parent. Individual Together is clustered at a greater distance than all other individuals. This indicates that the Together parent is genetically more divergent than the other individuals. Stylist Pink Dark × Chic and Stylist Pink Dark individuals were in the same cluster, indicating the genetic closeness of this hybrid individual with its parent (Figure 4).

3.5. Molecular Characterization of F1 Genotypes and Parental Lines

Although 239 F1 hybrids were produced and assessed morphologically, molecular analyses were conducted on a subset of 42 individuals. This subset was chosen to represent the genetic variability across the different cross-combinations, thereby providing a reliable overview of the genomic diversity within the population while maintaining the feasibility of molecular procedures. Eight primers that showed amplification were used in molecular approaches to evaluate the genetic diversity dimensions of 5 parents and 42 F1 genotypes of chrysanthemum. Using eight iPBS primers, the study produced 140 DNA band profiles, of which 133 were polymorphic and 7 were monomorphic. It was determined that the average polymorphism value was 93%. This result indicates that a significant portion of the obtained bands are polymorphic and that genetic variation has been reliably determined. The iPBS primers had band widths ranging from 100 to 1400 Bp. Primers iPBS-2383 and iPBS-2239 produced the most and least amount of amplification, respectively, with 27 and 11 bands (Table 5).
The average Polymorphic Information Content (PIC) value was calculated as 0.614, indicating that these primers possess a moderate to high capacity for detecting genetic differences. Some primers performed significantly better than others, achieving a 100% polymorphism rate. The fact that all bands detected by these primers were polymorphic demonstrates their high effectiveness in revealing genetic diversity in chrysanthemum. Among them, the iPBS-2239 primer outperformed the others in detecting genetic diversity, reaching the highest PIC value of 0.86. On the other hand, the iPBS-2383 primer exhibited the widest band range, from 150 to 1400 Bp, indicating its effectiveness in detecting diversity across broad genomic regions. In contrast, the iPBS-2239 primer had a narrower band range of 110–700 bp, providing genetic diversity information from a more limited genomic region. Overall, primers with a wide band range and high polymorphism rate were found to be more effective in genetic diversity analysis.
The expected and observed allelic frequency values (p, q), dependent on the iPBS primers, varied from 0.242 to 0.504 and 0.496 to 0.758, respectively. The average values for p and q were determined to be 0.424 and 0.577, respectively, indicating that the dominant allele is more limited compared to the recessive allele. These values indicate a moderate level of genetic diversity within the population.
The number of effective alleles (Ne) ranged from 1.372 (iPBS-2376) to 1.895 (iPBS-2383), with an average of 1.683. Shannon’s information index (I) values varied from 0.372 to 0.630, averaging 0.549. Expected heterozygosity (He) values ranged from 0.239 to 0.469, and unbiased expected heterozygosity (uHe) values ranged from 0.242 to 0.474 (Table 5). It was determined that some primers (iPBS-2252, iPBS-2270, iPBS-2383) stood out due to their high Ne, He, and uHe values, demonstrating superior performance in detecting genetic diversity. These primers are particularly suitable for comprehensive analyses in populations with high genetic diversity. In contrast, some primers (iPBS-2376) showed weak performance in detecting genetic diversity due to their low Ne, He, and uHe values. Such primers may be more suitable for analyzing populations with low genetic diversity or those with narrowly targeted genomic regions.
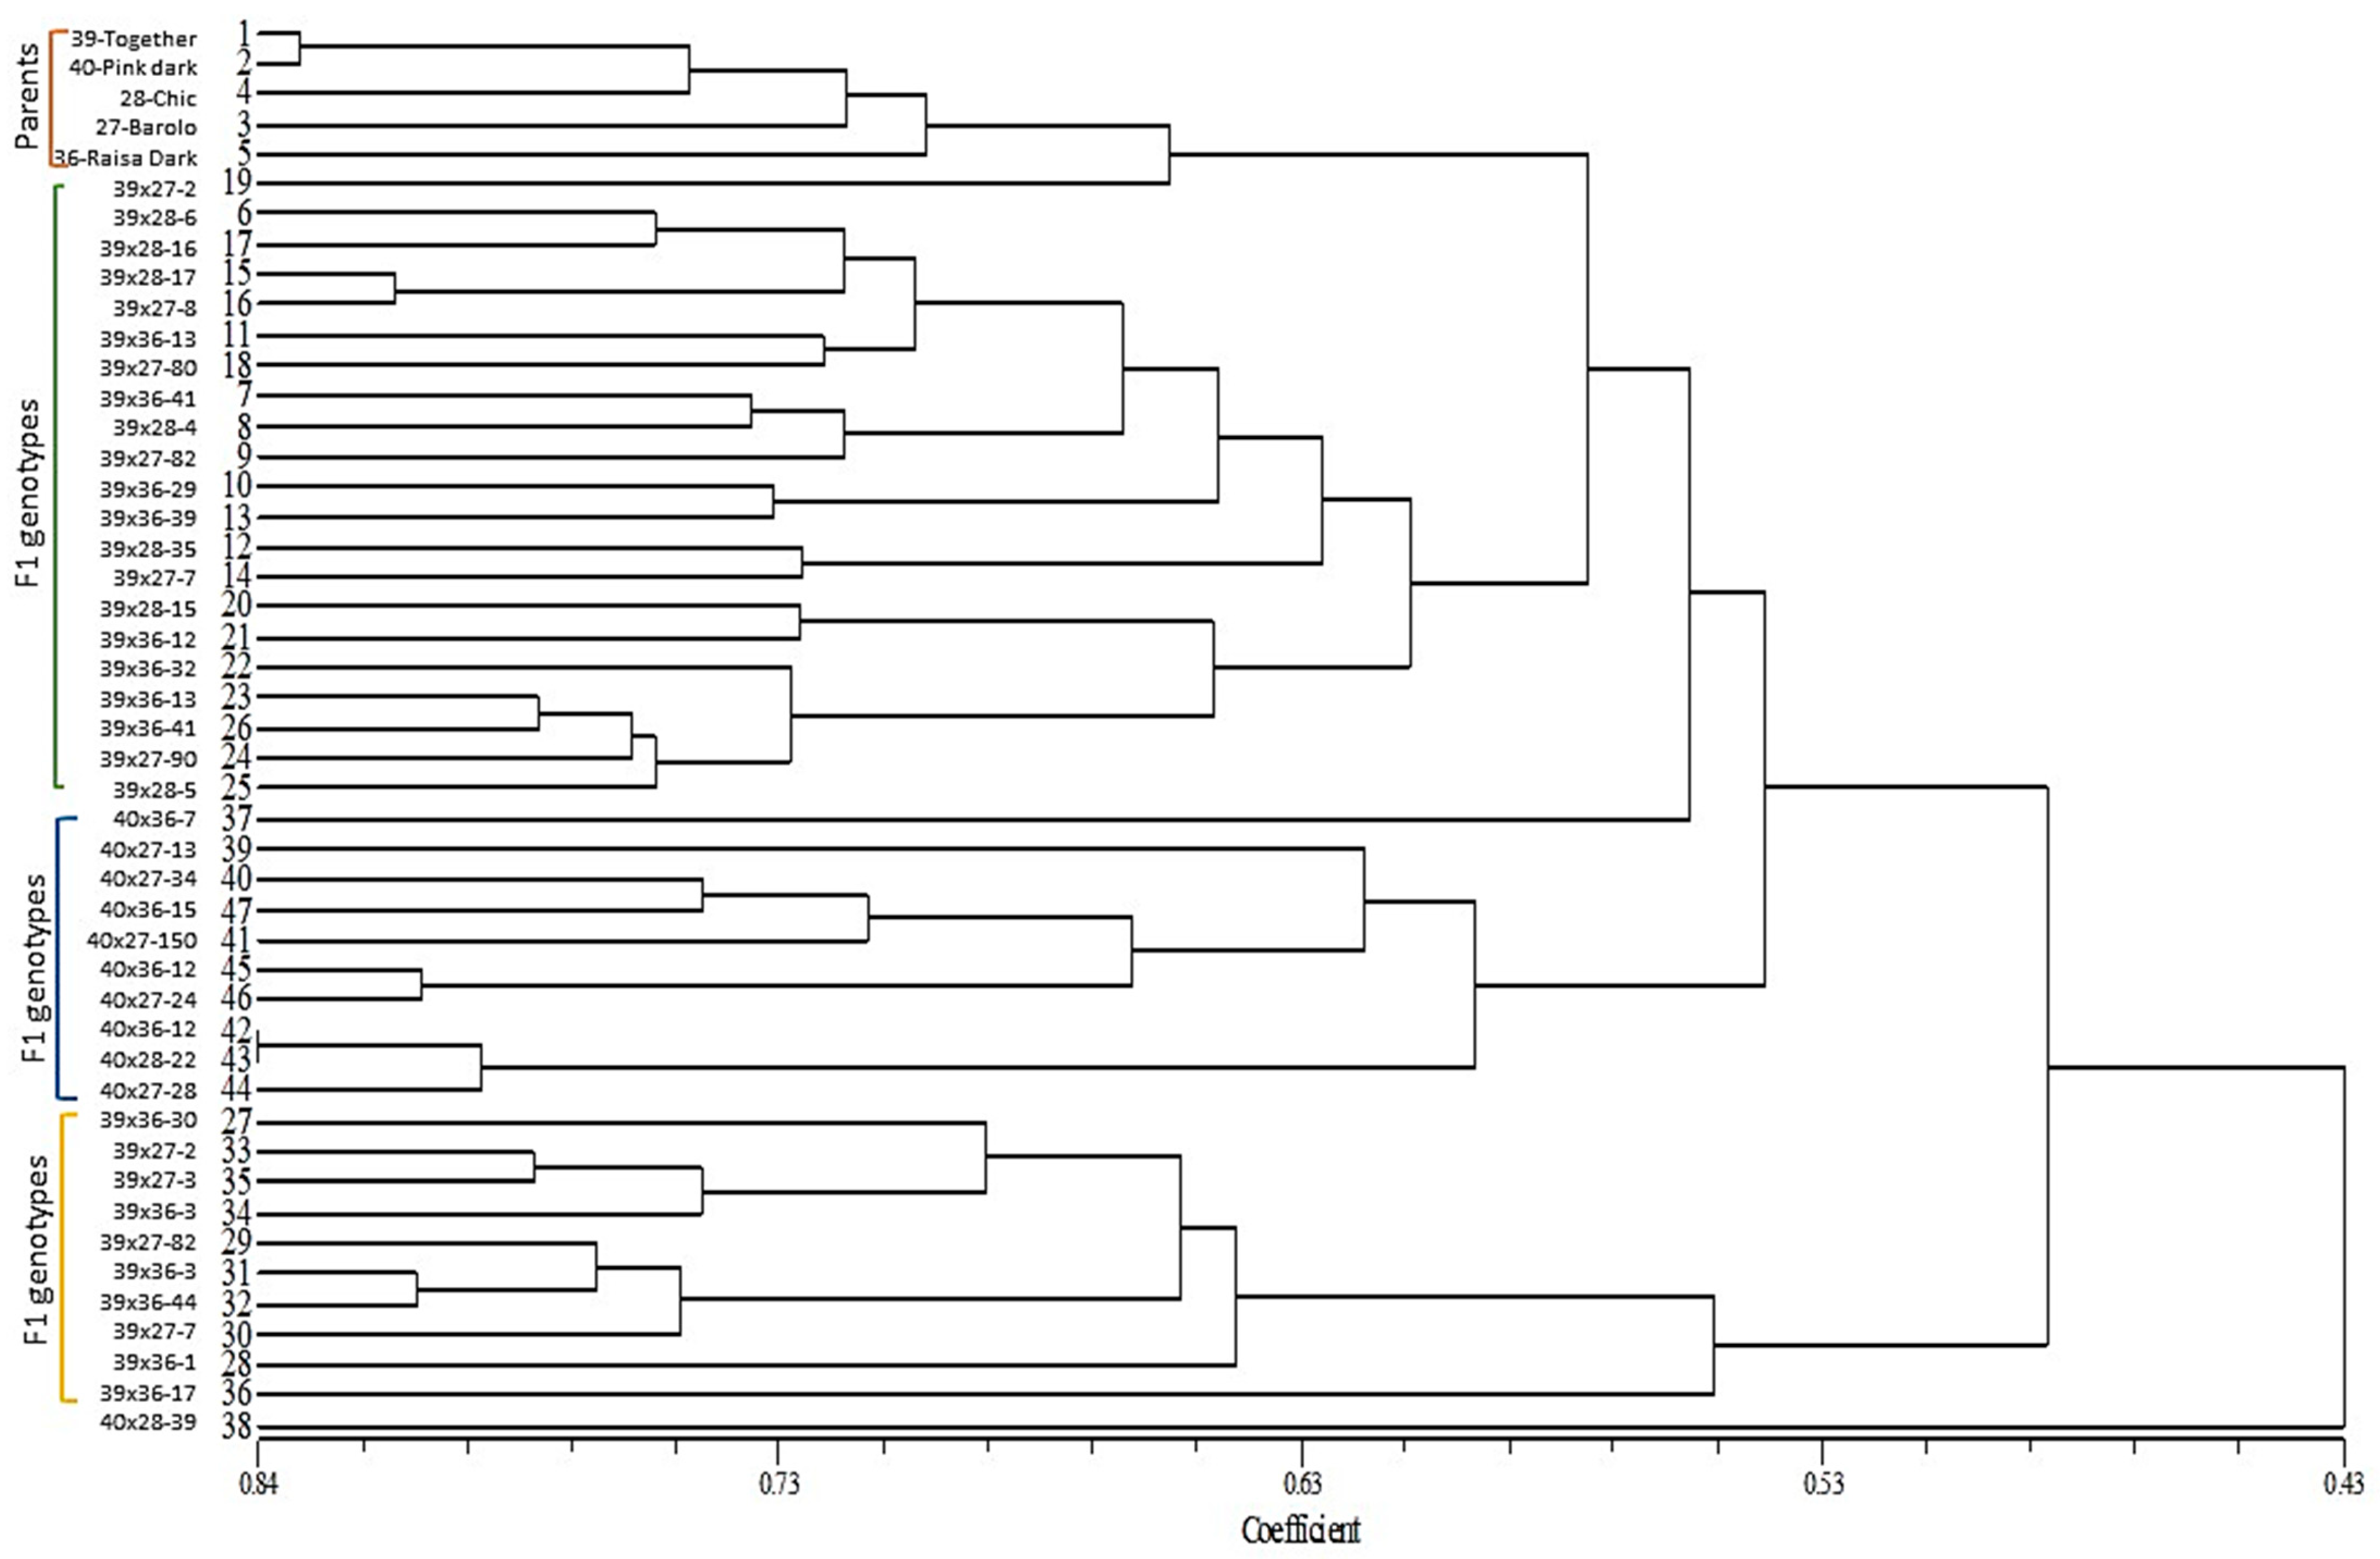
Cluster analysis was conducted using the UPGMA method with the Jacard similarity index, considering the results obtained from 8 iPBS primers across 5 parents and 42 F1 genotypes of chrysanthemum. The resulting dendrogram is presented in Figure 5. Based on the Jacard similarity matrix, the genetic similarity levels among chrysanthemum genotypes ranged from 0.43 to 0.84. In the dendrogram, it is observed that the genotypes 39-Together and 40-Stylist Pink Dark, used as maternal parents, and 27-Barolo, 28-Chic, and 36-Raisa Dark, used as paternal parents, are grouped together in a separate cluster. The F1 genotypes, which are hybrids of these parental genotypes, have formed three additional distinct clusters.
When examining the genetic distributions, it is evident that in chrysanthemum, the genetic traits are predominantly inherited from the maternal parent. The F1 genotypes, derived from 39-Together as the maternal parent and 27-Barolo, 28-Chic, and 36-Raisa Dark as paternal parents, are positioned on the same branch of the dendrogram. Similarly, the F1 genotypes obtained by hybridizing 40-Stylist Pink Dark as the maternal parent with the same paternal genotypes are also grouped closely together on a separate cluster in the dendrogram. Moreover, some F1 genotypes with the same maternal but different paternal parents show a high level of genetic similarity. According to the dendrogram, the F1 genotypes numbered 15 (39 × 28) and 16 (39 × 27), which share the same maternal parent but have different paternal parents, exhibit approximately 80% genetic similarity. Likewise, genotypes 42 (40 × 36) and 43 (40 × 28), which also share the same maternal but different paternal parents, display around 84% genetic similarity.
Despite these findings, when considering that the parental and F1 genotypes show a range of genetic similarity between 43% and 84%, it is clear that there is a high level of genetic variation in chrysanthemum. This is further supported by the distinct placement of the F1 genotype numbered 38 (a hybrid of 40 × 28), which appears on a separate branch, isolated from all other hybrids and parents, showing only 43% similarity with the rest.
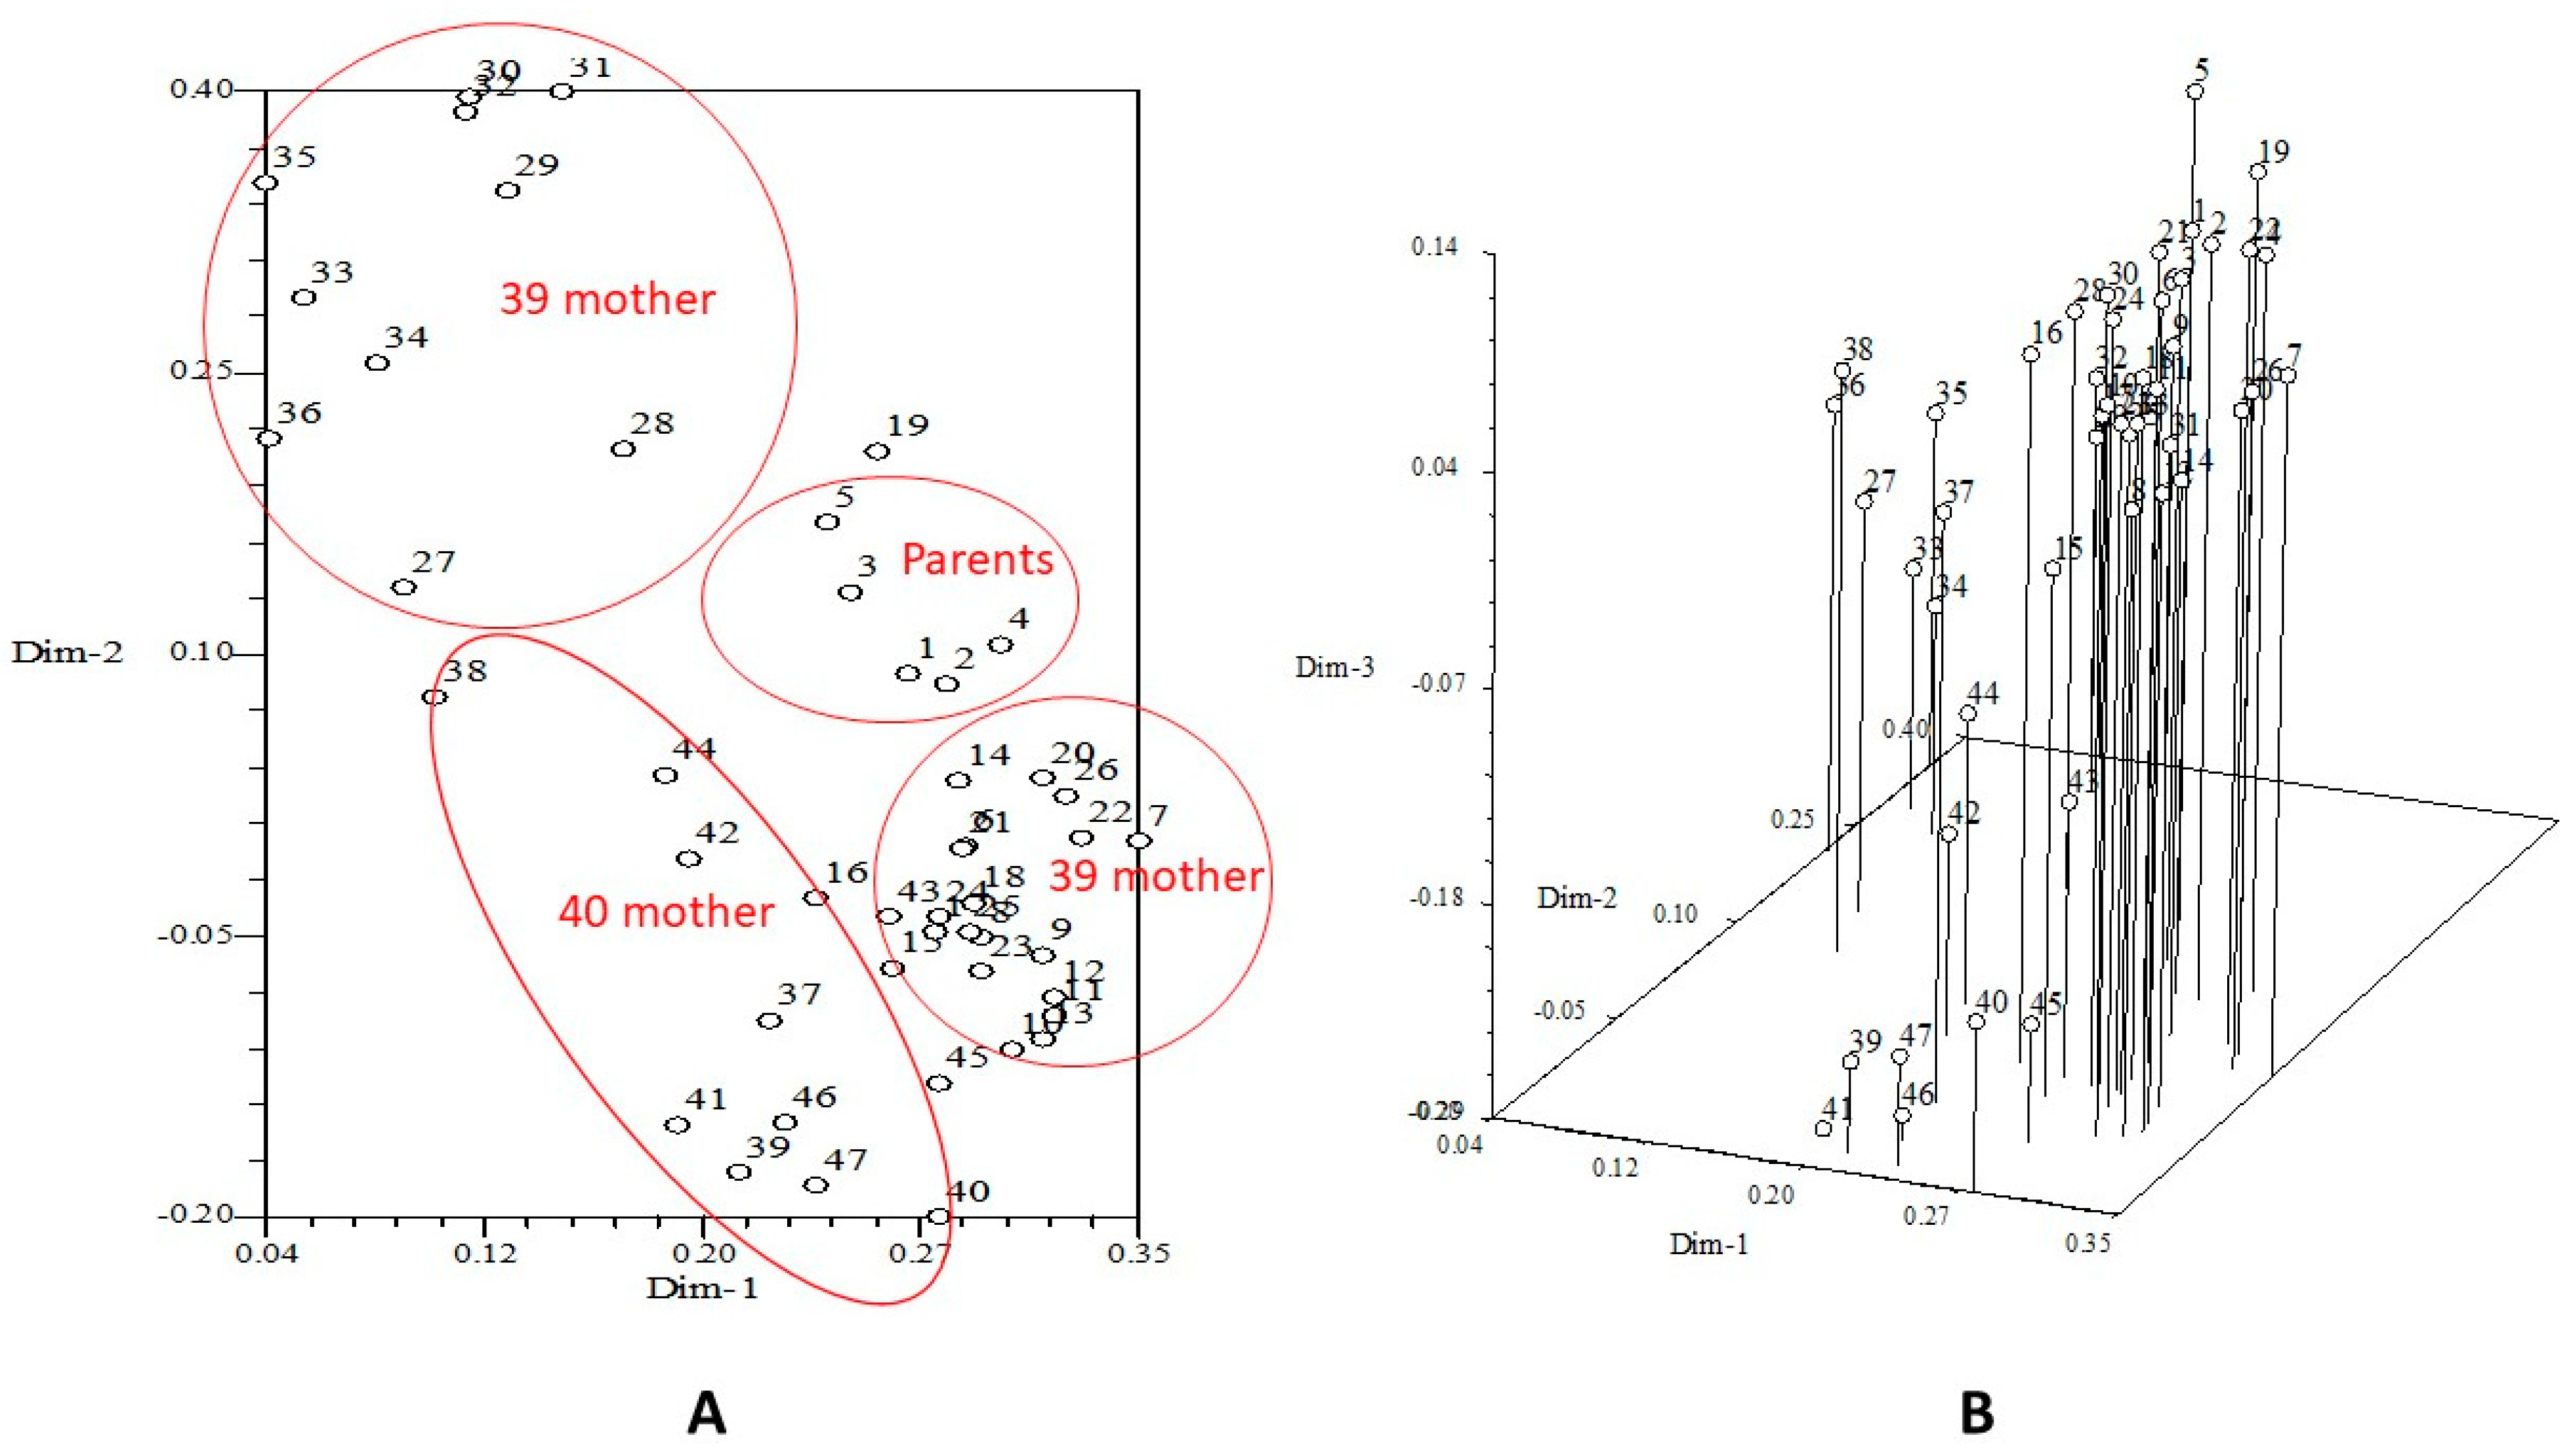
Using primers and other similarity matrices, DNA matrix data were subjected to correlation analysis via the Mantel test in the NTSYS software (version 2.10). There was a significant Mantel association found (r = 0.99682). Using Principal Coordinate Analysis, two- and three-dimensional visualizations were created in the NTSYS software. The two- and three-dimensional Principal Coordinate Analysis (PCoA) plots show that most genotypes are grouped together. However, the F1 genotypes sharing the same maternal parent are located within the same cluster. The F1 genotypes derived from 39-Together as the maternal parent are distributed into two clusters based on their genetic similarity levels, while the genotypes with 40-Stylist Pink Dark as the maternal parent are grouped within a single cluster (Figure 6).
Many researchers have emphasized that the combined evaluation of morphological traits and molecular markers is beneficial in breeding studies to minimize the effects of environmental factors, to distinguish between varieties and genotypes, or to reveal the resemblance of hybrid plants to their maternal and paternal parents.
Huang et al. [14] investigated three hybrid combinations of chrysanthemum using 24 RAPD primers to assess the genetic similarity between parents and F1 genotypes. In the three chrysanthemum hybrid combinations, it was found that 34.4% to 48.9% of the RAPD markers showed additivity between the parents and F1 genotypes. However, through similarity analysis, they were unable to determine definitively whether the markers in the offspring more closely resembled the female or male parent, attributing this to the highly complex genetic makeup of chrysanthemum. In contrast, in the present study, it is clearly observed that the F1 genotypes resemble their maternal parents. Furthermore, Huang et al. [14] noted that in two hybrid combinations, the parental genotypes were more similar to each other than to their respective offspring. A similar finding was observed in the current study, where the parental genotypes are clustered together within the same group. All these findings support the conclusion that hybridization increases genetic variation.
Genetic diversity in chrysanthemum has been investigated using various molecular markers to date. Although all these molecular methods have been successful in determining genetic diversity with appropriate primer selection, retrotransposon-based iPBS primers exhibit higher polymorphism values and have a greater capacity for identifying heterozygosity. In a study conducted by Mekapogu et al. [13], the genetic diversity of 126 spray-type chrysanthemum cultivars was evaluated using SSR markers. The study reported a strong level of discrimination with an average Polymorphic Information Content (PIC) value of 0.52. The observed average heterozygosity (Ho) was found to be 0.72, indicating substantial genetic differences among the cultivars. When compared to the findings of the present study (PIC: 0.61), it is evident that hybridization efforts significantly enhance genetic variation. In another study, the genetic diversity and similarity levels of 35 garden-type chrysanthemum genotypes from C. morifolium and C. indicum species were examined [18]. It was found that the similarity indices of the genotypes ranged from 0.36 to 0.76 using 11 inter-primer binding site (iPBS) markers. These findings demonstrate the success of iPBS primers in characterizing the chrysanthemum genome.
Olejnik et al. [12], stated that despite belonging to the same group, chrysanthemums exhibit high morphological diversity, making it very difficult to distinguish between genotypes. Therefore, they emphasized the importance of using molecular methods and evaluated the genetic diversity of 97 chrysanthemum cultivars using 14 SSR markers, identifying four distinct groups based on their genetic characteristics. Similarly, in the present study, although the genotypes resemble their maternal parents, they also possess distinct genomic characteristics, and a significant level of genetic variation (43%) was detected. Similarly, in a study conducted on C. morifolium, 10 simple sequence repeat (SSR) markers were used to identify 88 chrysanthemum genotypes. The similarity coefficient was found to range between 0.53 and 0.88. It was determined that wild species and large-flowered cultivars were initially divided into two main clusters, and subsequently, the large-flowered cultivars were grouped into five distinct clusters based on petal type [11]. So far, the high level of diversity within the gene pool has consistently been emphasized. In a study conducted by Kumar [16], RAPD molecular markers were used to characterize the genetic diversity of a population consisting of 38 Indian chrysanthemum cultivars, and the genetic similarity was reported to range between 0.41 and 0.90. Even within a limited number of samples, the presence of high diversity in the chrysanthemum genome highlights the significant extent of variation that can be achieved through hybridization. Significant genetic differences exist even among commercially cultivated chrysanthemum varieties. Martin et al. [15] investigated the characterization of fifteen commercial chrysanthemum cultivars using RAPD molecular markers. The level of genetic similarity among the cultivars was found to range between 0.50 and 0.80.

3.6. Relationship Between Molecular and Morphological Traits

The integration of molecular marker data with morphological trait evaluation represents a critical approach in plant breeding, particularly in complex polyploid species such as chrysanthemum. In the present study, the use of iPBS (inter-Primer Binding Site) markers revealed a high degree of polymorphism (93%) among parental lines and their F1 progenies, indicating substantial genomic variability introduced via intervarietal hybridization. This genomic variability was concurrently reflected in phenotypic divergence among the hybrids, especially in traits such as flowering time, stalk length, flower diameter, and branch weight.
Although a formal statistical correlation, such as Mantel’s test comparing genetic and phenotypic distance matrices, was not conducted, congruence between molecular clustering (UPGMA and PCoA) and morphological trait groupings suggests a partial association between genotypic and phenotypic variation. In particular, the clustering of most F1 individuals with their respective maternal parents in both datasets indicates a potential dominance of maternal inheritance patterns in controlling key ornamental traits. Similar findings were reported by Huang et al. [14], who noted additive marker expression in chrysanthemum F1 hybrids, although without definitive parental assignment due to complex genome structure.
Such correspondence aligns with previous research demonstrating the utility of integrating morphological and molecular markers to elucidate genotype-phenotype relationships [11,18]. For instance, Kazaz et al. [48] observed a phenotypic alignment between molecularly clustered genotypes and morphological performance in hybrid chrysanthemum lines. Moreover, Mekapogu et al. [13] emphasized that combining SSR marker data with trait-based selection enhanced cultivar discrimination efficiency in breeding programs.

4. Conclusions

This study demonstrated the critical role of hybridization breeding in enhancing genetic diversity and improving morphological and agronomic traits in cut chrysanthemum. The successful formation of viable F1 hybrids from six cross-combinations highlighted the potential of selected parental genotypes for inter-varietal hybridization. Significant variation was observed in traits such as flowering time, flower stalk length, flower diameter, and branch weight among the F1 progenies, suggesting the effectiveness of hybridization in creating novel phenotypic combinations.
Molecular characterization using iPBS markers revealed a high level of genetic polymorphism (93%) among parents and F1 hybrids, confirming the genetic divergence introduced through crossbreeding. The clustering of F1 hybrids predominantly with their maternal parents further indicated maternal dominance in genetic inheritance, yet considerable variation was also retained from paternal contributions. These findings were supported by both UPGMA clustering and Principal Coordinate Analyses, underscoring the utility of molecular tools in validating morphological assessments.
Furthermore, the study confirmed the practical applicability of combining morphological evaluation with DNA-based molecular markers to select elite genotypes with desirable horticultural traits. The integration of crossability assessment, phenotypic screening, and molecular data provides a robust foundation for marker-assisted selection (MAS) in chrysanthemum breeding programs. Overall, the results emphasize that strategic parental selection and comprehensive evaluation of hybrid progenies are key to developing superior cultivars with enhanced commercial and ornamental value.

Author Contributions

Conceptualization; E.K. and S.K.; Data Curation; E.K. and S.K.; Formal Analysis; E.K. and E.D.M.; Investigation; E.K., E.D.M. and A.D.Ş.; Software; E.K., E.D.M. and A.D.Ş.; Supervision; S.K. Writing—Original Draft Preparation; E.K. and E.D.M.; Writing—Review and Editing: E.K., E.D.M. and S.K. All authors have read and agreed to the published version of the manuscript.

Funding

This research received no external funding.

Data Availability Statement

The original contributions presented in this study are included in the article. Further inquiries can be directed to the corresponding author.

Acknowledgments

This study is based on the Ph.D. thesis completed in the Department of Horticulture, Faculty of Agriculture, Ankara University. We would like to thank the Office of the Dean for Research at Erciyes University for providing the necessary laboratory equipment and infrastructure at the ArGePark research building.

Conflicts of Interest

The authors declare no conflicts of interest.

References

  1. Mekapogu, M.; Kwon, O.K.; Song, H.Y.; Jung, J.A. Towards the improvement of ornamental attributes in chrysanthemum: Recent progress in biotechnological advances. Int. J. Mol. Sci. 2022, 23, 12284. [Google Scholar] [CrossRef]
  2. Randhava, G.S.; Mukhopadhyay, A. Chrysanthemum. In Floriculture in India; Allied Publishers: Lahore, Pakistan, 1986; pp. 362–367. [Google Scholar]
  3. Hadizadeh, H.; Samiei, S.; Hakeri, A. Chrysanthemum, an ornamental genus with considerable medicinal value: A comprehensive review. S. Afr. J. Bot. 2022, 144, 23–43. [Google Scholar] [CrossRef]
  4. AIPH/Union Fleurs. International Statistics Flowers and Plants 2020; AIPH/Union Fleurs International Flower Trade Association: Ixelles, Belgium, 2021; 226p. [Google Scholar]
  5. Haider, S.; Gao, Y.; Gao, Y. Standardized Genetic Transformation Protocol for Chrysanthemum cv. ‘Jinba’ with TERMINAL FLOWER 1 Homolog CmTFL1a. Genes 2020, 11, 860. [Google Scholar] [CrossRef]
  6. Su, J.; Jiang, J.; Zhang, F.; Liu, Y.; Ding, L.; Chen, S.; Chen, F. Current achievements and future prospects in the genetic breeding of chrysanthemum: A review. Hortic. Res. 2019, 6, 109. [Google Scholar] [CrossRef]
  7. Chong, X.; Su, J.; Wang, F.; Wang, H.; Song, A.; Guan, Z.; Fang, W.; Jiang, J.; Chen, S.; Chen, F.; et al. Identification of favorable SNP alleles and candidate genes responsible for inflorescence-related traits via GWAS in chrysanthemum. Plant Mol. Biol. 2019, 99, 407–420. [Google Scholar] [CrossRef]
  8. Yan, W.; Jung, J.A.; Lim, K.B.; Cabahug, R.A.M.; Hwang, Y. Cytogenetic studies of chrysanthemum: A review. Flower. Res. J. 2015, 4, 242–253. [Google Scholar] [CrossRef]
  9. Li, F.; Zhang, H.; Zhao, H.; Gao, T.; Song, A.; Jiang, J.; Chen, F.; Chen, S. Chrysanthemum Cm HSFA 4 gene positively regulates salt stress tolerance in transgenic chrysanthemum. Plant Biotechnol. J. 2018, 16, 1311–1321. [Google Scholar] [CrossRef] [PubMed]
  10. Jaishreepriyanka, R.; Sinha, S.; Mandal, S.S.; Singh, B.; Rashmi, K. Diversity Analysis of Maize Inbred Lines. Int. J. Curr. Microbiol. Appl. Sci. 2020, 9, 2765–2773. [Google Scholar] [CrossRef]
  11. Luo, C.; Chen, D.; Cheng, X.; Liu, H.; Li, Y.; Huang, C. SSR Analysis of genetic relationship and classification in chrysanthemum germplasm collection. Hortic. Plant J. 2018, 4, 73–82. [Google Scholar] [CrossRef]
  12. Olejnik, A.; Parkitna, K.; Kozak, B.; Florczak, S.; Matkowski, J.; Nowosad, K. Assessment of the Genetic diversity of chrysanthemum cultivars using SSR markers. Agronomy 2021, 11, 2318. [Google Scholar] [CrossRef]
  13. Mekapogu, M.; Lim, S.H.; Choi, Y.J.; Lee, S.Y.; Jung, J.A. Evaluation of Genetic Diversity and Identification of Cultivars in Spray-Type Chrysanthemum Based on SSR Markers. Genes 2025, 16, 81. [Google Scholar] [CrossRef]
  14. Huang, S.C.; Tsai, C.C.; Sheu, C.S. Genetic analysis of Chrysanthemum hybrids based on RAPD molecular markers. Bot. Bull. Acad. Sin. 2000, 41, 257–262. [Google Scholar]
  15. Martin, C.; Uberhuaga, E.; Pérez, C. Application of RAPD markers in the characterisation of Chrysanthemum varieties and the assessment of somaclonal variation. Euphytica 2002, 127, 247–253. [Google Scholar] [CrossRef]
  16. Kumar, S.; Kumar, M.; Yadav, H.K.; Sharma, S. Genetic diversity and population structure analysis of chrysanthemum (Dendranthema grandiflora Tzvelev) germplasm based on RAPD markers. J. Environ. Biol. 2017, 38, 457. [Google Scholar] [CrossRef]
  17. Shao, Q.S.; Guo, Q.S.; Deng, Y.M.; Guo, H.P. A comparative analysis of genetic diversity in medicinal Chrysanthemum morifolium based on morphology, ISSR and SRAP markers. Biochem. Syst. Ecol. 2010, 38, 1160–1169. [Google Scholar] [CrossRef]
  18. Dalda-Sekerci, A. Comprehensive assessment of genetic diversity in chrysanthemum germplasm using morphological, biochemical and retrotransposon-based molecular markers. Genet. Resour. Crop Evol. 2023, 70, 2321–2336. [Google Scholar] [CrossRef]
  19. Kalendar, R.; Flavell, A.J.; Ellis, T.H.N.; Sjakste, T.; Moisy, C.; Schulman, A.H. Analysis of plant diversity with retrotransposon-based molecular markers. Heredity 2011, 106, 520–530. [Google Scholar] [CrossRef]
  20. Kalendar, R.; Schulman, A.H. Transposon-Based Tagging: IRAP, REMAP, and iPBS. In Molecular Plant Taxonomy: Methods and Protocols; Besse, P., Ed.; Humana Press: Totowa, NJ, USA, 2013; pp. 233–255. [Google Scholar] [CrossRef]
  21. Tuna, M.; Cabi, E. Bazı Buğdaygil yem Bitkisi Türlerine ait Populasyonların Çekirdek DNA Içeriklerinin Flow Sitometri Yöntemiyle Belirlenmesi ve Ploidy Analizi ile tür Teşhisinde Kullanımı. 2014. Available online: https://acikerisim.nku.edu.tr:8080/xmlui/handle/20.500.11776/2119 (accessed on 21 January 2020).
  22. Eti, S. Çiçek tozu miktarını belirlemede kullanılan pratik bir yöntem. Çukurova Üniv. Ziraat Fak. Derg. 1990, 5, 49–58. [Google Scholar]
  23. Eti, S. Bazı meyve tür ve çeşitlerinde değişik in vitro testler yardımıyla çiçek tozu canlılık ve çimlenme yeteneklerinin belirlenmesi. Çukurova Üniv. Ziraat Fak. Derg. 1991, 6, 69–80. (In Turkish) [Google Scholar]
  24. Meral, E.D.; Kırbay, E.; Haspolat, G.; Kazaz, S. Evaluation of pollen vivability in some spray Chrysanthemum varieties on storage period. Ornam. Hortic. 2024, 30, e242740. [Google Scholar] [CrossRef]
  25. Yang, J.; Endo, M. In vitro germination and viability of Dendranthema Pollen. Asian J. Plant Sci. 2005, 4, 673–677. [Google Scholar] [CrossRef]
  26. Anderson, N. Chrysanthemum (Dendranthema x grandiflora Tzvelz.). In Flower Breeding and Genetics; Springer: Berlin/Heidelberg, Germany, 2007; pp. 389–437. [Google Scholar]
  27. Wang, X.G.; Wang, H.; Chen, F.; Jiang, J.; Fang, W.; Liao, Y.; Teng, N. Factors affecting quantity of pollen dispersal of spray cut chrysanthemum (Chrysanthemum morifolium). BMC Plant Biol. 2014, 14, 5. [Google Scholar] [CrossRef]
  28. Boeder, M. (Armada Young Plants BV. Nieuwveens Jaagpad 47, 2441 EK Nieuwveen The Netherlands). Oral communication, 2020.
  29. Post, A. (Deliflor Chrysanthemum B.V., Postbus 77, 2676 ZH Maasdijk, The Netherlands). Oral communication, 2017.
  30. Carvalho, S.M.P. Effects of Growth Conditions on External Quality of Cut Chrysanthemum; Analysis and Simulation. Ph.D. Thesis, Wageningen University and Research, Wageningen, The Netherlands, 2003. [Google Scholar]
  31. National Agriculture and Food Research Organization. Dus Test for Chrysanthemum Naktuinbouw and NCSS(/NARO). 2022. Available online: https://www.naro.go.jp/publicity_report/publication/files/Chrysanthemum_calibration_manual_formalized.pdf (accessed on 10 October 2022).
  32. Doyle, J.J.; Doyle, J.L. A rapid DNA isolation procedure for small quantities of fresh leaf tissue. Phytochem. Bull. 1987, 19, 11–15. [Google Scholar]
  33. Dice, L.R. Measures of the amount of ecologic association between species. Ecology 1945, 26, 297–302. [Google Scholar] [CrossRef]
  34. Guo, X.; Luo, C.; Wu, Z.; Zhang, X.; Cheng, X.; Huang, C. Polyploidy levels of Chinese large-flower chrysanthemum determined by flow cytometry. Afr. J. Biotechnol. 2012, 11, 7789–7794. [Google Scholar] [CrossRef]
  35. Chang, L.I.; Chen, S.M.; Chen, F.D.; Zhen, L.I.; Fan, W.M. Karyomorphological studies on chinese pot Chrysanthemum cultivars with large inflorescences. Agric. Sci. China 2009, 8, 793–802. [Google Scholar] [CrossRef]
  36. Abd El-Twab, M.H.; Kondo, K. Hybridity and relationship between Chrysanthemum shiwogiku Kitam. and C. Vestitum (Hemsl.) Stapf. Chromosome Bot. 2009, 4, 65–70. [Google Scholar] [CrossRef]
  37. Shibata, M. Importance of genetic transformation in ornamental plant breeding. Plant Biotechnol. 2008, 25, 3–8. [Google Scholar] [CrossRef]
  38. Xu, Y.; Chen, F.; Chen, S.; Teng, N.; Li, F. Seed set of inbred, meiosis and pollen capacity of 5 Chrysanthemum cultivars. Acta Bot. Boreali-Occident. Sin. 2009, 29, 469–474. [Google Scholar]
  39. Zhu, P.; Liu, N.; Zhou, Z.; Song, W.; Mao, H. Different pollination method on improving the self-compatibility and cross-compatibility in cut-flower Chrysanthemum. Chin. Agric. Sci. Bull. 2011, 27, 114–118. [Google Scholar]
  40. Zhang, Y.; Wang, C.; Ma, H.; Dai, S. Assessing the genetic diversity of chrysanthemum cultivars with microsatellites. J. Am. Soc. Hortic. Sci. 2013, 138, 479–486. [Google Scholar] [CrossRef]
  41. Mekapogu, M.; Song, H.; Lim, S.; Jung, J. Assessment of genetic diversity in the white-colored variants of spray-type chrysanthemum cultivars using ssr markers. Horticulturae 2023, 9, 798. [Google Scholar] [CrossRef]
  42. Kim, S.; Lee, H.; Park, C.; Kim, D.; Kim, J.; Kim, S.; Jin Jeong, K.; Pak, H.; Jung, J.A.; Kim, T. Assessing amounts of genetic variability in key horticultural traits underlying core Korean breeding lines of cut chrysanthemums. Plants 2024, 13, 577. [Google Scholar] [CrossRef] [PubMed]
  43. Li, Q.; Jiang, W.; Ren, Y.; Chen, R.; Xing-lian, L.; Yang, Y.; Wu, H. In vitro cloning potential and phytochemical evaluations of aneuploid individuals produced from reciprocal crosses between diploid and triploid in Echinacea purpurea L. Acta Soc. Bot. Pol. 2017, 86, 3556. [Google Scholar] [CrossRef]
  44. Zhang, Y.; Dai, S.; Hong, Y.; Song, X. Application of genomic SSR locus polymorphisms on the identification and classification of chrysanthemum cultivars in China. PLoS ONE 2014, 9, e104856. [Google Scholar] [CrossRef] [PubMed]
  45. Zhao, H.B.; Chen, F.D.; Fang, W.M. Pollen germination in vitro of Chrysanthemum cultivars with small inflorescences and several species of Dendranthema. J. Nanjing Agric. Univ. 2005, 28, 22–27. [Google Scholar]
  46. Wang, F.; Zhong, X.; Wang, H.; Song, A.; Chen, F.; Fang, W.; Jiang, J.; Teng, N. Investigation of differences in fertility among progenies from self-pollinated Chrysanthemum. Int. J. Mol. Sci. 2018, 19, 832. [Google Scholar] [CrossRef]
  47. Dursun, H.B.; Kazaz, S.; Kılıç, T. Farklı sıcaklık ve sürelerde bekletilen kasımpatı polenlerinde polen kalitesinin belirlenmesi. Iğdır Üniv. Fen Bilim. Enst. Derg. 2023, 13, 2303–2314. (In Turkish) [Google Scholar] [CrossRef]
  48. Kazaz, S.; Yanmaz, R.; Karagüzel, Ö.; Haspolat, G. Melezleme Islahı ile Kesme Çiçek Kasımpatı Çeşitlerinin Geliştirilmesi ve Sektöre Kazandırılması; Proje No: 119O082; TÜBİTAK ULAKBİM TR Dizin: Ankara, Turkey, 2023. (In Turkish) [Google Scholar]
  49. Sun, C.; Huang, Z.; Wang, Y.; Chen, F.; Teng, N.; Fang, W.; Liu, Z. Overcoming pre-fertilization barriers in the wide cross between chrysanthemum grandiflorum (ramat.) kitamura and c. nankingense (nakai) tzvel. by using special pollination techniques. Euphytica 2010, 178, 195–202. [Google Scholar] [CrossRef]
  50. Xu, L.; Liu, C.L.; Wang, H.D.; Chen, K.L. Study on the pollen viability and stigma receptivity of Chrysanthemum morifolium ‘Fubaiju’. Zhong yao cai J. Chin. Med. Mater. 2012, 35, 1546–1550. [Google Scholar]
  51. Miler, N.; Wozny, A. Effect of pollen genotype, temperature and period of storage on in vitro germinability and in vivo seed set in chrysanthemum—Preliminary study. Agronomy 2021, 11, 2395. [Google Scholar] [CrossRef]
  52. Jie, Y.; Ziran, S.; Mingfang, Y.; Deying, L.; Yubin, N. The breeding of early-blossoming cut Chrysanthemum (Dendranthema morifolium Tzvcl.). Acta Hortic. 1995, 404, 131–138. [Google Scholar] [CrossRef]
  53. Anderson, N.O.; Ascher, P.D. Inheritance of seed set, germination, and day neutrality/heat delay insensitivity of garden Chrysanthemums (Dendranthema x grandiflora) under glasshouse and field conditions. J. Am. Soc. Hortic. Sci. 2004, 129, 509–516. [Google Scholar] [CrossRef]
  54. Miler, N.; Kulus, D. Effect of parental components and pollination frequency on the setting and germination of Chrysanthemum seeds. Horticulturae 2022, 8, 827. [Google Scholar] [CrossRef]
  55. Deng, Y.; Teng, N.; Chen, S. Reproductive barriers in the intergeneric hybridization between Chrysanthemum grandiflorum (Ramat.) Kitam. and Ajania przewalskii Poljak. (Asteraceae). Euphytica 2010, 174, 41–50. [Google Scholar] [CrossRef]
  56. Deng, Y.; Jiang, J.; Chen, S.; Teng, N.; Song, A.; Guan, Z.; Chen, F. Combination of multiple resistance traits from wild relative species in chrysanthemum via trigeneric hybridization. PLoS ONE 2012, 7, e44337. [Google Scholar] [CrossRef] [PubMed]
  57. Sun, C.Q.; Chen, F.D.; Teng, N.J.; Liu, Z.L.; Fang, W.M.; Hou, X.L. Factors affecting seed set in the crosses between Dendranthema grandiflorum (Ramat.) Kitamura and its wild species. Euphytica 2010, 171, 181–192. [Google Scholar] [CrossRef]
  58. Kim, H.; Seong, J.; Han, Y.Y.; Choi, D.J.; Woo, J. Breeding of a new light pink spray-mum ‘Noble ND’ as cut flower. Korean J. Hortic. Sci. Technol. 2010, 28, 895–898. [Google Scholar]
  59. Hwang, J.C.; Chin, Y.D.; Kim, J.K.; Kim, S.K. A new early flowering, spray Crysanthemum cultivar for cut flower, “Green witch” with pompon type and green petals. Korean J. Breed. Sci. 2009, 41, 529–533. [Google Scholar]
  60. Hwang, J.C.; Chin, Y.D.; Chung, Y.M.; Kim, S.K.; Ro, C.W.; Jeong, B.R. A new spray Chrysanthemum cultivar, ’Blue Hope’with anemone type and white petals for cut flower. Hortic. Sci. Technol. 2013, 31, 123–127. [Google Scholar]
  61. Lim, J.H.; Shin, H.K.; Park, S.K.; Cho, H.R.; Rhee, H.K.; Kim, M.S.; Joung, H.Y. A new spray chrysanthemum cultivar, “Cherry Blossom” with resistant to white rust, single flower type and bright pink petals for cut flower. Korean J. Breed. Sci. 2008, 40, 439–442. [Google Scholar]
  62. Lang, A. Physiology of flower initiation. Encycl. Plant Physiol. 1965, 15, 1380–1444. [Google Scholar]
  63. Karlsson, M.G.; Heins, R.D. Influence of temperature on growth and development of chrysanthemum. J. Am. Soc. Hortic. Sci. 1994, 119, 438–445. [Google Scholar]
  64. Cockshull, K.E. Environmental control of flower initiation in chrysanthemum. Acta Hortic. 1985, 174, 73–80. [Google Scholar]
  65. Armitage, A.M.; Laushman, J.M. Specialty Cut Flowers: The Production of Annuals, Perennials, Bulbs, and Woody Plants for Fresh and Dried Cut Flowers; Timber Press: Portland, OR, USA, 2003; ISBN 9780881922257. [Google Scholar]
  66. Anonymous. Dekkerchrysanten. 2023. Available online: https://dekkerchrysanten.com (accessed on 5 September 2023).
  67. Anonymous. Deliforchrysanten. 2023. Available online: https://www.delishow.nl (accessed on 5 September 2023).
  68. Anonymous. Royalvanzanten. 2023. Available online: https://www.royalvanzanten.com/en/product-category/cut-flowers/ (accessed on 5 September 2023).
  69. Anonymous. Dummenorange. 2023. Available online: https://emea.dummenorange.com/app/en/products/netherlands?category=Cut%20Flowers&productgroup=Cut%20Chrysanthemum&surplus (accessed on 5 September 2023).
  70. De Jong, J. Selection for wide temperature adaptation in Chrysanthemum morifolium. Neth. J. Agric. Sci. 1978, 26, 110–118. [Google Scholar] [CrossRef]
  71. Mulford, F.L. Result of selfing twenty-four early blooming Chrysanthemums. Proc. Am. Soc. Hortic. Sci. 1937, 35, 818–821. [Google Scholar]
  72. Jung, Y.K.; Lim, J.W.; Kim, S.K.; Lee, Y.S.; Yu, Y.Y. A new spray Chrysanthemum cultivar, ’Dream Water’with single type for cut flower. Hortic. Sci. Technol. 2012, 30, 220–223. [Google Scholar] [CrossRef]
  73. Carvalho, S.M.P.; Heuvelink, E. Influence of greenhouse climate and plant density on external quality of chrysanthemum (Dendranthema grandiflorum (Ramat.) Kitamura): First steps towards a quality model. J. Hortic. Sci. Biotechnol. 2001, 76, 249–258. [Google Scholar] [CrossRef]
  74. Zhang, C.; Mao, H.; Wu, D.; Liu, Y.; Yang, Q.; Deng, B.; Chen, F. Climatic heterogeneity in a large chrysanthemum greenhouse resolved by a LoRa-based wireless sensor network. Sci. Hortic. 2025, 344, 114109. [Google Scholar] [CrossRef]
Figure 1. Steps of hybridization in Chrysanthemum morifolium. (A) Pollen collection from male parent (B,C) Emasculation of the seed parent. (D) Hybridization. (E) The buds are dusted. (F) Mature fruit. (G) Removing seeds from the fruit. (H) Sowing the seeds. (I) Germinating seeds. (J) F1 genotypes. (K) The progeny of Together × Raisa Dark.
Horticulturae 11 01101 g001aHorticulturae 11 01101 g001b
Figure 2. Pollen viability and germination rates of Chrysanthemum morifolium varieties used as paternal parents, The difference between the means shown with different letters in the same column is significant at p < 0.05 level.
Horticulturae 11 01101 g002
Figure 3. Correlations between total seed number, total seed weight, average seed number per flower head, and germinating seed rate in Chrysanthemum morifolium (TSN: Total seed number, SNpF: Seed number per flower; TSW: Total seed weight (g), SG: Seed germination rate).
Horticulturae 11 01101 g003
Figure 4. The similarity dendrogram was obtained as a result of the clustering analysis carried out considering the morphological characteristics of Chrysanthemum morifolium parents and progenies (FT: Flowering time, RT: response time, FSL: Flower stalk length, FST: Flower Stalk Thickness, WB: The width of the bud, NL: Number of leaves, NF: Number of flowers, BW: Branch weight, NRFP: Number of ray flower of the flower stalk, NROF: Number of ray flower).
Horticulturae 11 01101 g004
Figure 5. The UPGMA analysis based on Jacard coefficients of iPBS markers from the 47 Chrysanthemum morifolium genotypes.
Horticulturae 11 01101 g005
Figure 6. Two-dimensional (A) and three-dimensional (B) graphics obtained as a result of Principal Coordinate Analysis with iPBS data in 47 Chrysanthemum morifolium genotypes.
Horticulturae 11 01101 g006
Table 1. Some morphological traits of Chrysanthemum morifolium parents.
VarietiesFTRTFSLFSTWBNFBWNRFSNPNLColor
Barolo6049864.55.056.062.02.033.025.0Red
Chic60491044.84.787.075.02.031.026.0White
Raisa Dark6049913.56.0011.059.02.027.021.0Bicolor (Orange-Yellow)
Together6049935.55.308.074.02.026.027.0Bicolor (Pink-White)
Stylist Pink Dark63521014.49.1010.077.02.032.028.0Bicolor (Pink-White)
FT: Flowering time (day), RT: Response time (day), FSL: Flower stalk length (cm), FST: Flower stalk thickness (mm), WB: Width of the bud (cm), NF: Number of flowers, BW: Branch weight (g), NRFS: Number of ray flower of the flower stalk, NP: Number of petals, NL: Number of leaves, C: The color of flower.
Table 2. Nuclear DNA contents and ploidy levels of Chrysanthemum morifolium genotypes.
VarietiesSample PeakStandard PeakAmount of DNADNA (pg/2C)Level of Ploidy
Together200.37113.2816.6518.842n = 6x = 54
Stylist Pink Dark214.96121.7916.6518.802n = 6x = 54
Barolo203.92118.6916.6518.302n = 6x = 54
Chic229.61122.816.6519.912n = 6x = 54
Raisa Dark200.35111.2816.6519.172n = 6x = 54
Table 3. Total seed number, total seed weight, average seed number per flower head, and germinating seed rate of Chrysanthemum morifolium cultivar according to hybrid combinations.
CombinationTotal Seed
Number
Average Seed Number per Flower HeadTotal Seed Weight (g)Germination of Seed (%)
Together × Barolo52332093.392.69
Together × Chic49611982.833.93
Together × Raisa Dark36801473.095.92
Stylist Pink Dark × Barolo 72262892.136.38
Stylist Pink Dark × Chic47721912.6110.73
Stylist Pink Dark × Raisa Dark45191812.259.58
Table 4. Some qualitative and quantitative traits of Chrysanthemum morifolium progeny.
Hybrid CombinationFT
(day)
RT
(day)
FSL
(cm)
FST
(mm)
BW
(g)
NLWB
(cm)
NFNRFNRFP
Together × Barolo70.75 ± 0.65 a59.75 ± 0.65 a86.60 ± 3.39 b5.57 ± 0.23
a
58.68 ± 3.38 ab22.58 ± 0.93 a5.48 ± 0.16 ab9.68 ± 0.48 a2.25 ± 0.16 a32.97 ± 2.48 ab
Together × Chic69.20 ± 0.78
ab
57.98 ± 0.80 ab98.73 ± 2.10 ab5.48 ± 0.18 ab66.10 ± 4.43 a24.99 ± 0.87 a5.54 ± 0.31 ab11.77 ± 1.28 a1.99 ± 0.10 a25.19 ± 0.81 c
Together × Raisa Dark70.95 ± 1.72
a
59.81 ± 1.71 a93.97 ± 2.40 ab5.17 ± 0.26 ab54.58 ± 3.48 b23.30 ± 0.76 a4.85 ± 0.15
b
11.10 ± 0.64 a2.13 ± 0.15 a26.86 ± 0.91 c
Stylist Pink Dark × Barolo 68.71 ± 0.75
ab
57.52 ± 0.80 ab93.21 ± 3.60 ab4.92 ± 0.15 ab57.33 ± 3.36 ab24.81 ± 1.20 a6.05 ± 0.22 a9.42 ± 0.62 a2.70 ± 0.28 a37.67 ± 1.89 a
Stylist Pink Dark × Chic68.89 ± 1.09
ab
56.44 ± 1.95 ab111.54 ± 2.31 a4.78 ± 0.14
b
65.67 ± 3.47 a24.65 ± 1.67 a6.13 ± 0.30
a
9.55 ± 0.50
a
2.11 ± 0.20 a30.87 ± 3.70 bc
Stylist Pink Dark × Raisa Dark65.80 ± 1.91
b
54.66 ± 1.80 b90.09 ± 1.44 ab5.16 ± 0.28 ab55.97 ± 6.01 ab23.83 ± 0.96 a5.64 ± 0.28 ab10.03 ± 0.94 a2.55 ± 0.24 a34.19 ± 1.91 ab
FT: Flowering time, RT: Response time, FSL: Flower stalk length, FST: Flower stalk thickness, WB: The width of the bud, NL: Number of leaves, NF: Number of flowers, BW: Branch weight, NRFP: Number of ray flower of the flower stalk, NRF: Number of ray flower, Mean values designated with the same letter were not significantly different (p ˂ 0.05).
Table 5. Polymorphism values of studied iPBS primers in Chrysanthemum morifolium.
PrimarySequence 5′–3′BpTNFNPFMP (%)PICpqNeIHeuHe
iPBS-2252TCATGGCTCATGATACCA175–100022221000.590.4190.5811.8130.6240.4360.441
iPBS-2221ACCTAGCTCACGATCA150–1100151493.330.650.3950.6051.6920.5650.3890.393
iPBS-2270ATCCTGGCAATGGAACCA160–99016161000.480.5040.4961.8110.6300.4400.445
iPBS-2272GGCTCAGATGCCA100–1200171588.240.570.4790.5211.6390.5060.3510.355
iPBS-2376TAGATGGCACCA100–1090171376.470.670.4540.5461.3720.3720.2390.242
iPBS-2239ACCTAGGCTCGGATGCCA110–70011111000.860.2420.7581.4450.4140.2660.269
iPBS-2399AAACTGGCAACGGCGCCA150–100015151000.600.4170.5831.7970.6240.4350.440
iPBS-2383GCATGGCCTCCA150–140027271000.490.4780.5221.8950.6600.4690.474
Total--140133--------
Mean-100–140017.516.693.810.6140.4240.5771.6830.5490.3780.382
Bp: Base pairs, TNF: Total Number of Fragments, NPF; Number of Polymorphic Fragments, MP: Mean Polymorphism, PIC: Polymorphic Information Content, p and q: Allele Frequency, Ne: Number of Effective Alleles, I: Shannon’s Information Index, He: Expected Heterozygosity and uHe: Unbiased Expected Heterozygosity.
Disclaimer/Publisher’s Note: The statements, opinions and data contained in all publications are solely those of the individual author(s) and contributor(s) and not of MDPI and/or the editor(s). MDPI and/or the editor(s) disclaim responsibility for any injury to people or property resulting from any ideas, methods, instructions or products referred to in the content.