Article

Transcriptomics and Metabolomics Revealed Genes Associated with the Formation of Different Fruit Colors in Fragaria pentaphylla

College of Horticulture, Jilin Agricultural University, Changchun 130118, China
*
Authors to whom correspondence should be addressed.
These authors contributed equally to this work.
Horticulturae 2025, 11(9), 1097; https://doi.org/10.3390/horticulturae11091097
Submission received: 19 August 2025 / Revised: 4 September 2025 / Accepted: 9 September 2025 / Published: 10 September 2025
(This article belongs to the Section Genetics, Genomics, Breeding, and Biotechnology (G2B2))

Abstract

Fragaria pentaphylla, a unique wild strawberry species in China, is rich in various fruit colors and a valuable resource for studying color genes. Fruits of different colors from F. pentaphylla were selected as the experimental material. Liquid chromatography-mass spectrometry (LC-MS) and high-throughput RNA sequencing (RNA-seq) were employed to identify key genes responsible for the development of different fruit colors. Metabolite analysis revealed that 3249 metabolites were detected, including nine differential metabolites related to anthocyanin synthesis and five biological pathways. Additionally, an analysis combining transcriptome and metabolome data showed that the structural genes FpDFR, FpCHS, FpCHI, and FpUFGT were upregulated in red fruit, with significantly higher expression levels compared to pink and white fruits, actively promoting anthocyanin production in red fruit. Conversely, genes FpANR and FpLAR were upregulated in white fruit, enhancing catechin synthesis and inhibiting anthocyanin formation. The gene FpPAL was upregulated in pink fruit. Transcription factors FpbHLH18, FpMYB1, FpMYB24, and FpMYB114 collaborate with structural genes to enhance the synthesis of anthocyanins in red fruit. The findings improve our understanding of the molecular mechanisms that control anthocyanin production in F. pentaphylla. The identified key candidate genes may be utilized in the molecular breeding of strawberries.

1. Introduction

Strawberries are highly valued and popular worldwide because they are rich in nutrients and bioactive compounds and have a unique flavor [1]. After years of relentless effort, strawberry colors have gradually become more diverse, with white strawberries gaining popularity among consumers due to their uniqueness. However, red strawberries remain the primary market color today [2]. F. pentaphylla is a wild diploid species indigenous to southwest China [3]. It exhibits three natural morphs: red, pink, and white fruit, with the white-fruit genotype especially notable for its sweetness and delicious juice. Its rich color and unique aroma make it a valuable breeding material and a potential model plant for molecular function research [4].
The quality evaluation of strawberries includes intrinsic qualities such as aroma, sugar content, acidity, and external attributes such as fruit size, shape, and color. Among them, fruit color is a key parameter for assessing strawberry quality [5]. The red, pink, and blue colors of berry fruits are mainly due to the accumulation of anthocyanins, which are significant water-soluble natural pigments classified as flavonoids [6,7]. These pigments are produced via the flavonoid pathway, which regulates numerous structural and regulatory processes genes [8]. Anthocyanin biosynthesis consists of a series of enzymatic reactions facilitated by various structural gene products. For example, chalcone synthase (CHS), chalcone isomerase (CHI), and flavonoid 3-O-glycosyltransferase (UFGT) [9]. Meanwhile, structural genes are synergistically regulated by the transcription factor containing MBW (MYB, bHLH, and WD40) [10].
Recent advances have been made in identifying the various pigment compounds in strawberry fruits and understanding the genes and mechanisms that regulate pigment accumulation through the biosynthesis pathway [11,12,13,14,15]. The primary anthocyanins in strawberries come from pelargonidin (Pg) and cyanidin aglycones (Cya). The dominant pigment in red and pink fruits of Fragaria × ananassa Duch is pelargonidin-3-glucoside [16,17]. Similarly, the main types of anthocyanins in Fragaria vesca red fruit, cyanidin-3-O-glucoside (Cy3G) and pelargonidin-3-O-glucoside (Pg3G), are also present in F. × ananassa [18]. Although many studies have examined strawberry fruit color, particularly the anthocyanin biosynthesis pathway, few reports address the coloration differences among the three fruit colors of the same species.
The emergence of advanced instruments like HPLC and LC-MS has enabled the simultaneous analysis of these two omics. This analysis has been thoroughly executed to investigate metabolic pathways and regulatory genes in horticultural plants, encompassing species such as Actinidia chinensis [19], Prunus persica [20], and Camellia sinensis [21]. Specifically, transcript and metabolite datasets have undergone a multifaceted integration process encompassing correlation and clustering analyses, ultimately forming intricate connection networks between genes and metabolites across diverse plant taxa. This study investigated the metabolic basis of fruit color changes in F. pentaphylla and the anthocyanin biosynthesis pathway (ABP) at the transcriptomic and metabolomic levels. Using Illumina sequencing technology (RNA-seq), we examined the transcriptional expression patterns of genes related to fruit color in F. pentaphylla. Additionally, LC-MS was used to identify and measure flavonoid compounds. We identified regulatory genes related to anthocyanin metabolites by constructing a metabolite-transcript association network. This study uncovered the detailed physiological processes and molecular mechanisms involved in anthocyanin biosynthesis and regulation in F. pentaphylla fruits, providing a strong basis for future investigations.

2. Materials and Methods

2.1. Plant Materials

The F. pentaphylla plants used in this study grow on the southern slopes of the Qinling Mountains, within Mian County, Hanzhong City, Shaanxi Province (latitude 33°11′52–33°23′42″ N, longitude 106°38′57″–107°20′10″ E). These plants were cultivated in the ‘Wild Strawberry Resource Nursery’ at Jilin Agricultural University using stolon propagation to ensure that each fruit color had at least 100 plants. During the fruit maturation period, all red fruits (RF), pink fruit (PF), and white fruit (WF) were collected, immediately frozen in liquid nitrogen, and stored at −80 °C for later use (Figure 1).

2.2. Metabolomic Analysis

Three types of fruit samples (red, pink, and white) of F. pentaphylla were stored at −80 °C, freeze-dried under vacuum, and ground into powder. An amount of 100 mg of the powder was dissolved in 1.0 mL of the extraction solution (MeOH:ACN:H2O, 2:2:1 (v/v)). The extraction solution contains deuterated internal standards. The mixed solution was vortexed for 30 s. After entirely dissolving the sample, it was stored in a 4 °C refrigerator overnight and vortexed thrice at regular intervals during incubation. The solution was then removed and centrifuged at 10,000 rpm for 10 min. The supernatant was filtered through a 0.22 μm microporous membrane and stored in a sample vial for LC-MS/MS analysis. This was repeated with each group of samples eight times.
Using the mzCloud and Chemspider databases, the original mass spectrometry file (.raw) was imported into Compound Discoverer 3.0 (CD) software for spectrum processing and database searching, producing qualitative and quantitative metabolite data. Additionally, this study employed partial least squares discriminant analysis (PLS-DA) and principal component analysis (PCA) to analyze and validate differences and the reliability of metabolites across samples. To identify differential metabolites, significant thresholds included a variable importance in projection (VIP) > 1, a fold change (FC) > 2, or an FC < 0.5 at a p < 0.05 [22]. Then, the differential metabolites were mapped to the Kyoto Encyclopedia of Genes and Genomes (KEGG) database for enrichment analysis and pathway identification.

2.3. Transcriptome Analysis

2.3.1. Construction of cDNA Library and Sequencing of the Transcriptome

Total RNA was isolated following the manufacturer’s instructions using Trizol reagent (Invitrogen, Carlsbad, CA, USA). The quantity and purity of the RNA were evaluated with an Agilent 2100 Bioanalyzer and the RNA 6000 Nano LabChip Kit (Agilent Technologies, Santa Clara, CA, USA). Samples with an RNA Integrity Number (RIN) of 7.0 or above were selected for subsequent analysis. mRNA was then enriched using Oligo(dT) (Thermo Fisher, San Diego, CA, USA) beads and broken into smaller fragments with a fragmentation buffer. Reverse transcription of these fragments was carried out with random primers, and second-strand cDNA synthesis was performed using a buffer, deoxynucleoside triphosphates, RNase H, and DNA Polymerase I. The resulting cDNA fragments were purified with AMPure XP beads [23]. Then, AMPure XP beads were used for fragment selection, and PCR amplification was carried out to generate the final sequencing library. In total, nine libraries were prepared from PCR-amplified cDNA, with three biological replicates each, labeled as RF1, RF2, RF3, PF1, PF2, PF3, WF1, WF2, and WF3, for subsequent RNA-seq analysis. The RNA-Seq libraries were assembled and analyzed on the Illumina Novaseq 6000 platform (LC-Bio Technology Co., Ltd., Hangzhou, China) by LC BIO.

2.3.2. DEG Analysis

The raw sequencing read data were processed with the Cutadapt (https://cutadapt.readthedocs.io/en/stable/, accessed on 8 July 2019, version: cutadapt-1.9) software to generate high-quality, clean data sequences. Subsequently, HISAT2 (https://daehwankimlab.github.io/hisat2/, accessed on 8 July 2019, version: hisat2-2.2.1) package aligned the F. pentaphylla sequencing data to the F. vesca reference gene sequence set [24]. The mapped reads of each sample were assembled using StringTie (http://ccb.jhu.edu/software/stringtie/, accessed on 8 July 2019, version: stringtie-2.1.6) with default parameters. Subsequently, all sample transcriptome data were merged using the Gffcompare software (http://ccb.jhu.edu/software/stringtie/gffcompare.shtml, accessed on 8 July 2019, version: gffcompare-0.9.8) to reconstruct the complete transcriptome map and compare it with public databases. The reference databases included Kyoto Encyclopedia of Genes and Genomes (KEGG) database (http://www.kegg.jp/kegg, 2017.10, accessed on 8 July 2019), Gene Ontology (GO) database (http://geneontology.org, accessed on 8 July 2019), Genome database (ftp://ftp.bioinfo.wsu.edu/species/Fragaria_vesca/Fvesca-genome.v4.0.a1/, accessed on 8 July 2019), mRNA database (ftp://ftp.bioinfo.wsu.edu/species/Fragaria_vesca/Fvesca-genome.v4.0.a1/, accessed on 8 July 2019). After the final transcriptome was generated, StringTie and ballgown (http://www.bioconductor.org/packages/release/bioc/html/ballgown.html, accessed on 8 July 2019) were used to estimate the expression levels of all transcripts and perform expression abundance for mRNAs by calculating the FPKM (fragments per kilobase of transcript per million mapped reads) value [25,26]. Differentially expressed unigenes were identified using the R (3.2.5) package edgeR [27], applying the criteria of |log2foldchange| ≥ 1 and statistical significance (FDR < 0.05). A cluster heat map was generated based on the expression levels of differentially expressed genes to illustrate the expression patterns among the three types of fruit in F. pentaphylla. The selected differentially expressed genes were analyzed with GO enrichment and KEGG enrichment to identify gene sets that differ among RF and PF, RF and WF, and PF and WF.

2.3.3. Metabolomics and Transcriptomics Integrated Analysis

Pearson correlation coefficients were computed to analyze the relationships between metabolites and differentially expressed genes (DEGs) involved in anthocyanin biosynthesis. Relationships with a correlation coefficient (r) greater than 0.6 or less than −0.6 were deemed significant for linking the metabolome and transcriptome. Correlation network analysis was conducted using Cytoscape 3.9.1 to visualize these specific associations.

2.3.4. Real-Time Fluorescent Quantitative PCR

Combine the differentially expressed metabolites and genes identified through metabolomics and transcriptomics screening of F. pentaphylla to identify genes associated with fruit color. Using the sequences of these candidate genes related to fruit color in F. pentaphylla, design real-time quantitative PCR primers (Table 1). Primers were designed using the Premier 5 software (http://www.premierbiosoft.com/primerdesign/index.html, accessed on 20 April 2021). Using the analytikena-qTOWER2.2 fluorescence quantitative PCR instrument (Analytik Jena AG, Jena, Germany) for qRT-PCR detection, a 20 μL reaction system was used, with five μL of 2 × SYBR® Green Supermix (Bio-Rad Laboratories, Inc., Hercules, CA, USA), 0.5 μL of Primer F and Primer R, one μL of cDNA, and three μL of ddH2O added sequentially. Following a thorough mixing process, the reverse transcription procedure was executed using the Aidlab reverse transcription kit (TUREscript 1st Stand cDNA SYNTHESIS Kit, Aidlab, Beijing, China). The resulting cDNA was used as a template to detect PCR product content. GAPDH was used as the internal reference gene to standardize the quantitative results. PCR cycling parameters were as follows: 95 °C for 3 min; 95 °C for 10 s, annealing temperature, 60 °C for 30 s, 40 cycles. After the reaction was complete, it was maintained at 95 °C for 30 s, cooled to 60 °C, maintained for 30 s, and then started at 60 °C. The temperature was increased by 1 °C per step and maintained for 4 s to collect fluorescence signals until the reaction was complete.

2.4. Data Statistics and Analysis

The 2−ΔΔCt method was utilized to ascertain each specimen’s relative gene expression levels. Office 2016 was used for result analysis and drawing metabolic pathway diagrams. Cytoscape 3.9.1 and Adobe Illustrator CC 2018 were used to draw the correlation network diagrams of differential metabolites and differential genes.

3. Results

3.1. Metabolite Identification in F. pentaphylla Fruits with Different Colors

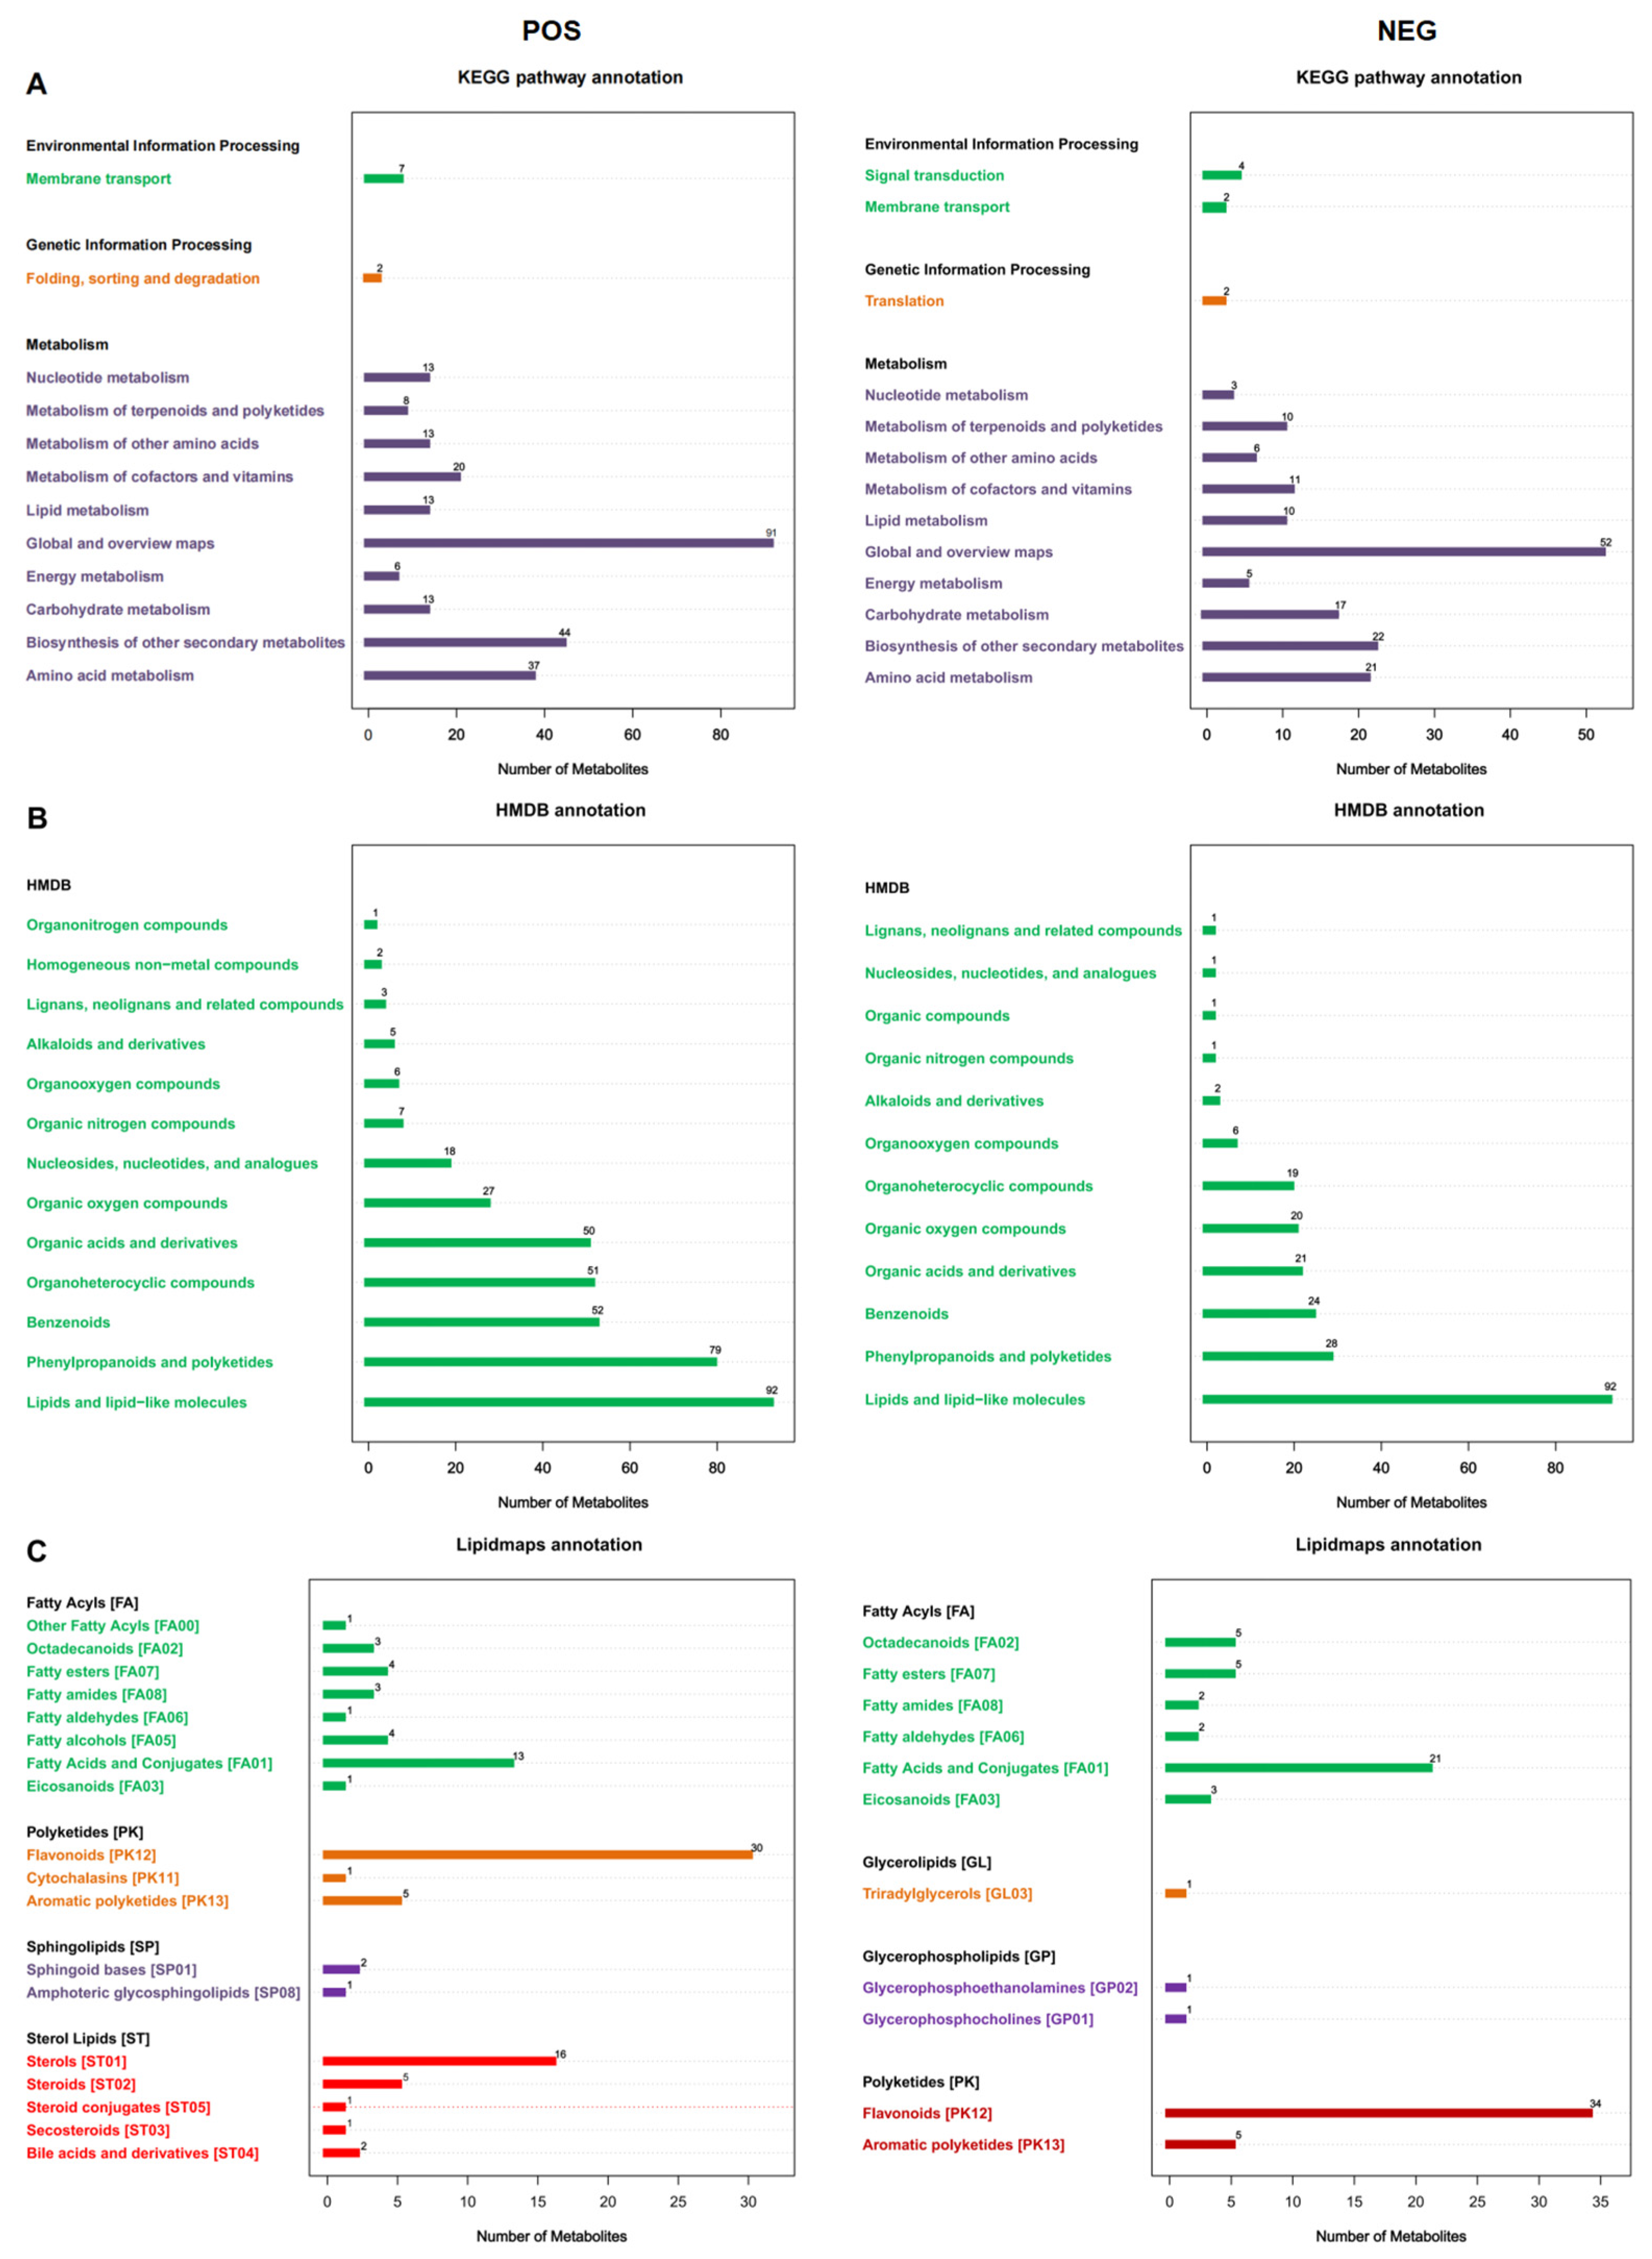
Non-targeted metabolomics analysis was performed for RF vs. PF, RF vs. WF, and PF vs. WF, identifying 3249 metabolites. By matching with the KEGG database, 613 metabolites were identified in positive (POS) and 344 in negative (NEG) ion modes. In this pathway, the top three metabolic pathways with the highest proportion of metabolites were: “Global and overview maps,” “Biosynthesis of other secondary metabolites,” and “Amino acid metabolism.” (Figure 2A).
Metabolites from F. pentaphylla were annotated using the HMDB database. The results indicated that, among the identified metabolites, 393 and 216 were matched and classified into 13 and 12 HMDB superclasses in the positive and negative ion modes, respectively. Of these metabolites, 92 were categorized as “lipids and lipid-like molecules,” representing the most common class in both models. This was followed by the categories “Phenylpropanoids and polyketides” and “Benzenoids.” (Figure 2B).
The identified metabolites were then assigned to the Lipidmaps database, 94 of which were matched and classified into 4 Lipidmaps superclasses in positive (POS) and negative (NEG) ion modes, respectively. A total of 30 metabolites were included in the “flavonoids” category, which constituted the majority of all classes identified within the POS model. Conversely, “flavonoids,” comprising 34 metabolites, emerged as the initial class, succeeded by “fatty acids and conjugates” within the NEG model (Figure 2C).
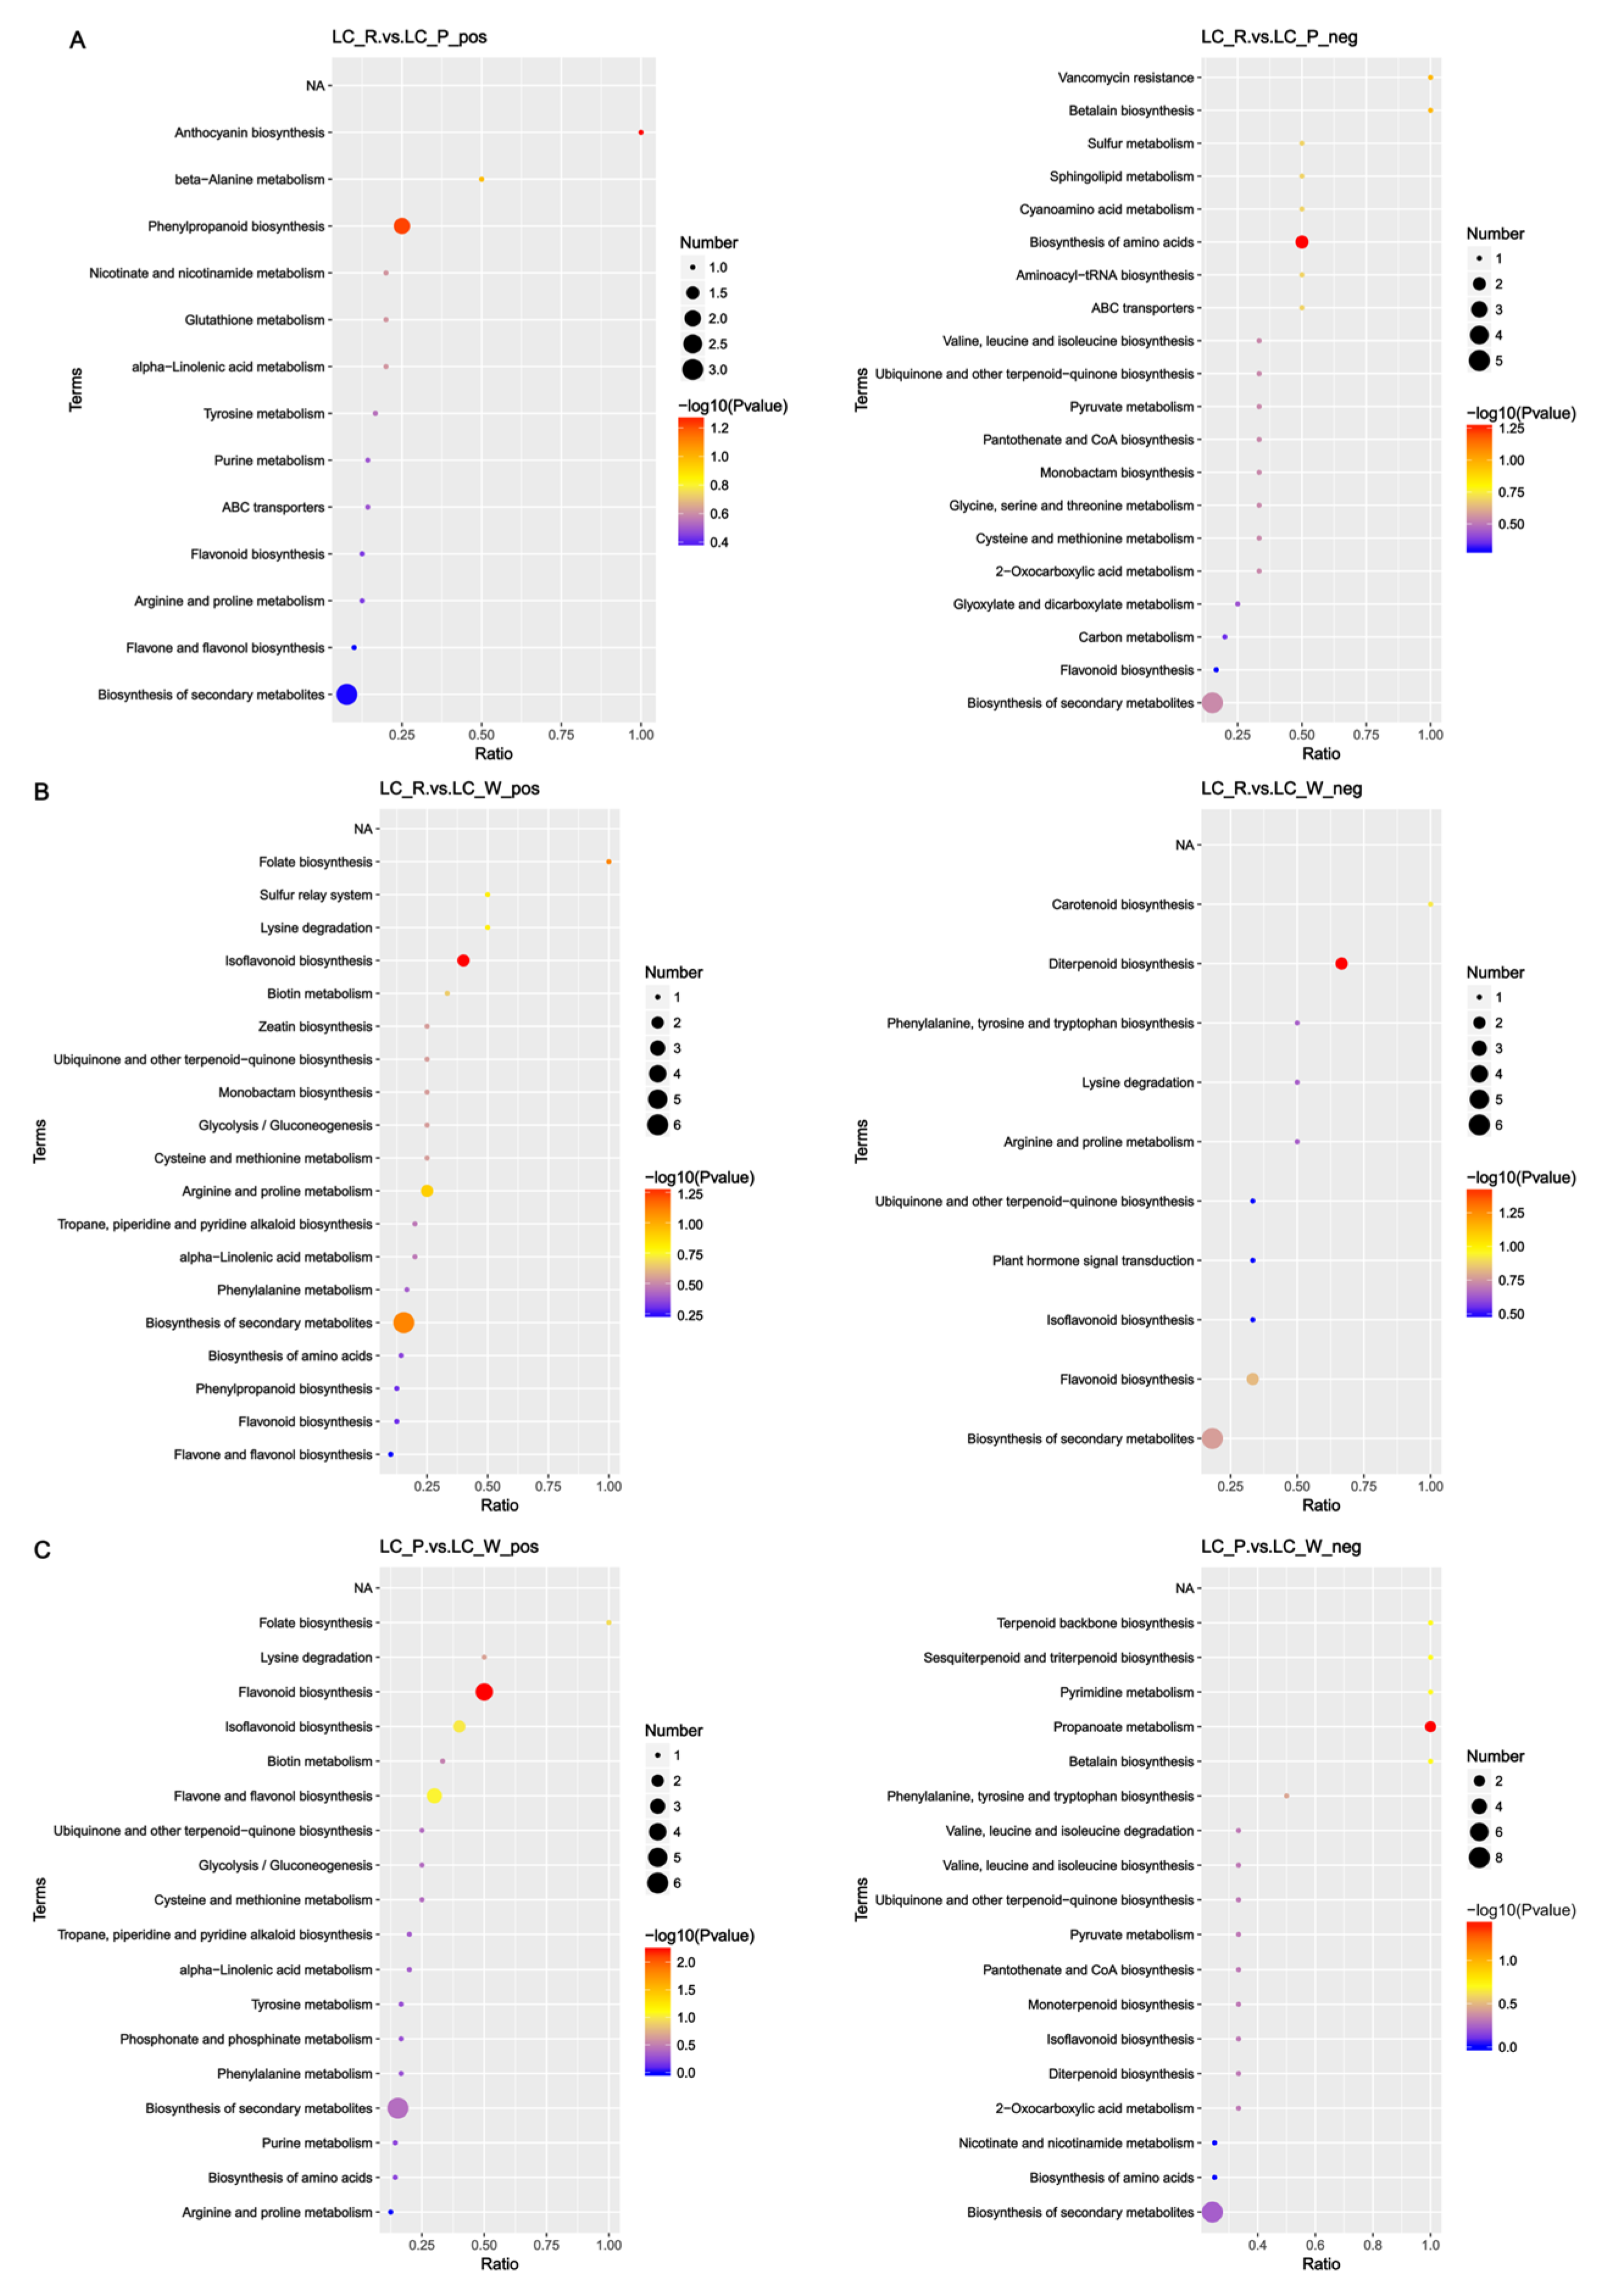
The KEGG enrichment analysis results (Figure 3) indicated that the pathways associated with F. pentaphylla fruit color development include carotenoid biosynthesis, flavonoid biosynthesis, anthocyanin biosynthesis, isoflavone biosynthesis, and flavonol biosynthesis. To clarify the key metabolites involved in color variation among different fruit groups, differential accumulation analyses were conducted across pairwise and three-group comparisons, with the following results: In the RF vs. PF comparison, taxifolin, keracyanin, and quercetin were identified as differentially accumulated metabolites (DAMs); In the RF vs. WF comparison, hesperetin, taxifolin, daidzein, and abscisic acid were detected as DAMs; In the PF vs. WF comparison, apiin, taxifolin, quercetin, and myricetin were classified as DAMs. In the three-group comparison (RF vs. PF vs. WF), the DAMs included abscisic acid, prunin, taxifolin, hesperetin, keracyanin, daidzein, malonylgenistin, genistein, apiin, quercetin, and myricetin.

3.2. Analysis of Flavonoid-Derived Metabolites

Quantitative analysis was performed on the identified metabolites to determine differences between groups, with comparisons based on fold-change and p-values. For F. pentaphylla, keracyanin content was the highest in red fruits (RF), which was 170-fold and 35-fold higher than that in pink fruits (PF) and white fruits (WF), respectively (Table 2 and Figure 4). The highest levels of procyanidin B1 and procyanidin B2 were detected in WF, which were approximately 2-fold higher than those in RF and PF. In addition, RF had the highest prunin content, being 4-fold and 76-fold higher than that in PF and WF, respectively. Catechin content was highest in WF, followed by PF, with RF showing the lowest content. Levels of taxifolin, quercetin, and apiin were nearly identical in RF and WF, while the highest levels of these three metabolites were observed in PF. Myricetin content was highest in WF, which was 3- to 4-fold higher than that in RF and PF, respectively.

3.3. RNA-Seq and Assembly

Using high-throughput sequencing, cDNA libraries constructed from the total RNA of F. pentaphylla RF, PF, and WF were sequenced. The raw image data obtained from sequencing were converted into sequence data (raw reads) through base calling. In total, 66.12 Gb were obtained from nine cDNA libraries, with each sample yielding more than 6 Gb. The total raw reads are respectively 47,908,194(RF1), 44,473,914(RF2), 53,874,228(RF3), 54,261,864(PF1), 41,872,844(PF2), 61,661,466(PF3), 51,405,642(WF1), 64,389,242 (WF2), and 53,240,280(WF3). Following the removal of the low-quality sequences, 44,887,508(RF1), 41,528,038(RF2), 49,677,842(RF3), 50,135,926(PF1), 37,341,402(PF2), 57,837,044(PF3), 48,344,662(WF1), 61,227,906(WF2), and 49,899,752(WF3) valid reads were preserved in subsequent assembly. The Q20 ratio of each sample exceeded 95%, and the GC content exhibited relative consistency, ranging approximately at 47% (Table 3). The Hisat program was utilized to map clean reads to the reference genome, resulting in a mapping ratio of approximately 77%. A subsequent analysis of the samples, based on FPKM values, revealed that all biological replicates exhibited analogous expression patterns, thereby substantiating the reliability of the sequencing data. These results confirm that the high data quality meets the requirements for subsequent analyses.

3.4. Identification of Differentially Expressed Genes (DEGs) in F. pentaphylla

In this study, pairwise differential expression analysis was performed on three strawberry fruit libraries: red fruit, pink fruit, and white fruit. Significant differences were defined as |log2foldchange| ≥ 1 and p < 0.05. Using pairwise comparisons, a comparative analysis will be performed between RF, PF, and WF. The RF vs. PF comparison revealed 241 DEGs, with 181 upregulated and 60 downregulated. Between red fruit (RF) and white fruit (WF) samples, 857 DEGs were identified, showing significant color differences. Among these, 462 were upregulated and 395 downregulated. The comparison between PF and WF yielded 677 DEGs, with 293 upregulated and 384 downregulated. (Figure 5).

3.5. Functional Annotation of Unigenes

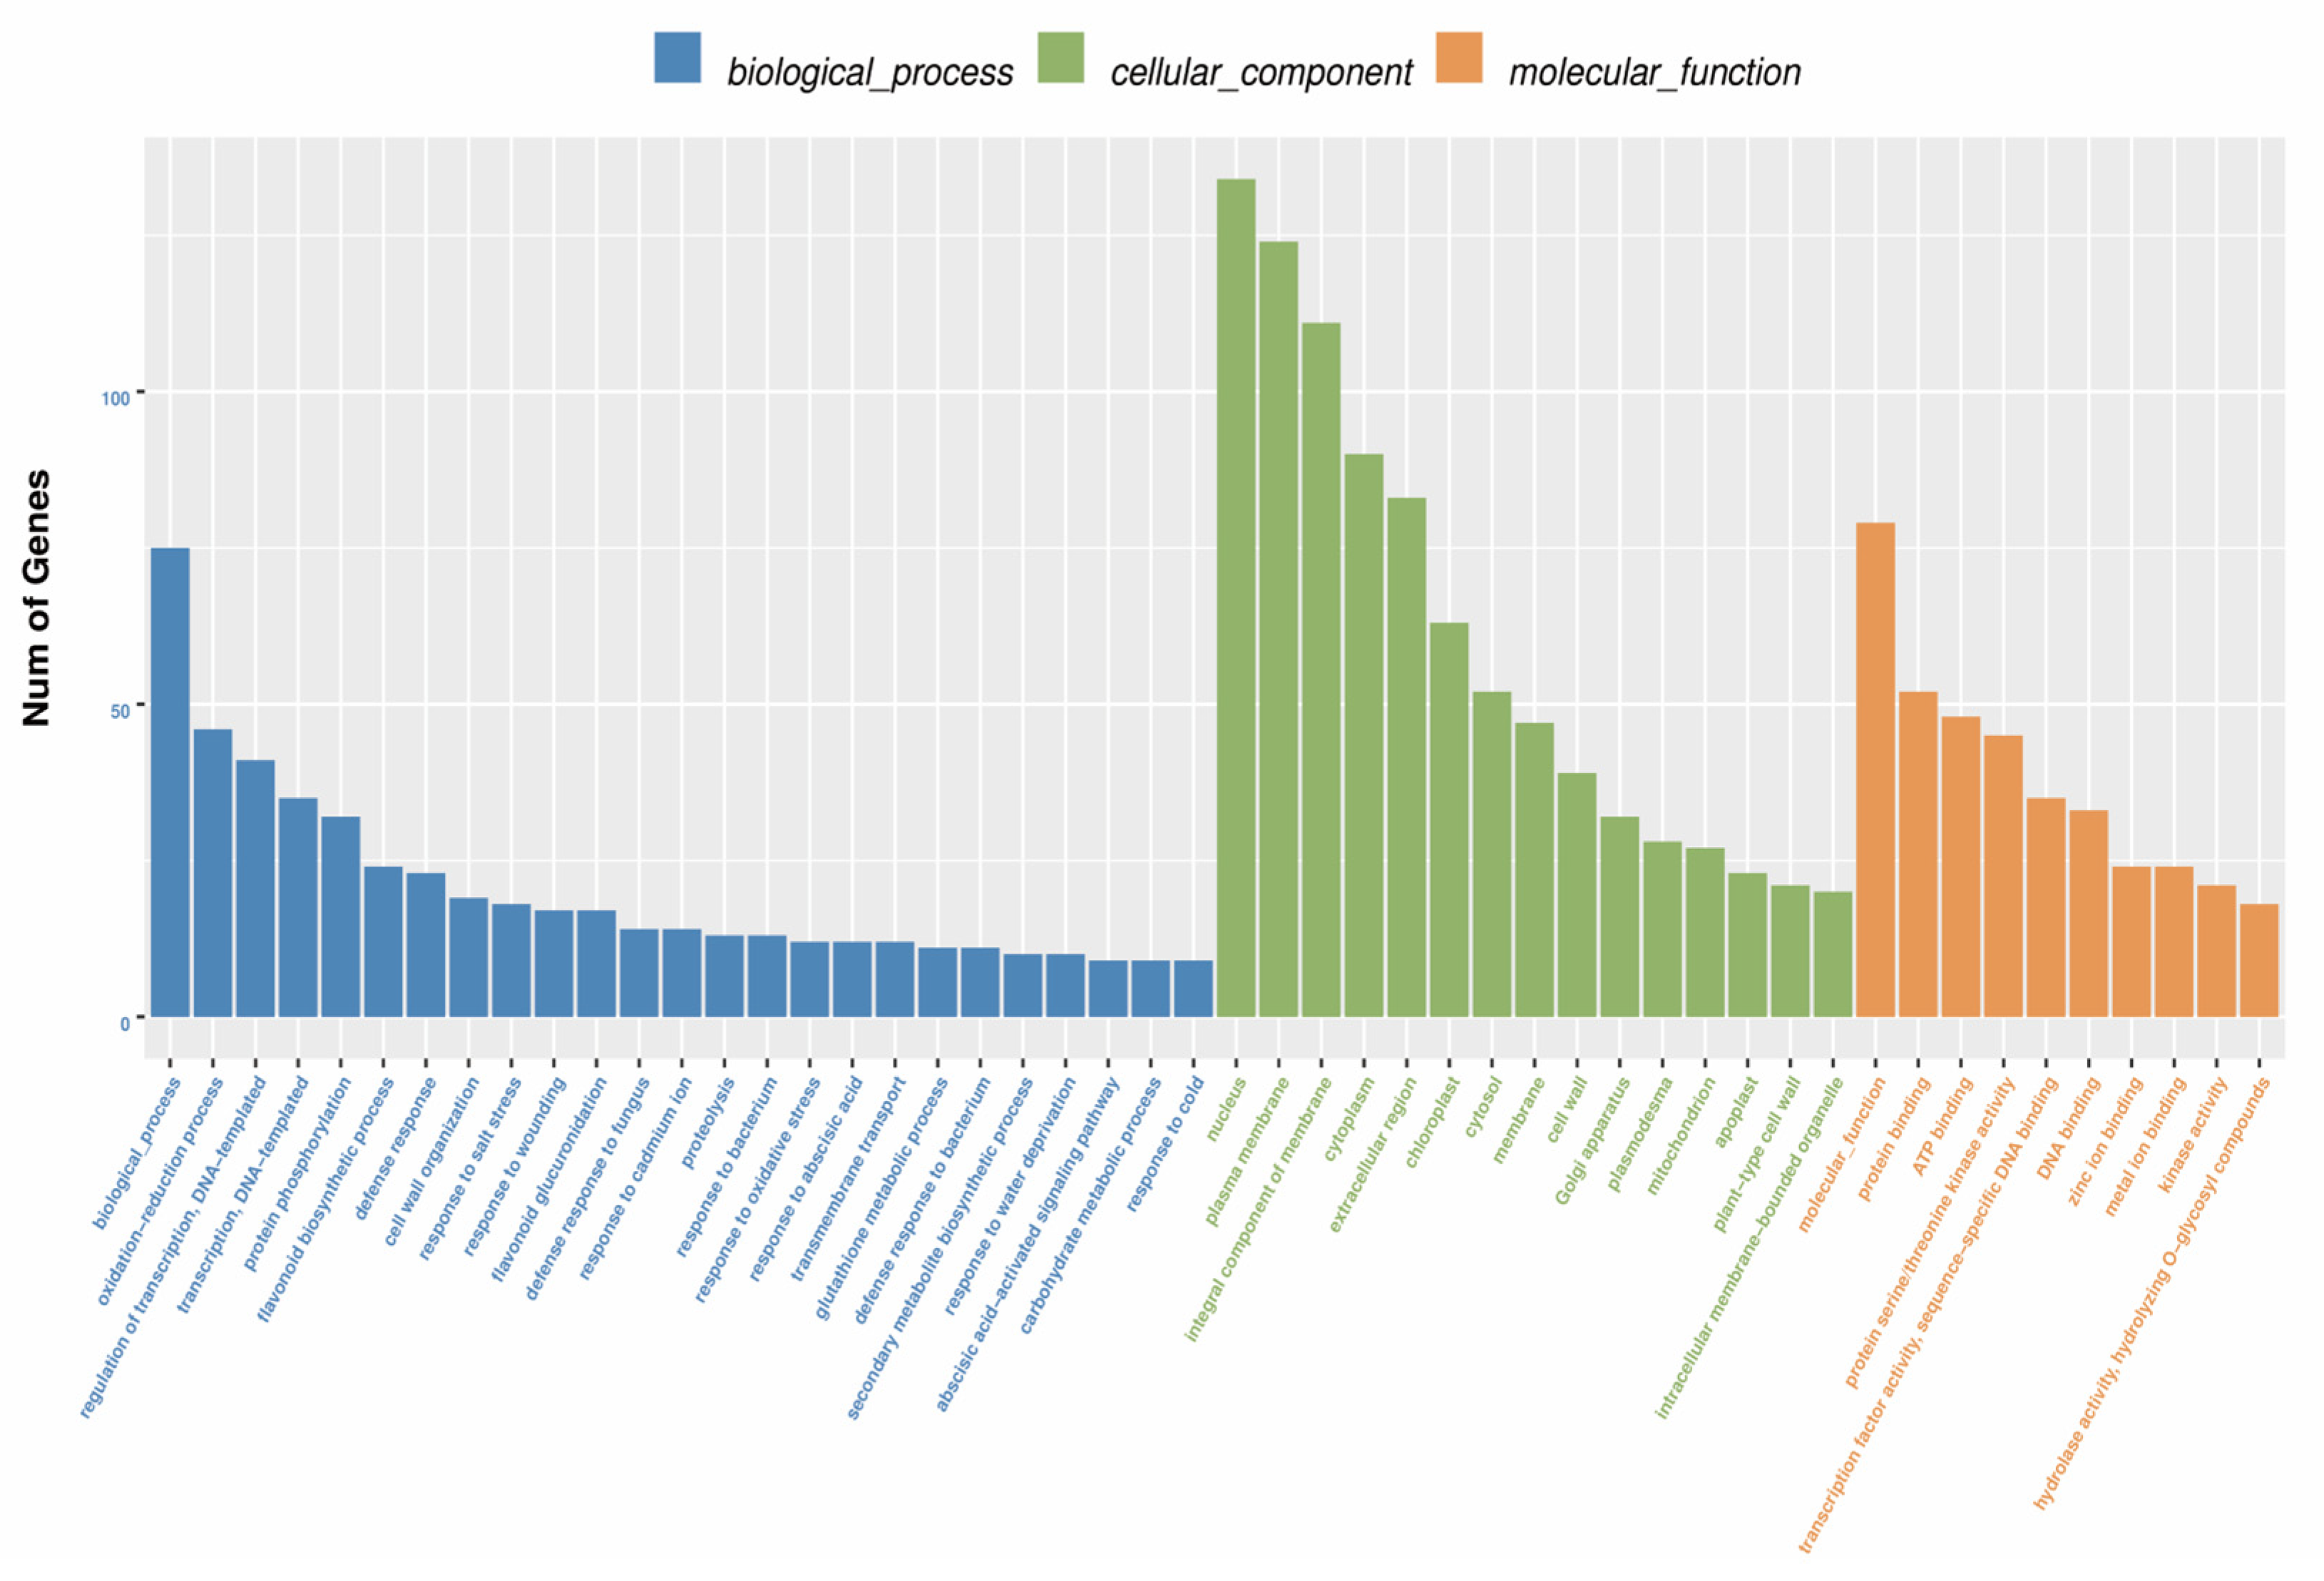
According to annotations from the GO database, 18,834 genes mapped to 926 GO terms, with 3646 genes identified as differentially expressed. The GO comprises three ontologies describing molecular function, cellular component, and biological process, encompassing 50 function-related subcategories (Figure 6). A total of 1409 differentially expressed genes were annotated to biological processes, categorized into 25 subclasses; 1151 differentially expressed genes were annotated to cellular components, classified into 15 subclasses; and 1086 differentially expressed genes were annotated to molecular functions, categorized into 10 subclasses.
To systematically analyze the functional roles of genes sequenced from F. pentaphylla, the metabolic pathways involved in fruit ripening, and the functions of gene products, relevant genes were aligned against the KEGG database. Results revealed that 10,554 genes participated in 20 metabolic pathways, with 702 genes showing differential expression. Among these pathways, flavonoids and other flavonoid-derived secondary metabolites constituted the core chemical basis for fruit coloration in F. pentaphylla. Thus, secondary metabolism pathways became the primary focus of this study. Further analysis revealed that among the 702 differentially expressed genes, 82 could be mapped to 12 secondary metabolic pathways within the 20 pathways (Table 4), accounting for 11.68% of the total differentially expressed genes. The remaining 620 differentially expressed genes were distributed across the other 8 metabolic pathways within the 20 pathways, excluding the aforementioned 12 secondary metabolic pathways.

3.6. Combined Analysis of Transcriptomes and Metabolomes

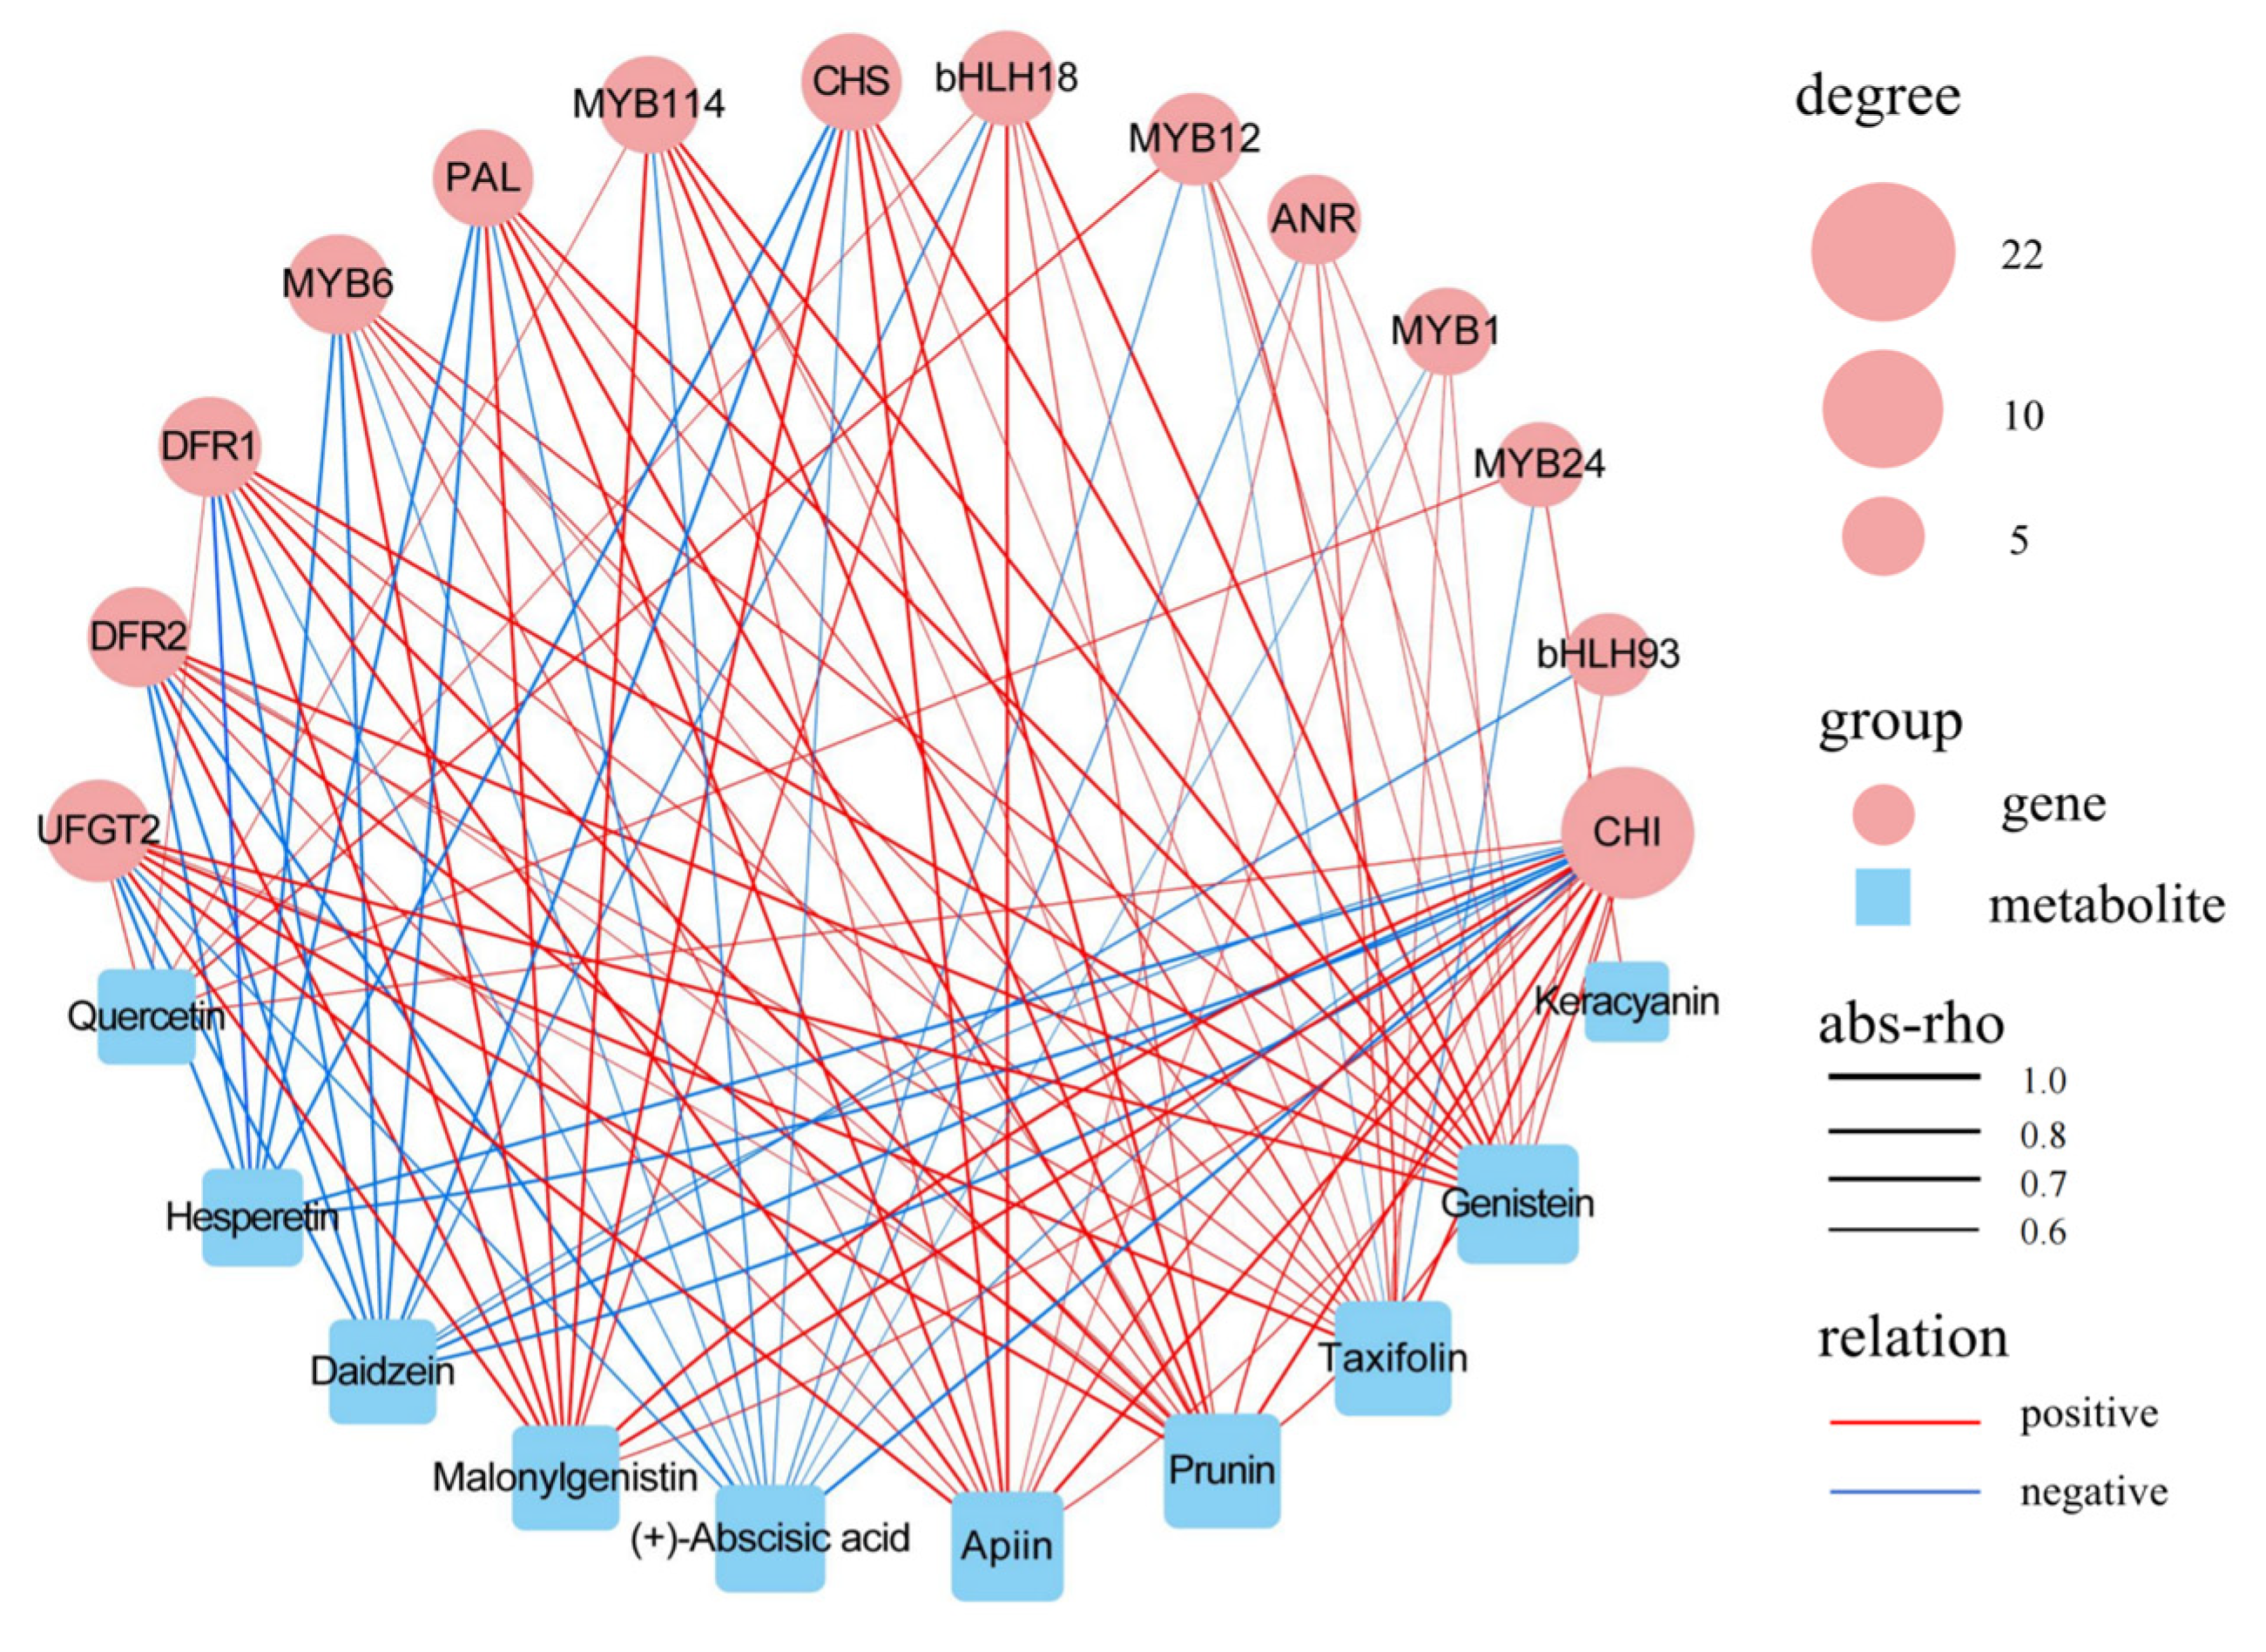
To further elucidate the transcriptome-metabolome correlation in F. pentaphylla fruits, correlation analysis was performed between differentially expressed genes (DEGs) and differential metabolites (DAMs) during fruit color transition. Structural genes and metabolites involved in the phenylpropanoid, flavonoid, and anthocyanin biosynthesis pathways were substantially upregulated. This indicates that these DEGs explicitly govern metabolite accumulation. Pairwise comparisons further revealed significant enrichment of structural genes and metabolites in the “phenylpropanoid biosynthesis pathway” and “flavonoid biosynthesis pathway” during fruit color change in F. pentaphylla, supporting the regulatory role of structural genes in metabolite accumulation. Genes and metabolites with a correlation coefficient (r) > 0.6 or <−0.6 are presented in Figure 7. The correlation network illustrated metabolite associations across the three fruit color types, with 14 candidate DEGs identified in the phenylpropanoid and flavonoid biosynthetic pathways.

3.7. qRT-PCR Validation of DEGs in Transcriptome Data

A total of 14 node DEGs expressions were detected in the fruits of three different colors: red, pink, and white (Figure 8). Based on the qRT-PCR results of 14 genes, their expression patterns can be categorized into three types. The structural genes included FpDFR1, FpDFR2, FpUFGT, FpCHS, and FpCHI; their expression levels were highest in RF, followed by PF. They showed a positive correlation between gene expression and anthocyanin accumulation. The structural genes included FpANR and FpLAR; their expression level in WF was higher than in RF and PF fruits. The structural gene FpPAL was highest in PF, followed by RF. The bHLH TFs included FpbHLH18, FpbHLH91, and FpbHLH93; their expressions were highest in RF. However, the expression levels of FpbHLH91 and FpbHLH93 in WF were higher than in PF. The expression level of FpbHLH18 was the lowest in WF. The MYB TFs included FpMYB1, FpMYB24, and FpMYB114; their expressions were highest in RF and were lowest in WF.

3.8. Fruit Color Change Involves Phenylpropanoid, Flavonoid, and Anthocyanidin Biosynthesis Pathways

A pathway diagram was created based on the detailed anthocyanin biosynthesis pathway, including a heatmap showing the expression of each structural gene involved in anthocyanin production in F. pentaphylla (Figure 9). Transcript levels of key structural gene families, including CHS, CHI, DFR, and UFGT, were higher in RF than in PF and WF, consistent with the elevated anthocyanin accumulation and fruit color variation. Compared with PF and WF, the PAL gene demonstrated a marked increase in expression in RF. Conversely, one LAR gene exhibited a marked decrease in expression in RF and PF compared to WF. The majority of MYB and bHLH transcription factors (TFs) demonstrated an increase in expression in RF. The differential accumulation of metabolites in the flavonoid biosynthetic pathway included keracyanin, hesperetin, prunin, and taxifolin (upregulated in RF), quercetin (upregulated in PF), and myricetin (upregulated in WF). Genes involved in flavonoid and anthocyanidin biosynthesis play critical roles, and MYB and bHLH transcription factors regulate structural genes to promote anthocyanin formation. The differential accumulation of these metabolites contributes to the observed variation in fruit coloration, manifesting as red, pink, or white hues.

4. Discussion

4.1. Metabolism Compounds Associated with Fruit Coloration in the Strawberry

Many anthocyanins have been identified, and they are the predominant compounds responsible for the red, green, and yellow colors observed in flowers, fruits, and vegetables. The content and composition of these substances determine the color of the fruits [28,29]. Common anthocyanins include pelargonidin, cyanidin, delphinidin, peonidin, petunidin, and chrysanthemum red [30]. Cyanidin is a red-purple (magenta) pigment and the primary pigment in berries [31]. Delphinidin, peonidin, petunidin, and cyanidin have been observed to manifest blue-red or purple hues in plant specimens [32]. The blue-purple tones in vegetables such as chili peppers and eggplants are attributable to anthocyanin pigments [33,34]. Geraniol, a naturally occurring compound, manifests in orange-red hues, contributing to the orange tint observed in certain plants and fruits, as well as berries, which exhibit a red coloration [35,36,37].
Many reports have demonstrated a correlation between fruit pigmentation and its composition and content [38,39,40]. As posited by Liu [41], the biosynthesis of anthocyanins can be categorized into three primary branches: pelargonium derivatives, cyanidin derivatives, and delphinidin derivatives. Liu [42] found that Cyanidin-3-O-rutinoside, a polyphenol with antioxidant properties, is the predominant anthocyanin in red-colored cherries. Ponce [43] discovered that cyanidin-3-O-glucoside, cyanidin-3-O-rutinoside, and cyanidin-3-O-sambubioside function as coloring agents during the development of Prunus avium. Salvatierr [44] found the major anthocyanin in F. chiloensis ssp. Chiloensis is cyanidin-3-glucopyranoside. Shen [45] found that cyanidin3-O-glucoside chloride, cyanidin 3-galactoside, and cyanidin 3-glucoside were the predominant anthocyanins found in the fruits of F. pentaphylla and F. nilgerrensis, respectively. In this study, the relative content of cyanidin-3-rutinoside in the red fruits of F. pentaphylla was higher than that in the pink and white fruits, indicating that cyanidin-3-rutinoside is the main anthocyanin in the red fruits of F. pentaphylla, consistent with the conclusions of previous studies. Silva [46] found that in cultured F. × ananassa, pelargonidin-3-glucoside accounted for most of the content, while cyanidin-3-glucoside accounted for only 3–10%. However, in comparison to cultivated F. × ananassa, wild strawberry species have been found to exhibit higher levels of anthocyanin content. Lin [47] and Jiang [48] found that the main anthocyanins in strawberries are pelargonidin-3-O-glucoside (Pg3G) and cyanidin-3-O-glucoside (Cy3G). However, pelargonidin and its derivatives were not detected in this study, which differs from the results of previous studies. It is speculated that this may be related to the sampling location and time, fruit ripeness, pelargonidin and its derivatives being metabolized or removed during the screening process due to low content, or genetic differences leading to different anthocyanin synthesis pathways, resulting in the absence of pelargonidin and its derivatives.

4.2. The Genes Involved in Anthocyanin Biosynthesis in the Strawberry

As demonstrated by numerous studies, the color of strawberries is closely associated with structural genes that are key to the biosynthesis of flavonoids and anthocyanins. These structural genes include PAL, CHS, CHI, F3H, DFR, ANR, UFGT, and transcription factors such as MYB and bHLH [49,50,51,52]. Multiple enzymes participating in the biosynthesis of flavonoids and anthocyanins have been characterized in strawberry fruits, including FaDFR, FaF3′H, FaANS, FaLAR, and FcANR [53,54,55,56,57,58]. Duan [59] found that the expression levels of structural genes (FpCHS, FpDFR, FpANS, and FpUFGT) were significantly higher in red fruits of F. pentaphylla compared to white fruits. Consistent with the results of this study, eight key structural genes were activated and encoded in F. pentaphylla, with the differentially expressed genes of FpCHS, FpCHI, FpDFR, and FpUFGT showing significantly higher expression levels in red fruits compared to pink and white fruits. Kadomura-Ishikawa [60] found that low expression of FaLAR in cultivated strawberries promotes anthocyanin synthesis. Fischer [61] demonstrated that reduced expression levels of the ANR gene might lead to the accumulation of colored anthocyanins in F. ananassa cv Senga Sengana. The results of Xu [62] are consistent with those of Fischer, and they also found that UFGT expression is higher in ANR mutants. High ANR expression promotes the flow of flavonoid metabolites toward proanthocyanidin synthesis, accumulating proanthocyanidins within the fruit. In this study, FpANR and FpLAR were highly expressed in white fruits, while FpUFGT expression was lower in red and pink fruits. Proanthocyanidin content accumulated at higher levels in white fruits, consistent with previous research findings.
In this study, as the fruit color of F. pentaphylla changed from red to pink to white, the expression levels of genes FpDFR, FpUFGT, FpCHS, and FpCHI gradually decreased, indicating that these genes positively regulate anthocyanin synthesis. The gene FpPAL is upregulated in PF, accumulating anthocyanin synthesis substrates in the phenylpropanoid biosynthesis pathway. The different expression levels of the genes FpUFGT and FpLAR result in various proportions of cyanidin derivatives and catechins, forming pink fruits. The elevated expression of genes FpANR and FpLAR in white fruits has been demonstrated to result in the accumulation of flavonoids, consequently impacting anthocyanin synthesis in these fruits. These genes are candidate genes for different color formation in F. pentaphylla.
Transcription factors (TFs) have been shown to play a pivotal role in regulating gene expression. These factors are essential for controlling diverse biological processes [63]. Previous studies have shown that MYB, bHLH, WD40, and MYB-bHLH-WD40 complexes regulate the biosynthesis of flavonoids and anthocyanins. Salvatierra [64] found that the expression level of the transcription factor FcMYB1 was significantly higher in white fruits of F. chiloensis than in red fruits. This study differs from Salvatierra’s findings, likely because F. pentaphylla was diploid in this experiment while F. chiloensis was octoploid. Varietal differences may account for the inconsistent expression of the MYB1 gene. Shen [45] found that the expression of MYB1 was upregulated in red fruits of F. pentaphylla compared to white fruits of F. nilgerrensis.
In this study, the expression level of FpMYB1 in red fruits of F. pentaphylla was significantly higher than in pink and white fruits, consistent with previous findings. Additionally, FpMYB24 and FpMYB114 are also highly expressed in the red fruit of F. pentaphylla. Therefore, it is speculated that the transcription factors FpMYB24 and FpMYB114 may also be key factors influencing the formation of different fruit colors in F. pentaphylla. Pavel [65] discovered that PacbHLH13 and PacbHLH74 can activate the PacANS promoter, while PabHLH33 exerts a substantial inhibitory effect. Zhao [66] found that FabHLH98 may co-activate the anthocyanin biosynthesis pathway with MYB75/PAP1. Xie [14] discovered that the FpMYB9 protein may interact with a bHLH transcription factor associated with anthocyanins and regulate anthocyanin synthesis. This study found that the transcription factors FpbHLH18, FpbHLH91, and FpbHLH93 are significantly expressed in the red fruits of F. pentaphylla. Based on previous studies, it is speculated that the expression levels of MYB and bHLH transcription factors may drive fruit color variation in F. pentaphylla. The low expression of these transcription factors is likely the primary reason F. pentaphylla white-fruited cannot accumulate anthocyanins. Furthermore, interactions between MYB and bHLH transcription factors may contribute to the formation of different fruit colors in F. pentaphylla. However, their precise roles in regulating anthocyanin biosynthesis and their interactions require further investigation.

4.3. Candidate Genes Involved in Regulating Fruit Coloration in F. pentaphylla

Researchers conducted a comprehensive analysis of metabolite and transcriptomic data to investigate the causes of the diverse fruit colors exhibited by F. pentaphylla. A comparative study of metabolite levels in fruits of varying colors was conducted, complemented by examining the expression patterns of key genes within the corresponding metabolic pathways. The catalytic reactions of these candidate genes may be responsible for forming different fruit colors in F. pentaphylla. The upregulation of PAL expression in red and pink fruits indicates that PAL is involved in anthocyanin synthesis, consistent with the findings of Tian [67]. The significant upregulation of the FpUGT gene in RF may also be an essential factor in the anthocyanin accumulation capacity of red fruits, as suggested by Salvatierra [64], who determined that substantial disparities in UFGT mRNA levels appear to function as a pivotal factor in the variation of pigmentation observed among two distinct forms of native Chilean strawberries. The substrate specificity of the FpDFR gene may be related to anthocyanin formation, with anthocyanins primarily composed of cyanidin derivatives, consistent with the findings of Duan [59], who speculated that FpDFR mutations may regulate anthocyanin biosynthesis in F. pentaphylla. The FpANR and FpLAR genes are upregulated in F. pentaphylla white fruit, and more flavonoids are detected in white fruit, suggesting that the competitive effects of FpANR and FpLAR genes limit the biomass of anthocyanin derivatives in white fruit. As the expression of FpANR and FpLAR genes is upregulated, the biomass used initially for anthocyanin turnover is converted into colorless flavanols, aligning with the findings of Xu [67].

5. Conclusions

F. pentaphylla exhibits three fruit colors due to the synergistic action of transcription factors FpbHLH18, FpMYB1, FpMYB24, and FpMYB114 with structural genes FpDFR, FpUFGT, FpPAL, FpCHI, FpANR, and FpLAR. This regulation modulates the production of flavonoids such as cyanidin 3-rutinoside, catechin, and myricetin in different proportions. The primary pigment responsible for the red color of the F. pentaphylla is cyanidin 3-rutinoside. The transcription factors FpbHLH18, FpMYB1, FpMYB24, and FpMYB114 synergistically upregulate the structural genes FpDFR, FpUFGT, FpCHS, and FpCHI in RF, promoting the synthesis of cyanidin derivatives, thereby leading to the accumulation of cyanidin 3-rutinoside and the formation of red fruit. The gene FpPAL is upregulated in powdery fruit, accumulating anthocyanin synthesis substrates in the phenylpropanoid biosynthesis pathway. Differences in the expression levels of the genes FpUFGT and FpLAR result in varying proportions of cyanidin derivatives and catechins produced, forming powdery fruit. The genes FpANR and FpLAR are upregulated in white fruit, causing a diversion in the anthocyanin synthesis process. Flavonoids such as catechin and myricetin accumulate in white fruits, limiting anthocyanin synthesis and producing white fruit. In summary, this study improves our understanding of the molecular regulatory mechanisms governing the biosynthesis and accumulation of anthocyanins during fruit color changes in F. pentaphylla.

Author Contributions

Conceptualization, X.Y. and C.Z.; Data curation, X.Y., J.L. and R.G.; Formal analysis, X.Y. and S.T.; Funding acquisition, X.T. and R.G.; Investigation, X.Y., S.T. and C.Z.; Methodology, X.Y., J.L. and R.G.; Resources, L.W.; Supervision, X.T. and R.G.; Visualization, X.Y.; Writing—original draft, X.Y. and S.T.; Writing—review and editing, X.Y. and R.G. All authors have read and agreed to the published version of the manuscript.

Funding

This work was supported by the Jilin Agricultural University Science Start-up Fund Supported Project (No. 21) and The Technological System of Modern Agricultural Industry of Jilin Province (No. JLARS-2025-120101).

Data Availability Statement

The original contributions presented in this study are included in the article. Further inquiries can be directed to the corresponding authors.

Acknowledgments

The authors are grateful to the anonymous reviewers for their comments.

Conflicts of Interest

The authors declare no conflicts of interest.

References

  1. Saridas, A.M.; Guclu, G.; Selli, S.; Kelebek, H.; Kargi, P.S. The cross-breeding of Osmanli and Sabrina varieties to produce newly aroma-enriched strawberry genotypes. J. Food Compos. Anal. 2025, 144, 107713. [Google Scholar] [CrossRef]
  2. Hong, T.H.; Chen, A.; Netzel, E.M.; O’Hare, J.T. Differences in the Anthocyanin Profile of Different Tissues of the Strawberry Fruit . Proceedings 2020, 36, 74. [Google Scholar]
  3. Chen, L.X.; Xu, S.T.; Ding, W.H.; Peter, A. Genetic diversity and offspring fitness in the red and white fruit color morphs of the wild strawberry Fragaria pentaphylla. J. Plant Ecol. 2019, 13, 36–41. [Google Scholar] [CrossRef]
  4. Sun, R.; Li, S.G.; Chang, L.L.; Dong, J.; Zhong, C.F.; Zhang, H.L.; Wei, L.G.; Gao, Y.S.; Wang, G.X.; Zhang, Y.T.; et al. Chromosome-level genome assembly of Fragaria pentaphylla using PacBio and Hi-C technologies. Front. Genet. 2022, 13, 873711. [Google Scholar] [CrossRef]
  5. Duan, X.Y.; Wang, K.; Tang, R.K.; Liu, J.Y.; Cheng, K.; Gao, G.T.; Wang, Y.Y.; Qin, G.Z. Recent advances in biosynthesis and regulation of strawberry anthocyanins. Hortic. Res. 2025, 12, uhaf135. [Google Scholar] [CrossRef] [PubMed]
  6. Mohammed, H.A.; Khan, R.A. Anthocyanins: Traditional Uses, Structural and Functional Variations, Approaches to Increase Yields and Products’ Quality, Hepatoprotection, Liver Longevity, and Commercial Products. Int. J. Mol. Sci. 2022, 23, 2149. [Google Scholar] [CrossRef] [PubMed]
  7. Qian, R.J.; Ye, Y.J.; Hu, Q.D.; Ma, X.H.; Zhang, X.L.; Zheng, J. Metabolomic and Transcriptomic Analyses Reveal New Insights into the Role of Metabolites and Genes in Modulating Flower Colour of Clematis tientaiensis. Horticulturae 2022, 9, 14. [Google Scholar] [CrossRef]
  8. Lu, Z.K.; Wang, X.W.; Lin, X.Y.; Mostafa, S.; Zou, H.L.; Wang, L.; Jin, B. Plant anthocyanins: Classification, biosynthesis, regulation, bioactivity, and health benefits. Plant Physiol. Biochem. 2024, 217, 109268. [Google Scholar] [CrossRef]
  9. Zhang, Y.; Butelli, E.; Martin, C. Engineering anthocyanin biosynthesis in plants. Curr. Opin. Plant Biol. 2014, 19, 81–90. [Google Scholar] [CrossRef]
  10. Wang, L.L.; Yang, S.; Ni, J.; Teng, Y.; Bai, S. Advances of anthocyanin synthesis regulated by plant growth regulators in fruit trees. Sci. Hortic. 2023, 307, 111476. [Google Scholar] [CrossRef]
  11. Aharoni, A.; De Vos, C.H.R.; Wein, M.; Sun, Z.K.; Greco, R.; Kroon, A.; Mol, J.N.M.; O’Connell, A.P. The strawberry FaMYB1 transcription factor suppresses anthocyanin and flavonol accumulation in transgenic tobacco. Plant J. 2001, 28, 319–332. [Google Scholar] [CrossRef]
  12. Schaart, J.G.; Dubos, C.; Romero De La Fuente, I.; van Houwelingen, A.M.M.L.; de Vos, R.C.H.; Jonker, H.H.; Xu, W.J.; Routaboul, J.-M.; Lepiniec, L.; Bovy, A.G. Identification and characterization of MYB-bHLH-WD40 regulatory complexes controlling proanthocyanidin biosynthesis in strawberry (Fragaria × ananassa) fruits. New Phytol. 2013, 197, 454–467. [Google Scholar] [CrossRef]
  13. Hossain, M.R.; Kim, H.T.; Shanmugam, A.; Nath, U.K.; Goswami, G.; Song, J.Y.; Park, J.I.; Nou, I.S. Expression Profiling of Regulatory and Biosynthetic Genes in Contrastingly Anthocyanin Rich Strawberry (Fragaria × ananassa) Cultivars Reveals Key Genetic Determinants of Fruit Color. Int. J. Mol. Sci. 2018, 19, 656. [Google Scholar] [CrossRef]
  14. Xie, L.M.; Wang, Y.N.; Tao, Y.T.; Chen, L.X.; Lin, H.Y.; Qi, Z.C.; Li, J.M. Genome-wide identification and analysis of anthocyanin synthesis-related R2R3-MYB genes in Fragaria pentaphylla. BMC Genom. 2024, 25, 952. [Google Scholar] [CrossRef]
  15. Yang, S.; Liu, M.; Zhao, C.; Wang, R.; Xue, L.; Lei, J. A novel bHLH transcription factor, FabHLH110, is involved in regulation of anthocyanin synthesis in petals of pink-flowered strawberry. Plant Physiol. Biochem. PPB 2025, 222, 109713. [Google Scholar] [CrossRef] [PubMed]
  16. Simirgiotis, M.J.; Theoduloz, C.; Caligari, P.D.S.; Schmeda-Hirschmann, G.S.H. Comparison of phenolic composition and antioxidant properties of two native Chilean and one domestic strawberry genotypes. Food Chem. 2008, 113, 377–385. [Google Scholar] [CrossRef]
  17. Yoshida, Y.; Koyama, N.; Tamura, H. Color and Anthocyanin Composition of Strawberry Fruit: Changes during Fruit Development and Differences among Cultivars, with Special Reference to the Occurrence of Pelargonidin 3-malonylglucoside. J. Jpn. Soc. Hortic. Sci. 2002, 71, 355–361. [Google Scholar] [CrossRef]
  18. Yuan, H.Z.; Pang, F.H.; Wang, J.; Cai, W.J.; Xia, J.; Zhao, M.Z. Identification of Anthocyanin Compositions and Expression Analysis of Key Related Genes in Fragaria × ananassa. Acta Hortic. Sin. 2023, 50, 791–801. [Google Scholar]
  19. Patricio, Z.; Makarena, G.; Igor, P.; Claudia, J.; Claudia, S.A.; Marco Isaac, G.; Rodrigo, I.; Juan Alfonso, S. Transcriptomic Analysis of Sex-Associated DEGs in Female and Male Flowers of Kiwifruit (Actinidia deliciosa [A. Chev] C. F. Liang & A. R. Ferguson). Horticulturae 2021, 8, 38. [Google Scholar] [CrossRef]
  20. Guo, Y.F.; Jing, Y.L.; Wang, Q.H.; Zhang, W.S. Identification and Quantification of Carotenoids in White and Yellow-Fleshed Peaches (Prunus persica (L.) Batsch) by QTRAP+ LC-MS/MS. Horticulturae 2025, 11, 376. [Google Scholar] [CrossRef]
  21. Zhou, C.B.; Xin, M.; Rothenberg, O.D.; Yang, Z.B.; Zhang, W.T.; Wan, S.H.; Yang, H.J.; Zhang, L.Y. Metabolome and Transcriptome Analysis Reveals Putative Genes Involved in Anthocyanin Accumulation and Coloration in White and Pink Tea (Camellia sinensis) Flower. Molecules 2020, 25, 190. [Google Scholar] [CrossRef]
  22. Lin, W.D.; Li, Y.L.; Lu, Q.W.; Lu, H.F.; Li, J.M. Combined Analysis of the Metabolome and Transcriptome Identified Candidate Genes Involved in Phenolic Acid Biosynthesis in the Leaves of Cyclocarya paliurus. Int. J. Mol. Sci. 2020, 21, 1337. [Google Scholar] [CrossRef]
  23. Xia, E.H.; Li, F.D.; Tong, W.; Li, P.H.; Wu, Q.; Zhao, H.J.; Ge, R.H.; Li, R.P.; Li, Y.Y.; Zhang, Z.Z.; et al. Tea Plant Information Archive: A comprehensive genomics and bioinformatics platform for tea plant. Plant Biotechnol. J. 2019, 17, 1938–1953. [Google Scholar] [CrossRef] [PubMed]
  24. Mihaela, P.; Daehwan, K.; Geo, P.M.; Jeffrey, L.T.; Steven, S.L. Transcript-level expression analysis of RNA-seq experiments with HISAT, StringTie, and Ballgown. Nat. Protoc. 2016, 11, 1650–1667. [Google Scholar]
  25. Grabherr, M.G.; Haas, B.J.; Yassour, M.; Levin, J.Z.; Thompson, D.A.; Amit, I.; Adiconis, X.; Fan, L.; Raychowdhury, R.; Zeng, Q.; et al. Full-length transcriptome assembly from RNA-Seq data without a reference genome. Nat. Biotechnol. 2011, 29, 644–652. [Google Scholar] [CrossRef]
  26. Pertea, M.; Pertea, G.M.; Antonescu, C.M.; Cheng, T.C.; Mendell, J.T.; Salzberg, S.L. StringTie enables improved reconstruction of a transcriptome from RNA-seq reads. Nat. Biotechnol. 2015, 33, 290–295. [Google Scholar] [CrossRef]
  27. Love, M.I.; Huber, W.; Anders, S. Moderated estimation of fold change and dispersion for RNA-seq data with DESeq2. Genome Biol. 2014, 15, 550. [Google Scholar] [CrossRef]
  28. Basharat, Y.; Khalid, G.; Abas, A.W.; Preeti, S. Health Benefits of Anthocyanins and Their Encapsulation for Potential Use in Food Systems: A Review. Crit. Rev. Food Sci. Nutr. 2016, 56, 2223–2230. [Google Scholar]
  29. Zhang, X.A.; Wang, W.X.; Li, J.P.; Ding, Y.H.; Tian, J.L.; Wang, Z.H.; Xiong, B.; Xu, T.; Kou, G.Q.; Zheng, Y.Y.; et al. Analysis of Anthocyanin Accumulation and Related Gene Expression During Fig Fruit Development. Plant Mol. Biol. Rep. 2023, 41, 317–332. [Google Scholar] [CrossRef]
  30. Wang, J.W.; Liu, X.; Liang, R.; Li, J.; Bi, M.G.; Li, J.; Mu, C.; Yang, Y.D.; Li, S.J.; Yang, P.P.; et al. LlbZIP11 promotes anthocyanin accumulation in raised spots of Lilium leichtlinii by inducing LlMYB19S expression. Int. J. Biol. Macromol. 2025, 320 Pt 3, 146085. [Google Scholar] [CrossRef]
  31. Gates, D.J.; Olson, B.J.; Clemente, T.E.; Smith, S.D. A novel R3 MYB transcriptional repressor associated with the loss of floral pigmentation in Iochroma. New Phytol. 2018, 217, 1346–1356. [Google Scholar] [CrossRef] [PubMed]
  32. Zhang, P.; Zhao, Q.; Song, Y.; Jin, H.C.; Seymour, D.; Liu, Y.Y.; Chen, J.; Hu, D.; Liu, D.F. Evaluation of pigment composition and antioxidant properties in the flesh of seven colored pummelo cultivars. Food Chem. X 2025, 29, 102705. [Google Scholar] [CrossRef] [PubMed]
  33. Mo, Y.; Hua, W.; Cheng, H.; Zhang, R.H.; Li, P.P.; Deng, M.H. Bioactive Components and Color Variation Mechanism Among Three Differently Colored Peppers Based on Transcriptomics and Non-Targeted Metabolomics. Horticulturae 2025, 11, 638. [Google Scholar] [CrossRef]
  34. Panda, S.; Maor, C.L.; Haro, D.A.L.; Jozwiak, A.; Gharat, S.A.; Kazachkova, Y.; Cai, J.H.; Vainer, A.; Toppino, L.; Sehrawat, U.; et al. Molecular Mechanisms Driving the Unusual Pigmentation Shift in Eggplant Fruit Development. Plant Commun. 2025, 6, 101321. [Google Scholar] [CrossRef]
  35. Jaakola, L.W. Insights into the regulation of anthocyanin biosynthesis in fruits. Trends Plant Sci. 2013, 18, 477–483. [Google Scholar] [CrossRef]
  36. Gianfranco, D.; Xin, J.; Teresa, C.; Zhu, C.F.; Lourdes, G.G. Differential accumulation of pelargonidin glycosides in petals at three different developmental stages of the orange-flowered gentian (Gentiana lutea L. var. aurantiaca). PLoS ONE 2019, 14, e0212062. [Google Scholar]
  37. Wang, Q.Y.; Zhu, J.; Li, B.; Li, S.S.; Yang, Y.; Xu, W.Z.; Wang, L.S. Functional identification of anthocyanin glucosyltransferase genes: A Ps3GT catalyzes pelargonidin to pelargonidin 3-O-glucoside, painting the vivid red flower color of Paeonia. Planta 2023, 257, 65. [Google Scholar] [CrossRef]
  38. Silvia, G.; Pierdomenico, P. Fruit Colour and Novel Mechanisms of Genetic Regulation of Pigment Production in Tomato Fruits. Horticulturae 2021, 7, 259. [Google Scholar] [CrossRef]
  39. Xue, Q.; Zhang, Q.; Zhang, A.; Li, D.; Liu, Y.; Xu, H.; Yang, Q.; Liu, F.; Han, T.; Tang, X. Integrated metabolome and transcriptome analysis provides clues to fruit color formation of yellow, orange, and red bell pepper. Sci. Rep. 2024, 14, 29737. [Google Scholar] [CrossRef]
  40. Chen, Y.; Yang, L.; Li, S.; Wang, M.; Yu, J.J.; Bai, W.Q.; Lin, H. New insights into the transcription factor regulatory networks driving peel coloration under hormone induction, analyzed by transcriptomics and metabolomics in tangor ‘Murcot’. Front. Plant Sci. 2025, 16, 1526733. [Google Scholar] [CrossRef]
  41. Liu, Y.; Tikunov, Y.; Schouten, R.E.; Marcelis, L.F.M.; Visser, R.G.F.; Bovy, A. Anthocyanin Biosynthesis and Degradation Mechanisms in Solanaceous Vegetables: A Review. Front. Chem. 2018, 6, 52. [Google Scholar] [CrossRef] [PubMed]
  42. Liu, Y.; Liu, X.Y.; Zhong, F.; Tian, R.R.; Zhang, K.; Zhang, X.M.; Li, T.H. Comparative study of phenolic compounds and antioxidant activity in different species of cherries. J. Food Sci. 2011, 76, C633–C638. [Google Scholar] [CrossRef]
  43. Ponce, C.; Kuhn, N.; Arellano, M.; Time, A.; Multari, S.; Martens, S.; Carrera, E.; Sagredo, B.; Donoso, J.M.; Meisel, L.A. Differential Phenolic Compounds and Hormone Accumulation Patterns between Early- and Mid-Maturing Sweet Cherry (Prunus avium L.) Cultivars during Fruit Development and Ripening. J. Agric. Food Chem. 2021, 69, 8850–8860. [Google Scholar] [CrossRef] [PubMed]
  44. Salvatierra, A.; Pimentel, P.; Moya-Leon, M.A.; Caligari, P.D.; Herrera, R. Comparison of transcriptional profiles of flavonoid genes and anthocyanin contents during fruit development of two botanical forms of Fragaria chiloensis ssp. chiloensis. Phytochemistry 2010, 71, 1839–1847. [Google Scholar] [CrossRef]
  45. Shen, J.C.; Shao, W.L.; Du, Z.K.; Lu, H.F.; Li, J.M. Integrated metabolomic and transcriptomic analyses reveal differences in the biosynthetic pathway of anthocyanins in Fragaria nilgerrensis and Fragaria pentaphylla. Sci. Hortic. 2020, 271, 109476. [Google Scholar] [CrossRef]
  46. Silva, D.L.F.; Escribano-Bailón, T.M.; Alonso, P.J.J.; Rivas-Gonzalo, J.C.; Santos-Buelga, C. Anthocyanin pigments in strawberry. LWT-Food Sci. Technol. 2005, 40, 374–382. [Google Scholar] [CrossRef]
  47. Lin, Y.X.; Jiang, L.Y.; Chen, Q.; Li, Y.L.; Zhang, Y.T.; Luo, Y.; Zhang, Y.; Sun, B.; Wang, X.R.; Tang, H.R. Comparative Transcriptome Profiling Analysis of Red- and White-Fleshed Strawberry (Fragaria × ananassa) Provides New Insight into the Regulation of the Anthocyanin Pathway. Plant Cell Physiol. 2018, 59, 1844–1859. [Google Scholar] [CrossRef]
  48. Jiang, L.Y.; Yue, M.L.; Liu, Y.Q.; Ye, Y.Y.; Zhang, Y.T.; Lin, Y.X.; Wang, X.R.; Chen, Q.; Tang, H.R. Alterations of Phenylpropanoid Biosynthesis Lead to the Natural Formation of Pinkish-Skinned and White-Fleshed Strawberry (Fragaria × ananassa). Int. J. Mol. Sci. 2022, 23, 7375. [Google Scholar] [CrossRef] [PubMed]
  49. Delgado, L.D.; Zúñiga, P.E.; Figueroa, N.E.; Pastene, E.; Escobar-Sepúlveda, H.F.; Figueroa, P.M.; Garrido-Bigotes, A.; Figueroa, C.R. Application of a JA-Ile Biosynthesis Inhibitor to Methyl Jasmonate-Treated Strawberry Fruit Induces Upregulation of Specific MBW Complex-Related Genes and Accumulation of Proanthocyanidins. Molecules 2018, 23, 1433. [Google Scholar] [CrossRef]
  50. Wang, J.W.; Yin, Y.J.; Gao, H.S.; Sheng, L.X. Identification of MYB Transcription Factors Involved in Fruit Quality Regulation of Fragaria × ananassa Duch. Genes 2022, 14, 68. [Google Scholar] [CrossRef]
  51. Wang, C.; Lin, A.Q.; Zhou, Y.K.; Liu, Z.; Bai, P.; Zhu, Y.X.; Fan, J.M.; Bi, X.Y.; Kuang, H.Y.; Lian, H.L.; et al. Mutation in FvPAL2 leads to light red strawberry fruits and yellow-green petioles. Plant Sci. Int. J. Exp. Plant Biol. 2024, 352, 112370. [Google Scholar] [CrossRef] [PubMed]
  52. Ren, X.R.; Sun, M.; Hui, J.T.; Yang, J.; Zhang, J.; Li, P.B.; Lin, G.C. Combined Transcriptome and Metabolome Analyses Provide New Insights into the Changes in the Flesh Color of Anthocyanins in Strawberry (Fragaria × ananassa (Weston) Duchesne ex Rozier). Genes 2024, 15, 1391. [Google Scholar] [CrossRef] [PubMed]
  53. Thomas, H.; Gregor, K. Wilfried S RNAi-induced silencing of gene expression in strawberry fruit (Fragaria × ananassa) by agroinfiltration: A rapid assay for gene function analysis. Plant J. Cell Mol. Biol. 2006, 48, 818–826. [Google Scholar]
  54. Jiang, F.; Wang, J.Y.; Jia, H.F.; Jia, W.S.; Wang, H.Q.; Xiao, M. RNAi-Mediated Silencing of the Flavanone 3-Hydroxylase Gene and Its Effect on Flavonoid Biosynthesis in Strawberry Fruit. J. Plant Growth Regul. 2013, 32, 182–190. [Google Scholar] [CrossRef]
  55. Zhang, Y.C.; Li, W.J.; Dou, Y.J.; Zhang, J.X.; Jiang, G.H.; Miao, L.X.; Han, G.F.; Liu, Y.X.; Li, H.; Zhang, Z.H. Transcript Quantification by RNA-Seq Reveals Differentially Expressed Genes in the Red and Yellow Fruits of Fragaria vesca. PLoS ONE 2015, 10, e0144356. [Google Scholar] [CrossRef] [PubMed]
  56. Giampieri, F.; Gasparrini, M.; Forbes-Hernandez, T.Y.; Mazzoni, L.; Capocasa, F.; Sabbadini, S.; Alvarez-Suarez, M.J.; Afrin, S.; Rosati, C.; Pandolfini, T.; et al. Overexpression of the Anthocyanidin Synthase Gene in Strawberry Enhances Antioxidant Capacity and Cytotoxic Effects on Human Hepatic Cancer Cells. J. Agric. Food Chem. 2018, 66, 581–592. [Google Scholar] [CrossRef]
  57. Wu, Y.Q.; Han, T.Y.; Lyu, L.F.; Li, W.L.; Wu, W.L. Research progress in understanding the biosynthesis and regulation of plant anthocyanins. Sci. Hortic. 2023, 321, 112374. [Google Scholar] [CrossRef]
  58. Xu, P.B.; Wu, L.; Cao, M.H.; Ma, C.; Xiao, K.; Li, Y.B.; Lian, H.L. Identification of MBW Complex Components Implicated in the Biosynthesis of Flavonoids in Woodland Strawberry. Front. Plant Sci. 2021, 12, 774943. [Google Scholar] [CrossRef]
  59. Duan, W.; Sun, P.; Li, J. Expression of genes involved in the anthocyanin biosynthesis pathway in white and red fruits of Fragaria pentaphylla and genetic variation in the dihydroflavonol-4-reductase gene. Biochem. Syst. Ecol. 2017, 72, 40–46. [Google Scholar] [CrossRef]
  60. Kadomura-Ishikawa, Y.; Miyawaki, K.; Takahashi, A.; Noji, S. RNAi-mediated silencing and overexpression of the FaMYB1 gene and its effect on anthocyanin accumulation in strawberry fruit. Biol. Plant. 2015, 59, 677–685. [Google Scholar] [CrossRef]
  61. Fischer, C.T.; Mirbeth, B.; Rentsch, J.; Sutter, C.; Ring, L.; Flachowsky, H.; Habegger, R.; Hoffmann, T.; Hanke, M.; Schwab, W. Premature and ectopic anthocyanin formation by silencing of anthocyanidin reductase in strawberry (Fragaria × ananassa). New Phytol. 2014, 201, 440–451. [Google Scholar] [CrossRef] [PubMed]
  62. Xu, P.B.; Li, M.B.; Ma, C.; Li, X.Y.; Bai, P.; Lin, A.Q.; Wang, Q.; Zhang, L.Q.; Kuang, H.Y.; Lian, H.L. Loss-of-function mutation in anthocyanidin reductase activates the anthocyanin synthesis pathway in strawberry. Mol. Hortic. 2024, 4, 33. [Google Scholar] [CrossRef] [PubMed]
  63. Jiao, Y.; Huang, D.; Peng, B.Y.; Zhang, P.P.; Zhan, W.Y.; Xu, Z.Q.; Lv, J.B. Genome-wide identification, characterization, and expression profiling of bHLH genes under different development and abiotic stress conditions in Carya illinoinensis. S. Afr. J. Bot. 2025, 184, 815–826. [Google Scholar] [CrossRef]
  64. Salvatierra, A.; Pimentel, P.; Moya-León, M.A.; Herrera, R. Increased accumulation of anthocyanins in Fragaria chiloensis fruits by transient suppression of FcMYB1 gene. Phytochemistry 2013, 90, 25–36. [Google Scholar] [CrossRef] [PubMed]
  65. Pavel, S.; Jurgita, P.; Vaiva, K.; Erna, D.; Vidmantas, S.; Vidmantas, B.; Tadeušas, S.; Aušra, R.; Raimundas, R. Expression and Anthocyanin Biosynthesis-Modulating Potential of Sweet Cherry (Prunus avium L.) MYB10 and bHLH Gene. PLoS ONE 2015, 10, e0126991. [Google Scholar]
  66. Zhao, F.L.; Li, G.; Hu, P.P.; Zhao, X.; Li, L.J.; Wei, W.; Feng, J.Y.; Zhou, H.C. Identification of fundamental/helix-loop-helix transcription factors reveals candidate genes involved in anthocyanin biosynthesis from the strawberry white-flesh mutant. Sci. Rep. 2018, 8, 2721. [Google Scholar]
  67. Tian, J.; Xu, R.; Chang, K.Z.; Yuan, S.; Huang, C.X.; Wang, J.W.; Li, S.H.; Liu, F.Z.; Zhong, F.L. Identification of PAL Gene in Purple Cabbage and Functional Analysis Related to Anthocyanin Synthesis. Horticulturae 2023, 9, 469. [Google Scholar] [CrossRef]
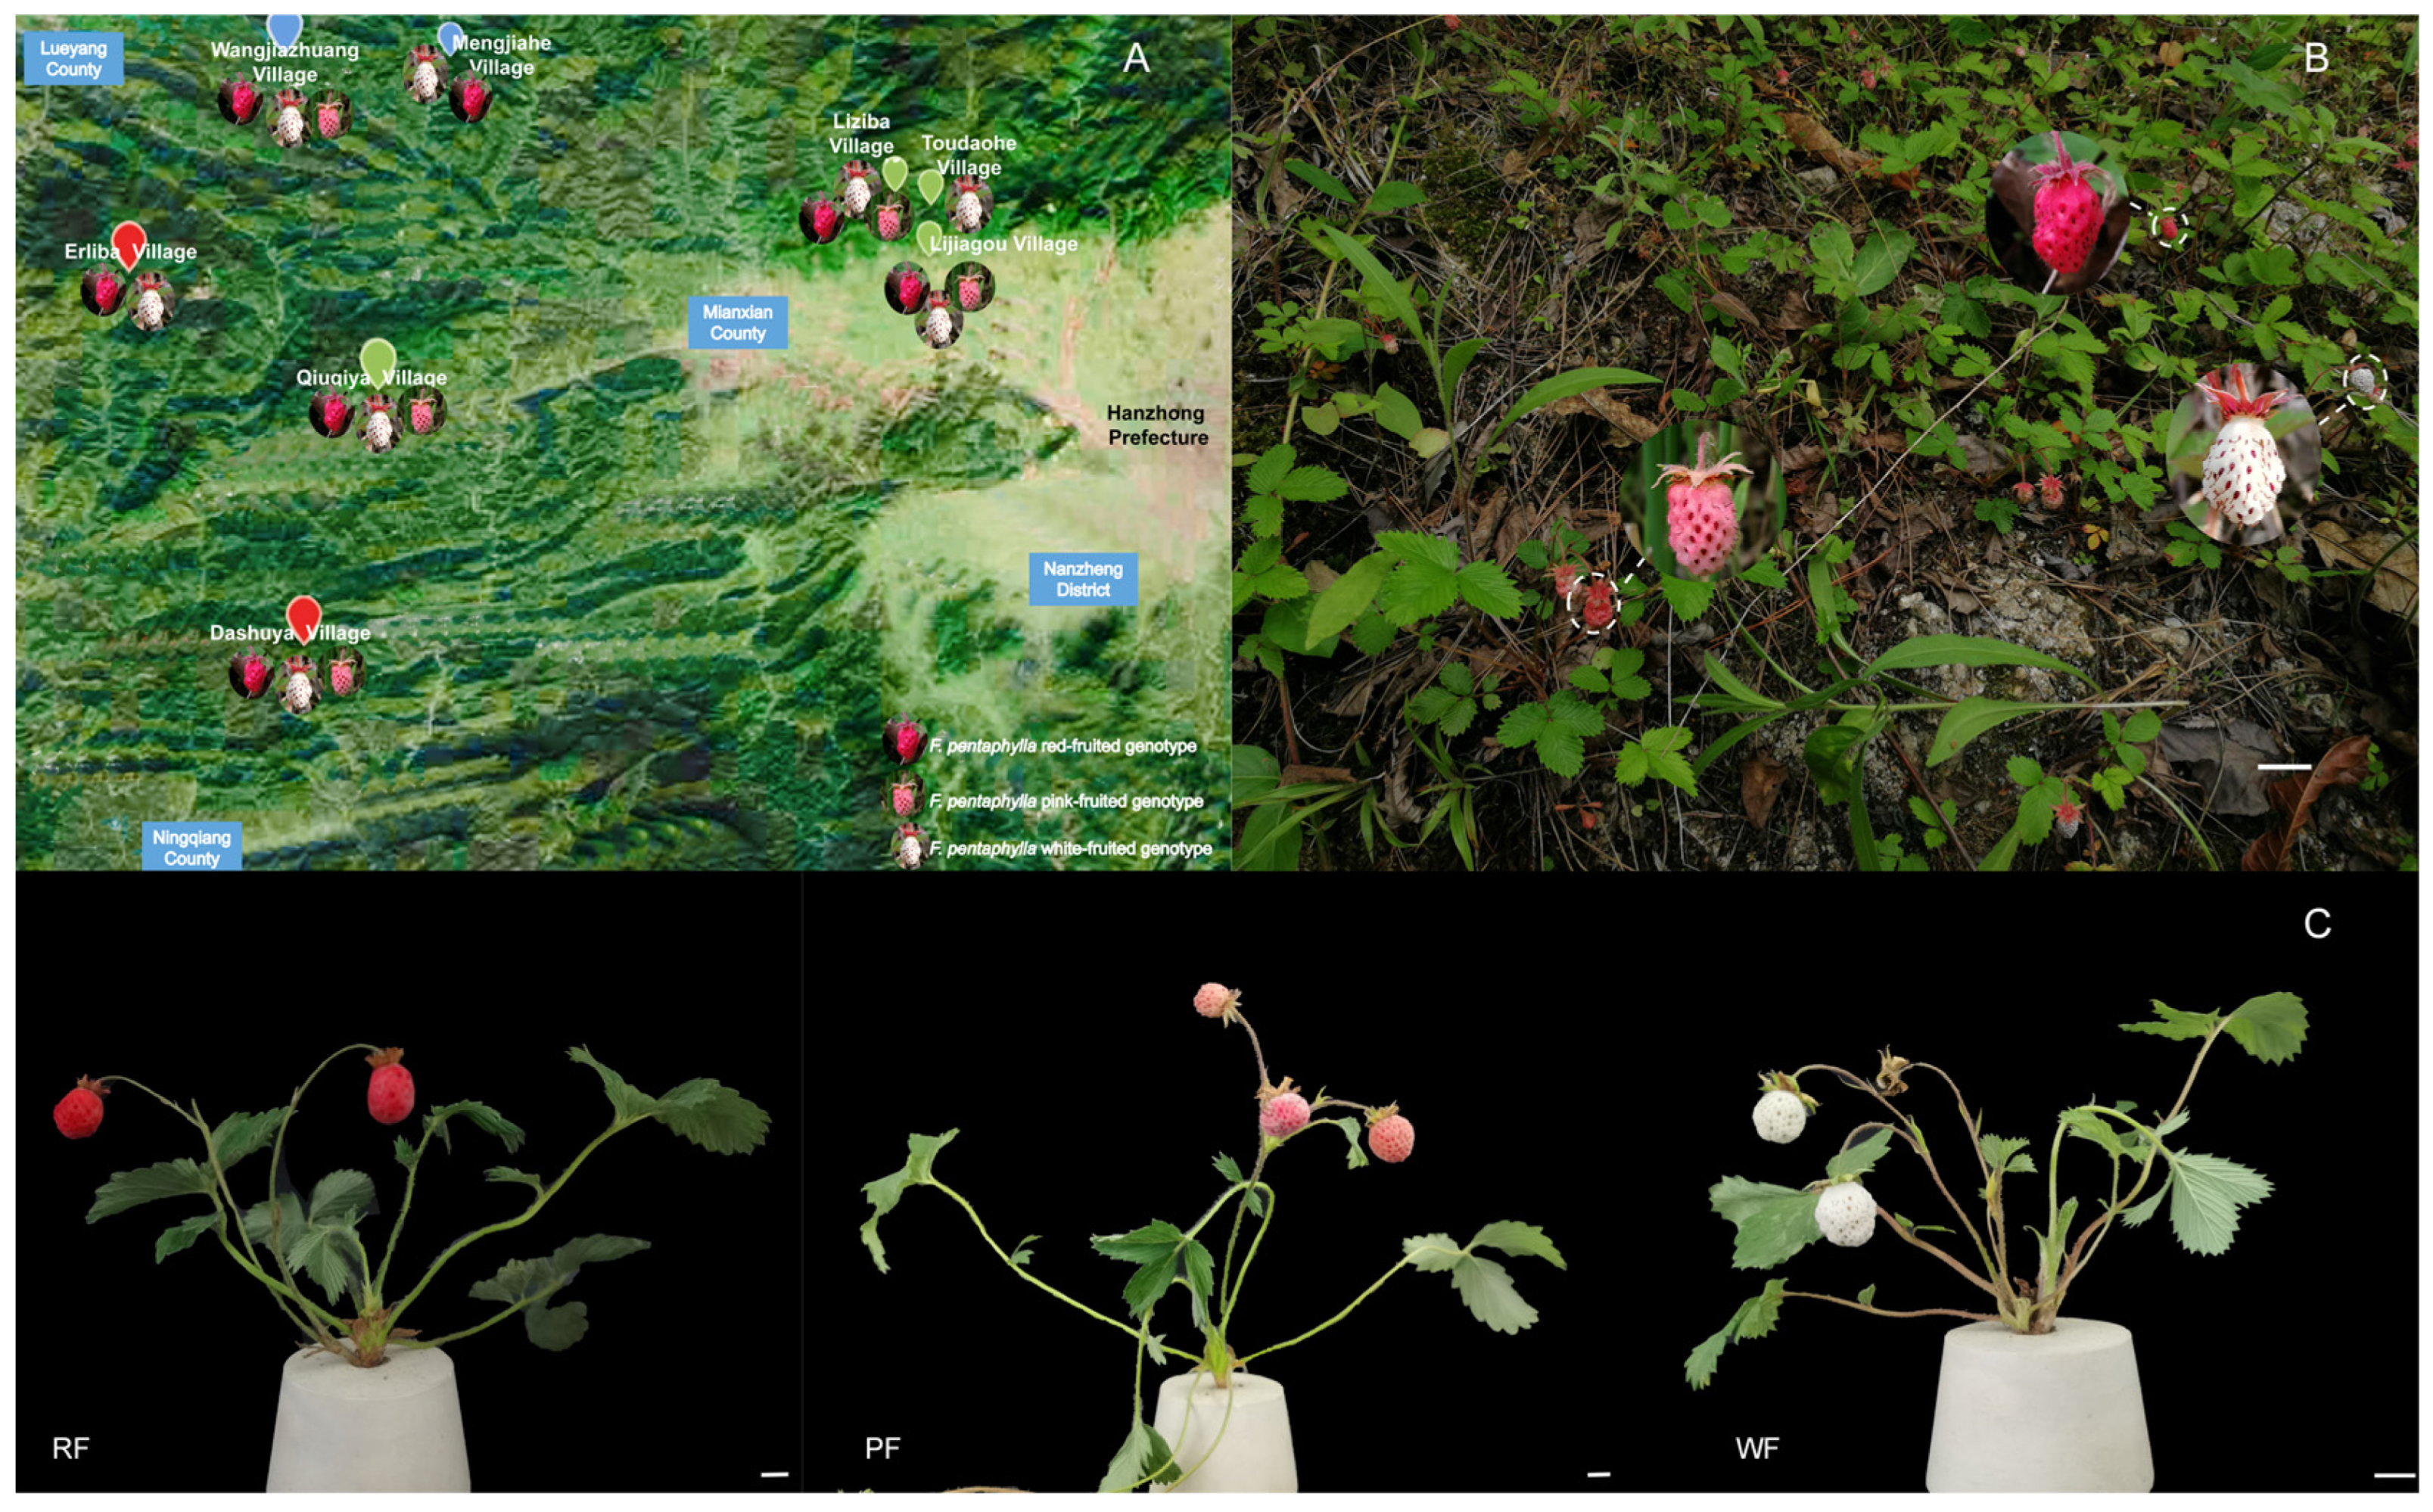
Figure 1. Fruits of different colors of F. pentaphylla used in deep sequencing. (A) The satellite distribution map of the collection site. (B) The native habitat map. (C) Plant materials. Scale bar = 6 mm.
Horticulturae 11 01097 g001
Figure 2. Metabolite analysis of fruit color differences in F. pentaphylla. (A) KEGG pathway annotation in POS and NEG. (B) HMDB annotation in POS and NEG. (C) Lipid maps annotation in POS and NEG.
Horticulturae 11 01097 g002
Figure 3. KEGG enrichment bubble diagram (positive ion mode on the left, negative ion mode on the right). (A) The KEGG pathway analysis of DEGs in LC_ vs. LC_P. (B) The KEGG pathway analysis of DEGs in LC_R vs. LC_W. (C) The KEGG pathway analysis of DEGs in LC_P vs. LC_W.
Horticulturae 11 01097 g003
Figure 4. Anthocyanin composition.
Horticulturae 11 01097 g004
Figure 5. Frequency of Up- and Down-Regulated Differentially Expressed Genes in Pairwise Comparisons of F. pentaphylla with Different Fruit Colors.
Horticulturae 11 01097 g005
Figure 6. GO classification of F. pentaphylla transcriptome data.
Horticulturae 11 01097 g006
Figure 7. Network diagram of differential metabolite and differential gene correlations in F. pentaphylla.
Horticulturae 11 01097 g007
Figure 8. Expression levels of genes related to fruit color formation of F. pentaphylla in different fruit colors.
Horticulturae 11 01097 g008
Figure 9. Metabolic pathways for fruit color formation in F. pentaphylla. The red arrow points to the pathway for red fruit formation, the blue arrow points to white fruit, and the dark blue arrow points to pink fruit. This metabolic pathway only highlights the more obvious pathway products.
Horticulturae 11 01097 g009
Table 1. Real-time fluorescent quantitative PCR primers.
GenesForward Primer (5′–3′)Reverse Primer (3′–5′)
GAPDHGCCACCCAGAAGACTGTTGATGCCAGTGCTGCTAGGAATGATGTTG
FpbHLH18CTTCATCAACCAGTGGCACATAGAATCGGGTGACAGTGAGAG
FpbHLH91GGTGCCAGAGACGACGATGAGCTCCTCAGAGACCCATTGTTGTA
FpbHLH93GAGTGCTCACAGTCCCATCTACTCCTCATCCTCCACCATTG
FpMYB1CCAGACGAAGACGACCTAATAATCGGTGTTCCAGTAGTTCTTGATCTC
FpMYB24CGACAAGCAAGACACGAACAAAGGTGAGGAAGGGTACGCCAACAAC
FpMYB114GTGTTCTGGTCTTATTGGTTTGGAGACTAGATCATTGCTTGCCGATT
FpDFR1GAAGGCGGCGACTCACTTGCATAGGTGTGGCGACATGGAAC
FpDFR2CGAGCCACCGTGCGAGACGCCTTCCACAGCGTCAGTAGC
FpLARGGCTCCATCGGCAAGTTCATAGAGGGTCATTGACAGTGGTCTCTCT
FpUFGTCCTCCAGACTCCGTACTATTCTATGAACCGCTGCTGACT
FpANRAAGTCTGCTTGTGTCATCGGTGGGTCTCTAACAGTGGTTCT
FpPALCCACAGACGAACCAAGCAAGGGGTGAGGCAGAGTGTGAGACT
FpCHSCGTCGAGACCGTTGTGCTTCAAGTTGGGTGGTGTCGCTGTC
FpCHITCGGAGTCTACTTGGAGGATAAGGCCTGTAACGATCTCCCTGAAGAAC
Table 2. Analysis of anthocyanin composition.
CompoundsMolecular WeightRT (min)Relative Quantification
RFPFWF
keracyanin594.158377.5781.02 × 1075.72 × 1042.88 × 105
cyanidin3-O-rutinoside 5-O-beta-D-glucoside betaine756.208577.9354.20 × 1053.88 × 1042.65 × 105
Procyanidin A2576.129049.3911.01 × 1061.49 × 1061.01 × 106
Procyanidin B1578.142216.3054.40 × 1065.06 × 1069.58 × 106
Procyanidin B2578.141946.451.35 × 1061.41 × 1062.93 × 106
Procyanidin C1866.20361.3711.05 × 1053.13 × 1054.42 × 105
Myricetin318.039847.8257.35 × 1055.42 × 1052.34 × 106
Quercetin302.042348.7331.68 × 1073.94 × 1071.53 × 107
Dihydromyricetin320.052267.8494.11 × 1042.86 × 1045.34 × 104
Taxifolin304.057448.8162.80 × 1073.55 × 1072.59 × 107
Catechin290.078436.9344.41 × 1075.83 × 1076.94 × 107
Hesperetin302.07797.6775.52 × 1053.83 × 1059.57 × 104
Prunin434.12128.1199.22 × 1062.22 × 1061.15 × 105
Apiin564.147437.9211.12 × 1061.62 × 1064.29 × 105
Table 3. Transcriptome sequencing data statistics.
SampleRaw ReadsRaw BasesValid ReadsValid BasesValid (%)Q20%Q30%GC
RF147,908,1947.19 G44,887,5086.73 G93.6999.9597.2047
RF244,473,9146.67 G41,528,0386.23 G93.3899.9597.1747
RF353,874,2288.08 G49,677,8427.45 G92.2199.9597.0647
PF154,261,8648.14 G50,135,9267.52 G92.4099.9597.0847
PF241,872,8446.28 G37,341,4025.60 G89.1899.9596.8047
PF361,661,4669.25 G57,837,0448.68 G93.8099.9597.0547
WF151,405,6427.71 G48,344,6627.25 G94.0599.9597.1547
WF264,389,2429.66 G61,227,9069.18 G95.0999.9596.9647
WF353,240,2807.99 G49,899,7527.48 G93.7399.9597.0047
Table 4. Genes associated with secondary metabolic pathways are annotated in transcriptomic data.
Pathway NamePathway IDKEGG Annotated
Caffeine metabolismko002323
Aflatoxin biosynthesisko002541
Indole alkaloid biosynthesisko009011
Phenylpropanoid biosynthesisko0094030
Flavonoid biosynthesisko0094118
Anthocyanin biosynthesisko009424
Isoflavonoid biosynthesisko009437
Flavone and flavonol biosynthesisko009441
Stilbenoid, diarylheptanoid, and gingerol biosynthesisko009457
Disclaimer/Publisher’s Note: The statements, opinions and data contained in all publications are solely those of the individual author(s) and contributor(s) and not of MDPI and/or the editor(s). MDPI and/or the editor(s) disclaim responsibility for any injury to people or property resulting from any ideas, methods, instructions or products referred to in the content.