Article

Chemical Profiling of Monoterpenes and Genome-Wide Discovery of Monoterpene Synthases in Artemisia annua

1
Integrative Science Center of Germplasm Creation in Western China (CHONGQING) Science City, State Key Laboratory of Resource Insects, SWU-TAAHC Medicinal Plant Joint R&D Centre, School of Life Sciences, Southwest University, Chongqing 400715, China
2
Institute of Traditional Chinese & Ethnic Medicine Resources, Guizhou University of Traditional Chinese Medicine, Guiyang 550025, China
3
College of Pharmaceutical Sciences, Southwest University, Chongqing 400715, China
4
Key Laboratory of Xizang Medicine Resources Conservation and Utilization of Xizang Autonomous Region, Xizang Agriculture and Animal Husbandry University, Linzhi 860000, China
5
Biological Science Research Center, Southwest University, Chongqing 400715, China
6
Technology Development Center, Chongqing Medical and Pharmaceutical College, Chongqing 401331, China
*
Authors to whom correspondence should be addressed.
Horticulturae 2025, 11(9), 1083; https://doi.org/10.3390/horticulturae11091083
Submission received: 5 August 2025 / Revised: 28 August 2025 / Accepted: 1 September 2025 / Published: 8 September 2025
(This article belongs to the Special Issue Plant Secondary Metabolism and Its Applications in Horticulture)

Abstract

Monoterpenoids serve as essential components of plant essential oils and play significant roles in plant growth, development, and insect resistance. Artemisia annua, an important medicinal plant, produces abundant terpenoids. While previous research on A. annua has predominantly focused on artemisinin biosynthesis and its regulation, studies on other terpenoids in this plant have significantly lagged behind. To comprehensively investigate monoterpene biosynthesis in A. annua, we analyzed monoterpenes across its different tissues using optimized extraction and chromatographic conditions developed to enhance sensitivity and resolution in our GC-MS-based analytical method. In A. annua, 31 monoterpenoid compounds were identified. Subsequently, eight candidate monoterpene synthases (mTPS) were characterized in Escherichia coli, confirming their catalytic activity in converting geranyl pyrophosphate (GPP) into distinct monoterpene products. Subcellular localization revealed these TPSs in chloroplasts, consistent with the widely reported chloroplast localization of TPS enzymes. These enzymes were functionally defined as monoterpenoid synthases, collectively responsible for synthesizing 18 monoterpenoid metabolites. Notably, AaTPS13, AaTPS19, and AaTPS20 exhibited substantial product promiscuity. Critically, the AaTPS19 was identified as the first known terpene synthase producing 2-pinanol. These findings systematically elucidate the biosynthesis of monoterpenoids in A. annua and provide key enzymatic elements for metabolic engineering and synthetic biology applications in monoterpenoid production.

1. Introduction

Plant essential oils are volatile secondary metabolites, which predominantly consist of terpenoids, aromatic compounds, and aliphatic constituents. Due to their bioactive properties, essential oils have broad applications in healthcare and related industries [1]. Among these compounds, terpenoids have been the most extensively studied for their pharmacological and biological activities [2]. Terpenoids also play essential roles in plant defense and ecological interactions [3,4,5]. Representative cases include herbivore- and pollinator-mediated interactions [6,7,8]. For example, herbivore infestation triggers the emission of (E)-β-caryophyllene in Zea mays, a sesquiterpene that activates jasmonic acid signaling in neighboring plants, subsequently up-regulating insect resistance-related gene expression [6]. Artemisia annua is a species renowned for producing artemisinin, a sesquiterpene lactone with global recognition as an antimalarial agent. Beyond this famous compound, A. annua biosynthesizes a diverse array of volatile terpenoids, including monoterpenes and sesquiterpenes, which collectively constitute the core components of its essential oil [9,10]. A total of 26 monoterpenoids have been identified in a self-pollinated A. annua by GC-MS using two temperature procedures [11]. Collectively, these findings underscore A. annua as a suitable system to investigate monoterpene biosynthesis; however, a systematic, tissue-resolved monoterpene atlas integrated with a functional characterization of the underlying synthases remains lacking.
Monoterpenes are key constituents of plant essential oils whose profiles vary with species, tissue, development, and environment [12,13]. For example, 17 monoterpenes and 27 sesquiterpenes were detected in different tissues of Chrysanthemum indicum [14], while Wurfbainia villosa [15] contained 25 monoterpenes and 23 sesquiterpenes. The diversity of monoterpenes is intrinsically linked to plant environmental adaptation, and is primarily generated by monoterpene synthases (mTPSs) that catalyze geranyl pyrophosphate (GPP) into multiple C10 skeletons. Based on structural and functional characteristics, TPS enzymes are phylogenetically classified into seven subfamilies (TPS-a to TPS-h) [16]. Among these, the TPS-b/g subfamily dominates monoterpene formation in angiosperms [17]. The TPS-a subfamily primarily comprises the majority of sesquiterpene synthases, while the TPS-c and TPS-d subfamilies, along with the TPS-e/f subfamilies, are associated with diterpene synthesis. The TPS-h subfamily is unique to lycophytes [18]. Systematic identification and functional analysis of monoterpene synthases are therefore important for expanding our knowledge of monoterpene diversity and for mining candidate genes with potential applications.
The establishment and optimization of analytical workflows form a cornerstone for plant natural product identification [19]. For monoterpenes, GC-MS is the predominant platform. However, analytical resolution is frequently hampered by isomer co-elution and low-abundance in complex matrices [20]. Targeted optimization of extraction and GC-MS conditions (e.g., solvent selection and temperature programming) can substantially improve separation and detection, enabling a more accurate terpenoids assignment [21,22,23]. Thus, a tailored GC-MS workflow is a prerequisite for reliable monoterpene profiling and mTPS product delineation.
Despite advances in A. annua terpenoid research, a high-resolved monoterpene atlas integrated with genome-wide mining and the functional characterization of monoterpene synthases remains unavailable. Moreover, to our knowledge, some monoterpene, such as 2-pinanol, have been reported in plants, yet no dedicated 2-pinanol synthase has been biochemically characterized. To address these gaps, we hypothesize that integrating optimized GC-MS profiling with genome-wide identification and the functional analysis of monoterpene synthases in A. annua will provide a more precise monoterpene scope not only in monoterpenes profiling in tissues but also in the enzymatic analysis of promiscuous monoterpene synthases. We further hypothesize that the genome-wide identification of mTPS would uncover novel monoterpene synthases. The objectives of this study were to: (1) establish a highly sensitive and reproducible GC-MS method optimized for monoterpenes; (2) comprehensively profile the tissue-specific distribution of monoterpenes in A. annua; (3) identify and characterize the full complement of monoterpene synthase (mTPS) genes in the A. annua genome; and (4) functionally validate the catalytic activities of candidate mTPSs in vitro, precisely defining their product profiles.

2. Materials and Methods

This study established a highly sensitive and resolvable GC-MS method. Based on this improved method, we analyzed the monoterpenoid in tissues of A. annua and further characterized eight monoterpene synthases as following the route (Figure 1).

2.1. Plant Materials and Chemicals

The A. annua seeds used in this study were collected from the medicinal plant garden at Southwest University (Chongqing, China) [24,25]. Plants were grown under controlled conditions (25 °C, 16/8 h light/dark cycle) in a greenhouse. Fresh tissues (roots, stems, and leaves) were collected from 2-month-old plants, then immediately frozen in liquid nitrogen, and stored at −80 °C until analysis. The “mixture” sample refers to an equal fresh-weight composite of roots, stems, and leaves (1:1:1, FW), used as a QC-like composite for method optimization and reproducibility assessment. α-pinene, β-myrcene, limonene, terpinolene, linalool, and 4-carvomenthenol standards (SHYUANYE, Shanghai, China). Geraniol, nerol, β-pinene, borneol, camphor, eucalyptol, bornyl acetate, α-terpineol, camphene, sabinene, β-phellandrene, and ocimene standards (Macklin, Shanghai, China); GPP and FPP (Sigma-Aldrich, St. Louis, MO, USA).

2.2. Establishment and Validation of GC-MS Methodology for Monoterpenoids Analysis

The factors investigated in this study include extraction solvents, carrier gas flow rate, and heating rate [26]. Extraction solvents: five solvents—acetone, n-hexane, petroleum ether, ethyl acetate, and dichloromethane—were systematically evaluated for their extraction efficiencies. Carrier gas flow rate: Flow rates of 1.0 mL/min and 1.5 mL/min were compared. Heating rate: gradients of 5 °C/min, 8 °C/min, 10 °C/min, and 15 °C/min were assessed [11,27,28].
Each extraction solvent was tested in a separate parallel experiment; no solvent mixtures were used. For each sample, 300 mg of fresh mixture sample was combined with 1.5 mL of a single solvent, vortex-mixed for 2 min to ensure thorough contact between sample powder and solvent, and sonicated (40 kHz, 250 W) at 55 °C for 1 h. After centrifugation, the supernatant was filtered through a 0.22 μm nylon membrane. The analytical framework for volatile terpenoid detection was established using Thermo Scientific TSQ 9610 coupled with TG-5SILMS chromatographic column (30 m × 250 µm × 0.25 µm film thickness, Thermo Fisher Scientific, Waltham, MA, USA). The oven temperature program initiated at 40 °C (5min hold), followed by different temperature ramp (5 °C/min, 8 °C/min, 10 °C/min, and 15 °C/min) to 300 °C (30 min hold), achieving optimal resolution of high-boiling-point terpenoids. Ultra-high-purity helium (99.999%) served as the carrier gas at a constant flow rate of 1.0 mL/min, or 1.5 mL/min. A 1 µL sample was automatically injected under split mode (5:1 ratio).
Method repeatability was assessed using three independently extracted aliquots (n = 3) from the same homogenized sample; each extract was injected in duplicate. Precision was expressed as the relative standard deviation (RSD) of retention times and peak areas for the target compounds.

2.3. Profiling A. annua Volatile Monoterpenoids Via GC-MS

Volatile terpenoids were extracted from four samples of A. annua, including roots, stems, leaves, and their mixtures. Three independent biological replicates—each comprising pooled tissues from five individual plants—were analyzed. Relative metabolite abundances were quantified using peak area. Statistical analysis was performed by GraphPad Prism 10.0. Significant differences (p < 0.05) across tissues were assessed using one-way ANOVA with Tukey’s post hoc test. For multivariate pattern recognition, principal component analysis (PCA) was performed using the Omicshare platform (https://www.omicshare.com).

2.4. Compound Identification and Quantification

Compound identification was performed using the NIST17 spectral library and reference standards (similarity greater than 95%) (Figure S1). Dodecane was used as a quantitative internal standard added to the samples. Relative metabolite abundances were quantified based on peak areas and expressed as nanograms per milligram of fresh weight (ng/mg FW), with average concentrations derived from three biological replicates.

2.5. Genome-Wide Identification of Monoterpene Synthase (TPS) Genes in A. annua

To identify putative TPS genes in A. annua, a Hidden Markov Model (HMM) search was conducted using the HMMER3.0 suite (version 3.3.2) with the Pfam domains PF01397 (TPS N-terminal domain) and PF03936 (TPS C-terminal domain) as queries. Sequences exhibiting >90% amino acid similarity were clustered into orthologous groups to minimize redundancy. This approach yielded a comprehensive dataset of candidate TPS genes, which were subsequently annotated using the UniProtKB/Swiss-Prot database [22].
To retrieve monoterpene synthase genes, full-length TPS sequences from A. annua and related plant species with experimentally validated enzymatic activities were retrieved from the National Center for Biotechnology Information (NCBI). Multiple sequence alignment was performed using ClustalW (version 2.1) with default parameters, followed by manual curation in DNAMAN (version 9.0) to identify conserved motifs, such as the DDxxD and NSE/DTE metal-binding domains critical for catalytic activity. A maximum likelihood (ML) phylogenetic tree was constructed using MEGA11.0 with the Poisson substitution model and 1,000 bootstrap replicates to assess node support. The tree was visualized and annotated using the Interactive Tree of Life (iTOL) platform (https://itol.embl.de/, accessed on 30 July 2025). Finally, eight candidate TPS genes were selected based on their phylogenetic clustering within the TPS-b/g subfamily—known to encode monoterpene synthases.

2.6. Subcellular Localization

The encoding sequences of eight mTPSs were subcloned into a pCAMBIA1302-GFP vector with the primers listed in Table S1. The generated plasmid was then introduced to Agrobacterium tumefaciens strain GV3101. The empty vector was used as a control. The constructs were transiently transformed into the protoplasts of Nicotiana benthamiana for subcellular localization assay. The GFP fluorescence was observed with Olympus FV1000 confocal microscope (Olympus, Kyoto, Japan). GFP emissions were detected between 500 nm and 530 nm. The autofluorescence was detected under 560 nm.

2.7. Isolation of Full-Length TPS Transcripts and qRT-PCR Validation

Total RNA was extracted from roots, stems, leaves, and mixed tissues of A. annua using TRIzol reagent (Invitrogen, ThermoFisher, Waltham, MA, USA), followed by DNase I treatment to eliminate genomic DNA contamination. First-strand cDNA was synthesized from 200 ng of RNA using a PrimeScript™ RT reagent kit (Takara Biomedical Technology (Beijing) Co., Ltd., Beijing, China) in a 20 μL reaction volume. Full-length TPS cDNAs were amplified via touchdown PCR using PrimeSTAR Max DNA Polymerase (Takara) with gene-specific primers (Table S1). The thermal cycling protocol included an initial denaturation at 98 °C for 1min, followed by 35 cycles of denaturation (98 °C, 15 s), annealing (65–55 °C, gradient decrease of 0.5 °C per cycle), and extension (68–72 °C, 1.5–2 min). PCR products were cloned into pLB vectors. For quantitative real-time PCR (qRT-PCR), primers were designed using Primer-BLAST (NCBI) to span exon-exon junctions, ensuring specificity. The β-actin gene served as an internal reference. Reactions were performed in triplicate on CFX96 Touch Real-Time PCR Detection System (Bio-Rad Laboratories, Inc., Hercules, CA, USA) using qPCR MasterMix (Applied Biological Materials Inc., Richmond, BC, Canada). Relative expression levels were calculated via the 2−∆∆Ct method, and the primers for qPT-PCR were designed using NCBI Primer (https://www.ncbi.nlm.nih.gov/tools/primer-blast, accessed on 30 July 2025; Table S1). Statistical analysis was conducted using GraphPad Prism version 10.0. Significant differences (p < 0.05) among tissue samples were evaluated by one-way ANOVA.

2.8. Recombinant Protein Expression and Enzymatic Characterization

To characterize the catalytic activities of the eight candidate monoterpene synthases, each gene was heterologously expressed in Escherichia coli, and the recombinant proteins were purified for in vitro enzymatic assays as described below. The coding sequences of -tp-TPS genes were subcloned into the pET32a expression vector (Novagen brand, EMD Millipore, Billerica, MA, USA) via the In-Fusion HD Cloning System (Takara), using gene-specific primers (Table S1) designed to incorporate NdeI and XhoI restriction sites. Recombinant plasmids were transformed into Rosetta (DE3) competent cells, and a single colony was inoculated into lysogeny broth (LB) medium supplemented with carbenicillin (50 mg/L) and chloramphenicol (34 mg/L). Cultures were incubated at 37 °C with shaking (220 rpm) until the OD600 reached 0.5. Protein expression was induced by adding isopropyl β-D-1-thiogalactopyranoside (IPTG) to a final concentration of 0.1 mM, followed by incubation at 16 °C for 20 h tominimize inclusion body formation. Cells were harvested by centrifugation at 12,000 rpm for 5 min at 4 °C, and pellets were flash-frozen in liquid nitrogen for 10min to enhance cell lysis efficiency. For protein extraction, pellets were resuspended in ice-cold phosphate-buffered saline (PBS) containing 10 mM imidazole (pH 7.4) and lysed via ultrasonic disruption (30% amplitude, 5 s pulse/10 s interval, and 15min total; Sonics Vibra-Cell). Cellular debris was removed by centrifugation at 12,000 rpm for 25min at 4 °C. The soluble fraction was loaded onto a pre-equilibrated Ni-NTA affinity column (QIAGEN N.V., Hilden, Germany), and unbound proteins were washed with 20 mM PBS-imidazole (pH 7.2). Target proteins were eluted using a stepwise imidazole gradient (50–500 mM) in PBS, with the final elution buffer containing 500 mM imidazole (pH 7.2). Protein purity was assessed by 12% SDS-PAGE at 70 V for 20 min and then at 200 V for 40 min, and concentrations were quantified via the Bradford assay (Bio-Rad) using bovine serum albumin (BSA) as a standard. To remove imidazole and exchange buffer, purified proteins were dialyzed overnight at 4 °C against 50 mM HEPES (pH 7.5) using Slide-A-Lyzer™ dialysis cassettes (10 kDa cutoff; Thermo Scientific). [14,29]. Enzyme activity assays were conducted to characterize the catalytic properties of recombinant AaTPS proteins. Reactions were performed in a 100 μL total volume containing 50 μg of purified enzyme, 100 μM geranyl pyrophosphate (GPP), 25 mM HEPES buffer (pH 7.6), 5 mM MgCl2, and 5 mM dithiothreitol (DTT) to maintain reducing conditions. The mixture was incubated at 30 °C for 3 h to balance reaction completeness and product stability. Boiled AaTPSs proteins were used as negative controls.

3. Results

3.1. Optimization of Extraction and GC-MS Conditions for Monoterpenoids Analysis

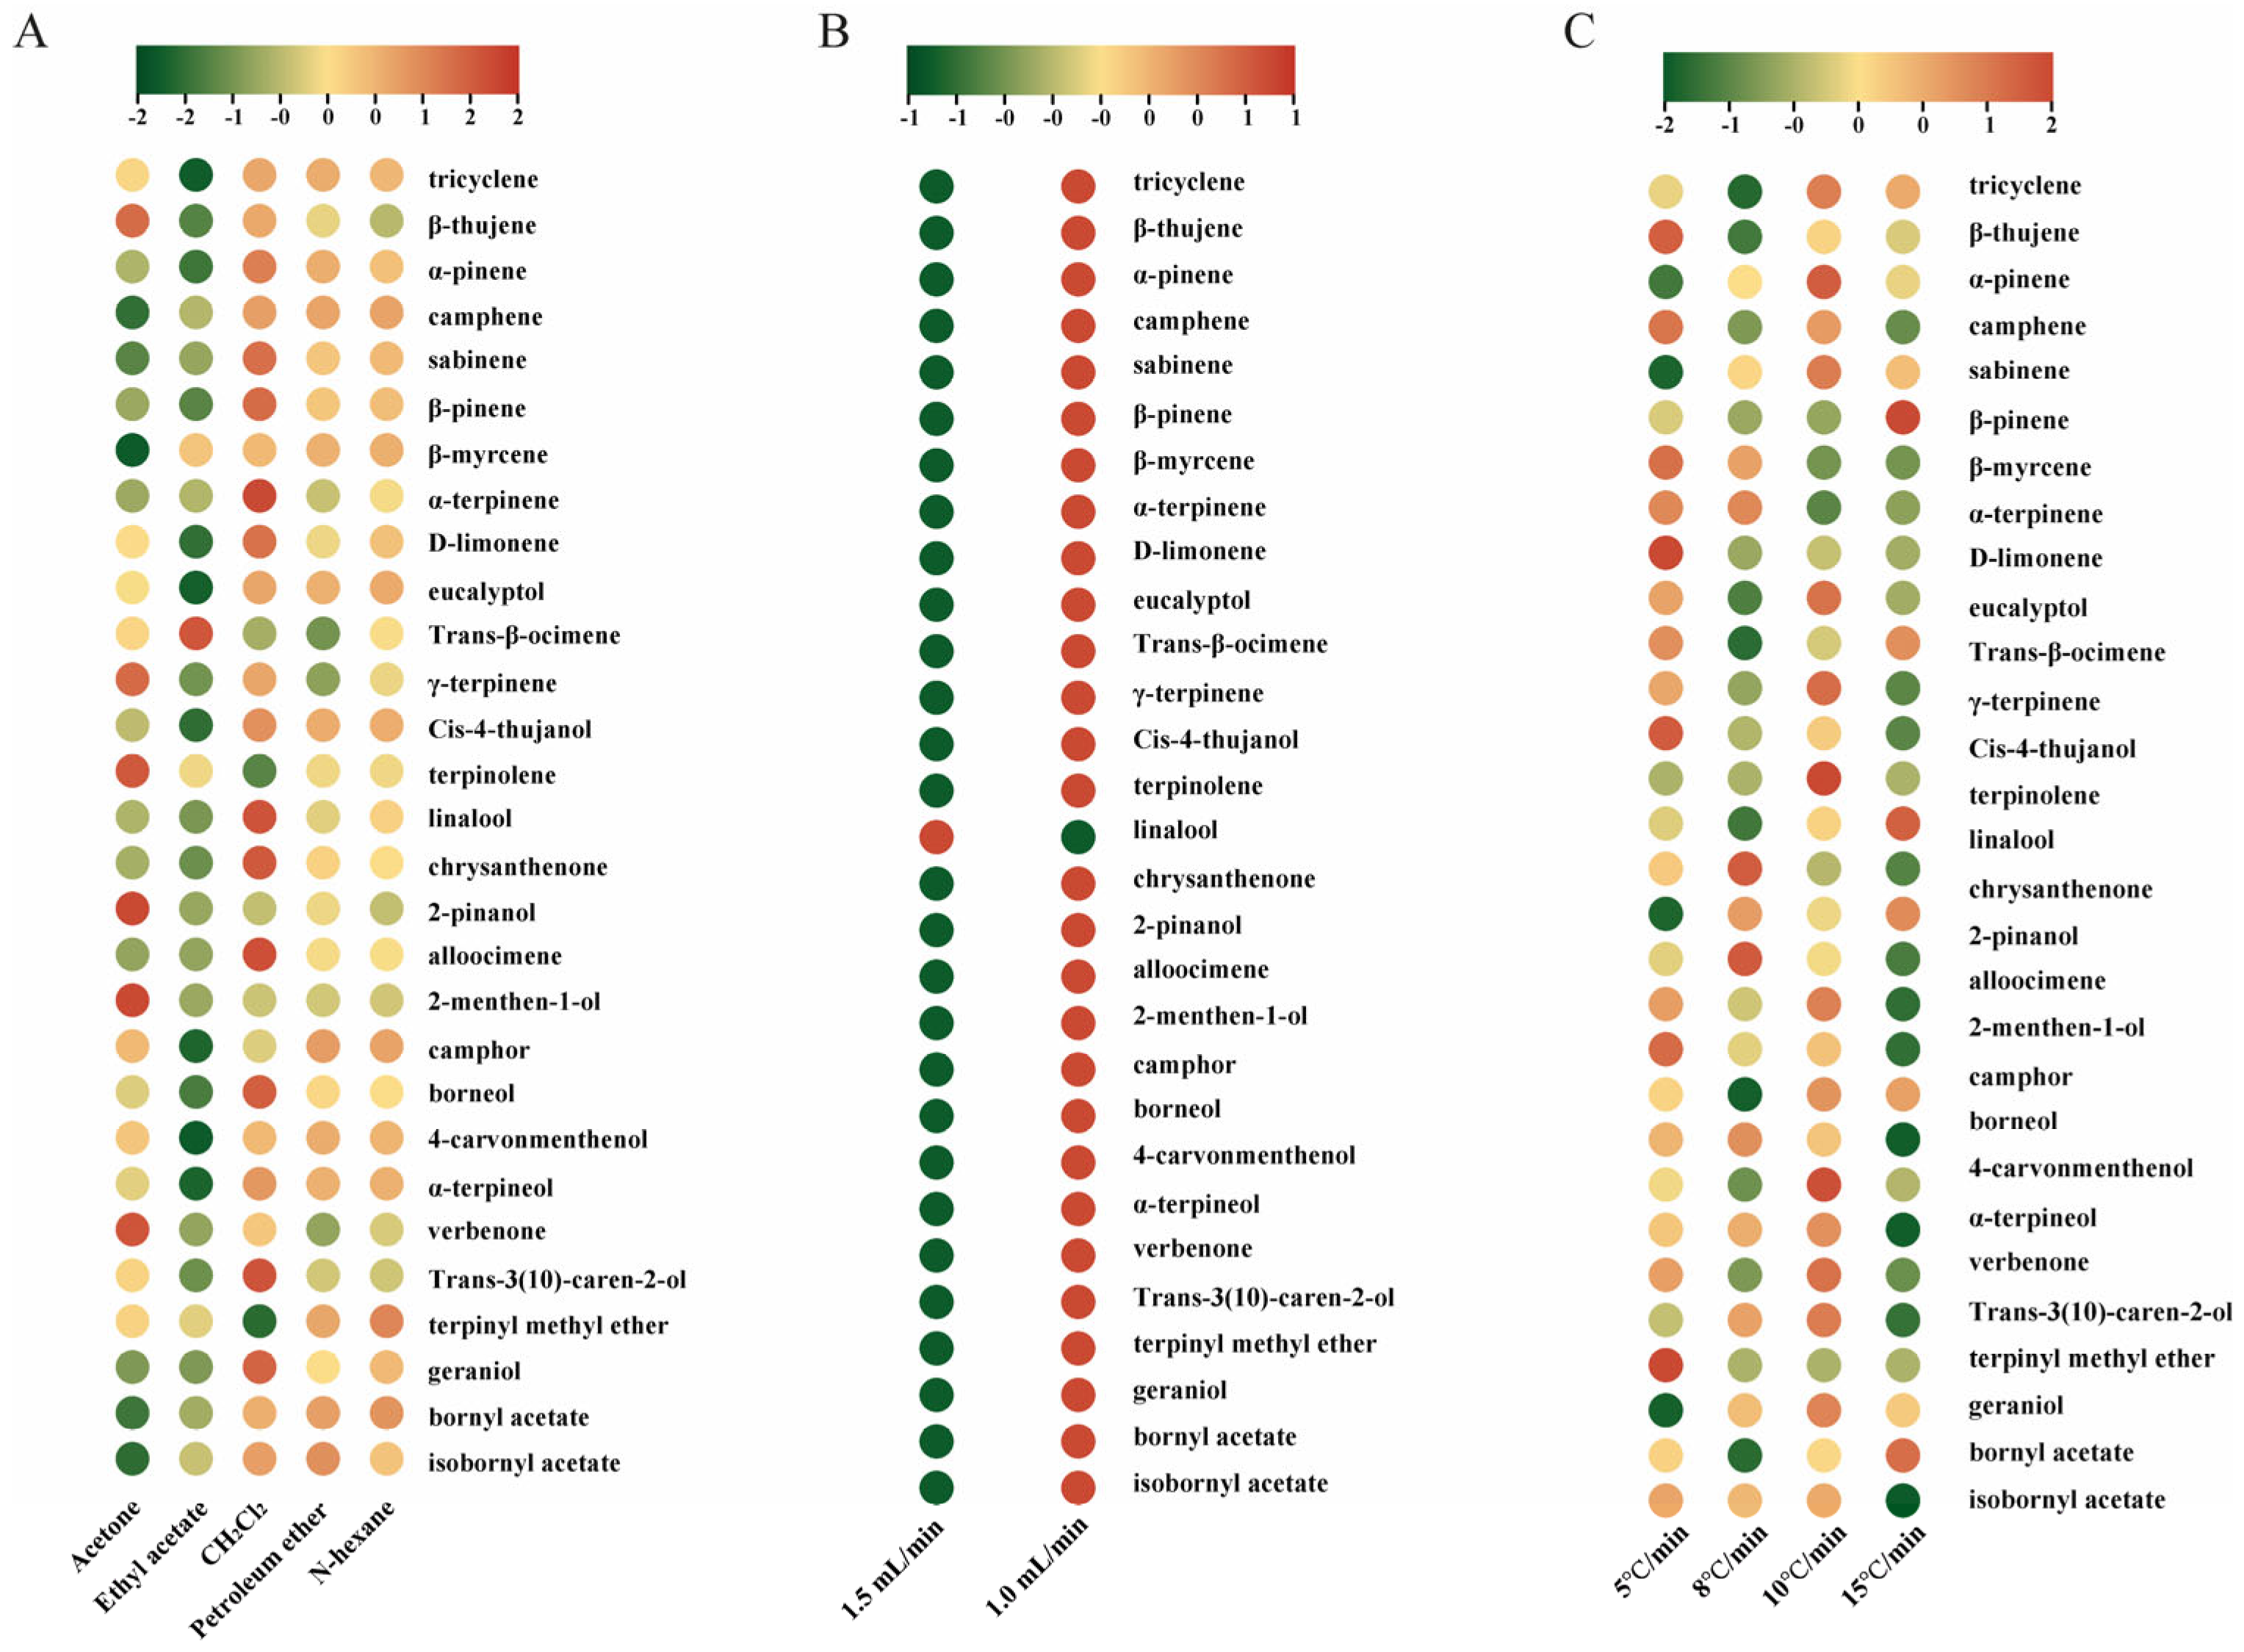
To systematically evaluate the monoterpenoids in A. annua, we screened five extraction solvents (n-hexane, ethyl acetate, dichloromethane, petroleum ether, and acetone) and optimized GC–MS parameters, namely the carrier gas flow rate and oven heating rate. The n-hexane and dichloromethane demonstrated the identification of 31 monoterpenoids, whereas the remaining solvents exhibited poor performance in detecting trace compounds, as such, only 28 monoterpenoids were detected using ethyl acetate and acetone (Figure 2A and Table S2). Given the toxicity of dichloromethane, we selected n-hexane as the extraction solvent for subsequent analyses. Subsequently, carrier gas flow rates were systematically tested. Lower flow rates significantly increased the response values for most monoterpenoids (Figure 2B and Table S3). Finally, we compared heating rates and found that slower ramps, while extending the run time, enhanced separation and enabled the detection of low-abundance components such as nerol (Figure 2C and Table S4). Rapid ramps led to a partial co-elution that obscured trace signals and hindered confident MS library matching, whereas gradual heating improved the resolution for isomeric and low-concentration analytes. Before tissue-wise comparisons, we assessed a pooled QC-like sample across three independent biological replicates. Retention times and peak-area RSDs for most compounds fell within acceptable limits (RSD ≤ 15%) (Tables S5 and S6), confirming that the optimized temperature program had the largest impact on separation and a reliable comparative quantification among the parameters tested.
Based on these evaluations, we selected n-hexane as the extraction solvent, the lower carrier gas flow rate (1.0 mL/min), and a slower oven ramp (5°C/min) as the working GC–MS conditions. This combination maximized monoterpenoid coverage (31 compounds), improved resolution and signal-to-noise for isomeric and low-abundance analytes (e.g., nerol), and yielded an acceptable precision for retention times and peak areas (RSD ≤ 15%). These optimized settings were used for all subsequent analyses.

3.2. Monoterpenoid Profiling in A. annua Under Optimized Extraction and GC-MS Conditions

Under the optimized extraction–GC–MS workflow, tissue-resolved monoterpenoid profiles of A. annua were acquired from the roots, stems, leaves, and a pooled QC-like mixture. Total ion chromatogram showed a broad chromatographic resolution across analytes (Figure 3A). After NIST library screening and standard referencing where available, we identified 31 monoterpenoids, comprising 6 acyclic, 11 monocyclic, 13 bicyclic, and 1 tricyclic types (Figure 3B and Table S7). Leaves had the highest abundance and diversity of monoterpenoids, followed by stems and then roots. A principal component analysis (PCA) revealed clear tissue separation (Figure 3C). The loading plot showed that six significantly different monoterpenoids—bornyl acetate, cis-carveol, trans-3(10)-caren-2-ol, camphor, camphene, and eucalyptol—were identified as major contributors to inter-tissue variation (Figure 3D). The roots contained the fewest monoterpenoid types and generally had lower levels than stems and leaves, with the notable exception of bornyl acetate, which was relatively enriched in the roots. Stems were characterized by camphor as the predominant component, accompanied by moderate levels of 1,8-cineole and trans-3(10)-caren-2-ol. Leaves encompassed nearly all the monoterpenes detected in A. annua. In addition, many monoterpenoids, such as camphene, 1,8-cineole, and camphor, were highly abundant in leaves and substantially exceeded levels in roots and stems. Of note, trans-β-ocimene was only found in the pooled sample, possibly due to non-enzymatic reactions.
Collectively, these results delineate tissue-specific monoterpenoid signatures in A. annua and highlight key discriminant compounds. Furthermore, to our knowledge, this optimized extraction-GC-MS workflow enabled detection of the broadest set of monoterpenoids reported for A. annua to date; notably, tricyclene, nerol, β-thujene, trans-β-ocimene, alloocimene, and isobornyl acetate have not been previously documented in this species.

3.3. Genome-Wide Identification of Monoterpene Synthase Candidates and Subcellular Localization

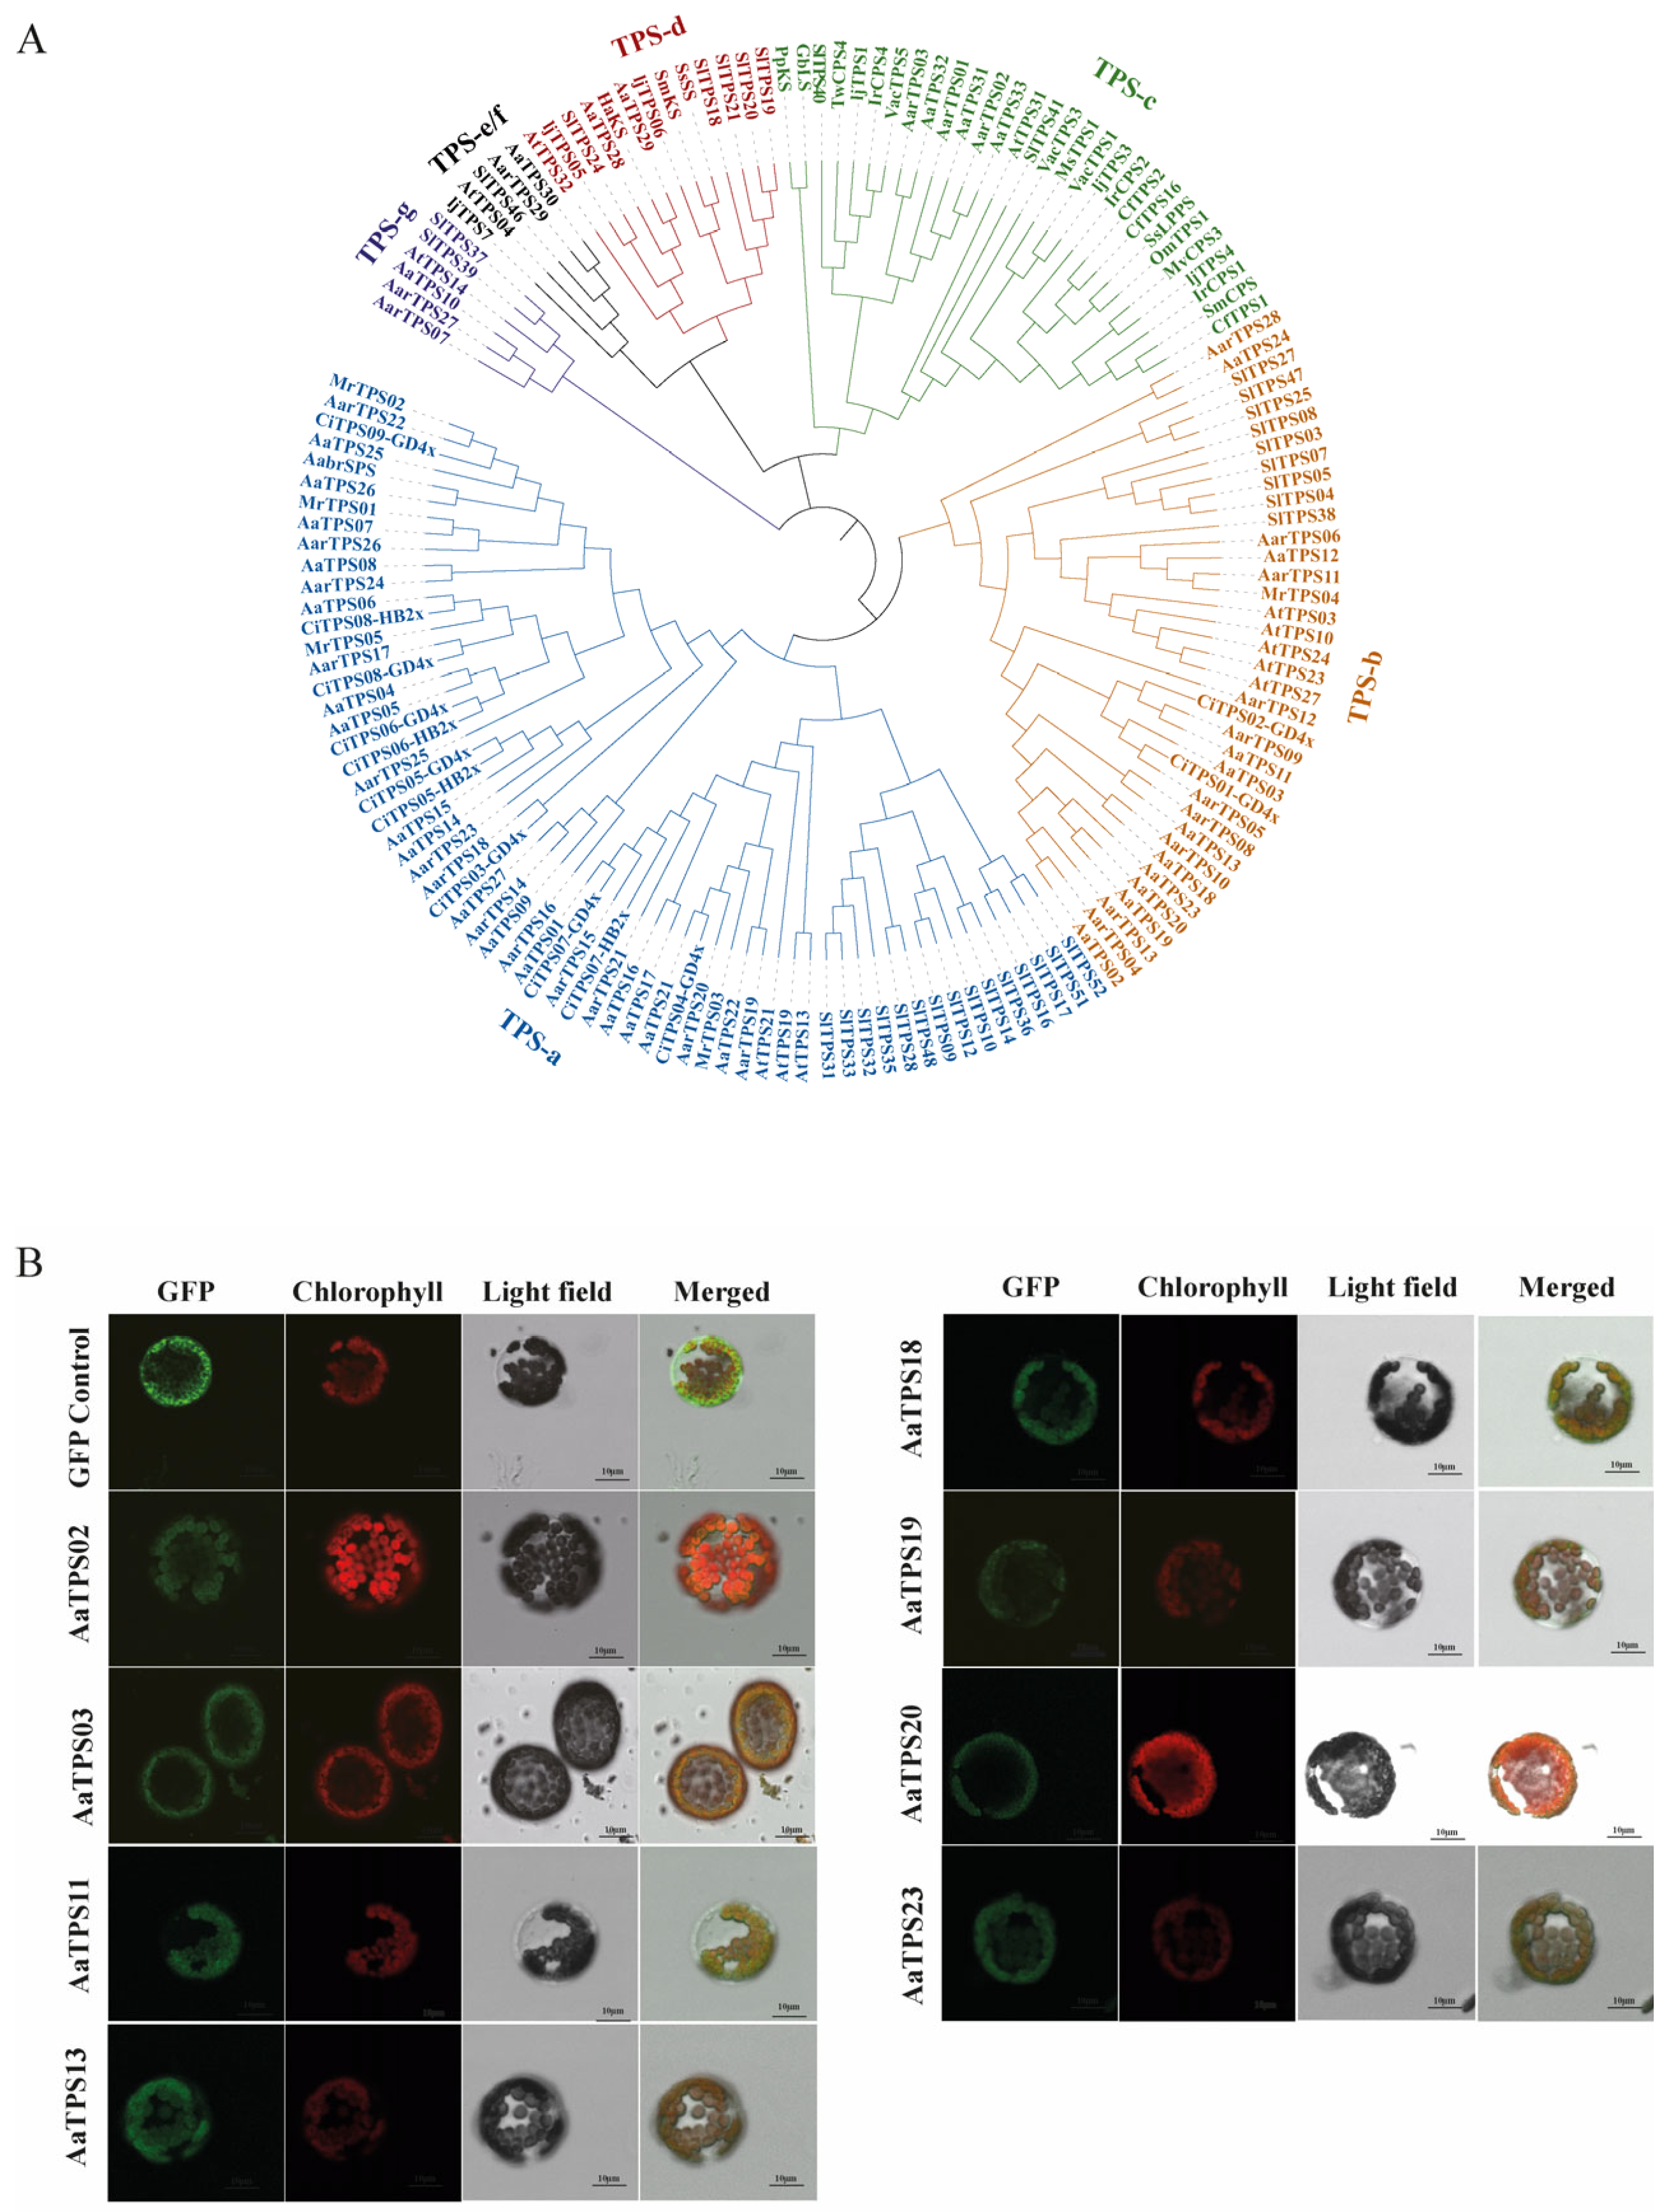
Monoterpenoid biosynthesis is initiated by monoterpene synthases that convert plastidic geranyl diphosphate (GPP) into diverse C10 monoterpene skeletons, which are subsequently tailored into oxygenated monoterpenoids. To investigate the enzymes underlying monoterpenoids biosynthesis in A. annua, we performed a genome-wide mining of terpene synthases (TPSs). Using HMMER against canonical TPS HMM profiles and local BLASTp searches, we retrieved 33 non-redundant TPS-like proteins from the A. annua genome. Subsequently, a phylogenetic tree using characterized TPSs from Arabidopsis thaliana, Artemisia argyi, Solanum lycopersicum, and other plants with well-defined TPS subfamilies and known activities was performed (Figure 4A) [30,31]. This analysis assigned A. annua TPSs to established subfamilies and pinpointed eight candidates clustering within monoterpene-associated clades TPS-b and TPS-g: AaTPS02, AaTPS03, AaTPS11, AaTPS13, AaTPS18, AaTPS19, AaTPS20, and AaTPS23 (Figure 4A).
A multiple sequence alignment confirmed that all eight candidates contain intact DDxxD and NSE/DTE motifs required for catalysis. In addition, transit-peptide prediction indicated N-terminal plastid-targeting sequences for these candidates (Figure S2). Based on phylogenetic clustering, the presence of plastid transit peptides, and intact catalytic motifs, we prioritized these eight candidates as putative monoterpene synthases of A. annua (AamTPSs) for experimental validation.
To determine the subcellular localization of AamTPSs, the coding sequences were fused in-frame to the N terminus of the green fluorescent protein (GFP) and transiently expressed in tobacco (Nicotiana benthamiana) leaf mesophyll protoplasts. Consistent with most monoterpene synthase, GFP fluorescence co-localized with chlorophyll autofluorescence, indicating chloroplast localization for all eight AamTPSs (Figure 4B). These localization data corroborate the bioinformatic predictions and support a role for these AaTPSs in plastid-based monoterpene biosynthesis in A. annua.

3.4. In Vitro Characterization of Monoterpene Synthase in Artemisia annua

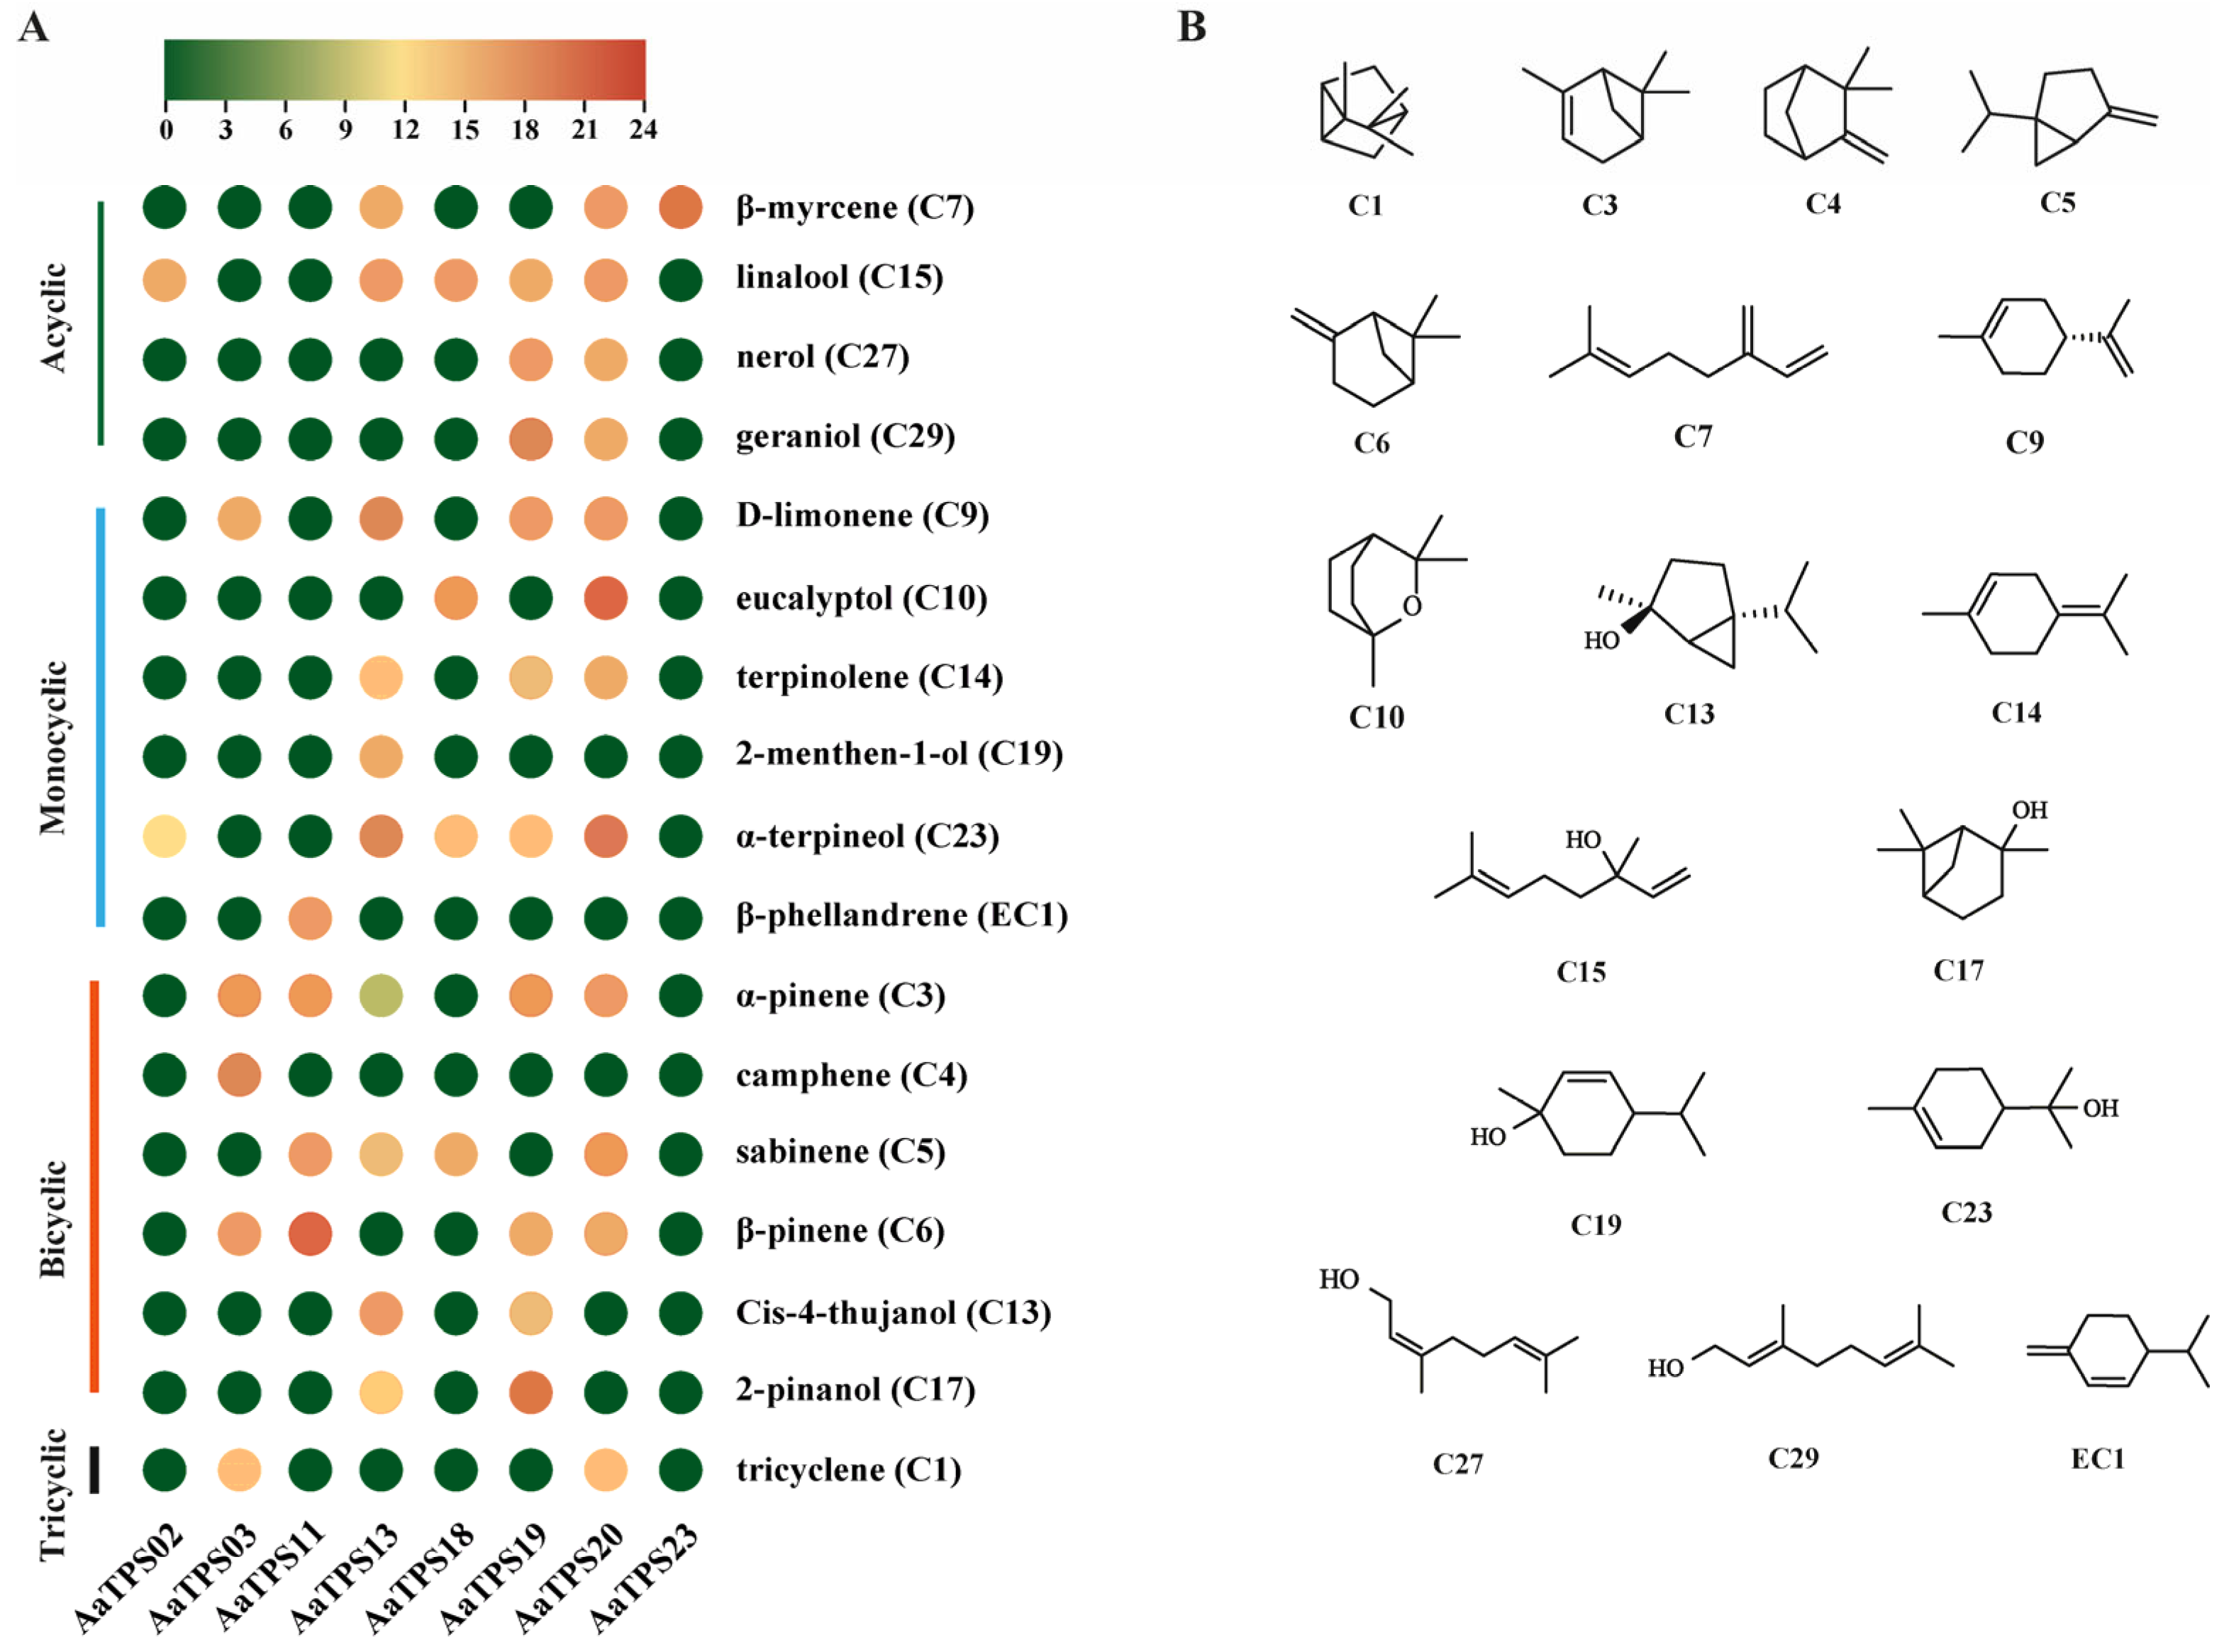
To characterize the activities of eight putative AamTPSs, we expressed and purified the recombinant proteins and verified purity by SDS-PAGE (Figure S3). Subsequently, we conducted in vitro enzymatic assays using geranyl diphosphate (GPP) and farnesyl diphosphate (FPP) as substrates. Under our assay conditions, all eight enzymes converted GPP to monoterpenes (Figure 5, Figures S4–S8), whereas assays with FPP did not yield detectable sesquiterpene products above control levels. An activity atlas summarizing the eight enzymes was shown in Figure 5A, with product structures in Figure 5B. Major products per enzyme were listed in Table S9. Because several enzymes generated complexes with potential co-eluting products, we next examined whether oven ramping influences the product detection and relative quantification.
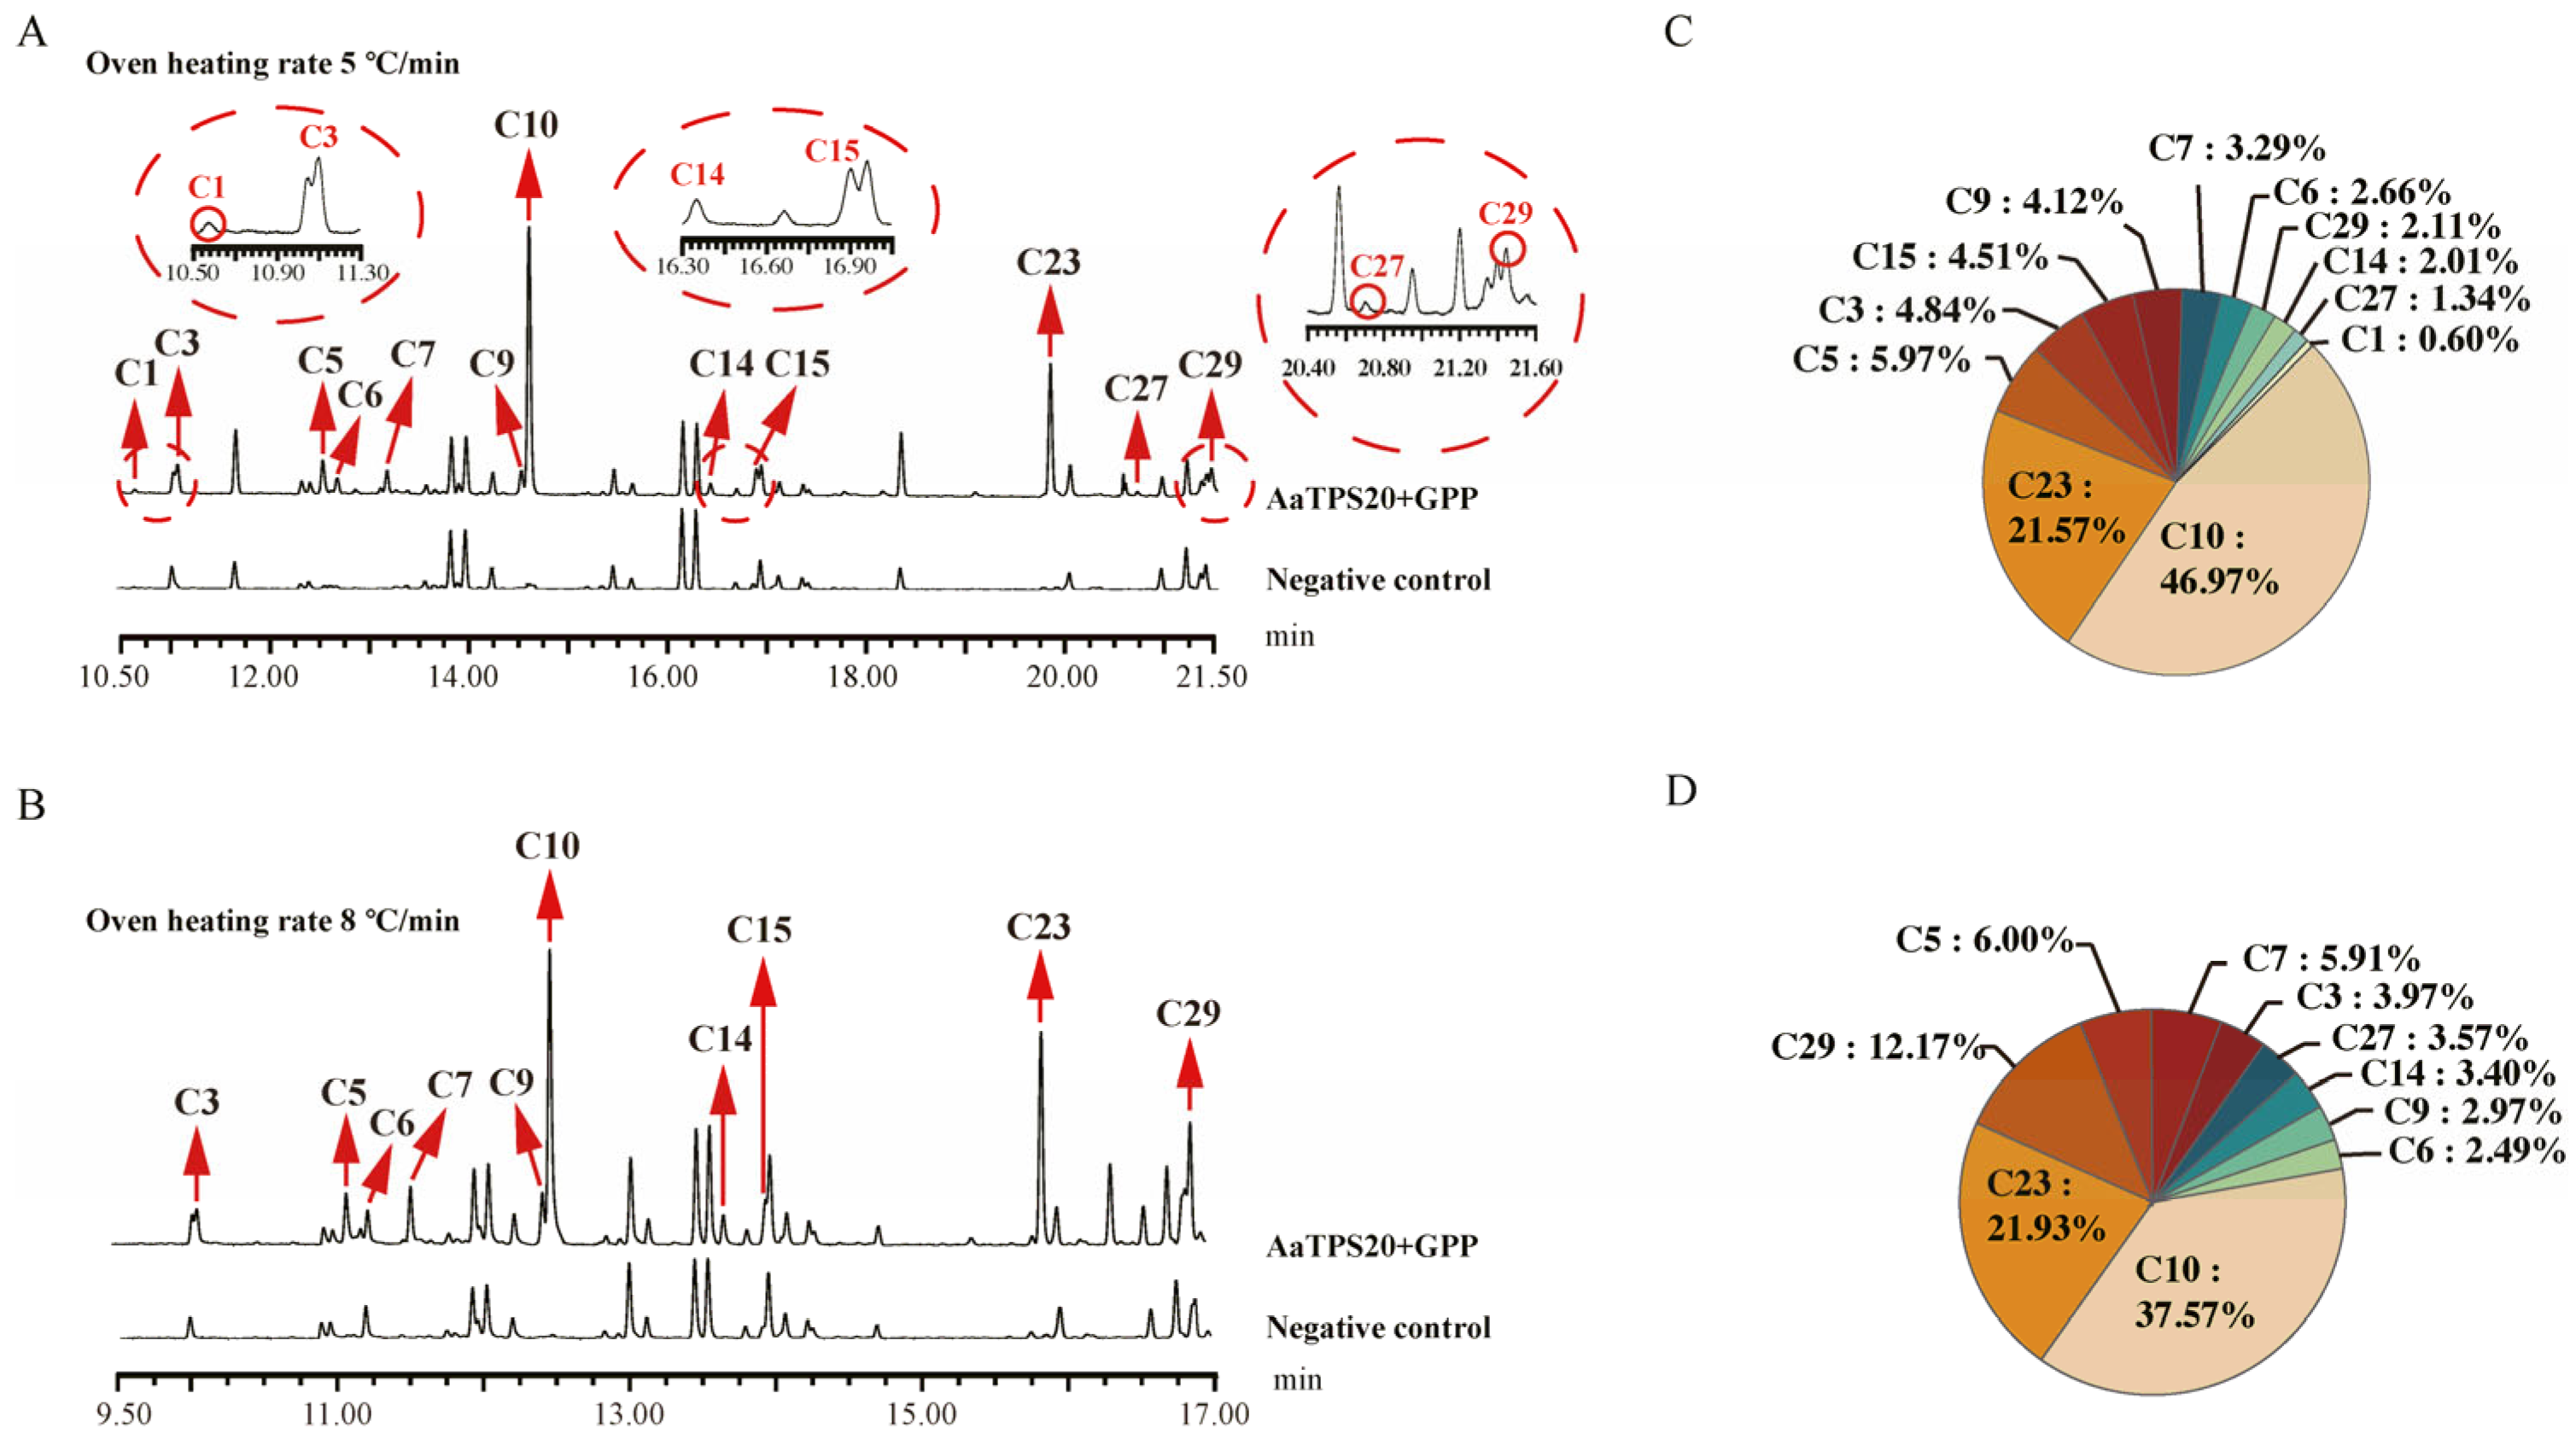
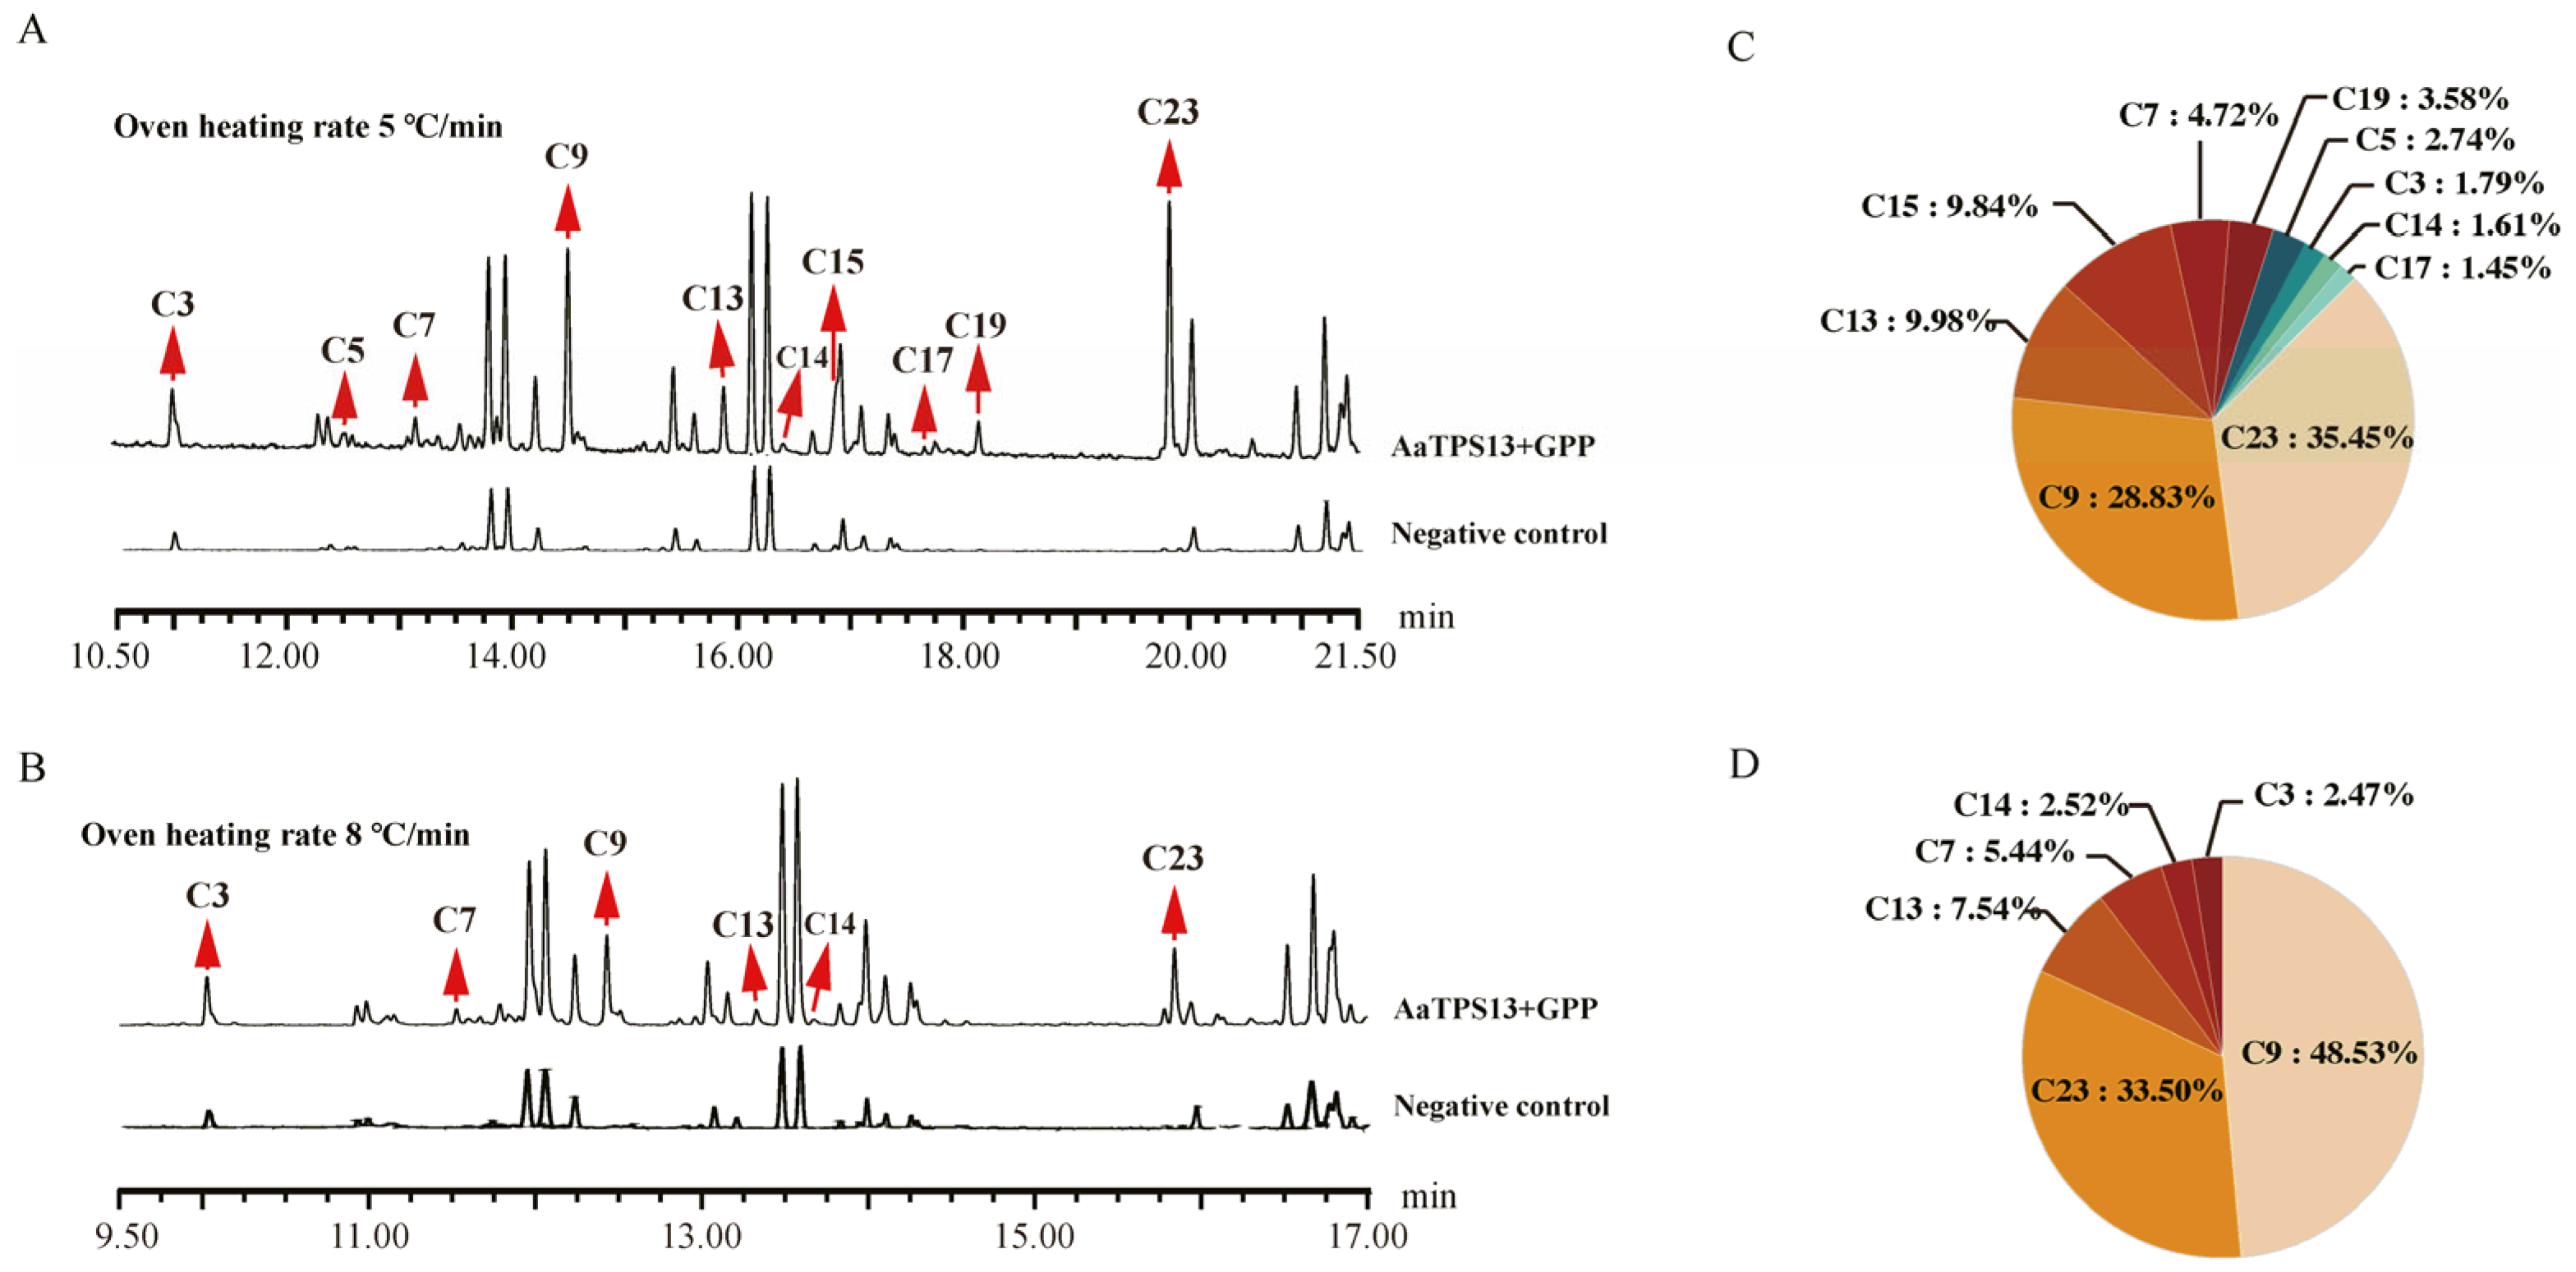
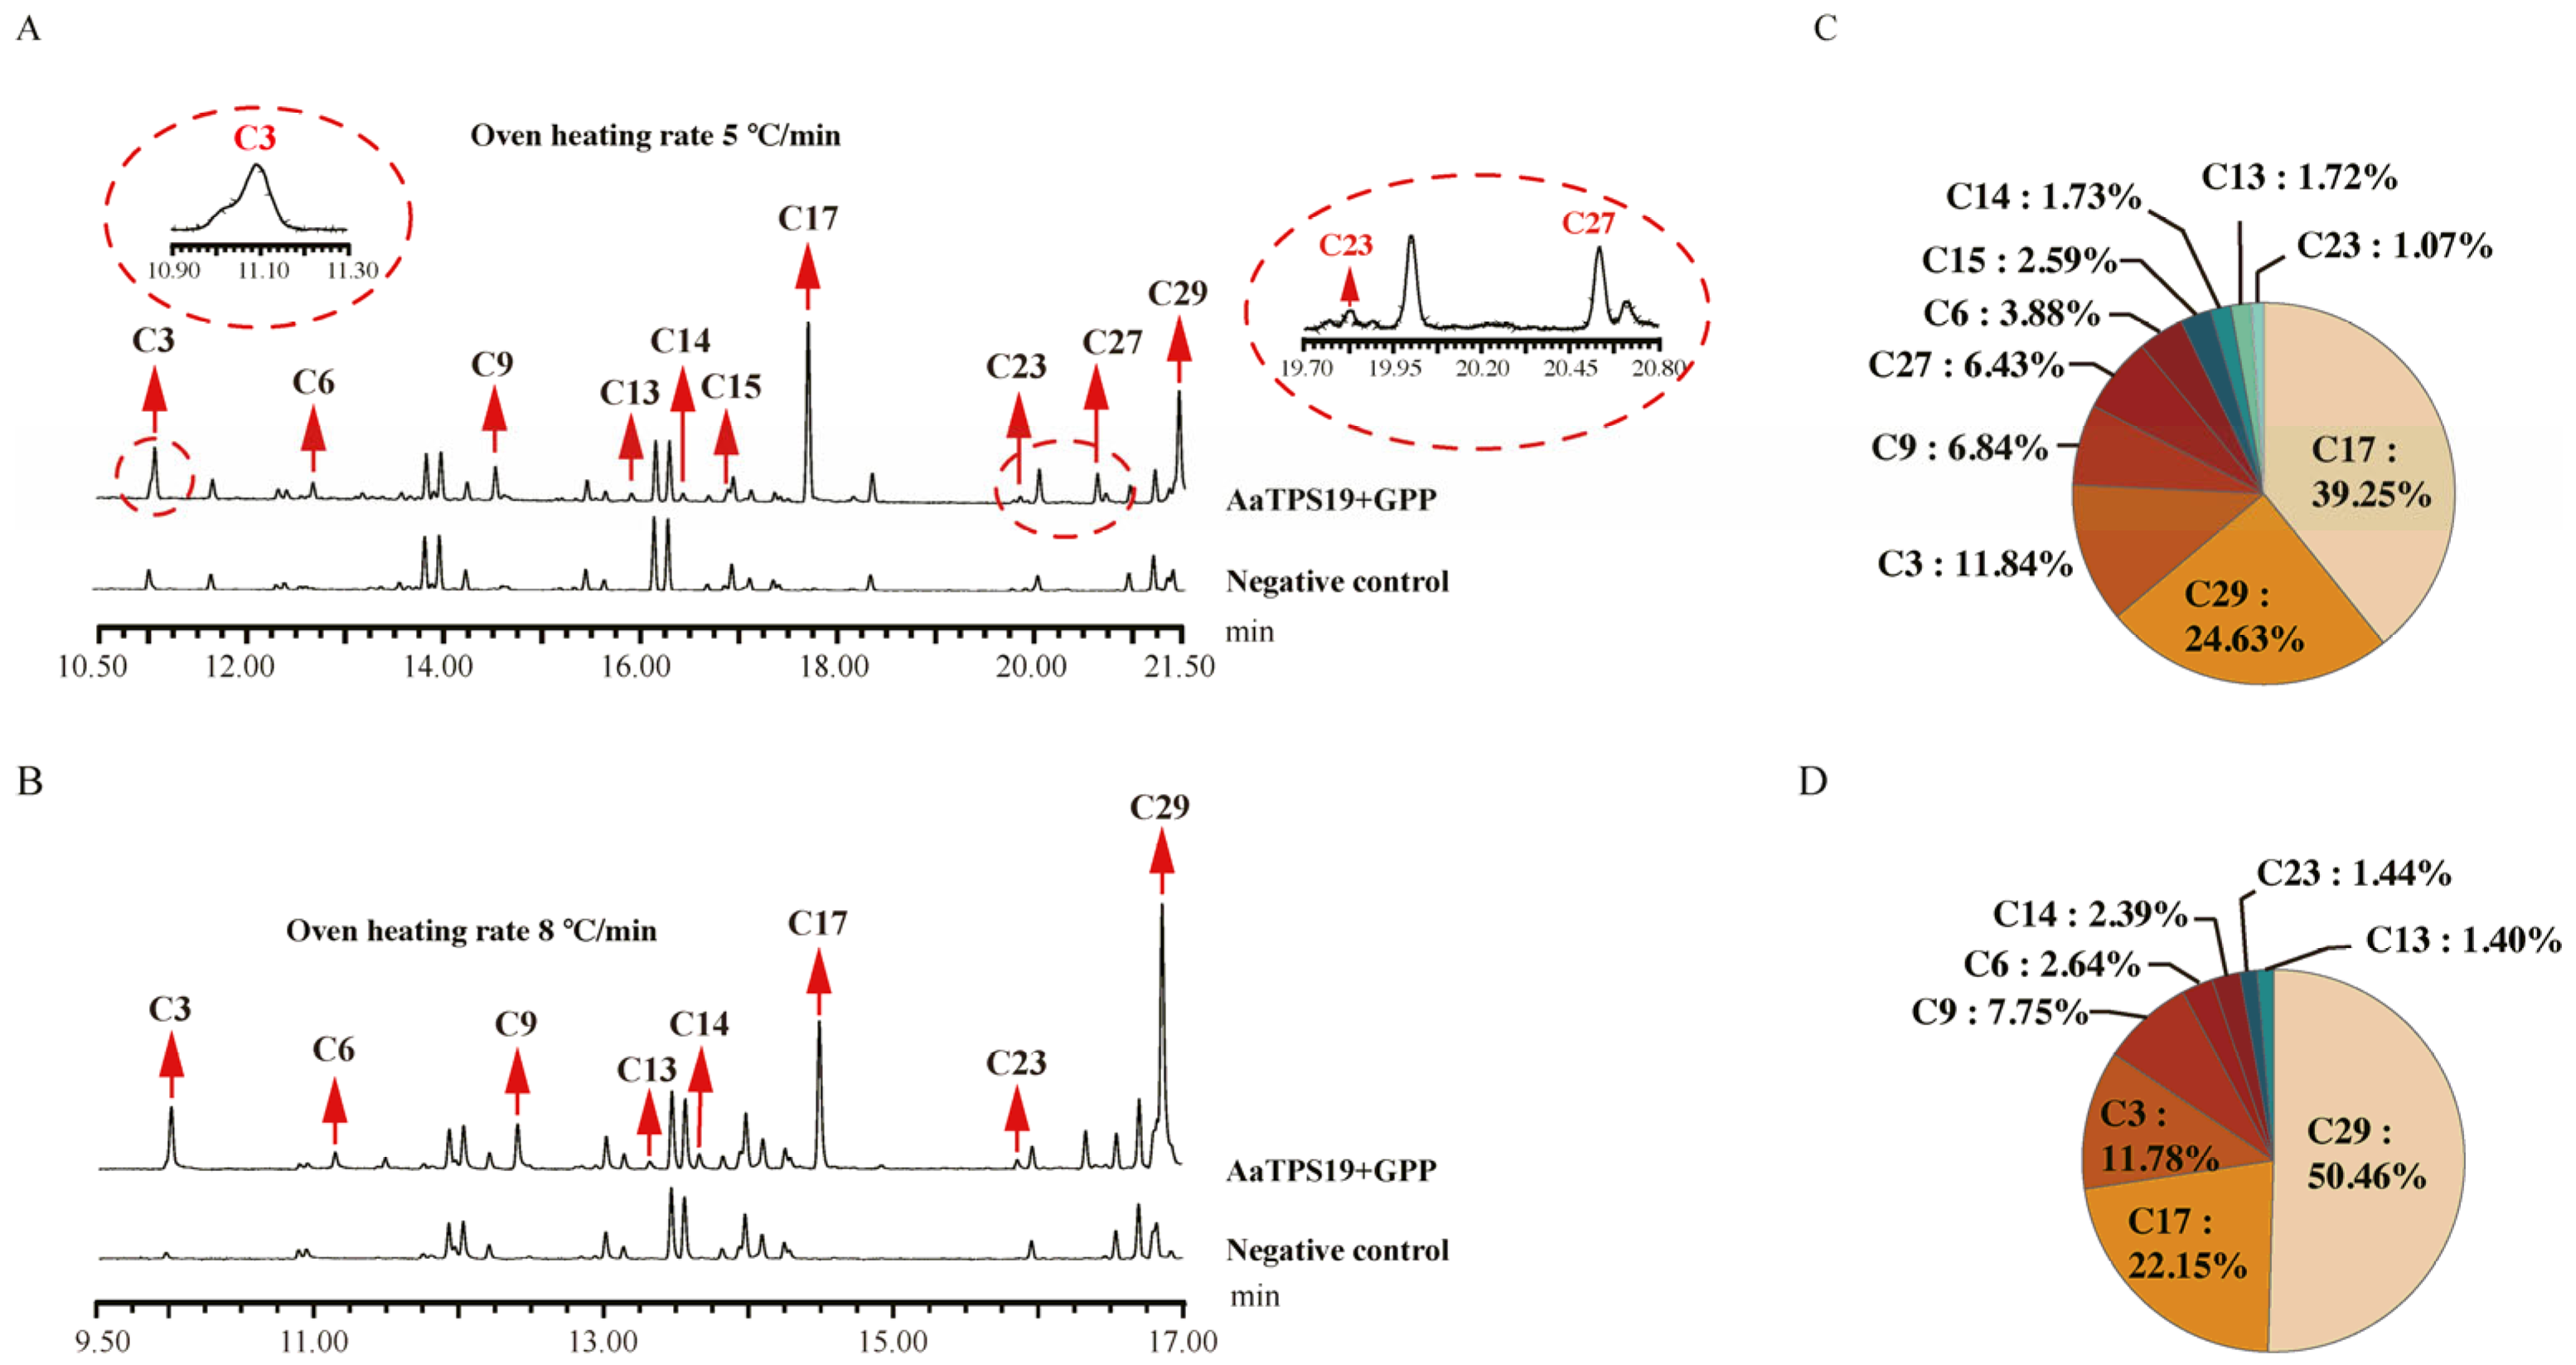
Guided by this overview, we selected the three enzymes with the most multiproducts (AaTPS13/19/20) for a detailed comparison of rapid- vs. slow-ramp GC–MS programs (Figure 6, Figure 7 and Figure 8). For AaTPS20, the slow-ramp protocol enabled the detection of additional by-products (tricyclene and nerol) that were not resolved under the rapid-ramp protocol and refined the relative quantification by increasing the proportion assigned to 1,8-cineole (eucalyptol) (Figure 6). For AaTPS13, under the rapid-ramp protocol, six products were resolved; the slow-ramp protocol revealed four additional products—sabinene, linalool, 2-pinanol, and 2-menthen-1-ol—bringing the total to ten. Beyond compositional changes, the apparent main product shifted from limonene (rapid ramp) to α-terpineol (slow ramp) (Figure 7), indicating that an insufficient chromatographic resolution can bias major-product assignment for multiproduct enzymes. For AaTPS19, the rapid-ramp program resolved eight products. In contrast, the optimized slow-ramp protocol resolved ten products with 2-pinanol emerging as the major product. The enhanced separation achieved by the slow ramp allowed for the unambiguous identification of 2-pinanol as the principal product of AaTPS19—representing, to our knowledge, the first biochemically characterized 2-pinanol synthase (Figure 8). Collectively, these comparisons demonstrate that the optimized GC–MS method increases the number of detectable products, improves relative quantification, and corrects misassigned major-product identities that arise from co-elution under faster oven ramps.

3.5. Expression Pattern Analysis of Monoterpene Synthase in Artemisia annua

Analyzing the correlation between terpenoid distribution and terpene synthase expression is key to unraveling the complex in vivo terpenoid metabolic network. Accordingly, we employed quantitative real-time PCR (qRT-PCR) to assess the expression of eight monoterpene synthase genes across roots (R), stems (S), leaves (L) and their mixture (M). As shown in Figure 9, AaTPS03, AaTPS11, and AaTPS18 showed predominant expression in leaves, whereas AaTPS20 predominant expression in roots. The remaining AaTPSs were expression in all three tissues. This overall pattern aligns with our tissue metabolite profiling, in which leaves displayed the greatest diversity and abundance of monoterpenes.
For most genes, tissue expression qualitatively mirrored the distribution of products generated by their encoded enzymes, supporting in planta functionality of these AamTPSs. However, the distribution of some monoterpene synthase products did not align with the expression patterns of their encoding genes, especially for the three multi-product monoterpene synthases, AaTPS13, AaTPS19, and AaTPS20. For instance, AaTPS20 predominantly expressed in roots, but products of AaTPS20, including tricyclene, α-pinene, sabinene, β-pinene, and eucalyptol, showed significantly higher accumulation levels in leaves. Moreover, although AaTPS13 expressed at similar levels in roots, stems, and leaves, several of AaTPS13’s products, such as linalool, 2-pinanol, 2-menthen-1-ol, and α-terpineol, cannot be detected in the roots.
Together, these data integrate gene expression with enzyme biochemistry and metabolite distribution to outline a tissue-resolved monoterpene network in A. annua, while highlighting regulatory that can uncouple transcript levels from product accumulation for multifunctional TPSs.

4. Discussion

4.1. Optimized GC–MS Enables First Identification of a 2-Pinanol Synthase

Although 2-pinanol has long been reported in essential oils of multiple plant species, its dedicated synthase had not been described—likely because standard GC–MS temperature programs insufficiently resolved 2-pinanol from geraniol. Our optimized slow-ramp protocol improved separation, enhanced the detection of oxygenated monoterpenes, and refined relative quantification. This allowed for the unambiguous assignment of 2-pinanol as the predominant product of AaTPS19; to our knowledge, this is the first biochemical characterization of a 2-pinanol synthase (Figure 8). Beyond this case, the method increased the number of detectable products, improved major-product calling, and expanded the identification of trace components—key advantages for multifunctional TPSs that generate diverse products.
Some monoterpenoids detected in planta were not produced in our in vitro assays, suggesting potential contributions from additional TPS genes or post-synthetic modifi-cation processes. The characterized enzymes, particularly the multifunctional AaTPS19, offer valuable tools for metabolic engineering applications. They enable the sustainable production of high-value monoterpenes in microbial systems and provide insights for targeted engineering strategies in plants. Our findings substantially expand the understanding of monoterpenoid biosynthesis in A. annua and provide a robust foundation for future research on terpenoid metabolism regulation and biotechnological applications.

4.2. Interpreting Expression–Metabolite Incongruence

qRT-PCR profiling showed the leaf-enriched expression for AaTPS03/11/18 and root-enriched expression for AaTPS20, with other genes broadly expressed (Figure 9). For most genes, tissue expression qualitatively mirrored monoterpene distribution, supporting in planta functionality. However, notable mismatches occurred for multiproduct enzymes. For example, AaTPS20 transcripts were highest in the roots, yet several of its products (tricyclene, α-pinene, sabinene, β-pinene, and 1,8-cineole) accumulated predominantly in leaves; AaTPS13 was expressed across tissues, but several oxygenated products (e.g., linalool, 2-pinanol, 2-menthen-1-ol, and α-terpineol) were undetectable in roots. Such decoupling likely reflects a glandular-trichome specificity not captured by bulk tissue qRT-PCR, differences in plastidial GPP supply/MEP flux, volatility and inter-tissue transport, storage and downstream modification, and post-transcriptional/post-translational regulation.

4.3. Concordance with Prior AaTPS Reports and Effects of Analytical/Construct Design

Five AaTPSs had prior characterizations (AaTPS02/03/11/18/23). Our results corroborate AaTPS02 and AaTPS23 (previously AaTPS2) product profiles (Figures S4 and S5) [32]. For AaTPS03 (previously AaTPS5), the optimized GC–MS resolved limonene rather than the β-myrcene by-product reported by Ruan et al., indicating prior co-elution (Figure S6) [32]. AaTPS18 (previously AaTPS6) retained 1,8-cineole (eucalyptol) as the main product, but with fewer by-products—potentially influenced by differences in N-terminal transit-peptide truncation (Figure S7) [32]. AaTPS11 (QH6) primarily produced β-pinene and additionally yielded sabinene and β-phellandrene, highlighting the impact of column chemistry and instrument settings (Figure S8) [33]. Comparing in vitro products with the 31 monoterpenes detected in A. annua tissues showed partial overlap (17/31); some species, such as β-phellandrene, appeared only in enzyme assays, consistent with the low in planta abundance, rapid downstream modification, and compartmentation. Together, these observations underscore two practical determinants of apparent specificity—chromatographic resolution and transit-peptide design—that should be standardized and transparently reported.

5. Conclusions

In conclusion, this study successfully established a highly sensitive and reproducible extraction GC–MS workflow, enabling the comprehensive detection of 31 monoterpenoids across tissues of A. annua. We functionally characterized eight monoterpene synthases, which collectively contribute to the biosynthesis of 17 monoterpenes. Notably, we identified AaTPS19 as the first reported 2-pinanol synthase. The tissue-specific accumulation patterns of monoterpenes and the enzymatic promiscuity of several AamTPSs uncovered in this work significantly deepen our understanding of monoterpenoid biosynthesis in A. annua. Together, these resources and methods provide a rigorous reference for future research on the regulation of terpenoid metabolism and for the metabolic engineering of high-value monoterpenoids.

Supplementary Materials

The following supporting information can be downloaded at: https://www.mdpi.com/article/10.3390/horticulturae11091083/s1, Table S1: The primer sequences of A. annua; Table S2: Methodological comparison of extraction efficiency of monoterpenoids by different extraction solvents; Table S3: Methodological comparison of the detection of monoterpenoids by different carrier gas flow rates; Table S4: Methodological comparison of different heating rates on the detection of monoterpenoid compound; Table S5: Examination of the retetion time for evaluating the repeatability of the detection method for monoterpene compounds; Table S6: Examination of the peak area for evaluating the repeatability of the detection method for monoterpene compounds; Table S7: Summary table of the distribution of monoterpene compound contents in the tissue regions of A. annua (roots, stems, leaves, and mixtures); Table S8: The amino acid sequence and genebank of all genes for phylogenetic tree; Table S9: The tissue distribution of monoterpenoid compounds and the genes encoding their biosynthetic enzymes; Figure S1: The mass spectrum of main terpenoids was determined by NIST17; Figure S2: Amino acid sequence alignment of candidate monoterpene synthase; Figure S3: SDS gel electrophoresis of monoterpene synthase proteins from A. annua; Figure S4: Enzymatic reaction analysis of AaTPS02; Figure S5: Enzymatic reaction analysis of AaTPS23; Figure S6: Enzymatic reaction analysis of AaTPS03; Figure S7: Enzymatic reaction analysis of AaTPS18; Figure S8: Enzymatic reaction analysis of AaTPS11.

Author Contributions

F.Z. and J.M. developed the entire project and experimental plans, provided technical training, participated in data analysis, and drafted and finalized this manuscript. W.W. performed most of experiments, analyzed data and drafted this manuscript. X.L. (Xinyue Lin), Z.L. (Zijian Le), X.Q., M.W. and Y.Q. performed RNA isolation, semi-quantitative PCR, real time quantitative PCR, and preparation of figures. L.Z. participated in the exploration of GC-MS conditions. G.S., M.C., Z.L. (Zhihua Liao) and X.L. (Xiaozhong Lan) participated in the manuscript writing and revisions. B.W. and Y.H. participated in the revision of the manuscript. All authors have read and agreed to the published version of the manuscript.

Funding

This research was funded by the Natural Science Foundation of Chongqing (Grant No. CSTB2022NSCQ-MSX1659); The National Key Research and Development Program of China (Grant No.2022YFD1201600); Chongqing Technology Innovation and Application Development Program (CSTB2024TIAD-KPX0019), the Fundamental Research Funds for the Central Universities, Southwest University, China, (grant No: SWU-KF25001) and Postgraduate Research and Innovation Project of Chongqing City, Southwest University, China (grant No: CYB23113).

Data Availability Statement

The data supporting the findings of this study are available within the paper figures and the Supplementary Materials.

Acknowledgments

The authors would like to express their sincere gratitude to the TsingkeBiotechnology Co., Ltd. for providing technical support such as primer synthesis and sequencing, and we thank our teachers for their academic advising and the encouragement and support of our team members. All acknowledged individuals have provided their consent to be mentioned in this section.

Conflicts of Interest

The authors declare no competing financial interest.

Abbreviations

The following abbreviations are used in this manuscript:
TPSterpene synthase
IPTGβ-D-1-thiogalactopyranoside
GPPgeranyl pyrophosphate
FPPfarnesyl diphosphate
qRT-PCRquantitative real-time PCR
GC–MSgas chromatography–mass spectrometry
RSDrelative standard deviation

References

  1. Amorati, R.; Foti, M.C.; Valgimigli, L. Antioxidant activity of essential oils. J. Agric. Food Chem. 2013, 61, 10835–10847. [Google Scholar] [CrossRef]
  2. Cao, Q.; Liu, L.; Ma, X.; Zhong, C.; Tang, M.; Liu, M.; Qu, L.B.; Wei, B.; Xu, X. 1, 8-Cineole Ameliorated Staphylococcus aureus-Induced Pneumonia through Modulation of TRP-KYN and Arginine-NO Reprogramming. J. Agric. Food Chem. 2025, 73, 11670–11683. [Google Scholar] [CrossRef]
  3. Abbas, F.; O’Neill Rothenberg, D.; Zhou, Y.; Ke, Y.; Wang, H.C. Volatile organic compounds as mediators of plant communication and adaptation to climate change. Physiol. Plant 2022, 174, e13840. [Google Scholar] [CrossRef]
  4. Raguso, R.A. More lessons from linalool: Insights gained from a ubiquitous floral volatile. Curr. Opin. Plant Biol. 2016, 32, 31–36. [Google Scholar] [CrossRef] [PubMed]
  5. Yahyaa, M.; Ibdah, M.; Marzouk, S.; Ibdah, M. Profiling of the Terpene Metabolome in Carrot Fruits of Wild (Daucus carota L. ssp. carota) Accessions and Characterization of a Geraniol Synthase. J. Agric. Food Chem. 2018, 66, 2378–2386. [Google Scholar] [CrossRef] [PubMed]
  6. Zhao, S.; Wang, X.; Wang, Z.; Wang, T.; Pan, Y.; Fang, K.; Wang, S.; Xi, J. High Nitrogen Enhances Maize Susceptibility to Holotrichia parallela via beta-Caryophyllene-Mediated Olfactory Recognition and Jasmonate Suppression. J. Agric. Food Chem. 2025, 73, 8204–8213. [Google Scholar] [CrossRef]
  7. Cascone, P.; Iodice, L.; Maffei, M.E.; Bossi, S.; Arimura, G.; Guerrieri, E. Tobacco overexpressing beta-ocimene induces direct and indirect responses against aphids in receiver tomato plants. J. Plant Physiol. 2015, 173, 28–32. [Google Scholar] [CrossRef]
  8. Zhang, L.; Su, Q.F.; Wang, L.S.; Lv, M.W.; Hou, Y.X.; Li, S.S. Linalool: A ubiquitous floral volatile mediating the communication between plants and insects. J. Syst. Evol. 2022, 61, 538–549. [Google Scholar] [CrossRef]
  9. Judd, R.; Bagley, M.C.; Li, M.; Zhu, Y.; Lei, C.; Yuzuak, S.; Ekelof, M.; Pu, G.; Zhao, X.; Muddiman, D.C.; et al. Artemisinin Biosynthesis in Non-glandular Trichome Cells of Artemisia annua. Mol. Plant 2019, 12, 704–714. [Google Scholar] [CrossRef]
  10. Abdallah, I.I.; Mahmoud, H.A.; El-Sebakhy, N.A.; Mahgoub, Y.A. Comparative phytochemical profiling and authentication of four Artemisia species using integrated GC-MS, HPTLC and NIR spectroscopy approach. BMC Chem. 2025, 19, 100. [Google Scholar] [CrossRef]
  11. Ma, D.M.; Wang, Z.; Wang, L.; Alejos-Gonzales, F.; Sun, M.A.; Xie, D.Y. A Genome-Wide Scenario of Terpene Pathways in Self-pollinated Artemisia annua. Mol. Plant 2015, 8, 1580–1598. [Google Scholar] [CrossRef]
  12. Yang, W.; Zhang, L.; Yang, Y.; Xiang, H.; Yang, P. Plant secondary metabolites-mediated plant defense against bacteria and fungi pathogens. Plant Physiol. Biochem. 2024, 217, 109224. [Google Scholar] [CrossRef]
  13. Xu, M.; Jiang, Y.; Chen, S.; Chen, F.; Chen, F. Herbivory-Induced Emission of Volatile Terpenes in Chrysanthemum morifolium Functions as an Indirect Defense against Spodoptera litura Larvae by Attracting Natural Enemies. J. Agric. Food Chem. 2021, 69, 9743–9753. [Google Scholar] [CrossRef]
  14. Zhou, Z.; Xian, J.; Wei, W.; Xu, C.; Yang, J.; Zhan, R.; Ma, D. Volatile metabolic profiling and functional characterization of four terpene synthases reveal terpenoid diversity in different tissues of Chrysanthemum indicum L. Phytochemistry 2021, 185, 112687. [Google Scholar] [CrossRef] [PubMed]
  15. Yang, P.; Ling, X.Y.; Zhou, X.F.; Chen, Y.X.; Wang, T.T.; Lin, X.J.; Zhao, Y.Y.; Ye, Y.S.; Huang, L.X.; Sun, Y.W.; et al. Comparing genomes of Fructus Amomi-producing species reveals genetic basis of volatile terpenoid divergence. Plant Physiol. 2023, 193, 1244–1262. [Google Scholar] [CrossRef] [PubMed]
  16. Luck, K.; Chen, X.; Norris, A.M.; Chen, F.; Gershenzon, J.; Kollner, T.G. The reconstruction and biochemical characterization of ancestral genes furnish insights into the evolution of terpene synthase function in the Poaceae. Plant Mol. Biol. 2020, 104, 203–215. [Google Scholar] [CrossRef]
  17. Yan, X.M.; Zhou, S.S.; Liu, H.; Zhao, S.W.; Tian, X.C.; Shi, T.L.; Bao, Y.T.; Li, Z.C.; Jia, K.H.; Nie, S.; et al. Unraveling the evolutionary dynamics of the TPS gene family in land plants. Front. Plant Sci. 2023, 14, 1273648. [Google Scholar] [CrossRef] [PubMed]
  18. Chen, F.; Tholl, D.; Bohlmann, J.; Pichersky, E. The family of terpene synthases in plants: A mid-size family of genes for specialized metabolism that is highly diversified throughout the kingdom. Plant J. 2011, 66, 212–229. [Google Scholar] [CrossRef]
  19. Hansen, N.L.; Heskes, A.M.; Hamberger, B.; Olsen, C.E.; Hallstrom, B.M.; Andersen-Ranberg, J.; Hamberger, B. The terpene synthase gene family in Tripterygium wilfordii harbors a labdane-type diterpene synthase among the monoterpene synthase TPS-b subfamily. Plant J. 2017, 89, 429–441. [Google Scholar] [CrossRef]
  20. Vidic, D.; Copra-Janicijevic, A.; Milos, M.; Maksimovic, M. Effects of Different Methods of Isolation on Volatile Composition of Artemisia annua L. Int. J. Anal. Chem. 2018, 2018, 9604183. [Google Scholar] [CrossRef]
  21. D’Atri, V.; Fekete, S.; Clarke, A.; Veuthey, J.L.; Guillarme, D. Recent Advances in Chromatography for Pharmaceutical Analysis. Anal. Chem. 2019, 91, 210–239. [Google Scholar] [CrossRef]
  22. Peng, Y.; Feng, X.; Feng, Y.; Li, L.; Chen, Y.; Yu, J. Optimization of two-stage thermal desorption combined with pentafluorophenyl hydrazine derivatization-gas chromatography/mass spectrometry analytical method of atmospheric carbonyl compounds. Microchemical Journal 2024, 197. [Google Scholar] [CrossRef]
  23. Choudhury, F.K.; Pandey, P.; Meitei, R.; Cardona, D.; Gujar, A.C.; Shulaev, V. GC-MS/MS Profiling of Plant Metabolites. In Plant Metabolic Engineering: Methods and Protocols; Springer: New York, NY, USA, 2022; pp. 101–115. [Google Scholar] [CrossRef]
  24. Xiang, L.; He, P.; Shu, G.; Yuan, M.; Wen, M.; Lan, X.; Liao, Z.; Tang, Y. AabHLH112, a bHLH transcription factor, positively regulates sesquiterpenes biosynthesis in Artemisia annua. Front. Plant Sci. 2022, 13, 973591. [Google Scholar] [CrossRef] [PubMed]
  25. Gou, Y.; Zhang, F.; Tang, Y.; Jiang, C.; Bai, G.; Xie, H.; Chen, M.; Liao, Z. Engineering Nootkatone Biosynthesis in Artemisia annua. ACS Synth. Biol. 2021, 10, 957–963. [Google Scholar] [CrossRef] [PubMed]
  26. Cassia de Souza Schneider, R.; Zanon Baldissarelli, V.; Trombetta, F.; Martinelli, M.; Bastos Caramão, E. Optimization of gas chromatographic–mass spectrometric analysis for fatty acids in hydrogenated castor oil obtained by catalytic transfer hydrogenation. Analytica Chimica Acta 2004, 505, 223–226. [Google Scholar] [CrossRef]
  27. Zeki, O.C.; Eylem, C.C.; Recber, T.; Kir, S.; Nemutlu, E. Integration of GC-MS and LC-MS for untargeted metabolomics profiling. J. Pharm. Biomed. Anal. 2020, 190, 113509. [Google Scholar] [CrossRef]
  28. Fiehn, O. Metabolomics by Gas Chromatography-Mass Spectrometry: Combined Targeted and Untargeted Profiling. Curr. Protoc. Mol. Biol. 2016, 114, 30–34. [Google Scholar] [CrossRef]
  29. Ye, P.; Liang, S.; Wang, X.; Duan, L.; Jiang-Yan, F.; Yang, J.; Zhan, R.; Ma, D. Transcriptome analysis and targeted metabolic profiling for pathway elucidation and identification of a geraniol synthase involved in iridoid biosynthesis from Gardenia jasminoides. Ind. Crops Prod. 2019, 132, 48–58. [Google Scholar] [CrossRef]
  30. Zhou, F.; Pichersky, E. The complete functional characterisation of the terpene synthase family in tomato. New Phytol. 2020, 226, 1341–1360. [Google Scholar] [CrossRef]
  31. Zhi, Y.; Dai, C.; Fang, X.; Xiao, X.; Lu, H.; Chen, F.; Chen, R.; Ma, W.; Deng, Z.; Lu, L.; et al. Gene-Directed In Vitro Mining Uncovers the Insect-Repellent Constituent from Mugwort (Artemisia argyi). J. Am. Chem. Soc. 2024, 146, 30883–30892. [Google Scholar] [CrossRef]
  32. Ruan, J.X.; Li, J.X.; Fang, X.; Wang, L.J.; Hu, W.L.; Chen, X.Y.; Yang, C.Q. Isolation and Characterization of Three New Monoterpene Synthases from Artemisia annua. Front. Plant Sci. 2016, 7, 638. [Google Scholar] [CrossRef]
  33. Lu, S.; Xu, R.; Jia, J.W.; Pang, J.; Matsuda, S.P.; Chen, X.Y. Cloning and functional characterization of a beta-pinene synthase from Artemisia annua that shows a circadian pattern of expression. Plant Physiol. 2002, 130, 477–486. [Google Scholar] [CrossRef]
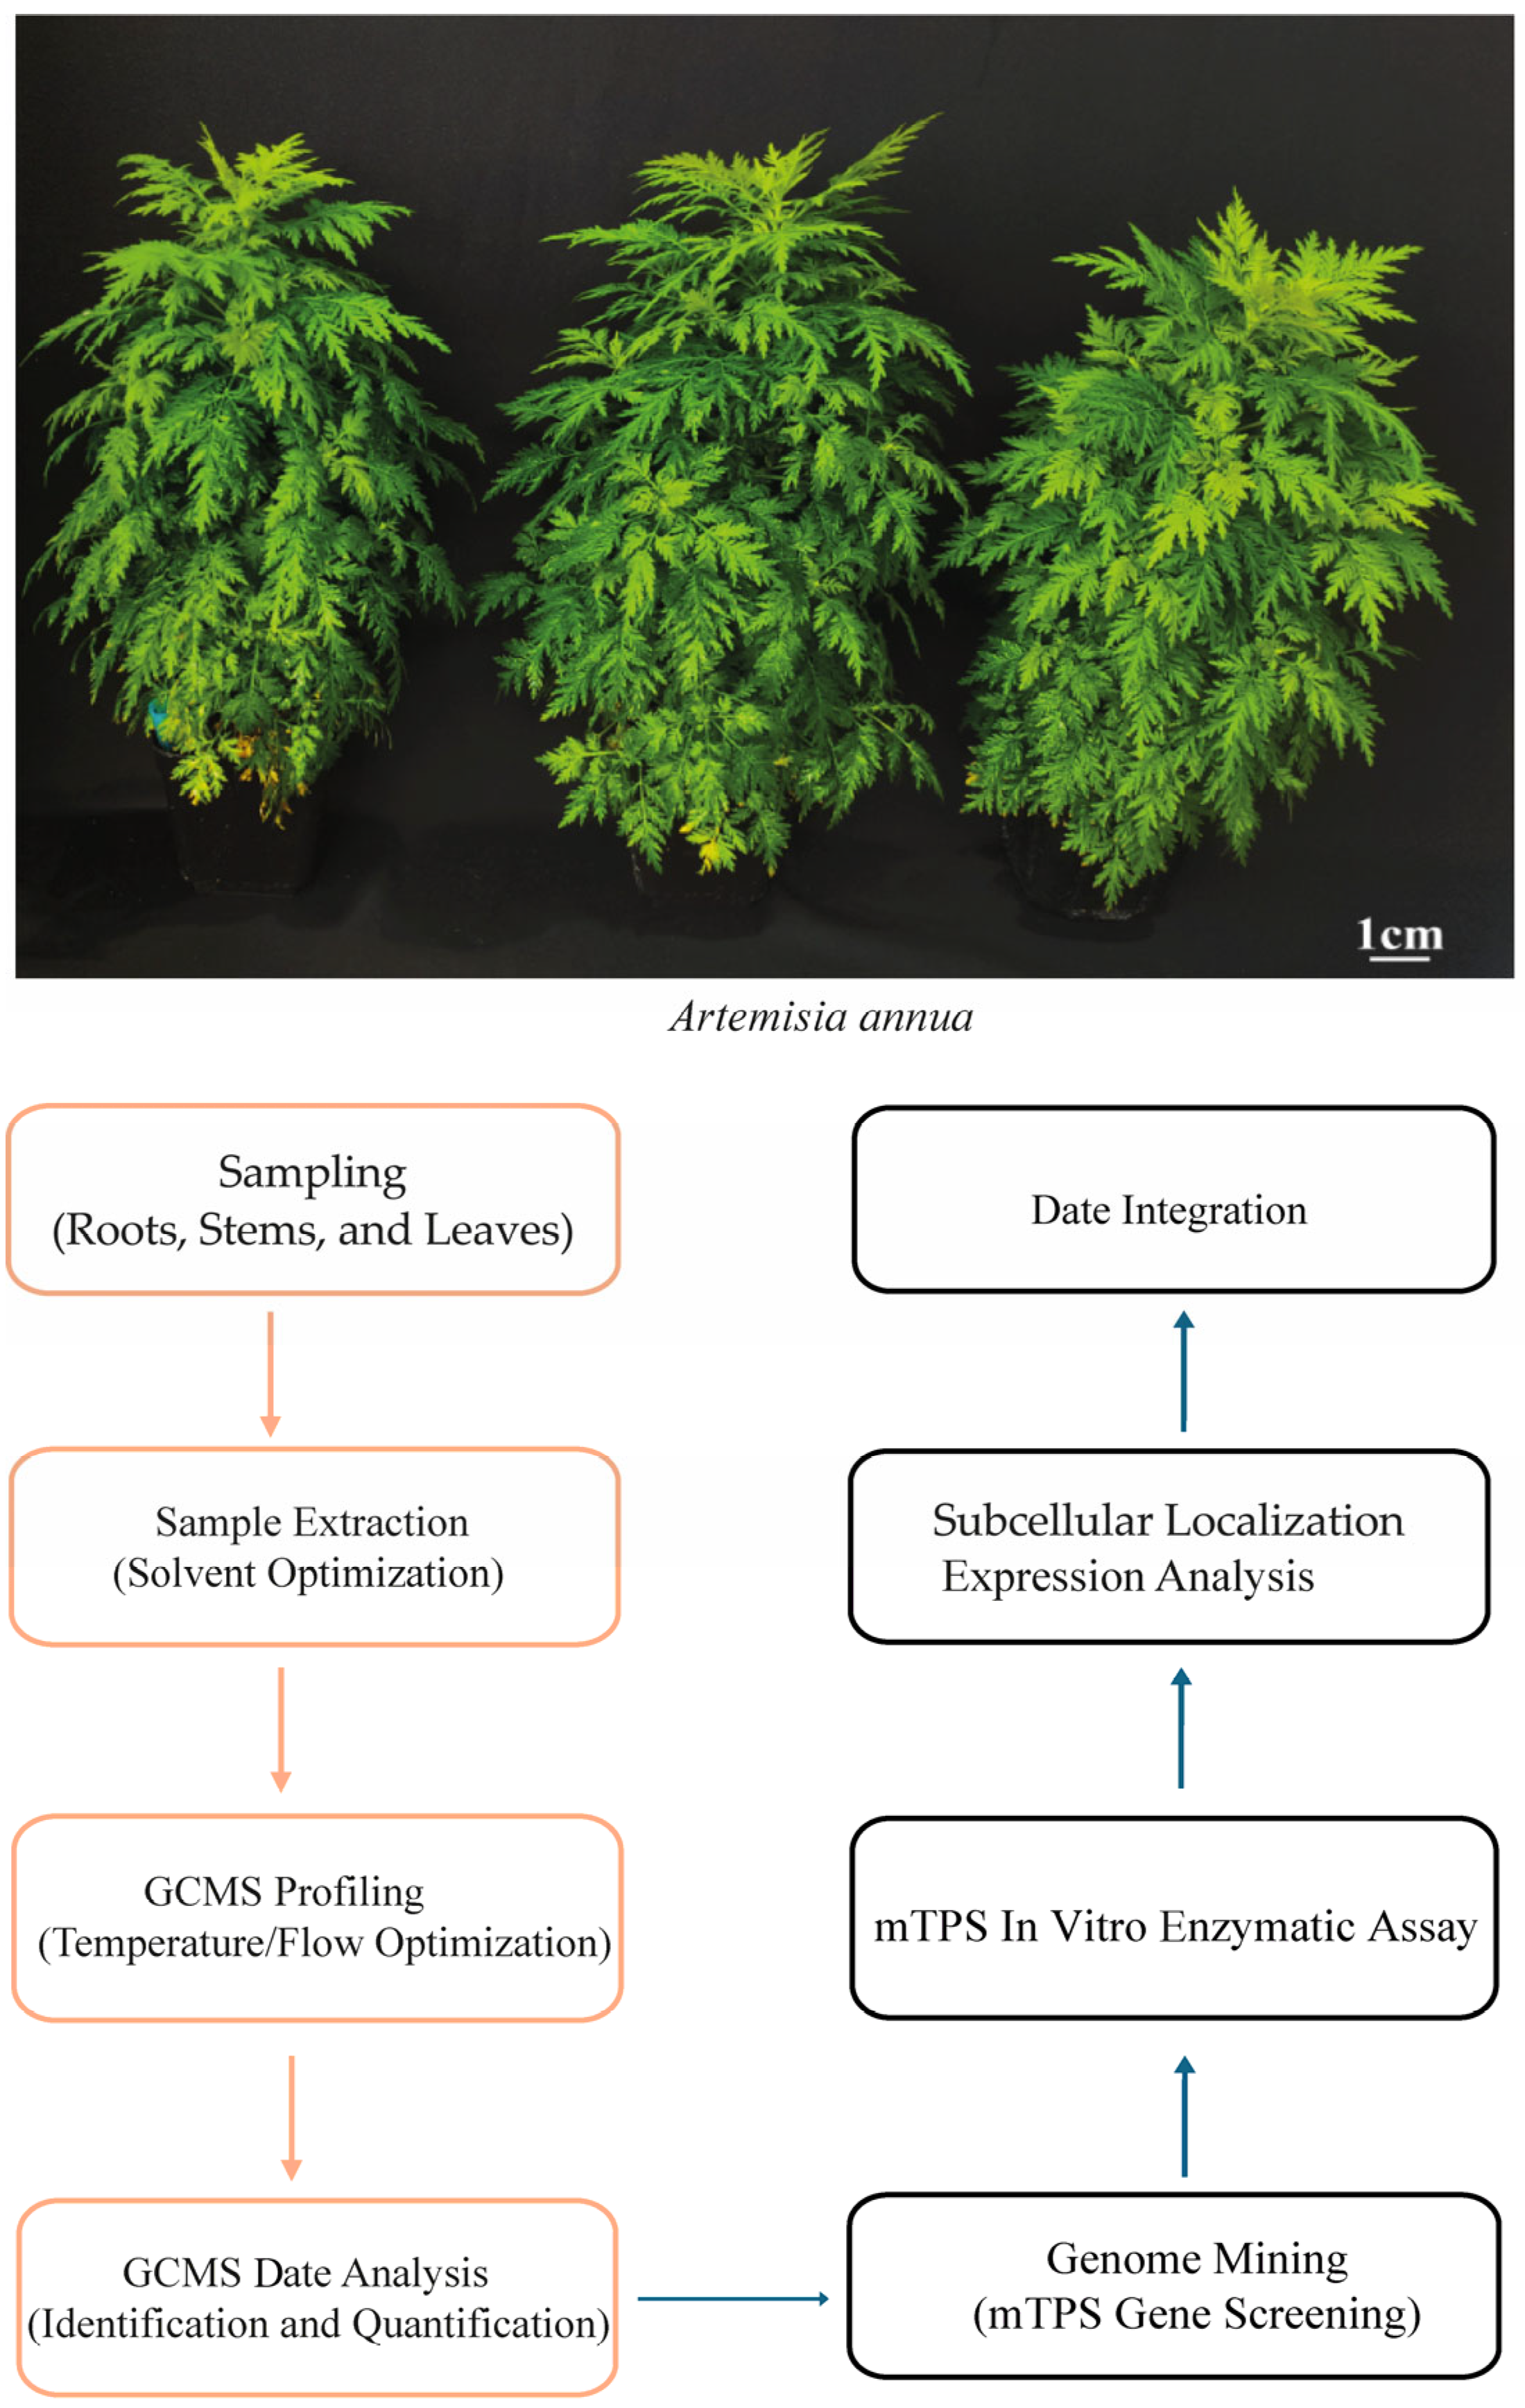
Figure 1. Methodology flowchart for the study.
Horticulturae 11 01083 g001
Figure 2. Extraction solvent screening and GC-MS parameter optimization for monoterpenoids in Artemisia annua. (A), Effect of extraction solvent on detected monoterpenoids (acetone, ethyl acetate, dichloromethane [CH2Cl2], petroleum ether, and n-hexane). (B), Effect of carrier gas flow rate (1.5 vs. 1.0 mL min−1). (C), Effect of oven heating rate (5, 8, 10, and 15 °C min−1).
Horticulturae 11 01083 g002
Figure 3. The monoterpenoids profiling in tissues of A. annua. (A), Representative total ion chromatograms (TIC) of monoterpenoids in roots (R), stems (S), leaves (L) and their mixtures (M). Labels (C1–C31) mark the 31 identified monoterpenoids. (B), Heatmap of mean relative contents of the 31 monoterpenoids across tissues (R, S, L, and Mix), grouped by structural class (acyclic, monocyclic, bicyclic, and tricyclic). Color indicates relative abundance. (C), Principal component analysis (PCA) score plot showing clear separation among roots (R), stems (S), leaves (L), and the pooled sample (Mix). (D), The loading plot highlighting compounds contributing most to tissue discrimination.
Horticulturae 11 01083 g003
Figure 4. Phylogeny analysis and subcellular localization of AaTPSs. (A), Maximum-likelihood phylogeny of putative AaTPSs. The phylogenetic tree was built by putative AaTPSs and TPS from other plants. (B), Confocal laser microscopy of transiently expressed AaTPSs-GFP and GFP in tobacco mesophyll protoplasts. GFP: pCAMBIA1302-EGFP control, combined GFP fluorescence and chlorophyll autofluorescence as the subcellular localization results of AaTPSs. Scale = 10 micrometers. The amino acid sequence of all genes was list in Table S8.
Horticulturae 11 01083 g004
Figure 5. In vitro product atlas of AamTPSs. (A), Bubble heat map of products generated from GPP by eight AamTPSs. Rows list identified monoterpenes grouped by structural class (acyclic, monocyclic, bicyclic, and tricyclic). (B), The structure of detected monoterpene compounds in enzymatic analysis. EC1 was a compound identified via in vitro enzymatic activity analysis; however, it is not detected in the A. annua.
Horticulturae 11 01083 g005
Figure 6. Enzymatic reaction analysis of AaTPS20. (A), Under GC-MS detection conditions with heating rate of 5 °C/min, the total ion chromatogram of the enzyme activity reaction and (C), the pie chart of the proportion of enzyme-catalyzed products. (B), Under GC-MS detection conditions with heating rate of 8 °C/min, the total ion chromatogram of the enzyme activity reaction and (D), the pie chart of the proportion of enzyme-catalyzed products. C1, Tricyclene; C3, α-pinene; C5, sabinene; C6, β-pinene; C7, β-myrcene; C9, D-limonene; C10, eucalyptol; C14, terpinolene; C15, linalool; C23, α-terpineol; C27, nerol; and C29, geraniol.
Horticulturae 11 01083 g006
Figure 7. Enzymatic reaction analysis of AaTPS13. (A), Under GC-MS detection conditions with heating rate of 5 ℃/min, the total ion chromatogram of the enzyme activity reaction and (C),the pie chart of the proportion of enzyme-catalyzed products. (B), Under GC-MS detection conditions with heating rate of 8 ℃/min, the total ion chromatogram of the enzyme activity reaction and (D), the pie chart of the proportion of enzyme-catalyzed products. C3, α-pinene; C5, sabinene; C7, β-myrcene; C9, D-limonene; C13, Cis-4-thujanol; C14, terpinolene; C15, linalool; C17, 2-pinanol; C19, 2-menthen-1-ol; and C23, α-terpineol.
Horticulturae 11 01083 g007
Figure 8. Enzymatic reaction analysis of AaTPS19. (A), Under GC-MS detection conditions with heating rate of 5 °C/min, the total ion chromatogram of the enzyme activity reaction and (C), the pie chart of the proportion of enzyme-catalyzed products. (B), Under GC-MS detection conditions with heating rate of 8 °C/min, the total ion chromatogram of the enzyme activity reaction and (D), the pie chart of the proportion of enzyme-catalyzed products. C3, α-pinene; C6, β-pinene; C9, D-limonene; C13, cis-4-thujanol; C14, terpinolene; C15, linalool; C17, 2-pinanol; C23, α-terpineol; C27, nerol; and C29, geraniol.
Horticulturae 11 01083 g008
Figure 9. Correlation between AaTPSs expression patterns in different A. annua tissues and corresponding products. n.d.: not detected; trace: less than 1 ng/mg, FW; +, 1–10 ng/mg, FW; + +, 20–100 ng/mg, FW; +++, 100-300 ng/mg, FW; and ++++, more than 300 ng/mg, FW. The primary products are highlighted in red; enzymatic products with no correlation to expression pattern are highlighted in blue. Different letters (a, b, and c) represent significant differences at p < 0.05.
Horticulturae 11 01083 g009
Disclaimer/Publisher’s Note: The statements, opinions and data contained in all publications are solely those of the individual author(s) and contributor(s) and not of MDPI and/or the editor(s). MDPI and/or the editor(s) disclaim responsibility for any injury to people or property resulting from any ideas, methods, instructions or products referred to in the content.