Article

Genetic Diversity Analysis in Natural Chinese Holly Using ISSR and SCoT Markers

by
Meng Liu
1,2,
Huixue He
1,2,
Baoxin Zhang
1,2,
Jianfang Zuo
1,2,
Wona Ding
3,
Bingsong Zheng
1,2,
Jiejie Jiao
4,5,* and
Xiaofei Wang
1,2,*
1
National Key Laboratory for Development and Utilization of Forest Food Resources, Zhejiang A&F University, Hangzhou 311300, China
2
Provincial Key Laboratory for Non-Wood Forest and Quality Control and Utilization of Its Products, Zhejiang A&F University, Hangzhou 311300, China
3
Ningbo Key Laboratory of Agricultural Germplasm Resources Mining and Environmental Regulation, College of Science and Technology, Ningbo University, Ningbo 315300, China
4
Zhejiang Academy of Forestry, Hangzhou 310023, China
5
Zhejiang Hangzhou Urban Forest Ecosystem Research Station, Hangzhou 310023, China
*
Authors to whom correspondence should be addressed.
Horticulturae 2025, 11(9), 1078; https://doi.org/10.3390/horticulturae11091078
Submission received: 30 July 2025 / Revised: 27 August 2025 / Accepted: 5 September 2025 / Published: 6 September 2025
(This article belongs to the Special Issue Advances in Cultivation and Breeding of Woody Plants)

Abstract

The Chinese holly (Ilex chinensis Sims.), an evergreen tree species native to China, is distributed mainly in regions south of the Qinling Mountains and Huai River. This research aimed to characterize the molecular profiles and genetic relationships of 40 Chinese holly genotypes via inter-simple sequence repeat (ISSR) and start codon targeted (SCoT) polymorphism markers. Genetic diversity analysis revealed that the ISSR markers detected 111 polymorphic bands from 13 primers, with a polymorphism rate of 88.10%. The analysis generated parameters such as the observed allele number (Na = 1.876), effective allele number (Ne = 1.461), Shannon’s information index (I = 0.271), and expected heterozygosity (H = 0.411). In comparison, the SCoT markers produced 65 polymorphic bands from the 6 primers, resulting in a 100% polymorphism rate, with Na = 2.000, Ne = 1.695, I = 0.393, and H = 0.575. Cluster analysis classified the 40 genotypes into two main clusters with genetic similarity coefficients of 0.69 (ISSR) and 0.55 (SCoT). The ISSR markers presented the greatest similarity between the ZSS and ZLS genotypes, whereas the ZZDH and ZWW genotypes presented lower similarity. Conversely, the SCoT markers identified ZZP and ZJDS as the most similar, with ZLJ and ZHX showing less similarity. These results provide a theoretical basis for hybrid breeding, germplasm innovation, and conservation strategies of Chinese holly in China.

1. Introduction

The Chinese holly (Ilex chinensis Sims.), an evergreen arbor species native to China, is distributed mainly on the southern slope of Qinling Mountains, in Yangtze River Basin, and in regions further south [1]. Southwestern China has the most extensive natural distribution of this species. As a keystone species in subtropical forests, it provides critical habitat for endemic birds and insects while stabilizing soil and mitigating erosion in mountainous regions. Its glossy leaves and persistent red berries symbolize resilience and vitality in traditional Chinese folklore, often featured in festive decorations during the Lunar New Year [2]. Characterized by its year-round greenery, shiny coriaceous leaves, and scarlet fruits that persist through winter, the Chinese holly has become a crucial element in landscaping subtropical urban green spaces across China, making a significant contribution to ecological services in garden construction [3]. However, rapid urbanization and deforestation have reduced its natural habitat in the past three decades [4,5]. In addition to its ornamental value, its leaf tissues contain bioactive triterpenoid saponins and flavonoids, which have been validated by traditional medicinal practices [6,7]. Recorded as “Sijiqing” in Chinese Materia Medica, it is clinically used to treat upper respiratory infections and bacterial dysentery and to assist in skin wound repair [6,8]. Given its dual strategic importance in providing regional ecosystem services and developing natural pharmaceutical resources, there is an urgent need to clarify intraspecific genetic structure and geographical differentiation patterns. Such research provides a scientific basis for accurate germplasm evaluation, the establishment of core collections, and the sustainable utilization of these ecologically and pharmacologically valuable germplasm resources.
Genetic diversity pertains to the degree of hereditary variation among individuals within a species or population. This variation stems from the recombination of genetic material through processes such as inheritance, mutation, gene flow, and genetic drift. In the analysis of genetic diversity, systematic classification methods include nucleic acid sequence analysis, molecular marker techniques, and phenotypic evaluation. Current research on plant genetic diversity widely utilizes molecular marker systems, including amplified fragment length polymorphisms (AFLP) [9], simple sequence repeats (SSR) [10], sequence-related amplified polymorphisms (SRAP) [11], inter-simple sequence repeats (ISSR) [12], start codon targeted polymorphisms (SCoT) [13], and single nucleotide polymorphisms (SNP) [14]. These markers serve as crucial tools for evaluating intraspecific variation and evolutionary relationships in botanical research.
Among molecular marker systems, ISSR technique designs primers that span microsatellite repeats to specifically amplify the conserved regions between adjacent simple sequence repeats in genomic DNA. This PCR-based method exhibits high polymorphism detection efficiency, cost-effectiveness, and excellent reproducibility, overcoming limitations of earlier techniques like AFLP (higher cost) and RAPD (lower reproducibility). These attributes have made ISSR valuable for biodiversity assessment, genome mapping, and developmental genetics studies across diverse plant taxa. ISSR has been effectively applied to various plant taxa [15,16,17,18]. Concurrent with the shift from random DNA markers to gene-targeted systems, the SCoT marker was developed on the basis of the short conserved regions flanking ATG start codon in plant genes. SCoT amplifies DNA fragments adjacent to start codons to uncover genetic variation with simplicity, novelty, and high polymorphism, while requiring no prior sequence information. Like ISSR, SCoT is PCR-based and cost-effective technique that has demonstrated utility across various plant species and diverse plant taxa [19,20,21]. Together, ISSR and SCoT represent complementary approaches that bridge the gap between random DNA markers and gene-specific systems. Integrated ISSR-SCoT approaches have been successfully applied for genetic diversity analysis in diverse plants, including Aegilops tauschii [22], Moringa oleifera [23], Laurus nobilis [24], Musa spp. [25], etc., demonstrating their versatility. At present, there are no reports on the combined application of ISSR and SCoT markers for analyzing the genetic diversity of Ilex plants. Although ISSR has been employed in genetic diversity studies of species like Ilex aquifolium [26] and Ilex integra [27], there are no published works on the use of SCoT markers for genetic diversity analysis within the genus Ilex.
This research employs a combined analysis of ISSR and SCoT markers to investigate the genetic diversity of Chinese holly germplasm resources. Two working hypotheses were tested: (H1) natural populations of Ilex chinensis maintain moderate-to-high genetic diversity despite severe habitat fragmentation; and (H2) geographical isolation, rather than elevation, is the primary force shaping present-day genetic structure. The resulting ISSR/SCoT datasets will be used (i) to delineate Evolutionarily Significant Units for prioritizing in situ conservation actions, and (ii) to identify genetically complementary mother trees for the establishment of ex situ seed orchards and future breeding programs. Collectively, these outcomes will provide a basis for the establishment and utilization of a core germplasm bank for Chinese holly individuals.

2. Materials and Methods

2.1. Plant Materials

A total of 40 representative branches from Chinese holly seedling trees were collected from 40 counties across 20 cities within 8 provinces of China (including Zhejiang, Jiangsu, Anhui, Hubei, Hunan, Shanghai, Sichuan and Guizhou). Sampling focused on counties with documented natural populations, selecting one tree per county based on proximity to concentrated stands and age ≥ 30 years to ensure population representativeness and mature genetic profiles (represented as Figure S1a). These branches were then transported to a germplasm nursery for grafting, with each germplasm resource grafted onto 15–20 2-year-old Chinese holly rootstock plants (represented as Figure S1b,c). The grafting success rate was monitored weekly. A minimum of 5 surviving plants per genotype was required for inclusion as experimental accessions. A total of 40 qualified accessions were ultimately established as experimental materials. The geographical distribution of collection sites is presented in Figure 1, which was generated via ArcMap 10.8 (Esri, Redlands, CA, USA), with coordinate data verified through the National Geomatics Center of China. The base map layers include administrative boundaries from the 1:50,000,000 National Fundamental Geographic Information Database.

2.2. DNA Extraction Procedure

Leaf tissue samples (100 mg) were collected from mature Chinese holly plants and immediately frozen in liquid nitrogen. Genomic DNA was extracted via the Magen Plant DNA Extraction Kit (Magen, Guangzhou, China) in conjunction with the Baiwo automated magnetic bead-based nucleic acid extraction system (Baiwo, Beijing, China). The extraction protocol followed the manufacturer’s instructions. DNA quantification was performed using a NanoDrop One spectrophotometer (NanoDrop One, Thermo Fisher Scientific, Madison, WI, USA). Purity was assessed by calculating the A260/A280 ratios (1.8–2.0) and A260/A230 ratios (>1.7). DNA integrity was verified through horizontal electrophoresis on 1% (w/v) agarose gels. Only DNA samples showing intact high-molecular-weight bands without visible smearing were selected for downstream applications. Qualified DNA samples were stored at −20 °C for subsequent analyses.

2.3. ISSR and SCoT Amplification

For molecular marker analysis, thirteen ISSR primers (Table 1) were selected from the University of British Columbia (UBC) primer set, whereas six SCoT primers were chosen from the original 36-primer set developed by Collard & Mackill (2009) [13]. Primer selection followed rigorous criteria, including preexperimental screening with three representative DNA samples, clear electrophoretic backgrounds with distinct bands, high polymorphism information content (PIC > 0.45), and consistent reproducibility across technical replicates. According to the method described by Roldan-Ruiz et al. (2000) [28], clearly repeatable ISSR/SCoT bands were treated as diallelic loci (1 = present, 0 = absent). For each polymorphic locus (i), the polymorphism information content (PICᵢ) was calculated using the formula:
PICᵢ = 2fᵢ(1 − fᵢ)
where fᵢ represents the frequency of “1” allele across all samples at this locus. The PIC value for each primer (PIC_primer) was determined as the arithmetic mean of PICᵢ values across all polymorphic loci amplified by that primer:
PIC_primer = Σ PICᵢ/n
where n denotes the total number of polymorphic bands (loci) detected by the primer. All oligonucleotide primers were synthesized by Sangon Biotech (Shanghai, China) with HPLC purification. The genomic DNA from 40 Chinese holly accessions was diluted to 50 ng/µL via sterile TE buffer (pH 8.0). PCR amplification was performed in 20 µL reactions containing 10 µL 2× Green Taq Mix (Vazyme, Nanjing, China), 1.0 µL genomic DNA (50 ng/µL), 1.0 µL primer (10 µmol/L), and 7.0 µL ddH2O. Thermal cycling on a Veriti™ 96-Well Thermal Cycler included initial denaturation at 95 °C for 3 min, followed by 35 cycles of 95 °C for 1 min, 50 °C (with 5 °C gradient testing) for 1 min, and 72 °C for 2 min, with a final extension at 72 °C for 5 min. Negative controls were included in each run. The amplified products were separated on 1.2% agarose gels in 1× TAE buffer at 120 V for 40 min via the Mini-Sub Cell GT System (EPS600, Shanghai, China), stained with 0.5 µg/mL GeneGreen Nucleic Acid Dye (Simgen, Hangzhou, China), and visualized with the Gel Doc XR+ System via Image Lab Software v6.1 (Bio-Rad, Hercules, CA, USA). The gel images were saved as uncompressed TIFF files. Only reproducible bands were verified for sizing and scored for downstream analysis.

2.4. Data Analysis

For genetic diversity assessment, binary matrices were constructed by interpreting distinct electrophoretic bands as genomic loci amplified by ISSR/SCoT primers. Each band represents a binding site between the genomic DNA of Chinese holly materials and ISSR/SCoT primers. Clear bands at the same migration rate positions for each primer were scored as 1, while absent or ambiguous bands were scored as 0, constructing a binary (0/1) matrix (Table S1). Only clear, stable, and reproducible bands were recorded. The amplification parameters, including the total number of amplification bits (TB), number of polymorphic bits (PB), and percentage of polymorphic bands (PPB), were calculated via Microsoft Excel 2019. Genetic diversity parameters, including the observed allele number (Na), effective allele number (Ne), Shannon’s information index (I), Nei’s gene diversity index (H), genetic similarity coefficients, and genetic distances, were computed via Popgen32 (version 1.32) software [29]. Cluster analysis based on genetic similarity matrices was performed using the UPGMA method in NTSYS-pc 2.10e [30], with dendrograms constructed to visualize relationships. Principal coordinates analysis (PCoA) for both marker systems was conducted via GenAlEx6.5 [31].

3. Results

3.1. Primer Amplification Efficiency and Polymorphism Performance

The ISSR and SCoT primers employed in this study demonstrated differential amplification efficiency in the genetic diversity analysis of Chinese holly individuals. The ISSR primers generated a total of 126 amplification bands, with 111 bands (88%) exhibiting polymorphism, indicating their robust genetic variation detection capability (Table 1; representative gel images are provided in Figure S2a,b). Notably, primers such as UBC824, UBC840 and UBC873 achieved complete (100%) polymorphism (Table 1), demonstrating the high specificity of their primer sequences in recognizing repetitive sequence spacing variations.
In contrast, the SCoT primer set exhibited superior performance, with all 65 amplified bands showing 100% polymorphism (Table 1). This confirms that primers designed on the basis of the start codon region offer greater resolution in detecting variations associated with functional genes.

3.2. Genetic Diversity Parameters

Genetic diversity analysis was conducted via binary matrices derived from ISSR and SCoT banding data (Table 2). For the ISSR markers, the observed allele number (Na) was 1.876, the effective allele number (Ne) was 1.461, Shannon’s information index (I) was 0.271, and Nei’s gene diversity index (H) was 0.411, indicating variability in polymorphic information among the different ISSR primers. For the SCoT markers, the observed allele number (Na) reached 2.000, the effective allele number (Ne) was 1.695, Shannon’s information index (I) was 0.393, and Nei’s gene diversity index (H) was 0.575, demonstrating variability in the polymorphic information among the different SCoT primers.

3.3. Genetic Similarity Coefficients

On the basis of genetic similarity coefficient matrices, the ISSR analysis revealed genetic similarity coefficients ranging from 0.5397 to 0.8730 among Chinese holly accessions (Figure S3a). The highest similarity (0.8730) was observed between samples ZSS and ZLS, indicating close genetic relationships between these two provenances. Conversely, the lowest similarity (0.5397) occurred between samples ZZDH and ZWW, suggesting distant phylogenetic relationships.
For the SCoT markers, the genetic similarity coefficients ranged from 0.3692 to 0.8462 (Figure S3b). The maximum similarity (0.8462) was detected between ZZP and ZJD samples, reflecting close genetic affiliation, whereas the minimum similarity (0.3692) between ZLJ and ZHX samples indicated the most divergent relationships.

3.4. Cluster Analysis

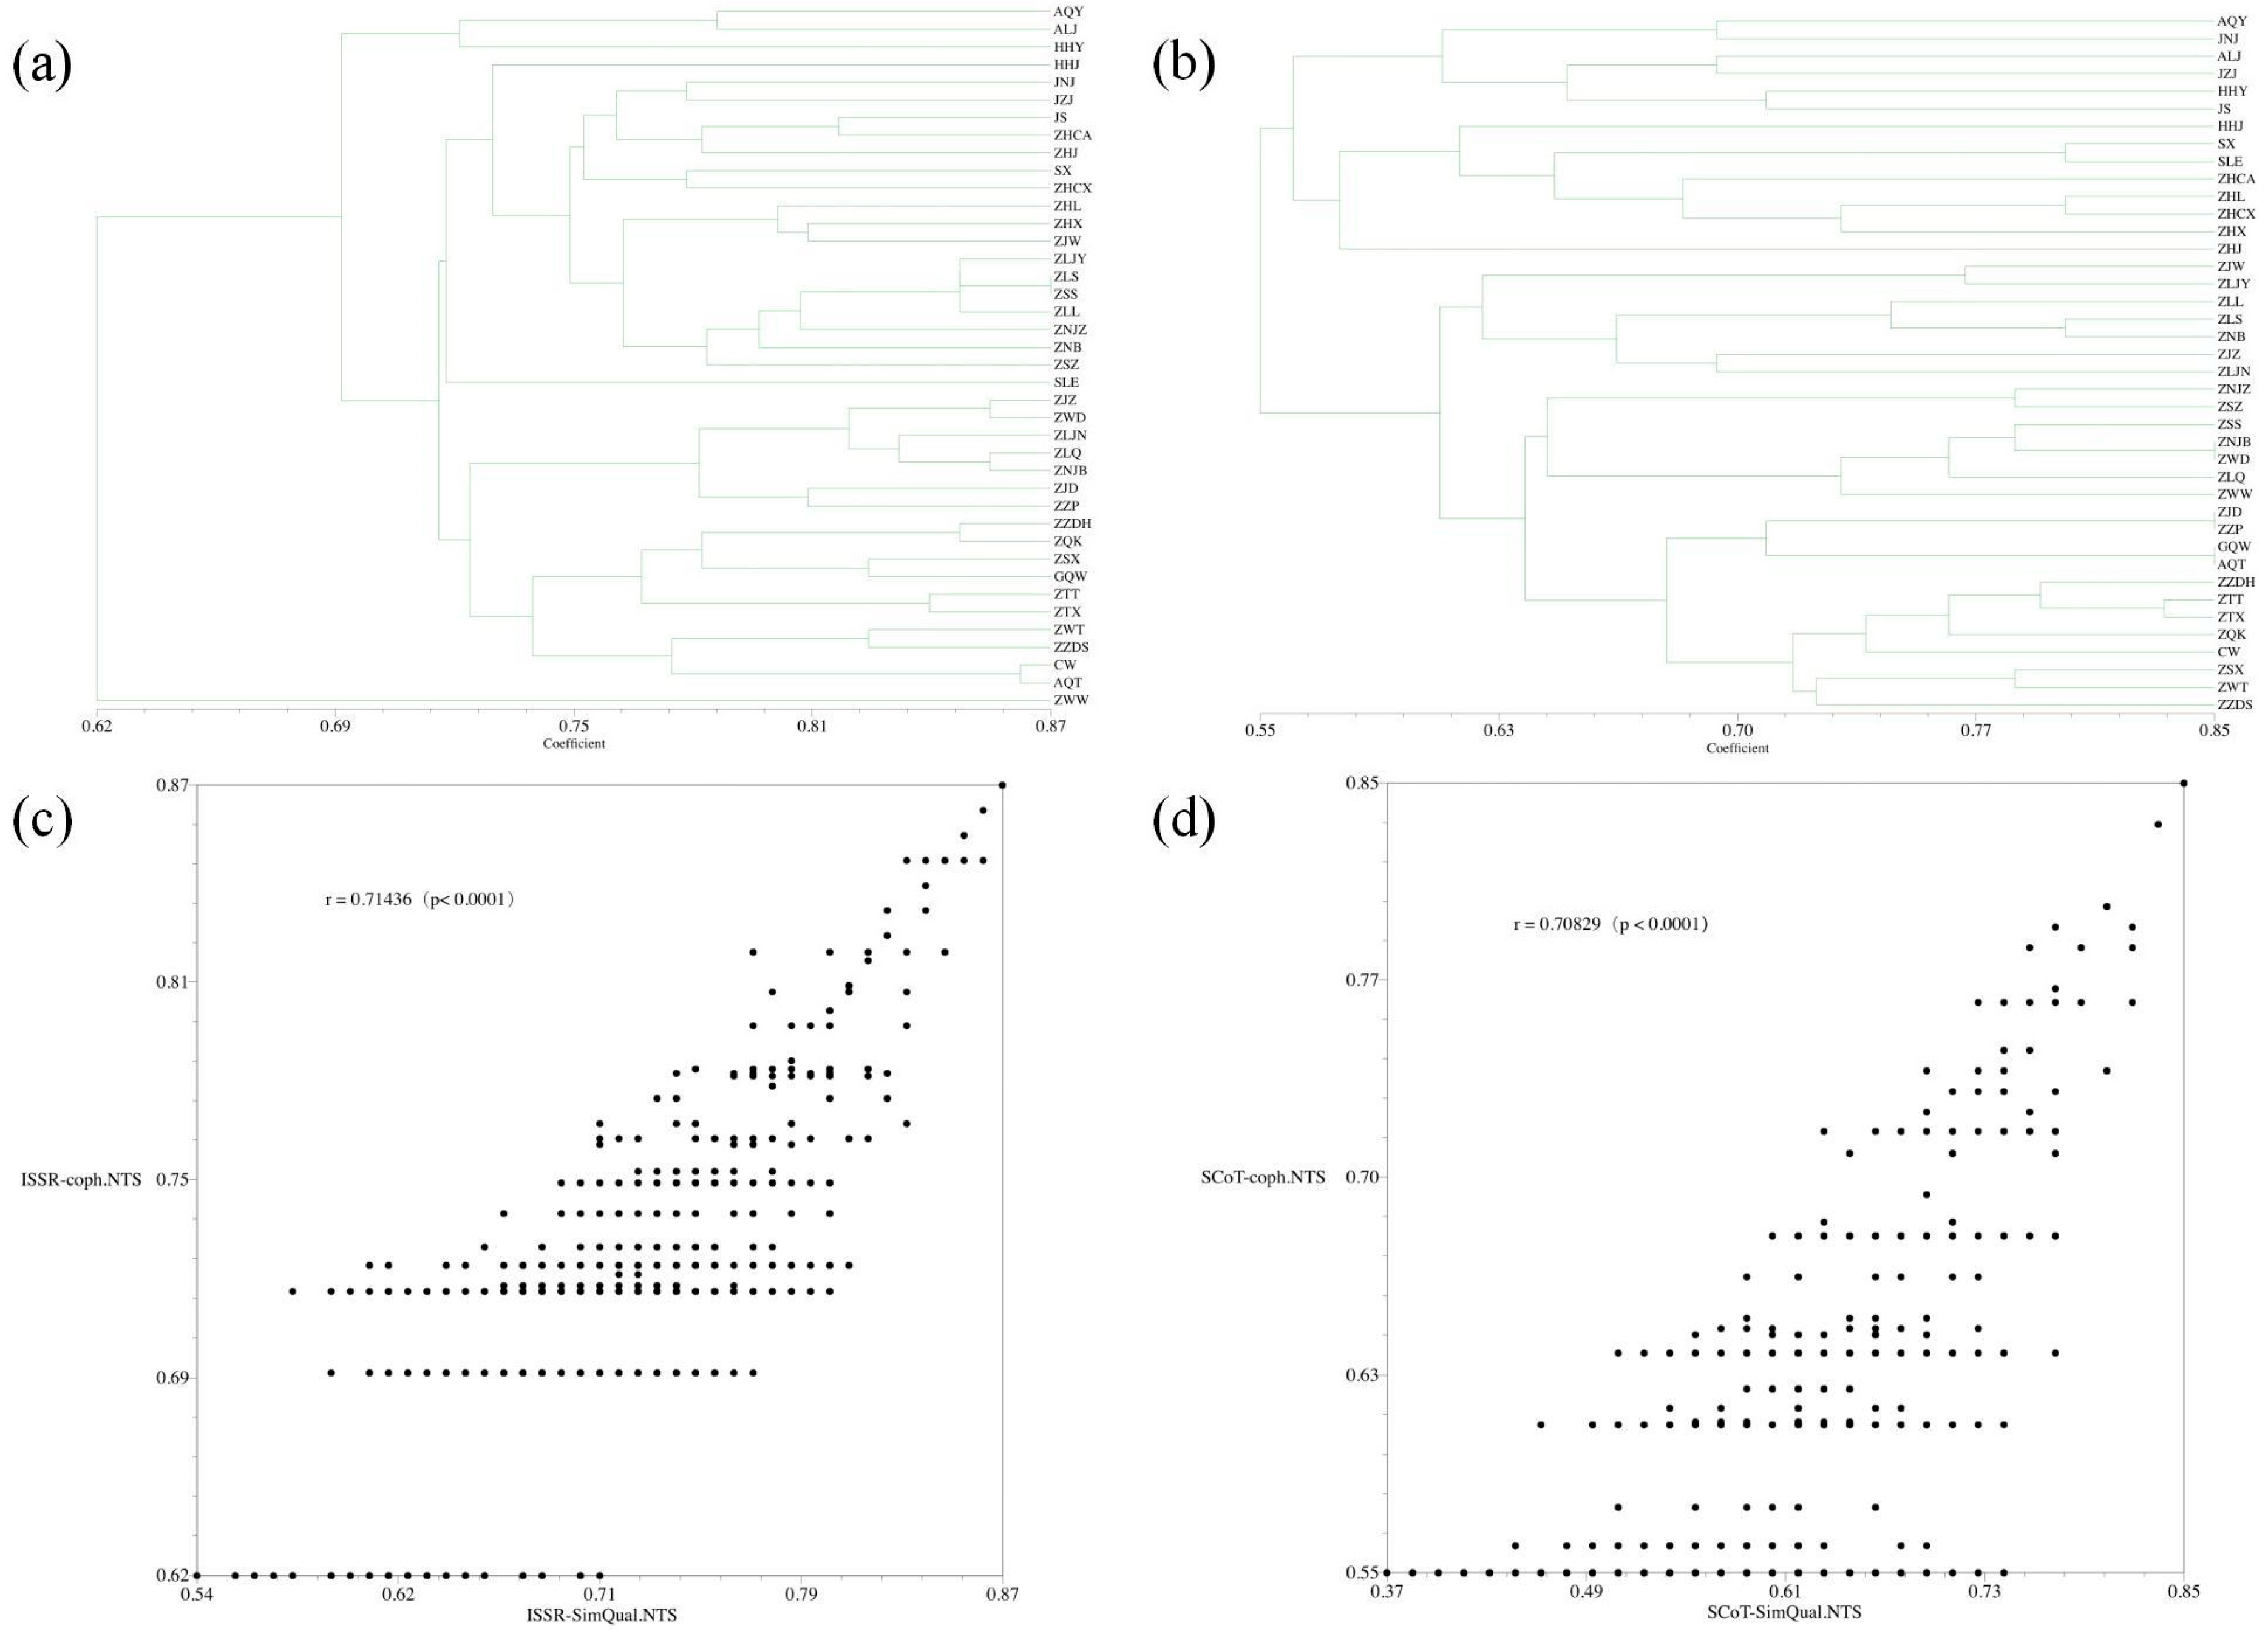
Cluster analysis of the 40 Chinese holly accessions, based on ISSR and SCoT molecular markers, revealed distinct genetic grouping patterns at varying similarity thresholds (Figure 2a,b). At a genetic similarity coefficient threshold of 0.69, two major clusters were formed, each subdivided into smaller groups. The Jiangsu province samples (JNJ and JZJ) clustered in a single branch, indicating genetic similarity within the province. Most Zhejiang province samples were grouped into adjacent branches, with ZLJY, ZLS and ZLL (all from Lishui city) forming a subcluster, suggesting minimal genetic divergence under shared environmental pressures. Notably, Sichuan’s SLE and Zhejiang’s ZWW samples appeared as isolated branches, indicating genetic distinctiveness in the ISSR profiles.
At a genetic similarity coefficient threshold of 0.55, two major clusters emerged with hierarchical subdivision. The Anhui Province samples (AQY and ALY) are grouped closely, reflecting high genetic affinity. Zhejiang samples are predominantly clustered in adjacent branches, emphasizing regional genetic cohesion. Interestingly, the Anhui (AQY) and Jiangsu (JNJ, ALJ and JZJ) samples converged in a subcluster, suggesting potential historical gene flow. Certain populations present exhibited low genetic diversity, warranting conservation attention amid environmental changes.
To assess the reliability of the clustering, we calculated the cophenetic correlation coefficient (r) for both ISSR and SCoT tree diagrams separately, and plotted the corresponding scatter plots (Figure 2c,d). The r value for ISSR markers was 0.71436, and for SCoT markers it was 0.70829. Both values were higher than 0.70, indicating that the UPGMA clustering of these two molecular markers can well reproduce the original similarity matrix.

3.5. Principal Coordinates Analysis

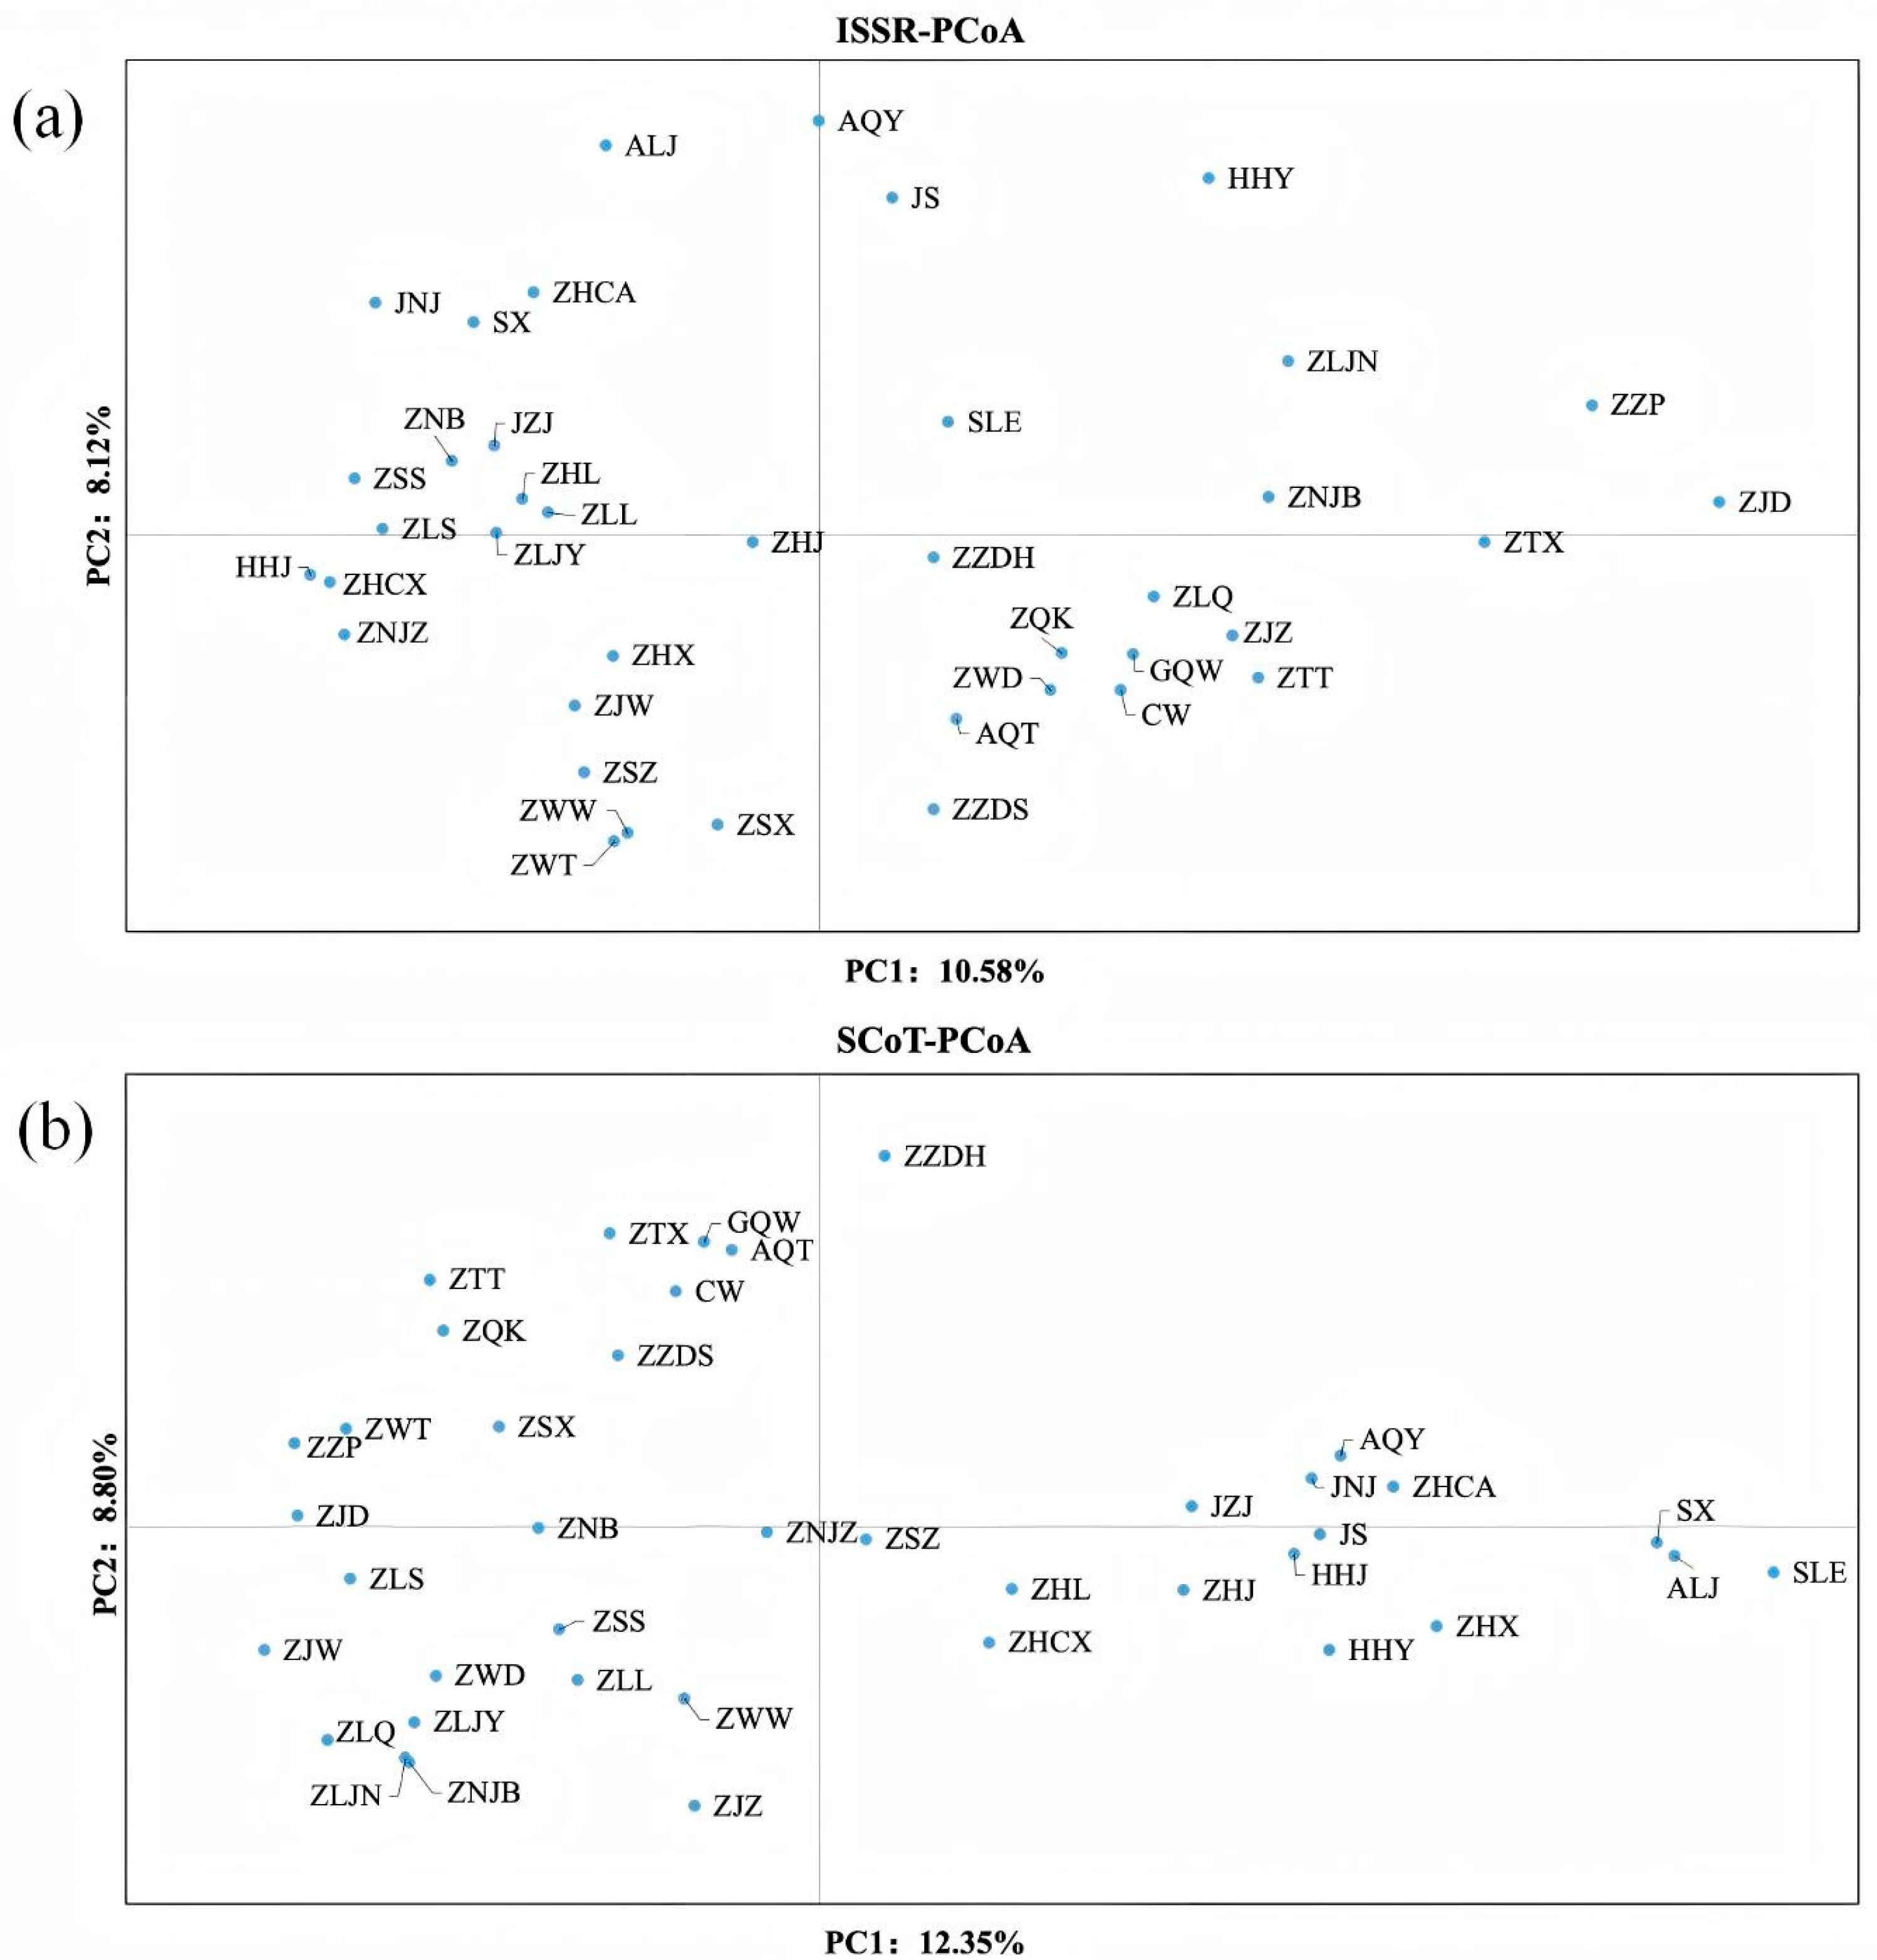
PCoA of the ISSR data revealed distinct clustering patterns (Figure 3a). The horizontal axis (PC1) accounted for 10.58% of the total variation, likely driven by key ISSR markers or combinations critical for sample differentiation. The vertical axis (PC2) explained 8.12% of the variation, working synergistically with PC1 to refine sample separation in the 2D plane. The Anhui (AQY and ALJ), Jiangsu (JZJ and JNJ) and Zhejiang samples (e.g., ZTT, ZQK and ZTX) clustered in specific regions, indicating that shared genetic features are potentially linked to geographic and environmental conditions.
For the SCoT markers, PC1 explained 12.35% of the variation, whereas PC2 accounted for 8.80% (Figure 3b). The Anhui samples AQY and ALY clustered closely, reflecting genetic similarity. The Jiangsu samples JZJ and JNJ also grouped in proximity, suggesting a shared genetic background. Most Zhejiang samples aggregated in a single region, reinforcing regional genetic cohesion. Notably, samples from the same geographic region (Anhui, Jiangsu and Zhejiang) tended to cluster adjacently, implying that environmental factors such as hydrology and climate may impose selective pressures shaping genetic divergence. PCoA effectively simplified complex multidimensional data, offering a robust visualization framework for interpreting genetic structure and diversity.

4. Discussion

Genetic diversity is a critical indicator for evaluating species’ capacity for survival, reproduction, and evolutionary adaptation. Species with greater genetic diversity demonstrate greater adaptability to environmental changes [32]. Molecular marker techniques have recently become indispensable tools for studying plant genetic diversity and identifying populations [33]. This study systematically analyzed the genetic diversity of 40 Chinese holly germplasm accessions from eight Chinese provinces by integrating ISSR and SCoT molecular marker techniques to elucidate their molecular-level genetic characteristics and phylogenetic relationships [34]. The results revealed significant genetic differentiation among Chinese holly populations, which is closely associated with their extensive geographic distribution and diverse ecological environments, but also with multiple ecological, historical, anthropogenic, and evolutionary factors [35]. For instance, gene flow among geographically adjacent populations may have promoted genetic exchange, while geographic isolation and habitat fragmentation could have restricted gene flow, leading to population differentiation [36,37]. Moreover, genetic drift, local adaptation, and long-term evolutionary history have likely shaped the observed genetic patterns, while human-mediated cultivation and dispersal might also have contributed to the current distribution of genetic diversity [38,39].
Genetic diversity parameters, including Na, Ne, H and I, serve as critical metrics for evaluating the genetic diversity of Chinese holly materials. Both ISSR and SCoT marker analyses revealed a high proportion of polymorphic loci and consistently indicated substantial genetic variation within the studied populations. These findings indicate substantial genomic variation within the Chinese holly population, which is likely attributable to its wide geographic distribution and diverse ecological habitats. This high genetic diversity provides a robust foundation for long-term survival and environmental adaptation, while also offering valuable genetic resources for horticultural and medicinal applications [40]. Distinct regional populations may contain unique allelic variants associated with the biosynthesis of pharmacologically active compounds. By integrating molecular diversity data with phytochemical screening, it is possible to target specific germplasm for medicinal research and cultivation, thereby enhancing both conservation and sustainable use.
Cluster analysis and PCoA revealed correlations between genetic distance and geographic distribution in the Chinese holly population. Samples from the same or adjacent provinces tended to cluster closely, suggesting that ecological factors such as temperature, precipitation, and soil type impose distinct selective pressures across regions. These pressures likely drive genetic differentiation among geographic populations, highlighting the interplay between environmental heterogeneity and evolutionary processes [41]. Conservation priorities should emphasize the preservation of individuals that harbor unique alleles or exhibit high genetic divergence, as identified in clustering analyses. Such individuals represent valuable genetic reservoirs for maintaining adaptive potential. For horticultural and medicinal breeding, selecting genetically distant individuals from separate PCoA clusters could enhance heterosis and provide a broader genetic base for trait improvement. In addition, germplasm management would benefit from a strategy that integrates diversity indices (H, I) and polymorphism data at the marker level, thereby guiding the systematic sampling of representative individuals to ensure that ex situ collections capture the full spectrum of variation present in Chinese holly.
Compared with previous studies, this research demonstrated higher genetic diversity levels in Chinese holly individuals, potentially due to broader sampling regions and optimized molecular marker selection. Chen et al. (2015) developed 25 nuclear microsatellite markers for Chinese holly, providing essential tools for population genetic studies [42]. More recently, Hou et al. (2024) reported decreasing genetic diversity from southeastern to southwestern China, with low-altitude populations exhibiting greater diversity than their high-altitude counterparts [43]. These findings align with our results, reinforcing the significant role of geographic factors in shaping genetic differentiation patterns. Identifying such high-diversity populations is essential for selecting breeding parents in horticultural improvement programs, particularly for traits such as stress tolerance, ornamental value, and adaptability to different environments.
While microsatellite markers offer advantages in individual identification and kinship analysis, their development and operational costs remain high, particularly in the absence of genomic resources. In contrast, ISSR and SCoT markers provide cost-effective alternatives suitable for large-scale genetic analyses under resource-limited conditions. Our study prioritized these markers to balance data quality and practicality. Additionally, Zhou et al. (2022) reported the genomic features of Chinese holly via next-generation sequencing (NGS), including genome size, heterozygosity, repeat sequence content, and GC content, marking the first comprehensive genomic characterization of this species [44]. Although genomic sequencing provides foundational genomic insights, it lacks direct resolution for interpopulation genetic relationships. Our ISSR and SCoT analyses complement these data by elucidating genetic diversity patterns and population structures. These findings not only establish a scientific basis for Chinese holly conservation and utilization but also, when integrated with genomic data, may enhance the understanding of its genetic traits and support sustainable development.

5. Conclusions

This study comprehensively evaluated the genetic diversity and population structure of Chinese holly individuals across eight Chinese provinces in 40 counties via ISSR and SCoT markers. SCoT markers identified 100% polymorphic bands and demonstrated higher genetic diversity indices than ISSR markers, likely due to broader sampling and optimized marker selection. Riverine populations, such as those in Zhejiang, exhibited peak genetic diversity, while montane groups like Sichuan’s SLE showed reduced variability, suggesting genetic drift or inbreeding. Genetic clustering via UPGMA and PCoA revealed population structuring correlated with geographic origin, with samples from adjacent provinces exhibited closer relationships, reflecting ecological niche-driven selection. These findings identify genetic hotspots and low-diversity populations as conservation priorities, with the integration of molecular and genomic resources poised to enhance breeding programs and climate resilience strategies. Future research should expand sampling to underrepresented regions, incorporate environmental variables to quantify selection pressures, and validate adaptive loci via whole-genome resequencing. This study will advance the understanding of intraspecific evolutionary dynamics in Chinese holly in China and support sustainable utilization and biodiversity conservation.

Supplementary Materials

The following supporting information can be downloaded at: https://www.mdpi.com/article/10.3390/horticulturae11091078/s1, Table S1: Binary matrix of ISSR and SCoT marker profiles for Chinese holly germplasm. Figure S1. Workflow visualization of germplasm sampling and grafting propagation in Chinese holly. Figure S2. Representative electrophoretic profiles of ISSR and SCoT Markers in Chinese Holly Genotypes. Figure S3. UPGMA clustering dendrograms of 40 Chinese holly germplasm accessions.

Author Contributions

Conceptualization, J.J. and X.W.; methodology, M.L., H.H. and B.Z. (Baoxin Zhang); software, M.L.; validation, M.L., H.H. and J.Z.; formal analysis, M.L.; investigation, M.L.; resources, J.J.; data curation, M.L. and H.H.; writing—original draft preparation, M.L. and X.W.; writing—review and editing, W.D., J.J. and B.Z. (Bingsong Zheng); visualization, M.L.; supervision, X.W.; project administration, X.W. and J.J.; funding acquisition, J.J. All authors have read and agreed to the published version of the manuscript.

Funding

This research was funded by the Zhejiang Science and Technology Major Program on Agricultural New Varieties Breeding (2021C02070-5-4).

Data Availability Statement

The raw data supporting the conclusions of this article will be made available by the authors on request.

Conflicts of Interest

The authors declare no conflicts of interest.

Abbreviations

The following abbreviations are used in this manuscript:
ISSRInter-Simple Sequence Repeat
SCoTStart Codon Targeted Polymorphism
AFLPAmplified Fragment Length Polymorphism
SSRSimple Sequence Repeats
SRAPSequence-Related Amplified Polymorphism
SNPSingle Nucleotide Polymorphisms
TBTotal Number of Amplification Bits
PBNumber of Polymorphic Bits
PPBPercentage of Polymorphic Bands
NaAllele Number
NeEffective Allele Number
IShan-non’s information index
HNei’s gene diversity index
AQYYuexi County, Anqing City, Anhui Province
ALJJinzhai County, Lu’an City, Anhui Province
HHYYingshan County, Huanggang City, Hubei Province
HHJJingzhou County, Huaihua City, Hunan Province
JNJJiangning District, Nanjing City, Jiangsu Province
JZJJurong City, Zhenjiang City, Jiangsu Province
JSShangrao City, Jiangxi Province
SXXuhui District, Shanghai City
SLEE’mei Mountain City, Leshan City, Sichuan Province
ZHCAChun’an County, Hangzhou City, Zhejiang Province
ZHJJiande City, Hangzhou City, Zhejiang Province
ZHLLin’an District, Hangzhou City, Zhejiang Province
ZHXXihu District, Hangzhou City, Zhejiang Province
ZHCXChangxing County, Huzhou City, Zhejiang Province
ZJWWucheng District, Jinhua City, Zhejiang Province
ZLJYJinyun County, Lishui City, Zhejiang Province
ZLLLongquan City, Lishui City, Zhejiang Province
ZLSSuichang County, Lishui City, Zhejiang Province
ZNBBeilun District, Ningbo City, Zhejiang Province
ZNJZYinzhou District, Ningbo City, Zhejiang Province
ZSSShengzhou City, Shaoxing City, Zhejiang Province
ZSZZhuji City, Shaoxing City, Zhejiang Province
ZJZZhenhai District, Ningbo City, Zhejiang Province
ZLJNJingning County, Lishui City, Zhejiang Province
ZJDDongyang City, Jinhua City, Zhejiang Province
ZZPPutuo District, Zhoushan City, Zhejiang Province
ZLQQingtian County, Lishui City, Zhejiang Province
ZNJBJiangbei District, Ningbo City, Zhejiang Province
ZWDDongtou County, Wenzhou City, Zhejiang Province
ZWWWencheng County, Wenzhou City, Zhejiang Province
ZZDHDinghai District, Zhoushan City, Zhejiang Province
ZQKKaihua County, Quzhou City, Zhejiang Province
ZSXXinchang County, Shaoxing City, Zhejiang Province
ZTTTiantai County, Taizhou City, Zhejiang Province
ZTXXianju County, Taizhou City, Zhejiang Province
CWWushan County, Chongqing Municipality
ZWTTaishun County, Wenzhou City, Zhejiang Province
ZZDSDaishan County, Zhoushan City, Zhejiang Province
GQWWangmo County, Qiannan Buyi and Miao Autonomous Prefecture, Guizhou Province
AQTTongcheng County, Anqing City, Anhui Province

References

  1. Hu, S. The genus Ilex in China. J. Arnold Arbor. 1949, 30, 233–344. [Google Scholar] [CrossRef]
  2. Yao, X.; Zhang, F.; Corlett, R.T. Utilization of the hollies (Ilex L. spp.): A review. Forests 2022, 13, 94. [Google Scholar] [CrossRef]
  3. Zhao, L.; Zhang, D. Ornamental plant resources from China. In Proceedings of the XXVI International Horticultural Congress: Asian Plants with Unique Horticultural Potential: Genetic Resources, Cultural 620, Toronto, ON, Canada, 11–17 August 2002; pp. 365–375. [Google Scholar]
  4. Liu, J.; Coomes, D.A.; Gibson, L.; Hu, G.; Liu, J.; Luo, Y.; Wu, C.; Yu, M. Forest fragmentation in China and its effect on biodiversity. Biol. Rev. 2019, 94, 1636–1657. [Google Scholar] [CrossRef]
  5. Liu, J.; Zhan, J.; Deng, X. Spatio-temporal patterns and driving forces of urban land expansion in China during the economic reform era. AMBIO J. Hum. Environ. 2005, 34, 450–455. [Google Scholar] [CrossRef][Green Version]
  6. Li, R.F.; Xia, W.Q.; Liu, J.B.; Cui, B.S.; Hou, Q.; Sun, H.; Li, S. New triterpenoid saponins from the leaves of Ilex chinensis. Fitoterapia 2018, 131, 134–140. [Google Scholar] [CrossRef] [PubMed]
  7. Shao, S.; Li, R.; Sun, H.; Li, S. New triterpenoid saponins from the leaves of Ilex chinensis and their hepatoprotective activity. Chin. J. Nat. Med. 2021, 19, 376–384. [Google Scholar] [CrossRef]
  8. College, J.N.M. Chinese Native Medicine Big Dictionary; Jiangsu Science and Technology Press: Nanjing, China, 1979. [Google Scholar]
  9. McLenachan, P.A.; Stöckler, K.; Winkworth, R.C.; McBreen, K.; Zauner, S.; Lockhart, P.J. Markers derived from amplified fragment length polymorphism gels for plant ecology and evolution studies. Mol. Ecol. 2000, 9, 1899–1903. [Google Scholar] [CrossRef]
  10. Ivandic, V.; Hackett, C.A.; Nevo, E.; Keith, R.; Thomas, W.T.; Forster, B.P. Analysis of simple sequence repeats (SSRs) in wild barley from the Fertile Crescent: Associations with ecology, geography and flowering time. Plant Mol. Biol. 2002, 48, 511–527. [Google Scholar] [CrossRef] [PubMed]
  11. Ayesiga, S.B.; Rubaihayo, P.; Oloka, B.M.; Dramadri, I.O.; Sserumaga, J.P. Genome-wide association study and pathway analysis to decipher loci associated with Fusarium ear rot resistance in tropical maize germplasm. Genet. Resour. Crop. Evol. 2024, 71, 2435–2448. [Google Scholar] [CrossRef]
  12. Joshi, P.; Dhawan, V. Assessment of genetic fidelity of micropropagated Swertia chirayita plantlets by ISSR marker assay. Biol. Plant. 2007, 51, 22–26. [Google Scholar] [CrossRef]
  13. Collard, B.C.; Mackill, D.J. Start codon targeted (SCoT) polymorphism: A simple, novel DNA marker technique for generating gene-targeted markers in plants. Plant Mol. Biol. Rep. 2009, 27, 86–93. [Google Scholar] [CrossRef]
  14. Kwok, P.; Chen, X. Detection of single nucleotide polymorphisms. Curr. Issues Mol. Biol. 2003, 5, 43–60. [Google Scholar]
  15. Daneva, V.; Beniwal, R.; Kajla, S.; Poonia, A.K.; Kumar, M.; Kajal. Assessment of genetic diversity in Tecomella undulata by using ISSR markers. Vegetos 2023, 36, 1526–1534. [Google Scholar] [CrossRef]
  16. Sheikh, Z.N.; Sharma, V.; Shah, R.A.; Sharma, N.; Summuna, B.; Al-Misned, F.A.; El-Serehy, H.A.; Mir, J.I. Genetic diversity analysis and population structure in apricot (Prunus armeniaca L.) grown under north-western himalayas using ISSR markers. Saudi J. Biol. Sci. 2021, 28, 5986–5992. [Google Scholar] [CrossRef] [PubMed]
  17. Zheng, J.; Su, H.; Pu, S.; Chen, H.; El-Kassaby, Y.A.; Yang, Z.; Feng, J. High-yield hybrid breeding of Camellia oleifolia based on ISSR molecular markers. BMC Plant Biol. 2024, 24, 517. [Google Scholar] [CrossRef] [PubMed]
  18. Sidhiq, D.F.; Widiyastuti, Y.; Subositi, D.; Pujiasmanto, B.; Yunus, A. Morphological diversity, total phenolic and flavonoid content of Echinacea purpurea cultivated in Karangpandan, Central Java, Indonesia. Biodiversitas J. Biol. Divers. 2020, 21, 1265–1271. [Google Scholar] [CrossRef]
  19. Vishnu, B.; Siril, E. Start Codon Targeted (SCoT) markers unveiled the genetic diversity of Nelumbo nucifera Gaertn. from Kerala, South India. Gene Rep. 2025, 40, 102262. [Google Scholar] [CrossRef]
  20. Altaf, M.T.; Nadeem, M.A.; Ali, A.; Liaqat, W.; Bedir, M.; Baran, N.; Ilić, A.; Ilyas, M.K.; Ghafoor, A.; Dogan, H. Applicability of Start Codon Targeted (SCoT) markers for the assessment of genetic diversity in bread wheat germplasm. Genet. Resour. Crop Evol. 2025, 72, 1205–1218. [Google Scholar] [CrossRef]
  21. Al-Qurainy, F.; Khan, S.; Nadeem, M.; Tarroum, M. SCoT marker for the assessment of genetic diversity in Saudi Arabian date palm cultivars. Pak. J. Bot. 2015, 47, 637–643. [Google Scholar]
  22. Nouri, A.; Golabadi, M.; Etminan, A.; Rezaei, A.; Mehrabi, A.A. Comparative assessment of SCoT and ISSR markers for analysis of genetic diversity and population structure in some Aegilops tauschii Coss. accessions. Plant Genet. Resour. Charact. Util. 2021, 19, 375–383. [Google Scholar] [CrossRef]
  23. Hassan, F.A.S.; Ismail, I.A.; Mazrou, R.; Hassan, M. Applicability of inter-simple sequence repeat (ISSR), start codon targeted (SCoT) markers and ITS2 gene sequencing for genetic diversity assessment in Moringa oleifera Lam. J. Appl. Res. Med. Aromat. Plants 2020, 18, 100256. [Google Scholar] [CrossRef]
  24. Yilmaz, A.; Ciftci, V. Genetic relationships and diversity analysis in Turkish laurel (Laurus nobilis L.) germplasm using ISSR and SCoT markers. Mol. Biol. Rep. 2021, 48, 4537–4547. [Google Scholar] [CrossRef]
  25. Igwe, D.O.; Ihearahu, O.C.; Osano, A.A.; Acquaah, G.; Ude, G.N. Assessment of genetic diversity of Musa species accessions with variable genomes using ISSR and SCoT markers. Genet. Resour. Crop Evol. 2022, 69, 49–70. [Google Scholar] [CrossRef]
  26. Tsaktsira, M.; Chavale, E.; Kostas, S.; Pipinis, E.; Tsoulpha, P.; Hatzilazarou, S.; Ziogou, F.-T.; Nianiou-Obeidat, I.; Iliev, I.; Economou, A.; et al. Vegetative Propagation and ISSR-Based Genetic Identification of Genotypes of Ilex aquifolium ‘Agrifoglio Commune’. Sustainability 2021, 13, 10345. [Google Scholar] [CrossRef]
  27. Leng, X.; Wang, Z.; An, S.; Feng, J.; Liu, Y.; Wang, G. ISSR analysis of genetic diversity of Ilex integra, an insular endemic plant. Biodiv. Sci. 2005, 13, 546–554. [Google Scholar] [CrossRef]
  28. Roldan-Ruiz, I.; Dendauw, J.; Van Bockstaele, E.; Depicker, A.; De Loose, M. AFLP markers reveal high polymorphic rates in ryegrasses (Lolium spp.). Mol. Breed. 2000, 6, 125–134. [Google Scholar] [CrossRef]
  29. Yeh, F.; Yang, R.; Boyle, T. Microsoft Window-Based Freeware for Population Genetic Analysis, Quick User Guide, POPGENE version 1.31; Center for International Forestry Research, University of Alberta: Edmonton, AB, Canada, 1999; pp. 1–29. [Google Scholar]
  30. Rohlf, F.J. NTSYS-Pc: Numerical Taxonomy and Multivariate Analysis System, version 2.1, Exeter Software: New York, NY, USA, 2000.
  31. Peakall, R.; Smouse, P.E. GenAlEx 6.5: Genetic analysis in Excel. Population genetic software for teaching and research—An update. Bioinformatics 2012, 28, 2537–2539. [Google Scholar] [CrossRef]
  32. Zhang, S.; Wang, S.; Wang, S.; Su, H.; De, J. Genetic Diversity and Metabolic Profile of Tibetan Medicinal Plant Saussurea obvallata. Genes 2025, 16, 593. [Google Scholar] [CrossRef] [PubMed]
  33. Ortega-Ramírez, M.E.; Magaña-Álvarez, A.; Pérez-Brito, D.; Cortés-Velázquez, A.; Nexticapan-Garcéz, Á.; Tapia-Tussell, R.; Martín-Mex, R. Exploring the Genetic Variability of Gmelina arborea Roxb. in Mexico with Molecular Markers to Establish an Efficient Improvement Program. Plants 2025, 14, 1888. [Google Scholar] [CrossRef] [PubMed]
  34. Igwe, D.O.; Afiukwa, C.A.; Ubi, B.E.; Ogbu, K.I.; Ojuederie, O.B.; Ude, G.N. Assessment of genetic diversity in Vigna unguiculata L. (Walp) accessions using inter-simple sequence repeat (ISSR) and start codon targeted (SCoT) polymorphic markers. BMC Genom. Data 2017, 18, 98. [Google Scholar] [CrossRef] [PubMed]
  35. Pakseresht, F.; Talebi, R.; Karami, E. Comparative assessment of ISSR, DAMD and SCoT markers for evaluation of genetic diversity and conservation of landrace chickpea (Cicer arietinum L.) genotypes collected from north-west of Iran. Physiol. Mol. Biol. Plants 2013, 19, 563–574. [Google Scholar] [CrossRef]
  36. Browne, L.; Karubian, J. Habitat loss and fragmentation reduce effective gene flow by disrupting seed dispersal in a neotropical palm. Mol. Ecol. 2018, 27, 3055–3069. [Google Scholar] [CrossRef] [PubMed]
  37. Toczydlowski, R.H.; Waller, D.M. Drift happens: Molecular genetic diversity and differentiation among populations of jewelweed (Impatiens capensis Meerb.) reflect fragmentation of floodplain forests. Mol. Ecol. 2019, 28, 2459–2475. [Google Scholar] [CrossRef] [PubMed]
  38. da Silva Carvalho, C.; Ribeiro, M.C.; Côrtes, M.C.; Galetti, M.; Collevatti, R.G. Contemporary and historic factors influence differently genetic differentiation and diversity in a tropical palm. Heredity 2015, 115, 216–224. [Google Scholar] [CrossRef] [PubMed]
  39. Ålund, M.; Cenzer, M.; Bierne, N.; Boughman, J.W.; Cerca, J.; Comerford, M.S.; Culicchi, A.; Langerhans, B.; McFarlane, S.E.; Möst, M.H.; et al. Anthropogenic Change and the Process of Speciation. Cold Spring Harb. Perspect. Biol. 2023, 15, a041455. [Google Scholar] [CrossRef] [PubMed]
  40. Luz, G.C.; Strioto, D.K.; Mangolin, C.A.; Machado, M. ISSR markers to assess genetic diversity of cultivated populations from artificial selection of Stevia rebaudiana (Bert.) Bertoni. Breed Sci. 2020, 70, 508–514. [Google Scholar] [CrossRef]
  41. Slatkin, M. Gene flow and the geographic structure of natural populations. Science 1987, 236, 787–792. [Google Scholar] [CrossRef]
  42. Chen, W.W.; Xiao, Z.Z.; Tong, X.; Liu, Y.P.; Li, Y.Y. Development and characterization of 25 microsatellite primers for Ilex chinensis (Aquifoliaceae). Appl. Plant Sci. 2015, 3, 1500057. [Google Scholar] [CrossRef]
  43. Hou, S.; Zhou, P.; Fang, Y.; Wang, X.; Zhang, M.; Zhang, Q. The Genetic Diversity of Natural Ilex chinensis Sims (Aquifoliaceae) Populations as Revealed by SSR Markers. Forests 2024, 15, 763. [Google Scholar] [CrossRef]
  44. Zhou, P.; Li, J.; Huang, J.; Li, F.; Zhang, Q.; Zhang, M. Genome Survey Sequencing and Genetic Background Characterization of Ilex chinensis Sims (Aquifoliaceae) Based on Next-Generation Sequencing. Plants 2022, 11, 3322. [Google Scholar] [CrossRef]
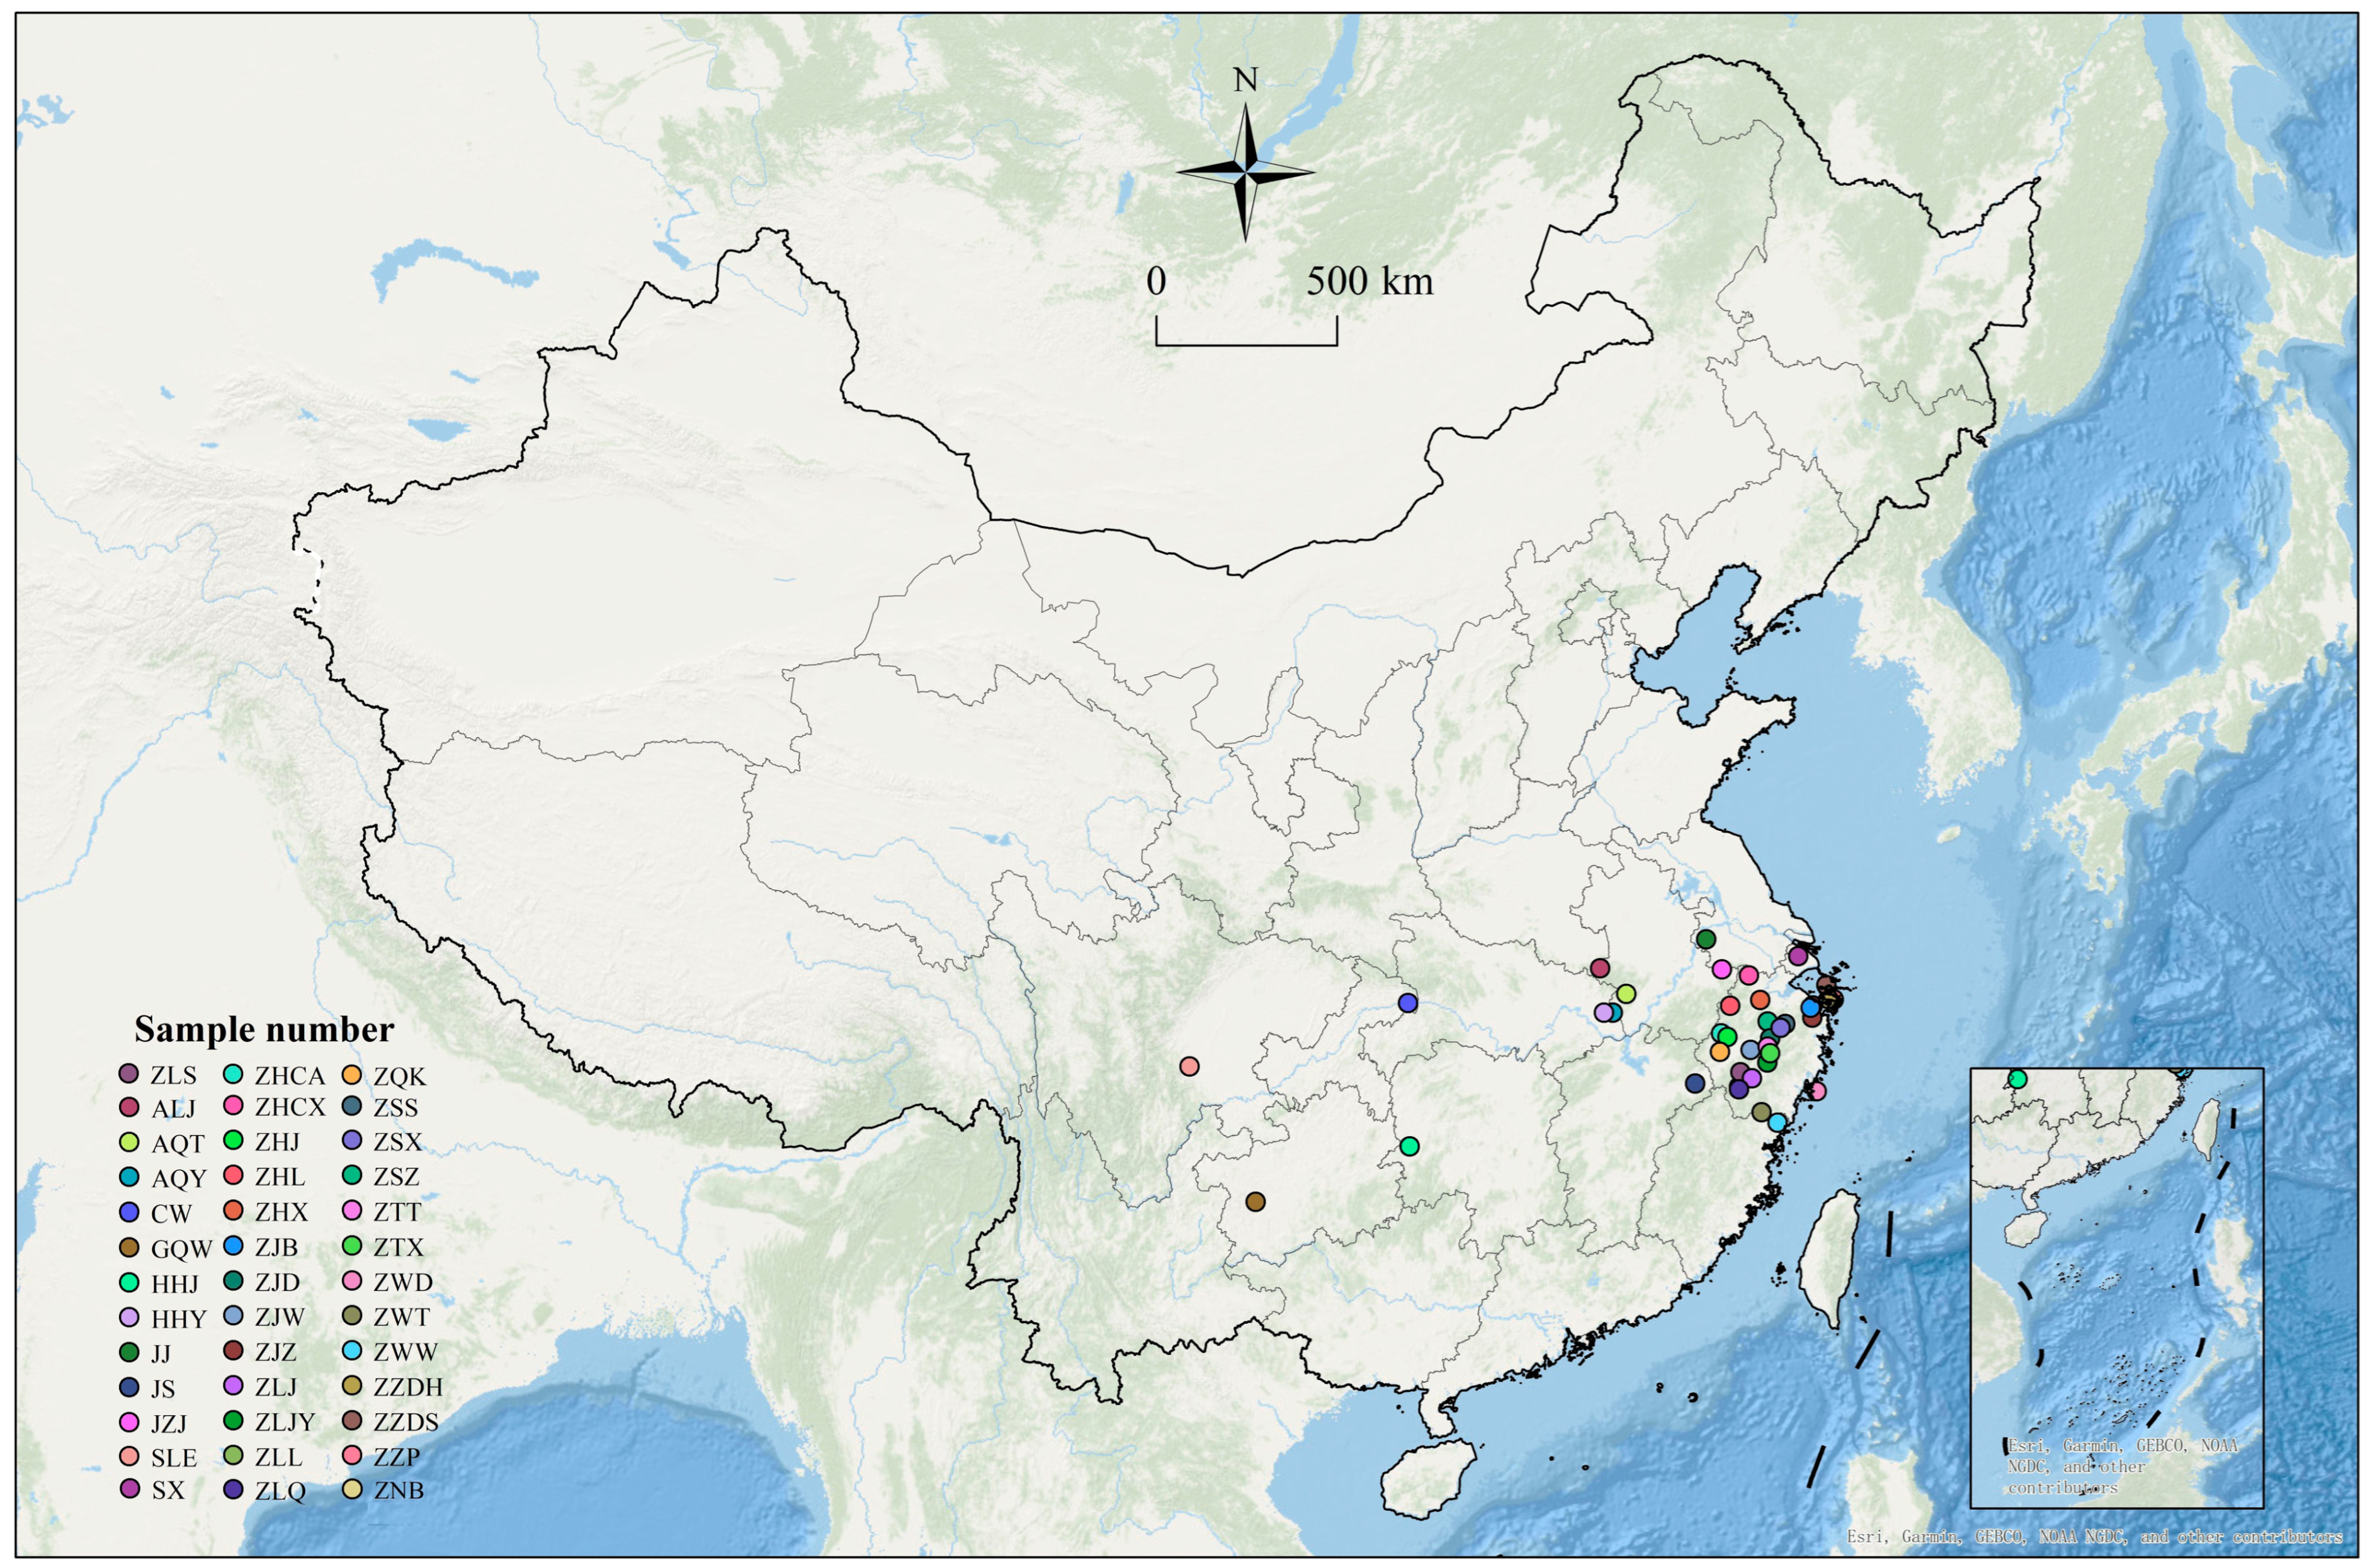
Figure 1. The geographical distribution of 40 Chinese holly germplasm collection sites across 8 provinces in China. Each site was labeled with a three-or four-letter acronym (defined below) and marked by a color-coded dot corresponding to its county. The acronyms and their corresponding locations are as follows: AQY (Yuexi County, Anqing City, Anhui Province), ALJ (Jinzhai County, Lu’an City, Anhui Province), HHY (Yingshan County, Huanggang City, Hubei Province), HHJ (Jingzhou County, Huaihua City, Hunan Province), JNJ (Jiangning District, Nanjing City, Jiangsu Province), JZJ (Jurong City, Zhenjiang City, Jiangsu Province), JS (Shangrao City, Jiangxi Province), SX (Xuhui District, Shanghai City), SLE (E’mei Mountain City, Leshan City, Sichuan Province), ZHCA (Chun’an County, Hangzhou City, Zhejiang Province), ZHJ (Jiande City, Hangzhou City, Zhejiang Province), ZHL (Lin’an District, Hangzhou City, Zhejiang Province), ZHX (Xihu District, Hangzhou City, Zhejiang Province), ZHCX (Changxing County, Huzhou City, Zhejiang Province), ZJW (Wucheng District, Jinhua City, Zhejiang Province), ZLJY (Jinyun County, Lishui City, Zhejiang Province), ZLL (Longquan City, Lishui City, Zhejiang Province), ZLS (Suichang County, Lishui City, Zhejiang Province), ZNB (Beilun District, Ningbo City, Zhejiang Province), ZNJZ (Yinzhou District, Ningbo City, Zhejiang Province), ZSS (Shengzhou City, Shaoxing City, Zhejiang Province), ZSZ (Zhuji City, Shaoxing City, Zhejiang Province), ZJZ (Zhenhai District, Ningbo City, Zhejiang Province), ZLJN (Jingning County, Lishui City, Zhejiang Province), ZJD (Dongyang City, Jinhua City, Zhejiang Province), ZZP (Putuo District, Zhoushan City, Zhejiang Province), ZLQ (Qingtian County, Lishui City, Zhejiang Province), ZNJB (Jiangbei District, Ningbo City, Zhejiang Province), ZWD (Dongtou County, Wenzhou City, Zhejiang Province), ZWW (Wencheng County, Wenzhou City, Zhejiang Province), ZZDH (Dinghai District, Zhoushan City, Zhejiang Province), ZQK (Kaihua County, Quzhou City, Zhejiang Province), ZSX (Xinchang County, Shaoxing City, Zhejiang Province), ZTT (Tiantai County, Taizhou City, Zhejiang Province), ZTX (Xianju County, Taizhou City, Zhejiang Province), CW (Wushan County, Chongqing Municipality), ZWT (Taishun County, Wenzhou City, Zhejiang Province), ZZDS (Daishan County, Zhoushan City, Zhejiang Province), and GQW (Wangmo County, Qiannan Buyi and Miao Autonomous Prefecture, Guizhou Province). The base map, sourced from the Standard Map Service website of the Ministry of Natural Resources (Approval No. GS (2023) 2767), remains unmodified.
Horticulturae 11 01078 g001
Figure 2. UPGMA clustering dendrograms and cophenetic correlation analyses of Chinese holly germplasm resources based on ISSR and SCoT marker. (a,b) UPGMA dendrograms generated by NTSYS-pc software based on Dice similarity coefficients using ISSR (a) and SCoT (b) markers. (c,d) Scatter plots showing the cophenetic correlation coefficients (r) between the Dice similarity matrix and the corresponding UPGMA dendrograms for ISSR (c) and SCoT (d) markers.
Horticulturae 11 01078 g002
Figure 3. PCoA of 40 Chinese holly populations generated via GenAlEx6.5 software, illustrating genetic relationships among germplasm accessions on the basis of ISSR (a) and SCoT (b) molecular markers.
Horticulturae 11 01078 g003
Table 1. The sequence and number of polymorphic bands produced by the selected ISSR and SCoT primers for the genetic diversity analysis of Chinese holly individuals.
Primer NameSequence of Primer (5′-3′)Total No. of Amplification (B)No. of Polymorphic (A)Polymorphism (A/B) %
UBC811GAGAGAGAGAGAGAGAC121083%
UBC815CTCTCTCTCTCTCTCTCTG111091%
UBC824TCTCTCTCTCTCTCTCG77100%
UBC834AGAGAGAGAGAGAGAGYT8675%
UBC835AGAGAGAGAGAGAGAGYC9667%
UBC836AGAGAGAGAGAGAGAGYA9778%
UBC840GAGAGAGAGAGAGAGAYT1111100%
UBC841GAGAGAGAGAGAGAGAYC8788%
UBC842CTCTCTCTCTCTCTCTRA9778%
UBC843CTCTCTCTCTCTCTCTRC77100%
UBC844CTCTCTCTCTCTCTCTRG99100%
UBC873GACAGACAGACAGACA1616100%
UBC874CCCTCCCTCCCTCCCT10880%
Total bands scored 12611188%
SCoT11AAGCAATGGCTACACCAA1212100%
SCoT13ACGACATGGGACACATCG1616100%
SCoT19ACCATGGCTACACCCGGC99100%
SCoT20ACCATGGCTACACCCGGG1010100%
SCoT34ACCATGGCTACCCCGGA99100%
SCoT35CATGGCTACCCCGGGCC99100%
Total bands scored 6565100%
Table 2. Assessment of Genetic Diversity Parameters in Chinese Holly.
Primer TypePrimer NamePBTBPPBNaNeIHPIC
UBC811101283%1.8331.5240.2960.4360.30
UBC815101191%1.9091.5090.2860.4290.29
UBC82477100%2.0001.4610.2790.4320.28
UBC8346875%1.7501.5120.2820.4120.28
UBC8356967%1.6671.2750.1810.2860.18
ISSRUBC8367978%1.7781.5390.2990.4380.30
UBC8401111100%2.0001.4770.2810.4330.28
UBC8417888%1.8751.3470.2110.3290.21
UBC8427978%1.7781.5290.2940.4290.29
UBC84377100%2.0001.5940.3400.5040.34
UBC84499100%2.0001.3090.2090.3480.21
UBC8731616100%2.0001.4920.3090.4790.31
UBC87481080%1.8001.4240.2530.3840.25
AV. 1.8761.4610.2710.4110.27
SCoT111212100%2.0001.8600.4580.6490.46
SCoT131616100%2.0001.6660.3780.5570.38
SCoT1999100%2.0001.6950.4020.5890.40
SCoT201010100%2.0001.6780.3910.5760.39
SCoT3499100%2.0001.6450.3690.5460.37
SCoT3599100%2.0001.6230.3590.5360.36
AV. 2.0001.6950.3930.5750,39
Note: PB, Number of Polymorphic Bits; TB, Total Number of Amplification Bits; PPB, Percentage of Polymorphic Bands; Na, Allele Number; Ne, Effective Allele Number; I, Shan-non’s information index; H, Nei’s gene diversity index; PIC, polymorphism information content.
Disclaimer/Publisher’s Note: The statements, opinions and data contained in all publications are solely those of the individual author(s) and contributor(s) and not of MDPI and/or the editor(s). MDPI and/or the editor(s) disclaim responsibility for any injury to people or property resulting from any ideas, methods, instructions or products referred to in the content.