Article

Variations in C:N:P Stoichiometry and Non-Structural Carbohydrates in Different Parts of Pomelo (Citrus maxima) Flowers at Three Phenophases

1
Department of Forestry, Faculty of Forestry, Sichuan Agricultural University, Chengdu 611130, China
2
School of Life Science and Engineering, Southwest Jiaotong University, Chengdu 611756, China
3
Ecological Conservation, Restoration and Resource Utilization on Forest and Wetland Key Laboratory of Sichuan Province, Sichuan Academy of Forestry, Chengdu 610081, China
4
Forest Ecology and Conservation in the Upper Reaches of the Yangtze River Key Laboratory of Sichuan Province & Sichuan Mt. Emei Forest Ecosystem National Observation and Research Station, Sichuan Agricultural University, Chengdu 611130, China
*
Authors to whom correspondence should be addressed.
Horticulturae 2025, 11(9), 1053; https://doi.org/10.3390/horticulturae11091053
Submission received: 6 August 2025 / Revised: 29 August 2025 / Accepted: 2 September 2025 / Published: 3 September 2025

Abstract

Carbon (C), nitrogen (N) and phosphorus (P), and non-structural carbohydrates (NSCs) are basic nutrients and energy sources for flower development. In this study, the morphological traits, C, N, P, and NSC concentrations, and C:N:P ratios in pistil, stamen, and petal of C. maxima flower at three phenophases (BBCH54, BBCH59, and BBCH61) were comparatively analyzed. Morphology diverged markedly among the three phenophases, whereas relative water contents were stable. C, N, P, and NSC showed larger variations at three phenophases and parts in C. maxima flower. Maximal C:N, C:P, and N:P occurred in pistils, pistils, and petals at BBCH61, respectively. C:N:P stoichiometry was the most responsive to ontogeny, indicating development-specific elemental storage and biomass partitioning of C. maxima flowers. NSC contents (glucose, fructose, sucrose, starch) differed significantly among organs and phenophases, and peak NSC appeared in the pistils at the three phenophases. High correlations between NSCs and C:N:P ratios suggested coordinated resource allocation. Correlation analysis showed that significant differences occurred at three phenophases for the accumulation and allocation of C, N, P, and NSCs. Principal component analysis (PCA) ordinated samples along PC-1 (44.2%) and PC-2 (24.4%), cumulatively explaining 68.6% of variance, corroborating development- and organ-dependent divergence. These data elucidated the intricate regulatory dynamics of nutrient contents among the three parts during the flower development of C. maxima, providing a robust quantitative framework for targeted nutrient management strategies.

1. Introduction

Carbon (C) and nitrogen (N) can provide carbon skeletons, amino- and nucleic-acid backbones, and phosphorus (P) is required for nucleic acids, ATP, and membrane lipids [1,2]. Their absolute contents and relative proportions respond plastically to genotype, ontogeny, and environmental conditions (temperature, rainfall, soil nutrients, etc.), which drive plant architecture, metabolism, and reproduction. C, N, and P stoichiometry can govern resource-acquisition strategies, growth rates, and ecosystem productivity [3,4]. During flower development, they are tightly coupled to dynamic re-allocation of C, N, and P among floral organs and to the concomitant remobilization of non-structural carbohydrates (NSCs) [5,6]. Recent investigations in Hibiscus rosa-sinensis, Camellia sinensis, Juglans sigillata, Michelia maudiae ‘Rubicunda’, and Houpoea officinalis flowers pronounced stage-dependent shifts in C:N:P ratios. These changes are more tightly correlated with developmental stages than those of organs [5,7,8,9]. Moreover, the C:N:P stoichiometric ratios are tightly coupled to the dynamics of NSC accumulation and partitioning, thereby exerting decisive control during the floral development [8,9]. These studies implicated nutrients’ stoichiometric flexibility as an internal clock that synchronizes floral organ expansion, anther dehiscence, nectar secretion, and post-anthesis senescence [10,11].
NSCs, including fructose, glucose, sucrose, and starch, serve as the primary source of energy and carbon skeletons for plant metabolism and growth [12,13]. Beyond energetic roles, NSCs function as osmotic regulators and signaling molecules and modulate gene expression, hormone crosstalk, and developmental transitions in plants [14,15]. Studies have demonstrated that flower formation is highly dependent on the metabolism and availability of NSCs in flowering plants [16,17]. Carbohydrates drive cell division, expansion, and differentiation; provide C skeletons for the biosynthesis of secondary metabolites; and create the osmotic gradients necessary for petal expansion [8,12,18]. In Rosa hybrida petals, glucose and fructose levels rise dramatically during the opening phase, comprising up to 50% of the final dry mass and lowering osmotic potential [19]. Similar patterns of glucose and fructose content have been observed in various species during flower development, including Asiatic lily, Michelia maudiae ‘Rubicunda’, and Houpoea officinalis. In these species, stage-specific fluctuations in hexose levels are closely associated with inflorescence differentiation, pigment deposition, and the accumulation of secondary metabolites [8,9,20]. In woody perennials, starch reserves act as a buffer to reconcile the asynchronous supply and demand of carbohydrates. These reserves are remobilized to support flowering when the current photosynthate is insufficient [21]. Quantitative analysis of pistillate tissues at the time of pollination indicates that starch and soluble carbohydrates are strong predictors of subsequent fruit set and seed viability [7]. Collectively, these findings highlighted that the partitioning, interconversion, and utilization of NSCs must be precisely coordinated to meet the dynamically changing energy and C requirements throughout the entire process of flower development.
Flowers are the reproductive epicenters of angiosperms, driving propagation, genetic diversification, and evolutionary progress [19,22]. Structurally, they are reservoirs of carbohydrates, phenolic acids, flavonoids, mineral elements, and pigments, which support organogenesis, color development, and stress tolerance [19]. Flower ontogeny proceeds through tightly regulated phases: bud initiation, floral organ differentiation, anthesis, and senescence. A unified gene-signaling network controls the timing and progression of these stages [23]. This network integrates endogenous signals, including specifically phytohormone levels, carbohydrate status, transcription-factor activity, and external environmental signals, namely temperature, photoperiod, and water availability, ensuring that each developmental transition is synchronized with both internal physiology and external conditions [24,25]. Throughout these developmental stages, significant changes in biomass, morphometrics, coloration, mineral and NSC allocation, and secondary metabolites have been documented in Michelia maudiae ‘Rubicunda,’ Houpoea officinalis Zingiber mioga, and Rosa damascena [8,9,19,26]. Understanding their temporal distribution during flower development is imperative for defining nutrient-use efficiency and optimizing fertilization practices [1,25,27]. Thus, a mechanistic understanding of these processes enables growers to adjust cultural practices, thereby extending post-harvest longevity and enhancing the ornamental and commercial quality of these flowers.
Citrus maxima (Burm.) Merr. (C. maxima), commonly referred to as pomelo or “You-zi” in China, is an evergreen fruit tree that has been cultivated for over 3 000 years. It is now the world’s most widely planted and economically important horticultural plant [28]. Pomelo is highly valued for its large, crisp, mildly acidic fruit and long post-harvest life, and is predominantly grown across subtropical and tropical Asia, which is the largest producer in terms of both harvested area and production volume [29]. The fruit is a rich source of sugars, organic acids, vitamin C, flavonoids, carotenoids, coumarins, and dietary fiber. These components endow the fruit with antioxidant, anti-inflammatory, hypoglycemic, and hypolipidemic properties [30,31]. Clinical and animal studies have consistently associated these bioactives with reducing risks of cardiovascular disease, type-2 diabetes, renal calculi, osteoporosis, and certain cancers [32]. Despite the extensive literature on pomelo fruit, relatively little attention has been given to pomelo flowers. C. maxima produces globose flowers arranged in terminal panicles, with annual anthesis occurring from late March to early April, accompanied by a pronounced floral fragrance [33]. Traditionally in China, C. maxima flowers are used to make fragrant tea drinks or are incorporated into cakes, herbal drinks, and casseroles. Recent analyses have revealed that C. maxima flowers contain substantial concentrations of phenolics, essential oils, vitamins, amino acids, and mineral elements with potent antioxidant and radical-scavenging activities [34]. Studies on C. maxima flowers have been extensively conducted within the food science domain, generating comprehensive datasets on their phytochemical composition, bioactivity, and safety profiles. These efforts are designed to attract both academic investigators and industry stakeholders [33]. Recently, an increasing number of researchers have paid attention to the dynamic changes in C, N, P, and element composition during flower development in Rosa damascena, Michelia maudiae ‘Rubicunda’, and Houpoea officinalis plants [8,9,19]. However, detailed analysis of the spatiotemporal dynamics of C, N, P, and NSC partitioning among the discrete floral organs of C. maxima throughout development remains notably scarce. Herein, the goals of this study were to illustrate the variations of morphometric traits, C:N:P stoichiometry, and NSC contents in pistils, stamens, and petals of C. maxima flowers at three phenophases (BBCH 54, BBCH59, and BBCH61). The present findings may provide critical insights into the developmental dynamics of C:N:P stoichiometry, together with NSC fluxes, across the discrete floral organs of C. maxima. This information also offered evidence-based insights for flowering management protocols, particularly precision fertilization strategies across the three discrete phenophases.

2. Materials and Methods

2.1. Study Site

The study site is located in Sichuan Agricultural University, District Wenjiang, Chengdu, China, and it is a flat alluvial plain with elevations ranging from 511.3 to 647.4 m above sea level. The site has a typical subtropical humid monsoon climate, with an average monthly temperature of 16.4 °C and a daily temperature range of 13–17 °C. The highest average temperatures occur in July, at 25.6 °C, while the lowest average temperature is in January, at 5.5 °C. The annual total precipitation is 985.1 mm, primarily concentrated in the summer months, accompanied by an average relative humidity of 81–84%. Solar radiation is moderate, with an annual sunshine duration of 1 104.5 h. The weather data were obtained from the China Meteorological Administration.

2.2. Flower Collection and Measurements

Five uniformly cultivated, 10-year-old C. maxima trees were meticulously selected and tagged for floral sampling. For each individual tree, the onset and cessation of anthesis were meticulously recorded daily. Observations conducted in 2024 indicated that the flowering period of C. maxima spans about 40 days, extending from early March to mid-April. The C. maxima flower consists of a pistil, stamens, and five petals. Development was classified according to the Biologische Bundesanstalt, Bundessortenamt und Chemische Industrie (BBCH) scale into three phenophases [35,36], including young bud stage (BBCH 54), first bloom stage (BBCH 59), and full bloom stage (BBCH 61). Fresh flowers were harvested from 09:00 to 11:00 h. Twenty flowers per phenophase were collected from each tree (n = 60 per stage). Ten flowers were randomly subsampled to determine morphometric indices, fresh mass (FM), dry mass (DM), and relative water content (RWC). After photographic documentation, each flower was dissected into pistil, stamens, and petals (Figure 1). Three parts were oven-dried at 65 °C for 24 h to constant mass, reweighed, and pulverized to pass through a 0.15 mm mesh prior to further analyses.

2.3. Determinations of C, N, and P Contents

Approximately 0.5 g of finely ground sample was precisely weighed into polytetrafluoroethylene (PTFE, Teflon®, Houston, TX, USA) digestion vessels. Subsequently, 10 mL concentrated HNO3 and 2 mL of 30% (v/v) H2O2 were added to the vessels. The mixtures were then subjected to complete microwave-assisted digestion. After cooling to room temperature, the digest was transferred to a 25 mL volumetric flask and diluted to the volume with ultrapure (18.2 MΩ·cm) Milli-Q deionized water. C content was quantified by wet dichromate oxidation (H2SO4/K2Cr2O7), followed by titration with FeSO4. N content was determined using the Kjeldahl method. P content was measured using the molybdenum-antimony colorimetric procedure [5,9]. C, N, and P contents were expressed as mg per g dry mass (mg/g DM). C:N, N:P, and C:P ratios were calculated on a mass basis from the corresponding concentrations. Element accumulation (mg/per flower) in each part of C. maxima flower was calculated as the product of organ-specific elemental concentration (mg/g DM) and the corresponding dry mass (g). The proportional allocation of elements among reproductive organs was then expressed as Allocation ratio (%) = [Element accumulation in pistil, stamen, or petal (mg)/∑Element accumulation across all organs (mg)] ×100.

2.4. Determinations of NSC Contents

NSC contents were quantified with the anthrone–H2SO4 colorimetric protocol [8,9]. Approximately 0.2 g of material was extracted three times with 10 mL of 80% (v/v) ethanol. The suspensions were heated in a boiling-water bath for 30 min and then centrifuged at 5000× g for 10 min. The pooled supernatants were retained for the quantification of glucose, fructose, and sucrose. For glucose analysis, 0.1 mL of extract was reacted with 5 mL anthrone (0.2% w/v anthrone in 80% H2SO4) at 90 °C for 15 min, and absorbance was recorded at 620 nm after cooling to room temperature. For fructose analysis, identical volumes of extract and anthrone reagent were incubated at 25 °C for 90 min, and absorbance was recorded at 620 nm. For sucrose analysis, 0.1 mL of extract was hydrolyzed with 0.1 mL of 7.6 M KOH at 100 °C for 10 min. After cooling, 5 mL of anthrone was added, and the mixtures were heated at 90 °C for 15 min, and absorbance was then measured at 620 nm. For starch analysis, the extracted residues were suspended in 10 mL of 30% (v/v) perchloric acid and incubated at 80 °C for 10 min. The slurry was held overnight at 4 °C, then centrifuged at 4000× g for 10 min at 4 °C. The supernatants were collected and diluted to 50 mL with ultrapure water. Starch content was determined using the above anthrone procedure. The contents of glucose, fructose, sucrose, and starch were calculated from standard curves (Table S1) and expressed as mg g−1 dry mass (mg g−1 DM). NSC accumulation (mg/per flower) in each part of C. maxima flower was calculated as the product of organ-specific NSC concentration (mg g−1 DM) and the corresponding dry mass (g). The proportional allocation of NSCs among reproductive organs was calculated as follows: Allocation ratio (%) = [NSC accumulation in pistil, stamen, or petal (mg)/∑NSC accumulation across all organs (mg)] ×100.

2.5. Statistical Analysis

All data are presented as mean ± standard deviation (SD). Differences among phenophases and flower parts were assessed by one-way analysis of variance (ANOVA), followed by Duncan’s multiple-range test at p ≤ 0.05. Regression and Pearson correlation analyses were executed in SPSS 22.0 (SPSS Inc., Chicago, IL, USA). Additional data handling was performed in SPSS 22.0 and Microsoft Excel 2021 (Microsoft Corp., Redmond, WA, USA). Multivariate exploration of the dataset was conducted by principal component analysis (PCA) using the averaged values of each measured parameter across floral phenophases. Statistical significance was accepted at p ≤ 0.05 for all tests. Figures were generated, and PCA was executed in Origin 2021 (OriginLab Corp., Northampton, MA, USA).

3. Results

3.1. Variations of Morphological Indicators and Biomass

Morphometric indices and biomass allocation across three parts of C. maxima flower were monitored at three distinct phenophases, as summarized in Table 1 and Table S2. Pistil length (PL), stamen length (SL), petal length (PL), and petal width (PW) exhibited a progressive increase up to anthesis (BBCH61), reaching their respective maxima of 22.74 ± 0.37 mm, 19.38 ± 0.25 mm, 27.78 ± 0.38 mm, and 11.28 ± 0.97 mm (Table S1). The FM of pistil, stamen, and petal rose monotonically from BBCH54 to BBCH61, with values ranging from 0.34 ± 0.02 to 0.71 ± 0.10 g, 0.25 ± 0.02 to 0.43 ± 0.04 g, and 0.50 ± 0.09 to 1.27 ± 0.11 g, respectively (Table 1). The DM followed a similar trend, peaking at 0.19 ± 0.02 g, 0.08 ± 0.01 g, and 0.19 ± 0.02 g, respectively. The RWC in pistil and stamen declined steadily from BBCH54 to BBCH61, reaching 72.04% and 81.31%, respectively. In contrast, petal RWC peaked at BBCH59 (86.63%) before a modest decrease at BBCH61.

3.2. Variations in C, N, and P Contents

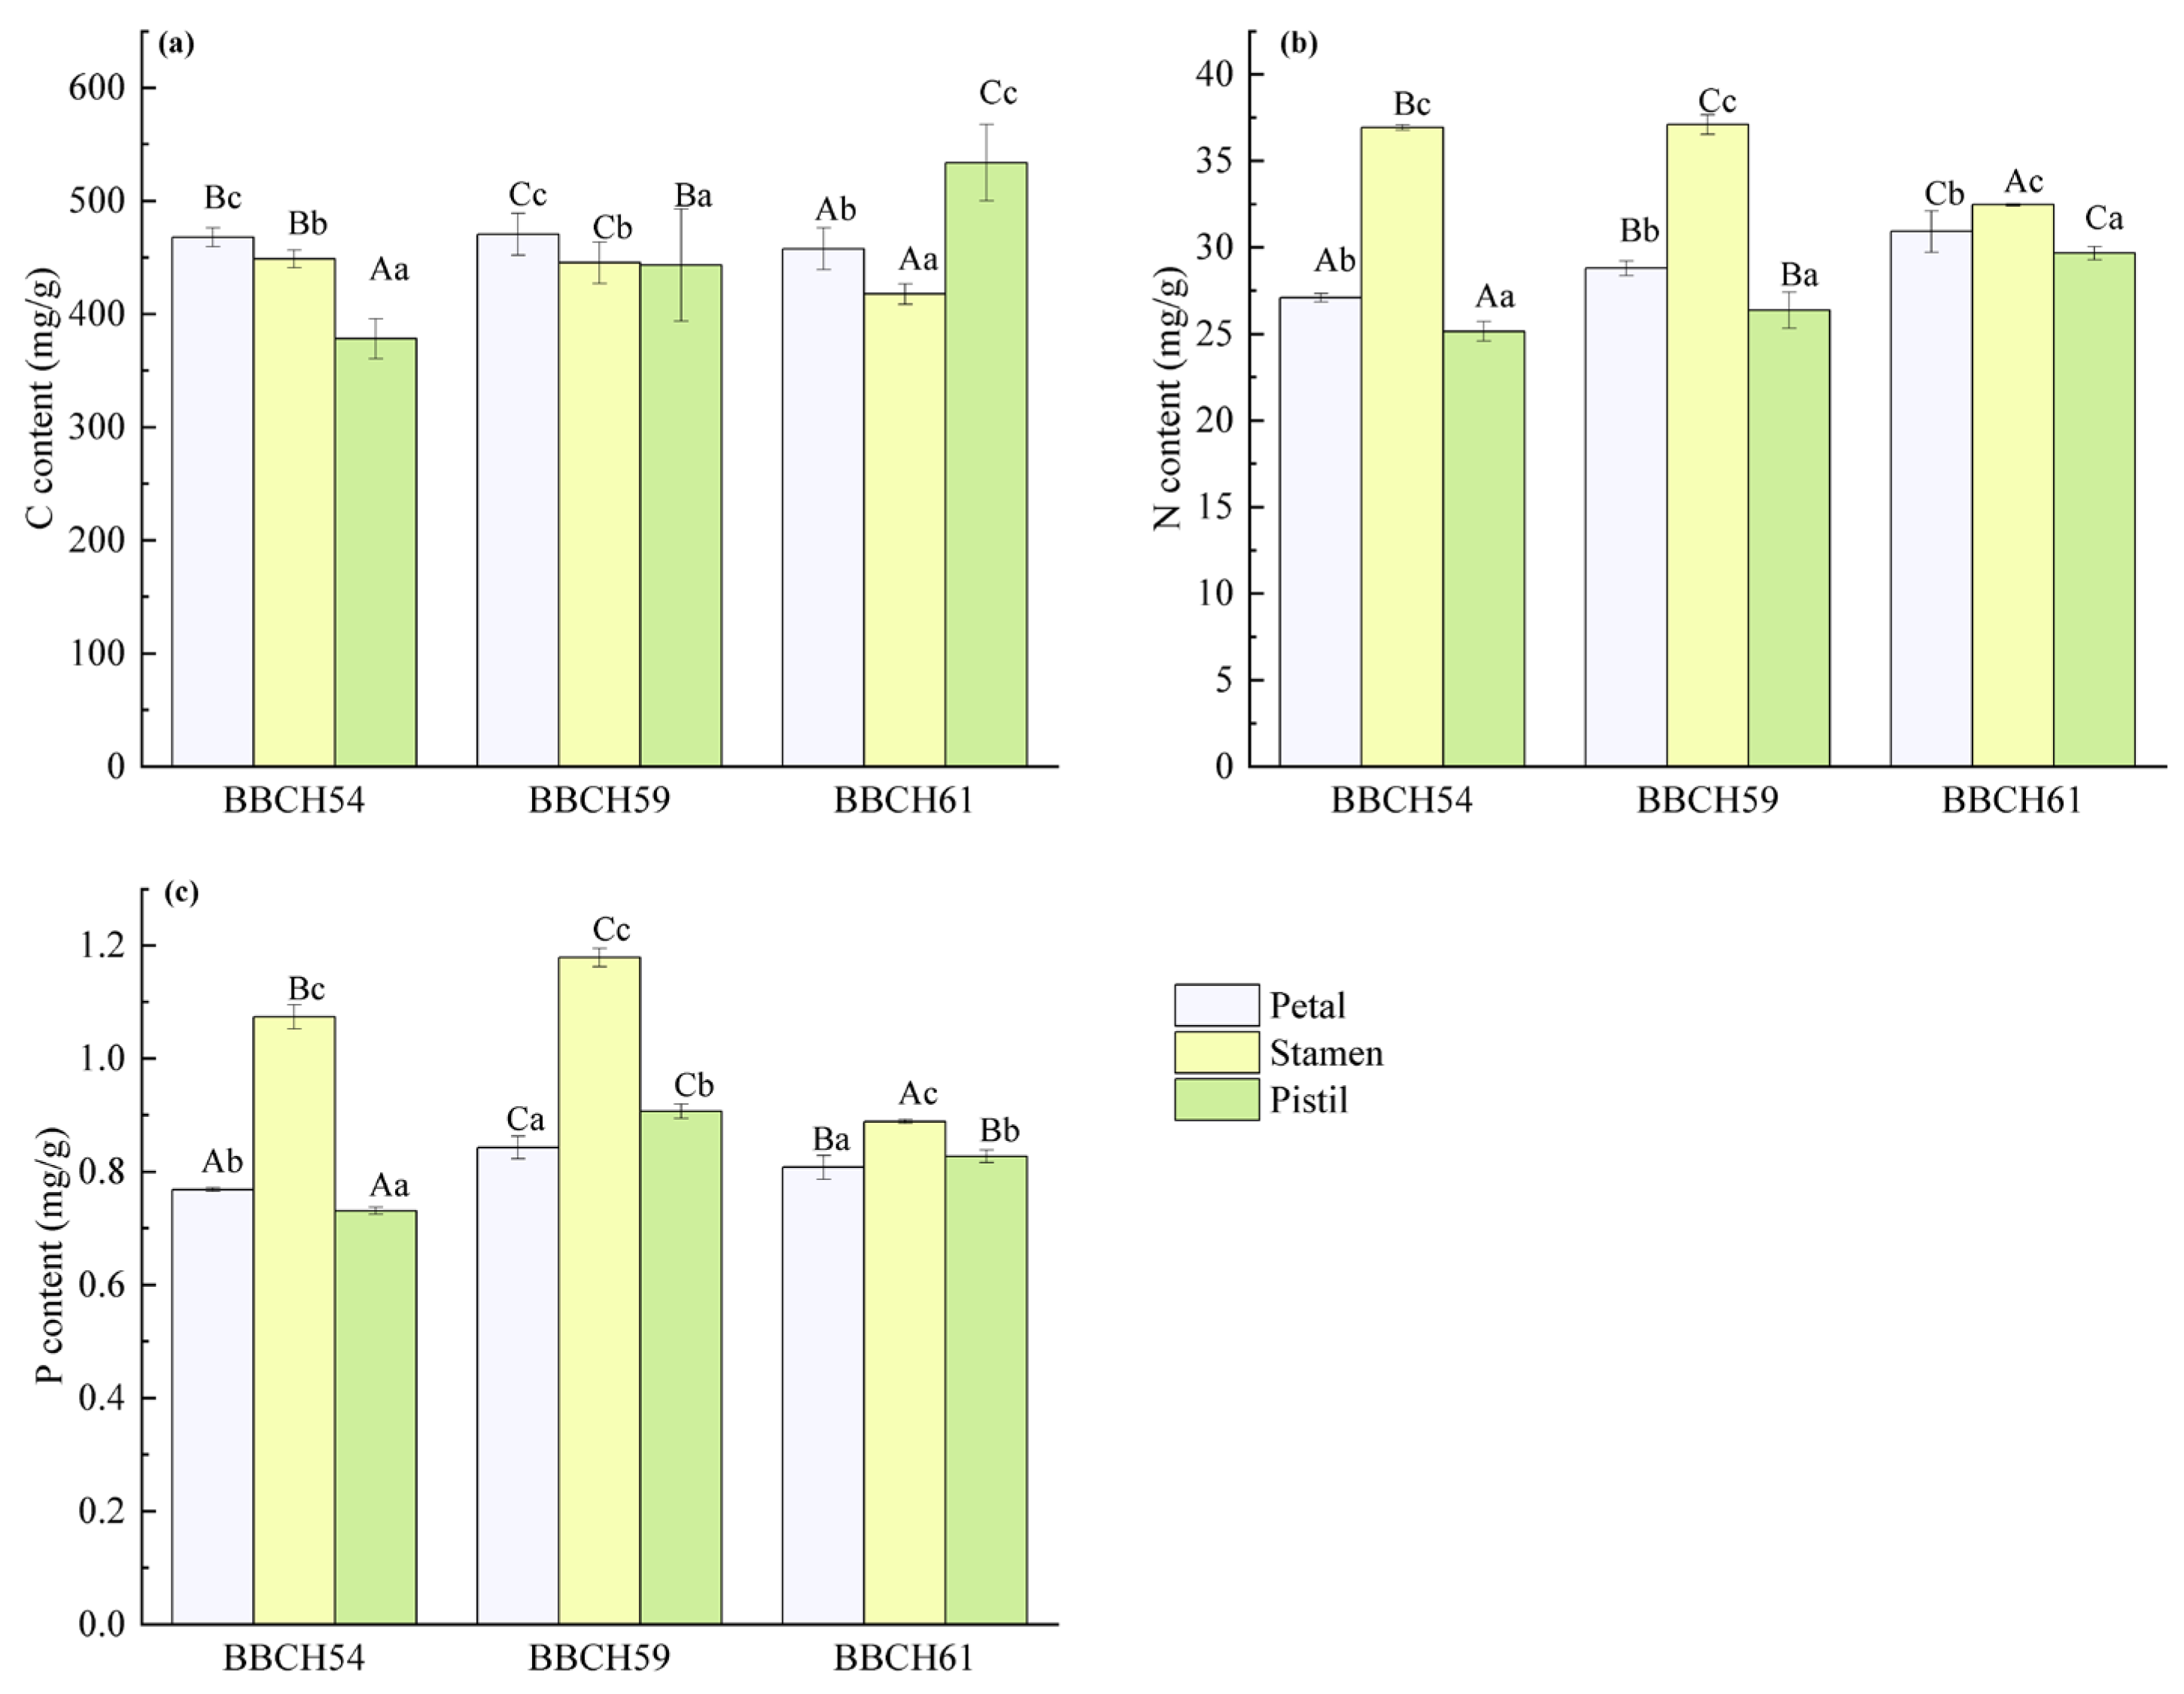
Figure 2 illustrates that both phenophases and floral parts significantly influence the C, N, and P contents in C. maxima flowers. In pistils and stamens, C contents ranged from 378.0 to 533.6 mg g−1 DM and 417.5 to 448.7 mg g−1 DM, respectively, with maxima recorded at BBCH61 (pistil) and BBCH54 (stamen). In contrast, C contents in the petals were relatively stable, ranging narrowly from 457.3 to 470.3 mg g−1 DM, peaking at BBCH59 (Figure 2a). As exhibited in Figure 2b, stamens exhibited the highest N concentrations (32.5–37.1 mg g−1 DM), followed by petals (27.1–30.9 mg g−1 DM) and pistils (25.1–29.7 mg g−1 DM). The maximal N contents were observed at BBCH57 (stamen), BBCH61 (petal), and BBCH61 (pistil), respectively. Figure 2c revealed that P contents are the highest in the stamens (0.889–1.18 mg g−1 DM), intermediate in the petals (0.768–0.843 mg g−1 DM), and the lowest in pistils (0.731–0.907 mg g−1 DM). Across three floral parts, P contents increased from BBCH54 to BBCH57 and then declined at BBCH61. Collectively, these findings indicated that C, N, and P contents in C. maxima flowers are closely associated with both developmental progression and organs.

3.3. Variations in C, N, and P Accumulation and Allocation Proportion

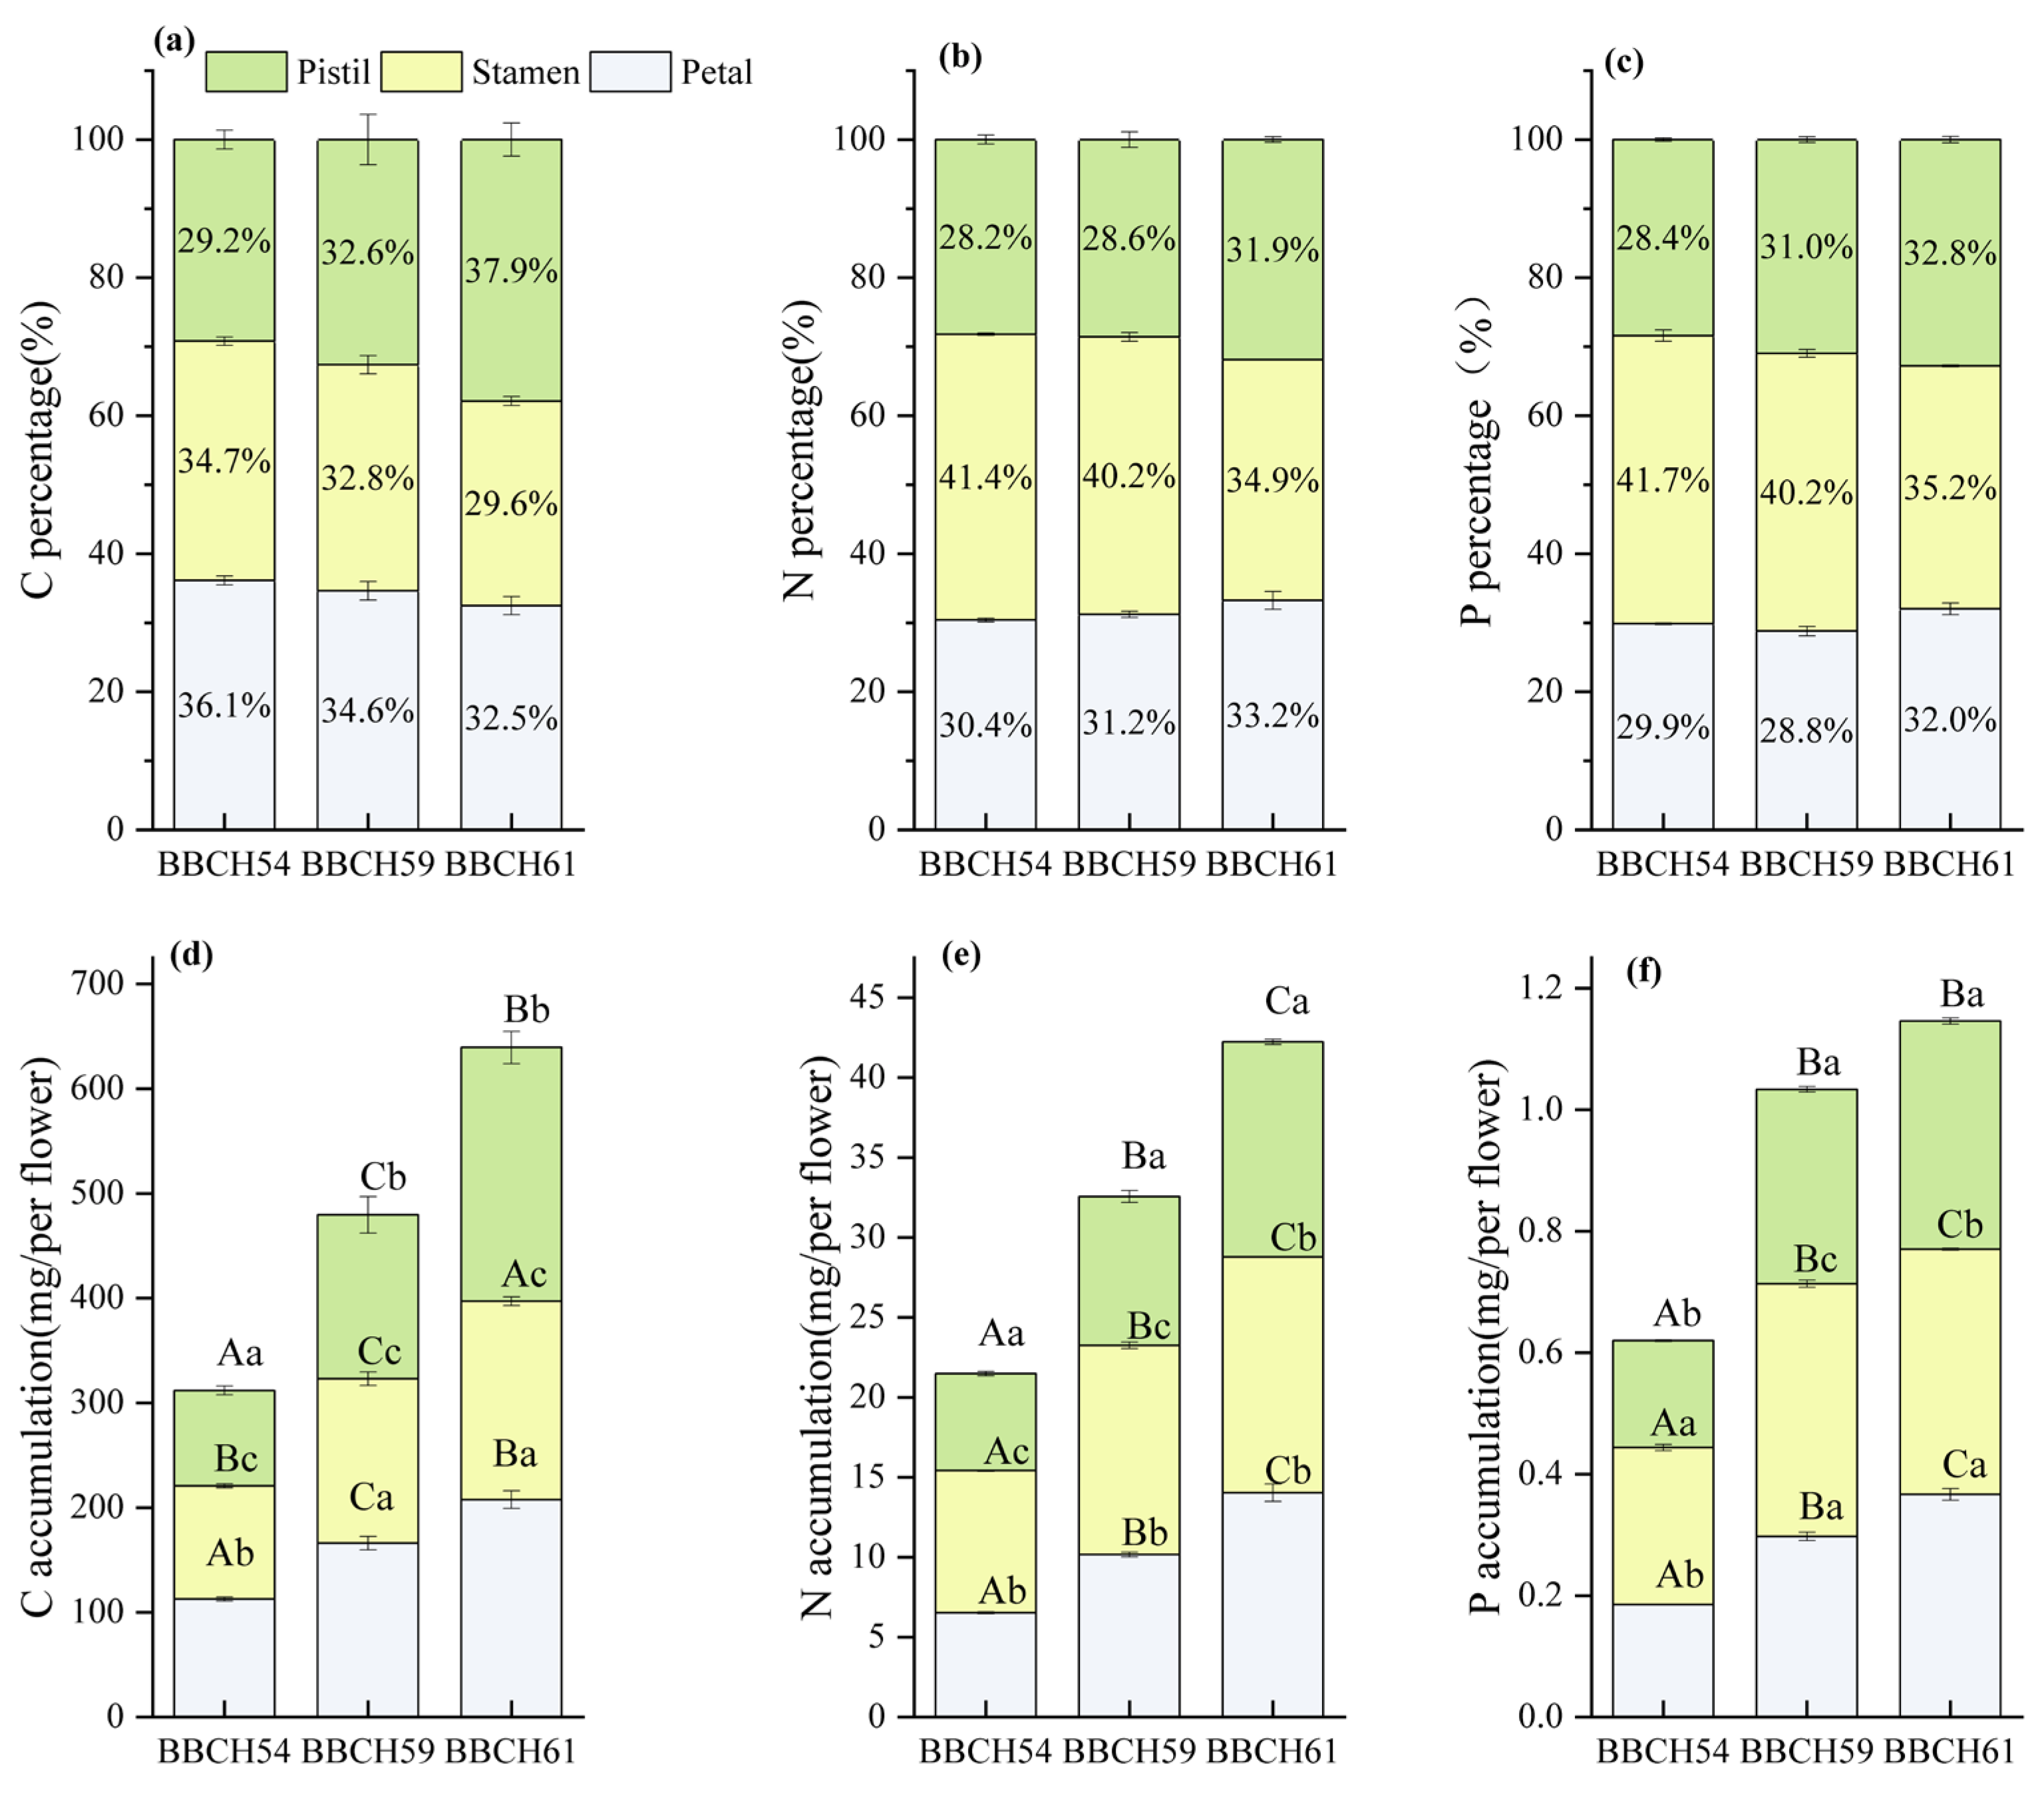
Figure 3 depicts the dynamic patterns of C, N, and P allocation fractions and accumulation within the pistil, stamens, and petals of C. maxima flowers across three phenophases (BBCH54, BBCH57, and BBCH61). Figure 3a shows that the proportion of C allocated to the pistil increased progressively from 29.2% (BBCH54) to 37.9% (BBCH61). Conversely, relative C allocation to stamens declined to 29.6%, while petal C allocation decreased to 32.5% by BBCH61. Figure 3b shows that N allocation in the pistil rose steadily from 28.2% to 31.9%, and N allocation in the petal increased from 30.4% to 33.2%. In contrast, N allocation in the stamen dropped significantly, from 41.4% (BBCH54) to 34.9% (BBCH61). In Figure 3c, P allocation in the pistil exhibits a pronounced increase, from 28.4% (BBCH54) to 32.8% (BBCH61). P allocation in the stamen declined from 41.7% to 35.2%. P allocation in the petal displayed a transient decrease at BBCH57 (29.9%) before recovering to 32.0% at BBCH61. As shown in Figure 3d–f, irrespective of the floral parts, C, N, and P accumulation in the flower escalated continuously with flower development, showing highly significant differences among phenophases. C, N, and P contents in whole flowers expanded from 311.8 to 639.4 mg/per flower, 21.5 to 42.2 mg/per flower, and 0.62 to 1.15 mg/per flower, respectively, underscoring pronounced stage-dependent nutrient accumulation.

3.4. Variations in C, N, and P Stoichiometry

Figure 4 demonstrates that both phenophases and floral parts significantly influence the stoichiometric ratios of C, N, and P in C. maxima flowers. Across the three phenophases, C:N values ranged from 14.8 to 17.3 in the petals, 12.0 to 12.9 in the stamens, and 15.0 to 18.0 in pistils, with maxima recorded at BBCH54, BBCH61, and BBCH61, respectively (Figure 4a). Pistils consistently exhibited the highest C:N ratios relative to those of the stamens and petals. C:P ratios varied markedly among stages and organs: 558.7–608.8 (petals), 489.0–645.7 (pistils), and 377.9–469.8 (stamens). Petals displayed the highest C:P values at each phenophase (Figure 4b). N:P ratios ranged from 34.1 to 38.3 (petals), 29.1 to 35.9 (pistils), and 31.5 to 36.5 (stamens) across three phenophases (Figure 4c), peaking at BBCH61 (petals and pistils) and BBCH54 (stamens). Collectively, these findings indicate that the C:N, C:P, and N:P ratios in C. maxima flowers are dynamically regulated by development stage and organ-specific nutrient demands.

3.5. Non-Structural Sugars (NSC) Contents

As depicted in Figure 5, the spatiotemporal distribution of NSCs in the pistil, stamens, and petals of C. maxima flowers exhibited significant divergence across the three phenophases. In Figure 5a, glucose fluctuated from 163.3 mg g−1 (BBCH 61) to 184.6 mg g−1 (BBCH 59) in the stamens, 136.9 mg g−1 (BBCH 61) to 214.3 mg g−1 (BBCH 54) in the petals, and 293.5 mg g−1 (BBCH 61) to 375.8 mg g−1 (BBCH 59) in the pistil. Figure 5b shows that fructose content reached maxima of 19.40 mg g−1 (stamens, BBCH 59), 29.82 mg g−1 (petals, BBCH 54), and 56.30 mg g−1 (pistil, BBCH 54). Figure 5c shows that sucrose contents ranged from 92.1 mg g−1 (BBCH 54) to 139.5 mg g−1 (BBCH 59) in the stamens, 68.6 mg g−1 (BBCH 61) to 114.8 mg g−1 (BBCH 59) in the petals, and 116.2 mg g−1 (BBCH 54) to 68.9 mg g−1 (BBCH 61) in the pistil. In Figure 5d, starch contents peaked at 33.2 mg g−1 (stamens, BBCH 54), 30.4 mg g−1 (pistil, BBCH 61), and 37.2 mg g−1 (petals, BBCH 59). These patterns indicate a dynamic interplay of NSC partitioning, implying coordinated inter-conversion and translocation of soluble sugars among floral parts during C. maxima flower development.

3.6. NSC Accumulation and Allocation Proportion

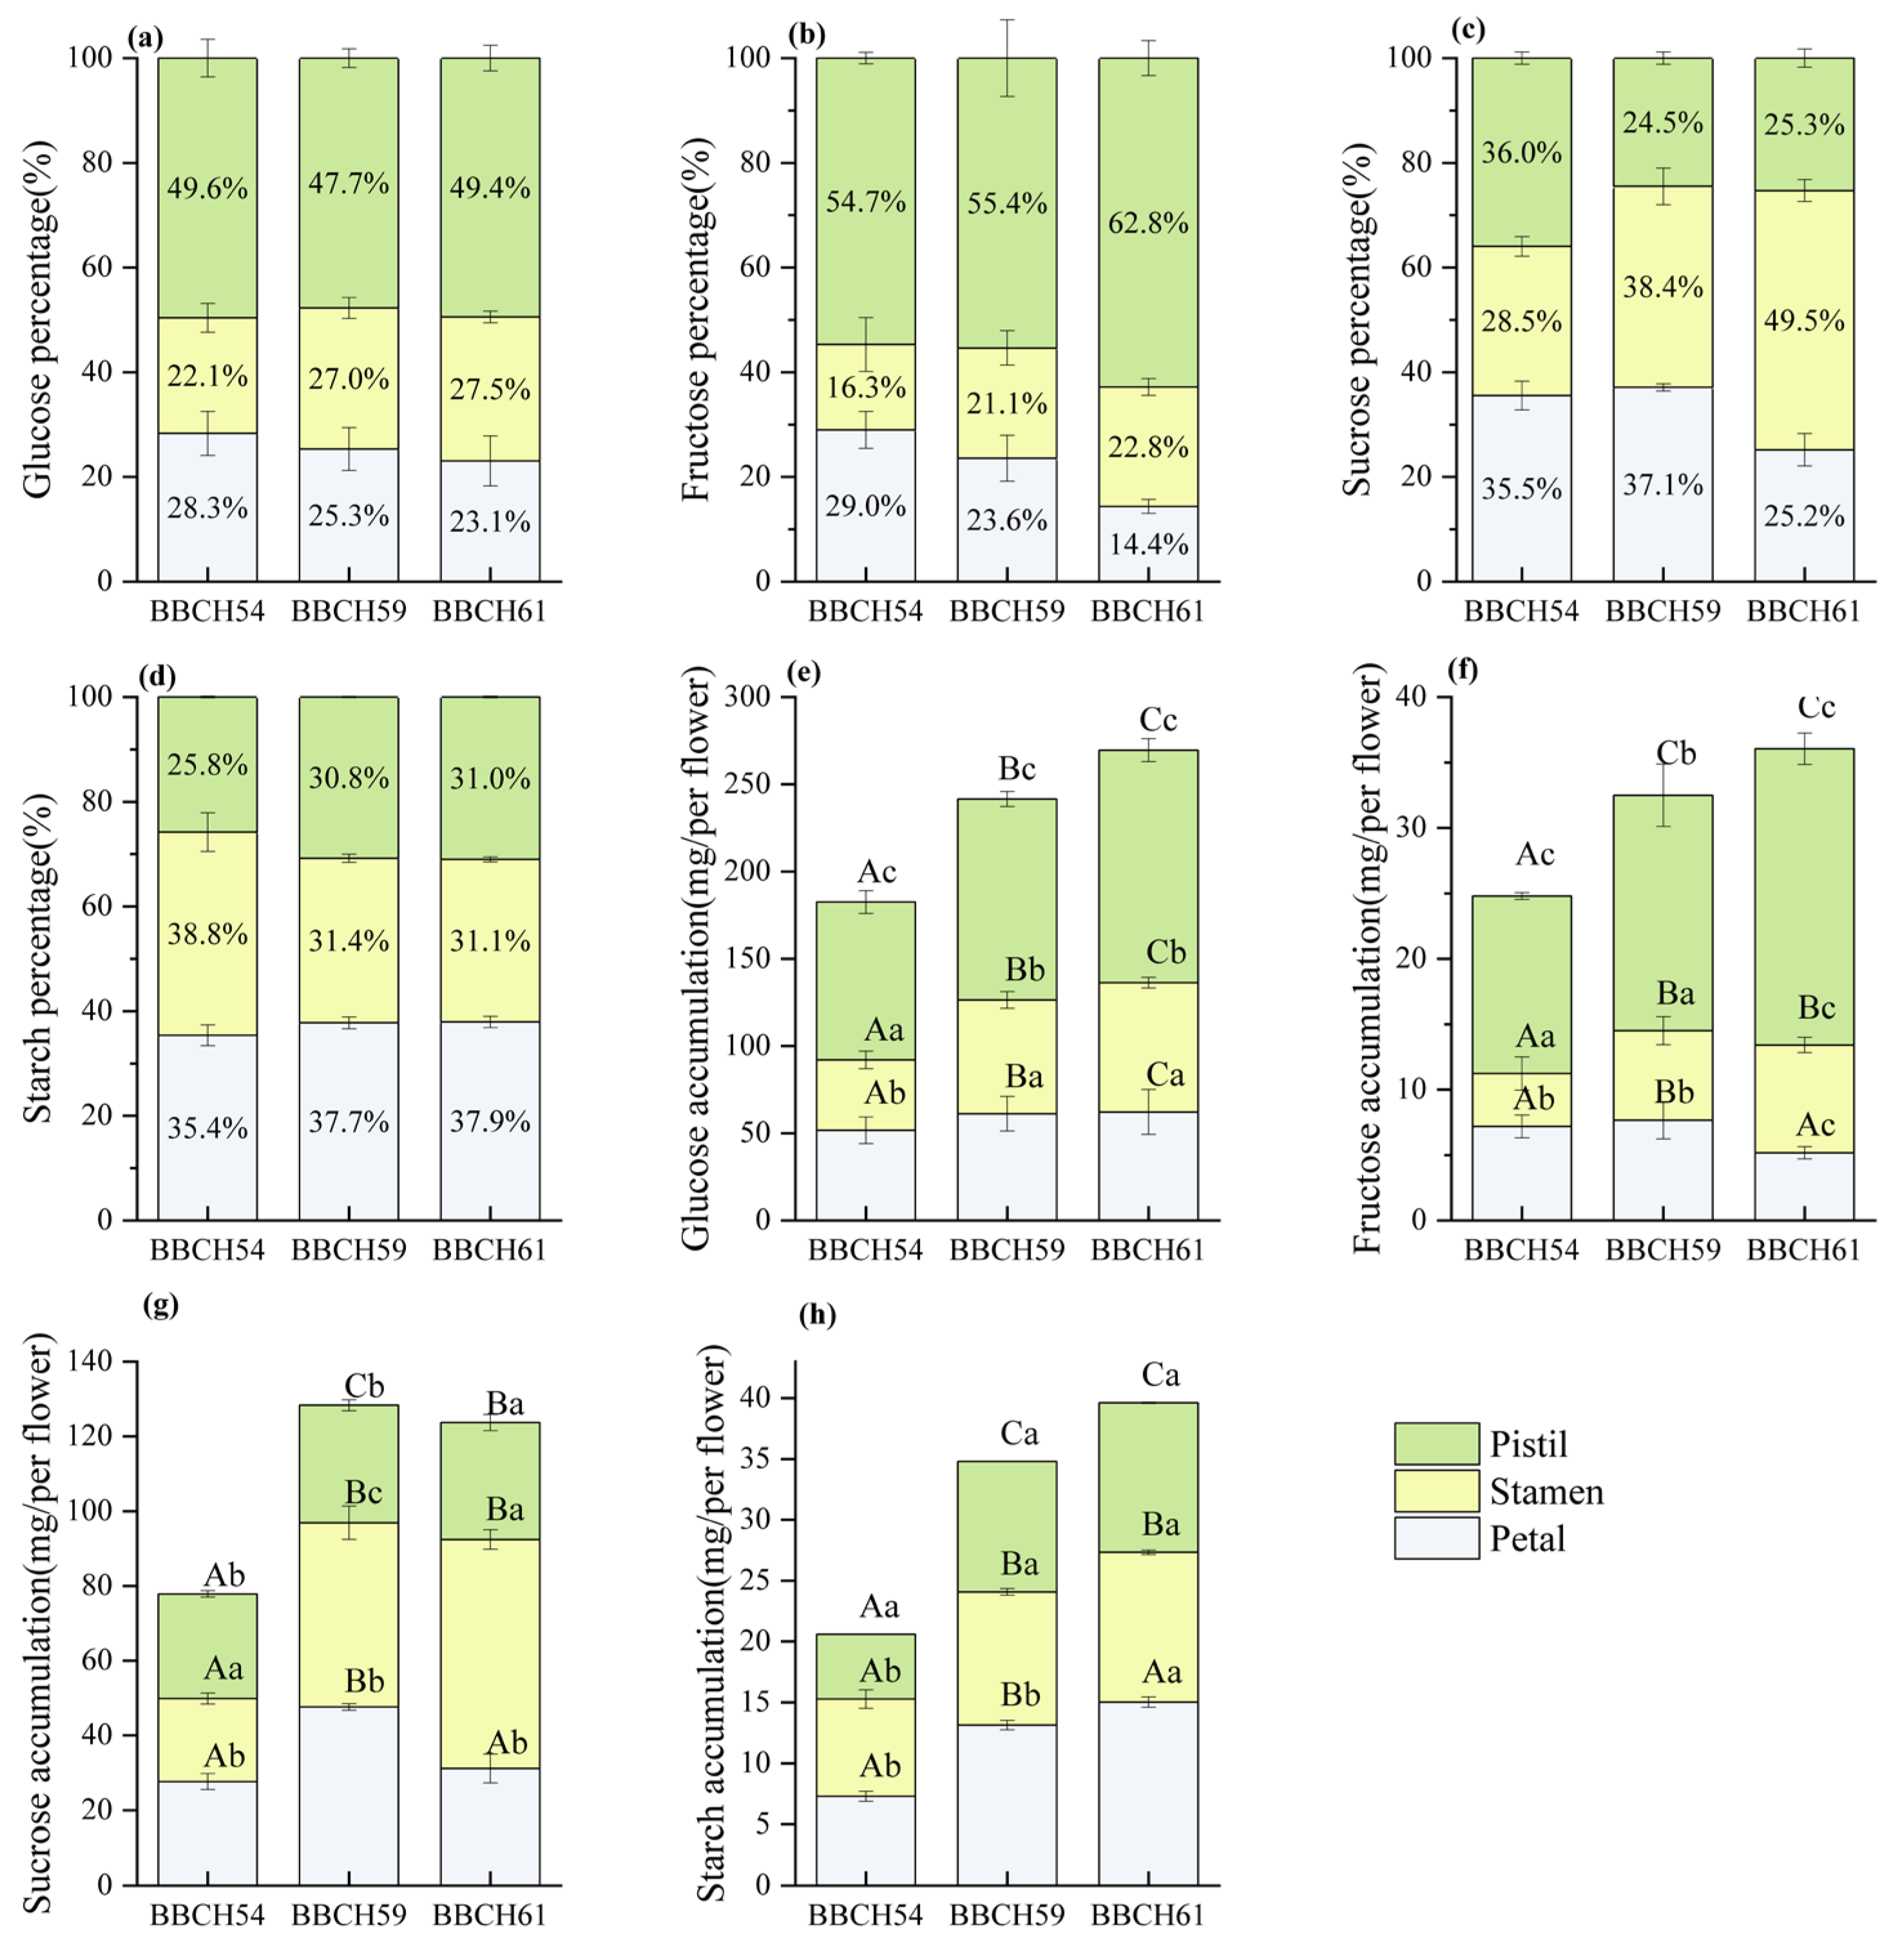
Figure 6 shows the development-dependent re-partitioning of NSCs within C. maxima flowers across the three phenophases. As shown in Figure 6a, stamens and petals received 22.1–27.5% and 23.1–28.3% of total glucose, respectively, with maxima at BBCH 61 and BBCH 54. The pistil retained a stable share (about 49%), indicating constitutive allocation. For fructose, allocation in the stamens rose progressively from 16.3% (BBCH 54) to 22.8% (BBCH 61), whereas petals exhibited a continuous decline from 29.0% to 14.4%. The pistil was the predominant sink for fructose partitioning, with a peak allocation of 62.8% at BBCH 61, which was significantly higher than 54.7% and 55.4% observed at BBCH 54 and BBCH 59, respectively (Figure 6b). As shown in Figure 6c, the sucrose allocation ratios of pistil, stamen, and petal fluctuated from 24.5 to 36.0%, 28.5 to 49.5%, and 25.2 to 37.1%, respectively, with maxima at BBCH 54, BBCH 61, and BBCH 59. As shown in Figure 6d, the starch allocation ratios in the pistil, stamen, and petal exhibited minimal change trends, ranging from 25.8% to 31.0%, 31.1% to 38.8%, and 35.4% to 37.9% respectively, with maxima appearing at BBCH54/BBCH59, BBCH54, and BBCH59/BBCH61, respectively. Total glucose, fructose, and starch increased monotonically from 182.5 to 269.5 mg g−1 (Figure 6e), 24.8 to 36.0 mg g−1 (Figure 6f), and 20.6 to 39.6 mg g−1 (Figure 6g), respectively. However, the accumulation of sucrose (128.3 mg/g, Figure 6h) in flowers at BBCH59 was significantly higher than that at BBCH54 and BBCH61.

3.7. Correlation Analysis

As shown in Figure 7a, correlation analysis showed the associations between C:N:P stoichiometric ratios and NSC content in the stamens, petals, and pistils of C. maxima flowers across three phenophases. Specifically, glucose exhibited strong positive correlations with C contents and C:N ratio (r ≈ 0.87), indicating that a high C availability coupled with nitrogen (N) limitation significantly promotes glucose accumulation. In contrast, N and P contents, as well as N:P and C:P ratios, showed pronounced negative correlations with fructose, sucrose, and starch (r ≈ −0.6 to −0.8), suggesting that N and P sufficiency may inhibit synthesis or accelerate consumption of these NSCs. The negative impact of P is particularly notable, implying that P may constrain the interconversion between starch and soluble sugars by modulating phosphorylase activity. Collectively, C:N:P stoichiometry might act as a critical regulator of sugar metabolism, with a higher C:N ratio potentially enhancing glucose storage, while relative excesses of N and P may mitigate this process.
As shown in Figure 7b–d, PCA showed significant temporal dynamics and part-specific differences in tested indicators in C. maxima flowers across three phenophases. The PCA biplot delineated that the variables (C, N, P, NSC contents, and C:N:P ratios) were partitioned into four principal clusters. C content, C:N, C:P, and N:P ratios were positioned in the upper right quadrant (Figure 7b), signifying their positive correlation with development stages. Retaining the first three PCs, which collectively explained 82.4% of total inertia (PC1 = 44.2%, PC2 = 24.4%, PC3 = 13.8%), the ordination resolved discrete organ-specific chemotypes. Petals were positioned along positive PC1, reflecting a C-dominant signature enriched in glucose and fructose, coupled with elevated C:N and C:P ratios. Pistils were positioned in the quadrant defined by positive PC1 and negative PC2, indicating an intermediate C status and a significant N:P-driven reallocation toward starch accumulation. In contrast, stamens were projected onto the quadrant defined by negative PC1 and PC2, indicating a stoichiometric profile characterized by high N and P content, but low C content. As shown in Table S3, loading trajectories revealed a hierarchical and three-tier control of sugar–starch partitioning along the C:N:P stoichiometric gradient. Firstly, high positive loadings for C:N (0.423), C:P (0.391), glucose (0.327), and fructose (0.362), juxtaposed with negative loadings for N (−0.424) and P (−0.403), indicated a C surplus that may promote the accumulation of soluble sugars in C. maxima flower. Second, the coordinated positive loadings of N:P (0.427) and starch (0.331), contrasted with negative loadings for glucose (−0.360) and fructose (−0.351), suggested a stoichiometrically regulated transformation of soluble sugars into starch. Moreover, the antagonism between carbon (0.464) and N:P (−0.582) promoted overflow-induced starch sequestration under conditions of extreme stoichiometric imbalance. These findings underscored that C, N, P contents, C:N:P stoichiometric ratios, and NSCs in the three parts of C. maxima flowers were highly correlated with phenophases.

4. Discussion

Flower development constitutes an extremely intricate and multifaceted process, encompassing a wide range of physiological and biochemical alterations in plants [19,25]. Elucidating the diverse processes that maintain flower development is of paramount importance for enhancing the visual quality and longevity of flowers. C. maxima, a highly regarded ornamental and economically significant citrus species, exhibited intricate flower development processes that are intricately linked to its morphological traits and underlying biochemical dynamics [30,33]. Understanding the complex interrelationships among flower development, morphological traits, and C, N, and P dynamics is crucial for optimizing cultivation practices and enhancing the ornamental value of this plant. The present study documented the variations in morphometric traits, C:N:P stoichiometry, and NSC contents in the pistils, stamens, and petals of C. maxima flowers across three phenophases. Correlation analysis and PCA revealed significant temporal dynamics and organ-specific differences in the tested parameters across the three phenophases (Figure 7 and Table S3). This study provides crucial insights into the developmental dynamics of morphological parameters and C:N:P stoichiometry, along with NSC fluxes, across the discrete floral organs of C. maxima. Variations in morphological parameters, C:N:P stoichiometry, and NSC contents of flowers have been reported in Styrax japonicus and other ornamental species during the process of flower development [8,9,19,37]. These findings not only facilitate a deeper understanding of the variations in nutritional composition in C. maxima flowers during flower development but also offer evidence-based insights for flowering management protocols, particularly precision fertilization strategies across the three discrete phenophases.
C, N, and P, along with their stoichiometric ratios, are pivotal to modulating a wide array of physiological and biochemical processes and exert a substantial influence on flower development. These elements serve as crucial indicators of the nutrient status of plants and their ability to sequester resources, thereby affecting the allocation of resources between vegetative and reproductive growth [2,9]. The intricate interplay among C, N, and P in floral tissues is a fundamental aspect of plant reproductive biology [3,4]. Extensive studies have documented the variability in C, N, and P contents during flower development in several species, such as Juglans sigillata, Cercis chinensis, and olive [5,7,24]. The transition from vegetative to reproductive growth is a critical juncture where the balance of these nutrients is particularly important [9]. An elevated C:N ratio is often indicative of a transition from vegetative growth, which requires significant N inputs, to reproductive growth, where C storage becomes the predominant process for flower bud differentiation. This shift is essential for the successful differentiation of flower buds and the subsequent development of flowers [7]. Yang et al. (2024) [9] showed that the C:P ratio in different floral parts of Houpoa officinalis increased progressively with flower development. This suggests that as flowers progress from bud stages to flowering, the relative availability of P decreases compared to C, potentially affecting the energy and nutrient balance essential for reproductive success. The present study demonstrated that the dynamics of C, N, and P in C. maxima flowers are closely linked to developmental progression and organs (Figure 2, Figure 3 and Figure 4). The variation in C, N, and P contents and stoichiometric ratios reflects the nutrient requirements and dynamic balances between development stages and floral parts, as demonstrated by the strong positive correlations with NSC contents (Figure 7a). These differential C, N, and P contents and allocation patterns observed in the pistils, stamens, and petals of C. maxima flowers have several direct and interrelated ramifications for flower development. One potential explanation is the progressive increase in absolute C, N, and P accumulation in the flower, thereby creating an increasingly larger metabolic sink (Figure 3d–f). Moreover, the fact that the share of C allocation to the stamen decreases while the share of C allocated to the pistil increases simultaneously (reaching 37.9% by BBCH61) suggests that the import of photoassimilates into the floral sinks speeds up, which occurs at the cost of maintaining the stamen. Another possible explanation is that by BBCH61, there is a steep decrease in the allocation of N (by 34.9%) and P (by 35.2%) to the stamen, while the shares of N and P in the pistil increase. This indicates the more energetically demanding processes of ovule development and seed set. In contrast, the stamens exhibit a decline in nutrient allocation, which may reflect a reduction in metabolic activity as the focus shifts to pistil development. The concept of metabolic sinks is particularly relevant in understanding these allocation patterns. As flowers develop, they become increasingly demanding metabolic sinks, attracting photoassimilates and nutrients from other parts of the plant [4,8,9]. Furthermore, the strong positive correlations between C, N, and P contents and NSC contents (Figure 7a) suggest that these elements play a crucial role in maintaining the energy balance within floral tissues. This interdependence highlights the importance of a balanced nutrient supply in supporting the energetic demands of flower development [22,23]. These findings highlighted that C, N, and P contents and their stoichiometric ratios are influenced by phenophases and floral parts, emphasizing the allocation and transport of these nutrients across compartments based on different physiological needs [38,39]. However, the molecular mechanisms that govern nutrient uptake, allocation, and transport during flower development in C. maxima still need to be elucidated.
NSCs serve as energy sources, osmotic regulators, and metabolic precursors, significantly contributing to flower bud differentiation and development. The deficiency of NSCs can have detrimental effects on flower development, leading to undersized petals or complete cessation of development [25,40,41]. In flowering plants, there are considerable variations in NSC content and type from floral bud development to blooming and senescence, which is accompanied by changes in color, morphological indices, and physiological and biochemical processes [12,16,19]. For example, in rose petals, the decrease in osmotic potential is primarily attributed to increased soluble carbohydrate content [42]. Numerous studies have shown that changes in NSC content are closely related to developmental stages and organ-specific requirements in flowers. In Houpoa officinalis, the concentrations of glucose, fructose, starch, and sucrose varied significantly across different floral parts (stamen, pistil, petal) and developmental stages [9]. Flower development is highly dependent on carbohydrate metabolism, as documented in species such as Rosa damascena, Dendrobium crumenatum, Borago officinalis, and Centaurea cyanus [19,22,43]. These reports highlight the role of NSCs in maintaining cellular turgor and facilitating processes such as petal expansion and scent emission. In our study, we observed gradual increases in soluble sugar and starch content across the three parts of C. maxima flowers (Figure 5). The accumulation and proportion patterns of NSCs varied significantly during the development process, and the allocation patterns among the three parts also showed significant differences (Figure 6). These variations may be due to several factors. One potential reason is that high petal glucose (28.3%, Figure 6e) and sucrose (37.1%, Figure 6g) levels, coupled with rising starch (35.4–37.9%, Figure 6h), generate the turgor and volatile precursors required for rapid corolla expansion and scent emission under variable light conditions, thereby maximizing pollinator encounter rates. Another potential reason is that a sharp rise in pistil fructose allocation (62.8%, Figure 6f) and continued starch accumulation in the pistil (30.4%, Figure 6h) create a buffered sink that sustains early endosperm proliferation even when current photosynthate is diverted to competing sinks. This may ensure that reproductive processes are not compromised by transient fluctuations in carbohydrate availability in C. maxima flowers. During Gladiolus flower development, total soluble sugars gradually increase, peaking after full bloom [23]. In Centaurea cyanus, glucose and fructose contents increase with flower development, while sucrose content does not show significant variability [22]. These changes in NSC contents and/or accumulation during flower development reflect the complex interplay between nutrient availability, developmental stage, and species-specific requirements. Moreover, highly significant correlations were observed between NSC variables and C:N:P stoichiometric variables in C. maxima flowers at three phenophases (Figure 7a). This is likely due to the dynamic balances of NSC storage, migration, conversion, and availability. These findings reveal a dynamic nutrient allocation trade-off between reproductive (pistils, stamens) and attractive (petals) parts, offering a comprehensive understanding of the NSC requirements and allocation patterns that underpin flower development of C. maxima.

5. Conclusions

In summary, the present work has demonstrated significant variations in C:N:P stoichiometry and NSC contents in C. maxima flowers, which are dependent on both the developmental stage and the floral parts. Elevated soluble-sugar contents seem to be essential for coordinating floral development, guaranteeing synchronized growth, differentiation, and development through optimized nutrient reallocation in C. maxima flowers. Correlation analysis and PCA further confirmed that nutrient stoichiometry and NSCs are closely associated with developmental stage and floral parts, highlighting the strong connection among phenophases, organ specificity, and nutrient dynamics. These findings not only enhance our understanding of nutrient allocation during flower development but also provide a robust theoretical framework for the estimation of nutrient status in C. maxima flowers. Given that flower development is controlled by a complex regulatory network, there are still uncertainties regarding the impacts of phenophases and/or floral parts on the variable C, N, P content and their ratios, as well as NSC contents in C. maxima flowers. These uncertainties call for further investigation, which drives morphogenesis, resource partitioning, and effective nutrient management during flower development in C. maxima plant via integrating physiological and biochemical analysis.

Supplementary Materials

The following supporting information can be downloaded at: https://www.mdpi.com/article/10.3390/horticulturae11091053/s1, Table S1: Standard curves of glucose, fructose, sucrose, and starch in this study. Table S2: Morphological indexes of three parts of C. maxima flower at three phenophases. Table S3: The first three principal component load and contribution rate of percentage of variance (%) in C. maxima flowers.

Author Contributions

Conceptualization, G.Z. and S.G.; methodology, J.L.; software, J.L.; validation, J.L., S.H. and Y.K.; formal analysis, J.L., S.H. and Y.K.; investigation, J.L.; resources, J.L.; data curation, J.L.; writing—original draft preparation, J.L., G.Z. and S.G.; writing—review and editing, J.L., S.H., Y.K., H.P., M.Z., T.Y., H.H., G.Z. and S.G. visualization, J.L., S.H. and Y.K.; supervision, G.Z. and S.G.; project administration, G.Z. and S.G.; funding acquisition, G.Z. and S.G. All authors have read and agreed to the published version of the manuscript.

Funding

This research received no external funding.

Data Availability Statement

The data presented in this study are available upon request from the corresponding author.

Acknowledgments

We are grateful to all of the group members and workers for their assistance in the field experiment.

Conflicts of Interest

The authors declare no conflicts of interest.

References

  1. Baslam, M.; Mitsui, T.; Sueyoshi, K.; Ohyama, T. Recent Advances in Carbon and Nitrogen Metabolism in C3 Plants. Int. J. Mol. Sci. 2019, 22, 318. [Google Scholar] [CrossRef]
  2. Krouk, G.; Kiba, T. Nitrogen and Phosphorus Interactions in Plants: From Agronomic to Physiological and Molecular Insights. Curr. Opin. Plant Biol. 2020, 57, 104–109. [Google Scholar] [CrossRef]
  3. Ågren, G.I. Stoichiometry and Nutrition of Plant Growth in Natural Communities. Annu. Rev. Ecol. Evol. Syst. 2008, 39, 153–170. [Google Scholar] [CrossRef]
  4. Sardans, J.; Rivas-Ubach, A.; Peñuelas, J. The C:N:P Stoichiometry of Organisms and Ecosystems in a Changing World: A Review and Perspectives. Perspect. Plant Ecol. Evol. Syst. 2012, 14, 33–47. [Google Scholar] [CrossRef]
  5. Ren, H.Y.; Qian, W.Z.; Yi, L.; Ye, Y.L.; Gu, T.; Gao, S.; Cao, G.X. Nutrient Composition and Antioxidant Activity of Cercis chinensis Flower in Response to Different Development Stages. Horticulturae 2023, 9, 961. [Google Scholar] [CrossRef]
  6. Jia, S.; Wang, Y.; Hu, J.; Ding, Z.; Liang, Q.; Zhang, Y.; Wang, H. Mineral and Metabolic Profiles in Tea Leaves and Flowers During Flower Development. Plant Physiol. Biochem. 2016, 106, 316–326. [Google Scholar] [CrossRef]
  7. Zhang, W.; Li, J.; Zhang, W.; Njie, A.; Pan, X. The Changes in C/N, Carbohydrate, and Amino Acid Content in Leaves During Female Flower Bud Differentiation of Juglans sigillata. Acta Physiol. Plant. 2022, 44, 19. [Google Scholar] [CrossRef]
  8. Yu, T.; Yang, Y.; Wang, H.; Qian, W.; Hu, Y.; Gao, S.; Liao, H. The Variations of C/N/P Stoichiometry, Endogenous Hormones, and Non-Structural Carbohydrate Contents in Michelia maudiae ‘Rubicunda’ Flower at Five Development Stages. Horticulturae 2023, 9, 1198. [Google Scholar] [CrossRef]
  9. Yang, Y.; Qiu, Y.; Cheng, Y.; Yu, T.; Zhu, M.; Qian, W.; Gao, S.; Zhuang, G. Non-Structural Carbohydrate Content and C:N:P Stoichiometry in Houpoea officinalis Flowers in Response to Development Stages. Horticulturae 2024, 10, 784. [Google Scholar] [CrossRef]
  10. Verlinden, S. Changes in Mineral Nutrient Concentrations in Petunia Corollas during Development and Senescence. HortScience 2003, 38, 71–74. [Google Scholar] [CrossRef]
  11. Wang, T.-W.; Tan, J.; Li, L.-Y.; Yang, Y.; Zhang, X.-M.; Wang, J.-R. Combined Analysis of Inorganic Elements and Flavonoid Metabolites Reveals the Relationship between Flower Quality and Maturity of Sophora japonica L. Front. Plant Sci. 2023, 14, 1255637. [Google Scholar] [CrossRef]
  12. Rolland, F.; Baena-Gonzalez, E.; Sheen, J. Sugar Sensing and Signaling in Plants: Conserved and Novel Mechanisms. Ann. Rev. Plant Biol. 2006, 57, 675–709. [Google Scholar] [CrossRef]
  13. Mishra, B.S.; Sharma, M.; Laxmi, A. Role of Sugar and Auxin Crosstalk in Plant Growth and Development. Physiol. Plant. 2022, 174, e13546. [Google Scholar] [CrossRef]
  14. Therby-Vale, R.; Lacombe, B.; Rhee, S.Y.; Nussaume, L.; Rouached, H. Mineral Nutrient Signaling Controls Photosynthesis: Focus on Iron Deficiency-Induced Chlorosis. Trends Plant Sci. 2022, 27, 502–509. [Google Scholar] [CrossRef]
  15. Wang, Y.; Funnell, K.A.; Eason, J.R.; Morgan, E.R.; Woolley, D.J. Osmotic Regulation via Carbohydrate Metabolism Drives Petal Expansion and Floret Opening in Gentian ‘Showtime Spotlight. ’ Sci. Hortic. 2016, 211, 19–25. [Google Scholar] [CrossRef]
  16. Cho, L.H.; Pasriga, R.; Yoon, J.; Jeon, J.S.; An, G. Roles of Sugars in Controlling Flowering Time. J. Plant Biol. 2018, 61, 121–130. [Google Scholar] [CrossRef]
  17. Norikoshi, R.; Imanishi, H.; Ichimura, K. Changes in Cell Number, Osmotic Potential and Concentrations of Carbohydrates and Inorganic Ions in Tweedia Caerulea during Flower Opening. J. Jpn. Soc. Hortic. Sci. 2013, 82, 51–56. [Google Scholar] [CrossRef]
  18. Xu, J.; Li, Q.; Yang, L.; Li, X.; Wang, Z.; Zhang, Y. Changes in Carbohydrate Metabolism and Endogenous Hormone Regulation During Bulblet Initiation and Development in Lycoris radiata. BMC Plant Biol. 2020, 20, 180. [Google Scholar] [CrossRef]
  19. Önder, S.; Tonguç, M.; Önder, D.; Erbaş, S.; Mutlucan, M. Flower Color and Carbohydrate Metabolism Changes During the Floral Development of Rosa Damascena. S. Afr. J. Bot. 2023, 156, 234–243. [Google Scholar] [CrossRef]
  20. Roderick, B.; John, E.; Julian, H.; Allan, W. Flower opening in Asiatic lily is a rapid process controlled by dark-light cycling. Ann. Bot. 2000, 86, 1169–1174. [Google Scholar] [CrossRef]
  21. Hedhly, A.; Vogler, H.; Schmid, M.W.; Pazmino, D.; Gagliardini, V.; Santelia, D.; Grossniklaus, U. Starch Turnover and Metabolism During Flower and Early Embryo Development. Plant Physiol. 2016, 172, 2388–2402. [Google Scholar] [CrossRef]
  22. Fernandes, L.; Pereira, J.A.; Saraiva, J.A.; Ramalhosa, E.; Casal, S. Phytochemical Characterization of Borago officinalis L. and Centaurea cyanus L. during Flower Development. Food Res. Int. 2019, 123, 771–778. [Google Scholar] [CrossRef]
  23. Jhanji, S.; Kaur, G.; Kaur, R.; Dhatt, U.K. Physiological and Biochemical Changes during Flower Development and Senescence in Chrysanthemum and Gladiolus. Acta Physiol. Plant. 2023, 45, 14. [Google Scholar] [CrossRef]
  24. Ulger, S.; Sonmez, S.; Karkacier, M.; Ertoy, N.; Akdesir, O.; Aksu, M. Determination of endogenous hormones, sugars and mineral nutrition levels during the induction, initiation and differentiation stage and their effects on flower formation in olive. Plant Growth Regul. 2004, 42, 89–95. [Google Scholar] [CrossRef]
  25. Borghi, M. Roles of Sugar Metabolism and Transport in Flower Development. Curr. Opin. Plant Biol. 2025, 85, 102722. [Google Scholar] [CrossRef]
  26. Wei, S.; Liu, H.; Li, J.; Ren, T.; Xie, J. Metabolite Variations of Sugars, Organic Acids, Fatty Acids and Amino Acids in Flower Buds of Zingiber mioga Roscoe at Different Developmental Stages. J. Food Compos. Anal. 2023, 116, 105050. [Google Scholar] [CrossRef]
  27. Önder, S.; Tonguç, M.; Erbaş, S.; Önder, D.; Mutlucan, M. Investigation of Phenological, Primary and Secondary Metabolites Changes during Flower Developmental of Rosa damascena. Plant Physiol. Biochem. 2022, 192, 20–34. [Google Scholar] [CrossRef]
  28. Xiang, N.; Zhao, Y.; Zhang, B.; Gu, Q.; Chen, W.; Guo, X. Volatiles Accumulation during Young Pomelo (Citrus maxima (Burm.) Merr.) Fruits Development. Int. J. Mol. Sci. 2022, 23, 5665. [Google Scholar] [CrossRef] [PubMed]
  29. Ding, S.; Wang, P.; Pang, X.; Zhang, L.; Qian, L.; Jia, X.; Chen, W.; Ruan, S.; Sun, L. The New Exploration of Pure Total Flavonoids Extracted from Citrus maxima (Burm.) Merr. as a New Therapeutic Agent to Bring Health Benefits for People. Front. Nutr. 2022, 9, 958329. [Google Scholar] [CrossRef] [PubMed]
  30. Huang, S.; Dong, T.; Xiong, B.; Qiu, X.; Sun, G.; Liao, L.; Fan, N.; Wang, X.; Deng, H.; He, S.; et al. Variation in The Content and Composition of Limonoids in Fruits of Four Pomelo Varieties During Fruit Development: The Natural Debittering Process in Pomelo Fruits. J. Food Compos. Anal. 2021, 100, 103928. [Google Scholar] [CrossRef]
  31. Zhao, Y.; Yang, X.; Hu, Y.; Gu, Q.; Chen, W.; Li, J.; Guo, X.; Liu, Y. Evaluation of Carotenoids Accumulation and Biosynthesis in Two Genotypes of Pomelo (Citrus maxima) during Early Fruit Development. Molecules 2021, 26, 5054. [Google Scholar] [CrossRef]
  32. Sapkota, B.; Devkota, H.P.; Poudel, P. Citrus maxima (Brum.) Merr. (Rutaceae): Bioactive Chemical Constituents and Pharmacological Activities. Evid. Based Complement. Altern. Med. 2022, 2022, 8741669. [Google Scholar] [CrossRef]
  33. Agustí, M.; Reig, C.; Martínez-Fuentes, A.; Mesejo, C. Advances in Citrus Flowering: A Review. Front. Plant Sci. 2022, 13, 868831. [Google Scholar] [CrossRef]
  34. Zhang, X.; Zhuang, X.; Xiong, T.; Huang, S.; Qian, X.; Guo, T.; Chen, M.; Xie, W.; Huang, Y. Extraction From Different Parts of Citrus maxima Flowers Using Ultrasound as an Aid and Study of Their Composition and Function. Ultrason. Sonochem. 2023, 100, 106632. [Google Scholar] [CrossRef]
  35. Fadón, E.; Herrero, M.; Rodrigo, J. Flower development in sweet cherry framed in the BBCH scale. Sci. Hortic. 2015, 192, 141–147. [Google Scholar] [CrossRef]
  36. Qian, W.; Hu, Y.; Lin, X.; Yu, D.; Jia, S.; Ye, Y.; Mao, Y.; Yi, L.; Gao, S. Phenological Growth Stages of Abelmoschus manihot: Codification and Description According to the BBCH Scale. Agronomy 2023, 13, 1328. [Google Scholar] [CrossRef]
  37. Chen, C.; Chen, H.; Ni, M.; Yu, F. A Study on Petal Morphological and Physiological Characteristics of Styrax Japonicus during the Flowering Period. Agronomy 2021, 11, 1498. [Google Scholar] [CrossRef]
  38. Önder, D. Variation in antioxidant capacity, antioxidant activity and mineral composition during flower development of oil-bearing rose (Rosa damascena Mill.). Sci. Rep. 2023, 13, 17255. [Google Scholar] [CrossRef]
  39. Simko, I.; Zhao, R. Phenotypic Characterization, Plant Growth and Development, Genome Methylation, and Mineral Elements Composition of Neotetraploid Lettuce (Lactuca sativa L.). Front. Plant Sci. 2023, 14, 1296660. [Google Scholar] [CrossRef] [PubMed]
  40. Goetz, M.; Rabinovich, M.; Smith, H.M. The Role of Auxin and Sugar Signaling in Dominance Inhibition of Inflorescence Growth by Fruit Load. Plant Physiol. 2021, 187, 1189–1201. [Google Scholar] [CrossRef] [PubMed]
  41. Shah, K.; Zhu, X.; Zhang, T.; Chen, J.; Chen, J.; Qin, Y. Transcriptome Analysis Reveals Sugar and Hormone Signaling Pathways Mediating Flower Induction in Pitaya (Hylocereus polyrhizus). Int. J. Mol. Sci. 2025, 26, 1250. [Google Scholar] [CrossRef] [PubMed]
  42. Yamada, K.; Norikoshi, R.; Suzuki, K.; Imanishi, H.; Ichimura, K. Determination of Subcellular Concentrations of Soluble Carbohydrates in Rose Petals during Opening by Nonaqueous Fractionation Method Combined with Infiltration–Centrifugation Method. Planta 2009, 230, 1115–1127. [Google Scholar] [CrossRef] [PubMed]
  43. Yap, Y.M.; Loh, C.S.; Ong, B.L. Regulation of Flower Development in Dendrobium crumenatum by Changes in Carbohydrate Contents, Water Status and Cell Wall Metabolism. Sci. Hortic. 2008, 119, 59–66. [Google Scholar] [CrossRef]
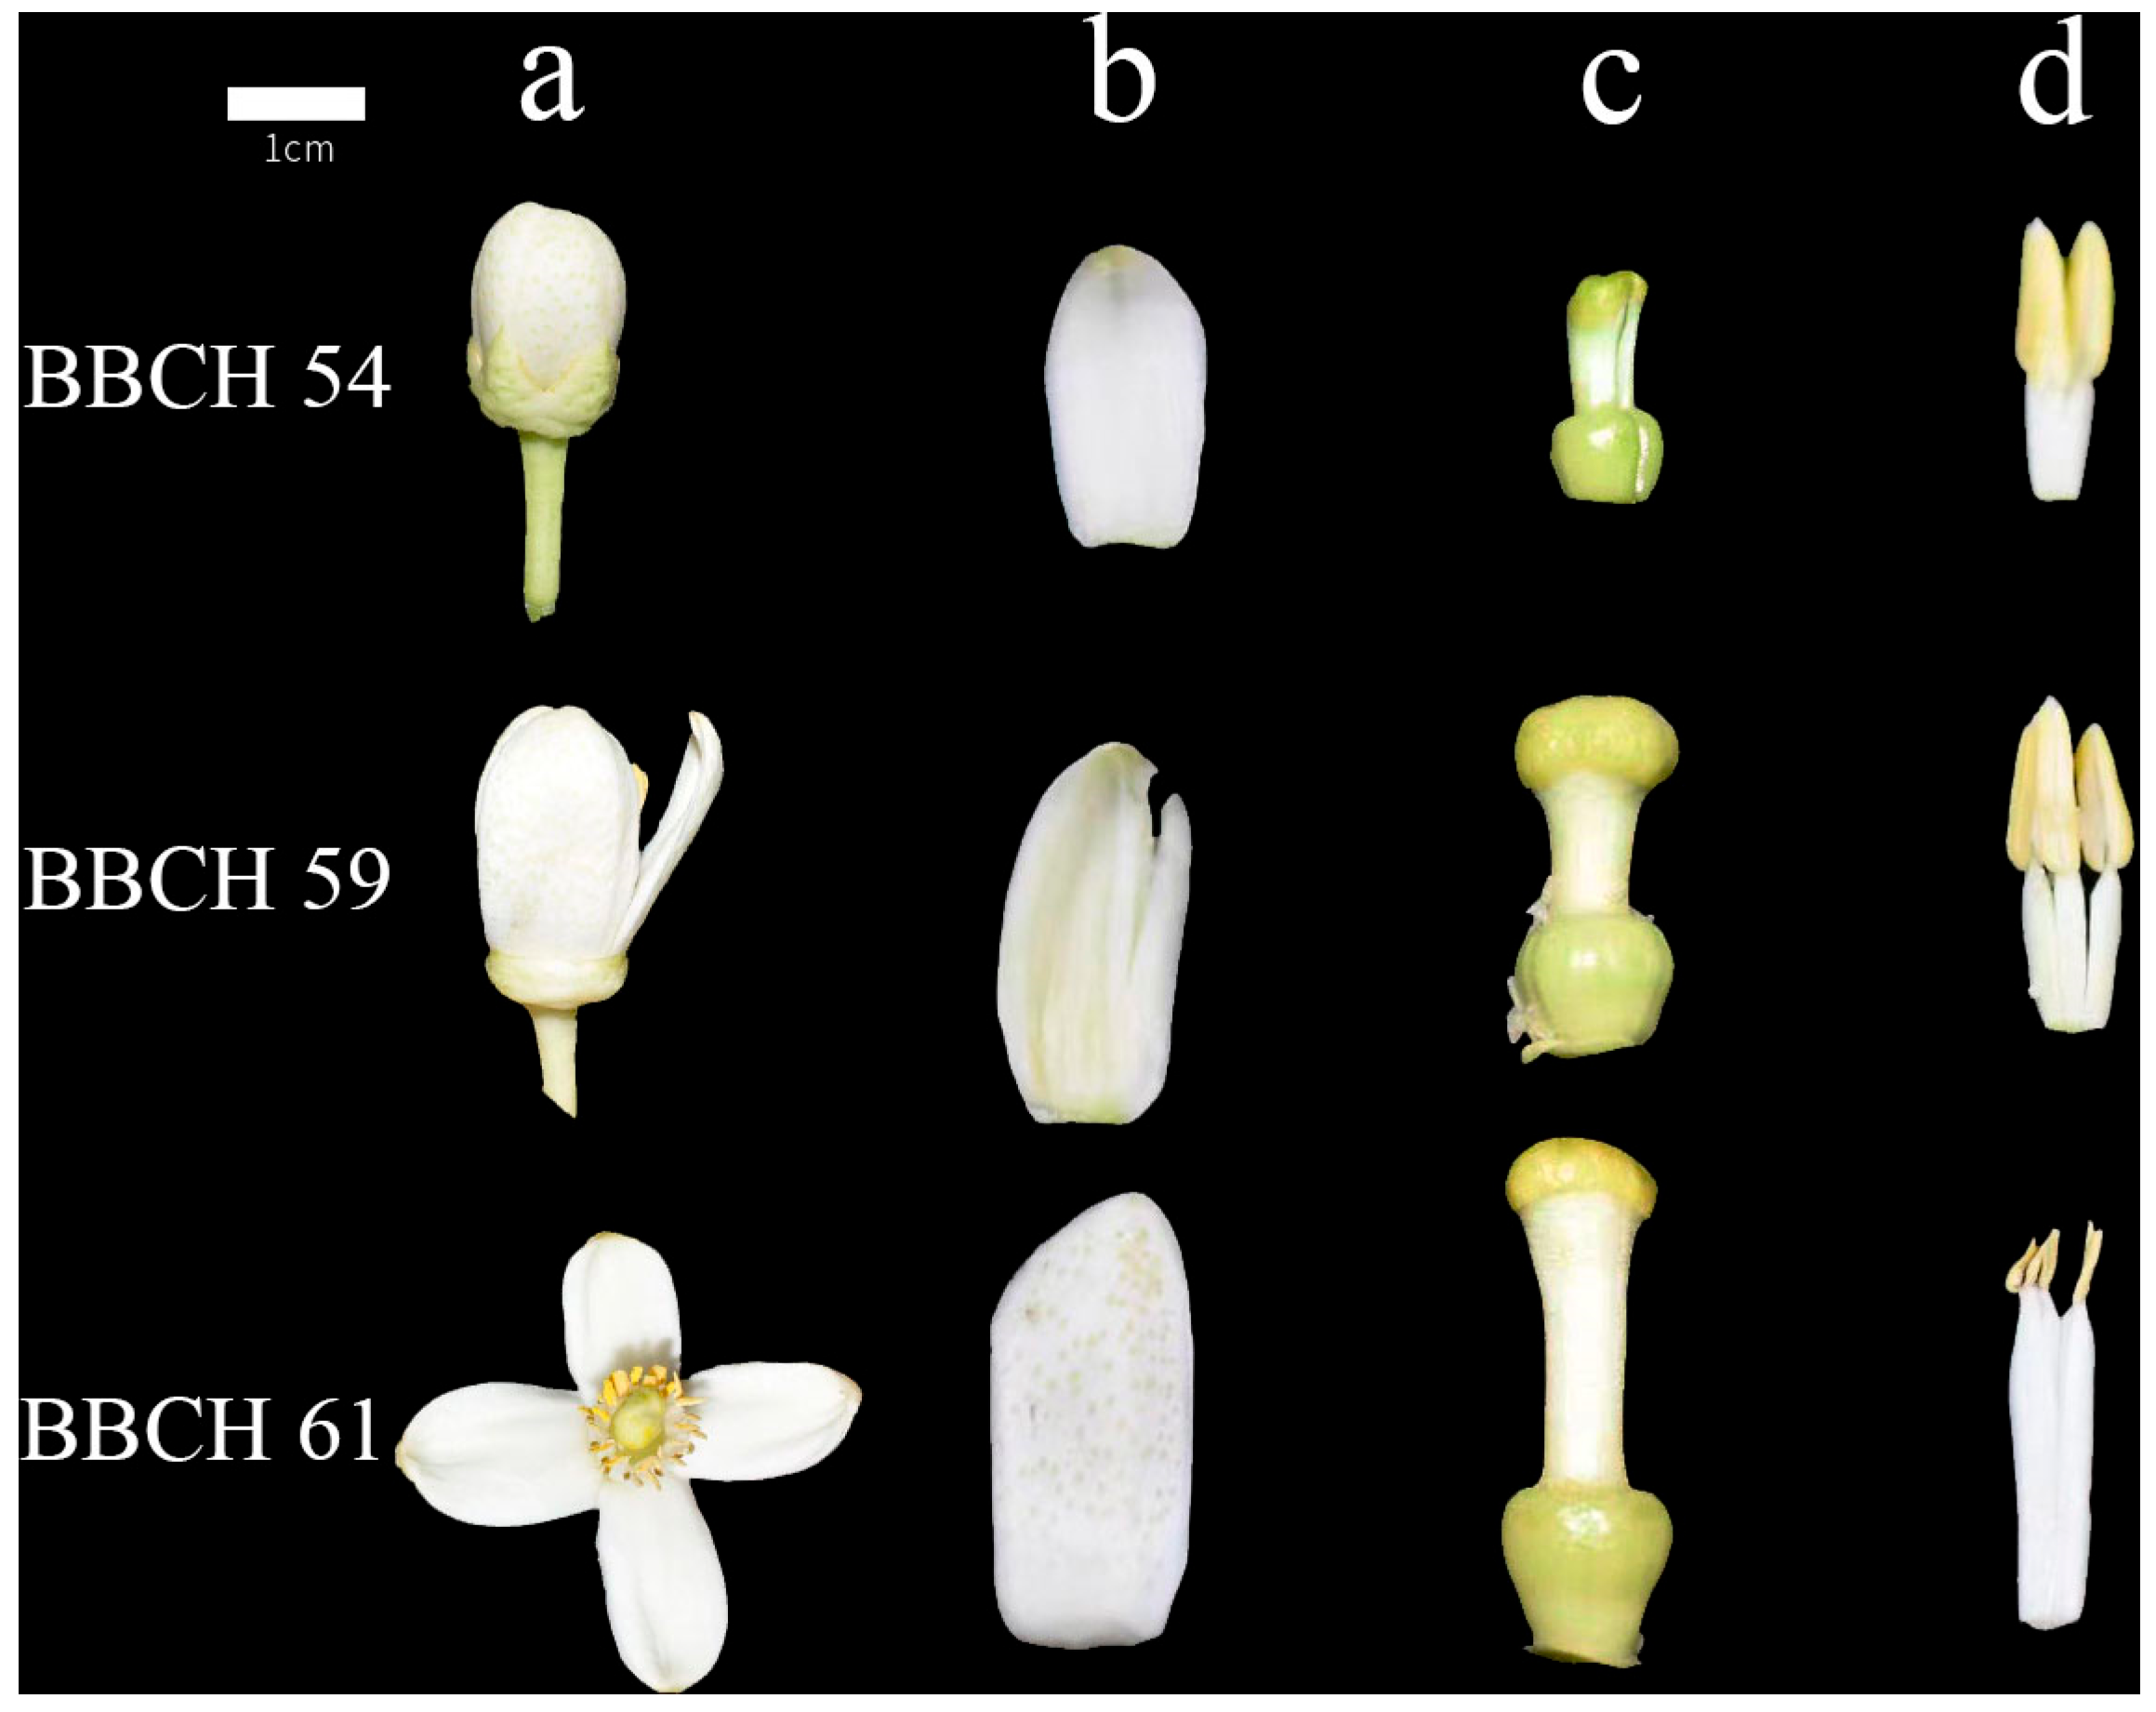
Figure 1. Morphology changes in three parts in the C. maxima flower at three phenophases. (a) Whole flower, (b) petals, (c) pistil, (d) stamen. BBCH54, young bud stage. BBCH59, first bloom stage. BBCH61, full bloom stage. Scale bar = 1 cm.
Horticulturae 11 01053 g001
Figure 2. Variations in C (a), N (b), and P (c) contents of three parts in C. maxima flowers at three phenophases. Data are expressed as the means ± standard deviation (n = 3). Lowercase letters represent significant differences, with a significance level of 0.05. Lowercase letters represent significant differences at different stages, and capital letters represent significant differences in the three parts, with a significance level of 0.05.
Horticulturae 11 01053 g002
Figure 3. Variations in C, N, and P allocation ratios and accumulations of pistil, stamens, and petals in C. maxima flower at three phenophases. (a) C allocation ratios. (b) N allocation ratios. (c) P allocation ratio. (d) C accumulation. (e) N accumulation. (f) P accumulation. Data are expressed as the means ± standard deviation (n = 3). Lowercase letters represent significant differences, with a significance level of 0.05. Lowercase letters represent significant differences at different stages, and capital letters represent significant differences in the three parts, with a significance level of 0.05.
Horticulturae 11 01053 g003
Figure 4. Variations in C:N (a), C:P (b), and N:P (c) ratios of pistil, stamens, and petals in C. maxima flower at three phenophases. Data are expressed as the means ± standard deviation (n = 3). Lowercase letters represent significant differences, with a significance level of 0.05. Lowercase letters represent significant differences at different stages, and capital letters represent significant differences in the three parts, with a significance level of 0.05.
Horticulturae 11 01053 g004
Figure 5. Variations in glucose (a), fructose (b), sucrose (c), and starch (d) contents of pistil, stamens, and petals in C. maxima flower at three phenophases. Data are expressed as the means ± standard deviation (n = 3). Lowercase letters represent significant differences, with a significance level of 0.05. Lowercase letters represent significant differences at different stages, and capital letters represent significant differences in the three parts, with a significance level of 0.05.
Horticulturae 11 01053 g005
Figure 6. Variations in glucose, fructose, sucrose, and starch allocation ratios (ad) and accumulations (eh) of pistil, stamens, and petals in C. maxima flower at three phenophases. Data are expressed as the means ± standard deviation (n = 3). Lowercase letters represent significant differences, with a significance level of 0.05. Lowercase letters represent significant differences at different stages, and capital letters represent significant differences in the three parts, with a significance level of 0.05.
Horticulturae 11 01053 g006
Figure 7. Correlation analysis and PCA of tested parameters in C. maxima flowers at three phenophases. (a) Correlation analysis of the test parameters. Correlation matrix showing significant p-values (<0.05; <0.01) of different tested parameters, where their color indicates the correlation slope (red Pearson’s correlation coefficient = 1.0 and blue one = −1.0). Asterisks indicate significant differences: * p < 0.05, ** p < 0.01. (b) Distribution plots of PC1 and PC2. (c) The histogram from PC1 to PC10. (d) The proportion of the contribution of the tested parameters to PC1, PC2, and PC3. The locations of the variables in PC1 and PC2 are indicated by the direction and strength of the vector lines. The percentage of variation explained by each component is given next to the axis. The location of the trait in the diagram closest to the intersection of 0 on the X-axis (PC1) and Y-axis (PC2) shows similarity.
Horticulturae 11 01053 g007
Table 1. Growth indexes of three parts of C. maxima flower at three phenophases.
OrgansBBCH54BBCH59BBCH61
PistilFresh mass (g)0.34 ± 0.02 b0.62 ± 0.04 a0.71 ± 0.10 a
Dry mass (g)0.11 ± 0.01 c0.16 ± 0.003 b0.19 ± 0.02 a
RWC (%)74.37 ± 1.38 a73.26 ± 0.41 a72.04 ± 1.82 a
StamenFresh mass (g)0.25 ± 0.02 b0.43 ± 0.01 a0.43 ± 0.04 a
Dry mass (g)0.04 ± 0.03 b0.08 ± 0.03 a0.08 ± 0.01 a
RWC (%)83.49 ± 1.15 a81.65 ± 1.27 a81.31 ± 0.97 a
PetalFresh mass (g)0.50 ± 0.09 c0.83 ± 0.10 b1.27 ± 0.11 a
Dry mass (g)0.08 ± 0.02 b0.11 ± 0.01 b0.19 ± 0.02 a
RWC (%)83.14 ± 0.54 b86.63 ± 1.05 a85.62 ± 0.99 a
Data are expressed as the means ± standard deviation (n = 3). Lowercase letters represent significant differences with a significance level of 0.05.
Disclaimer/Publisher’s Note: The statements, opinions and data contained in all publications are solely those of the individual author(s) and contributor(s) and not of MDPI and/or the editor(s). MDPI and/or the editor(s) disclaim responsibility for any injury to people or property resulting from any ideas, methods, instructions or products referred to in the content.