Article

Short-Term Effects of Cover Crop Species and Termination Methods on Soil pH and Key Enzymatic Activities (β-Glucosidase, Phosphatase and Urease Activities) in a Citrus Orchard (Eureka Lemons)

by
Sibongiseni Silwana
1,2,3,*,
Azwimbavhi Reckson Mulidzi
1 and
Nebo Jovanovic
2
1
Department of Soil and Water Sciences, Agricultural Research Council Infruitec-Nietvoorbij, Stellenbosch 7600, South Africa
2
Department of Earth Sciences, University of the Western Cape, Bellville 7535, South Africa
3
Department of Rural Development and Agrarian Reform, Dohne Agricultural Development Institute, Stutterheim 4930, South Africa
*
Author to whom correspondence should be addressed.
Horticulturae 2025, 11(9), 1014; https://doi.org/10.3390/horticulturae11091014
Submission received: 2 July 2025 / Revised: 28 July 2025 / Accepted: 30 July 2025 / Published: 27 August 2025
(This article belongs to the Special Issue Practices for Soil and Water Conservation in Horticulture)

Abstract

The best management practices for cover cropping in citrus orchards, particularly in terms of species selection and termination methods, remain unclear. This study assessed the short-term effects of different cover crop species (vetch, medics and oats) and termination methods (slashed vs. non-slashed) on soil pH and enzyme activities (β-glucosidase, acid phosphatase, and urease) in a citrus orchard with sandy soil. A randomized complete block design with a factorial treatment structure and six replications was used. Soil samples were collected before and one year after cover crop establishment. The results showed that cover cropping increased soil pH from 5.42 to 6.00 after one year. However, no statistically significant differences were observed in soil pH or enzyme activities among cover crop species or termination methods. Marginal increases in enzyme activities were observed under leguminous cover crops, and these changes were insufficient to indicate strong treatment effects. Correlation and principal component analyses revealed that soil enzyme activities were more strongly influenced by soil properties (depth, carbon content and moisture) than by cover crop species or termination methods. These findings suggest that, under sandy soil conditions and within a one-year period, cover cropping has limited immediate effects on soil biological indicators in citrus orchards. Longer-term studies are recommended to assess cumulative impacts.

1. Introduction

Citrus is a high-value crop in South Africa, where production is largely export-driven and reliant on intensive orchard management practices [1,2]. These practices typically rely on the frequent use of synthetic fertilizers, pesticides and other agrochemicals to maximize yields [3]. However, long-term dependence on these inputs has contributed to soil degradation, including acidification, reduced organic matter, compaction and microbial imbalance, especially in citrus orchards where crop diversity is limited [4]. The problem is further exacerbated in sandy soils, which dominate many South African citrus-producing regions. These soils are inherently low in organic matter, nutrient-holding capacity and microbial activity, making them particularly vulnerable to soil degradation [5].
This has prompted researchers to explore alternative production methods that promote sustainable practices to enhance soil quality [6,7]. Sustainable management practices such as cover cropping have gained attention for their potential to restore and maintain soil quality [8,9]. Cover crops offer a range of ecological benefits, including improved soil structure, organic matter inputs, weed suppression and nutrient cycling [7]. Their functional roles, however, vary depending on cover crop species. Legume species such as vetch (Vicia sativa) and medics (Medicago spp.) contribute to nitrogen enrichment through biological fixation and stimulate microbial activity due to their rapid decomposition and low carbon to nitrogen (C:N) ratios [10,11]. In contrast, non-legumes like oats (Avena sativa) contribute high biomass but decompose slowly due to higher C:N ratios, potentially delaying nutrient release and altering microbial dynamics. Additionally, non-legume cover crops are known for suppressing weeds, creating a strong soil structure and adding organic material [11].
One of the key soil functions influenced by cover crops is microbial activity, often assessed through soil enzyme activities, which serve as early indicators of soil biological status [6,12]. Enzymes such as urease, β-glucosidase and acid phosphatase play crucial roles in nitrogen, carbon and phosphorus cycling, respectively, and are sensitive to changes in soil organic matter and management practices [7]. Urease plays a crucial role in nitrogen cycling and is mainly derived from plants; it is also secreted by soil microbes [13]. β-glycosidases are a group of enzymes involved in catalyzing the hydrolysis [14,15] and biodegrading of various glucosides that are present in plant debris [16,17]. These reactions provide glucose as a final end product, an important carbon energy source for the growth and activity of microbes in the soil [18,19]. Acid phosphatase enzymes play critical roles in the phosphorus cycle by catalyzing the hydrolysis of esters and anhydrides of phosphoric acid [20]. Plants and soil microbes are the fundamental sources of acid phosphatase enzymes [21].
Although soil enzymes have been extensively studied in annual cropping systems, limited research exists on their response to cover crops in citrus systems established on sandy soils. Moreover, while cover crop species may influence microbial dynamics, termination methods such as mechanical slashing or natural senescence may also affect the rate of residue decomposition and substrate availability to microbes. Despite this, the interactive effects of cover crop functional type and termination strategy on soil enzyme activity in citrus orchards remain underexplored.
This study, therefore, aimed to evaluate how different cover crop species (oats, vetch and medics) and their termination methods (slashed vs. non-slashed) react with key soil enzyme activities (urease, β-glucosidase and acid phosphatase) and soil pH in a citrus orchard established on sandy soils. The findings contribute to a better understanding of soil biological responses to cover cropping strategies in citrus orchards and inform more sustainable orchard floor management practices.

2. Materials and Methods

2.1. Study Location

A cover crop study was conducted on Lamara farm (33°51′50.51″ S, 19°07′.66″ E) at Franschhoek, the district of Cape Winelands in the Western Cape Province, South Africa (Figure 1). The study was performed in a Eureka lemon (Citrus limon) cultivar orchard in May 2022 to May 2023. The soil of the area is characterized as the Tsitsikamma soil form [22] with a rainfall ranging between 280 and 785 mm (Table 1) during cover crop growing season. An orchard with five (5)-year-old Eureka lemon trees grafted on X639 rootstock planted at 3 m × 6 m (square system) apart was used for the study.

2.2. Factorial Experimental Design

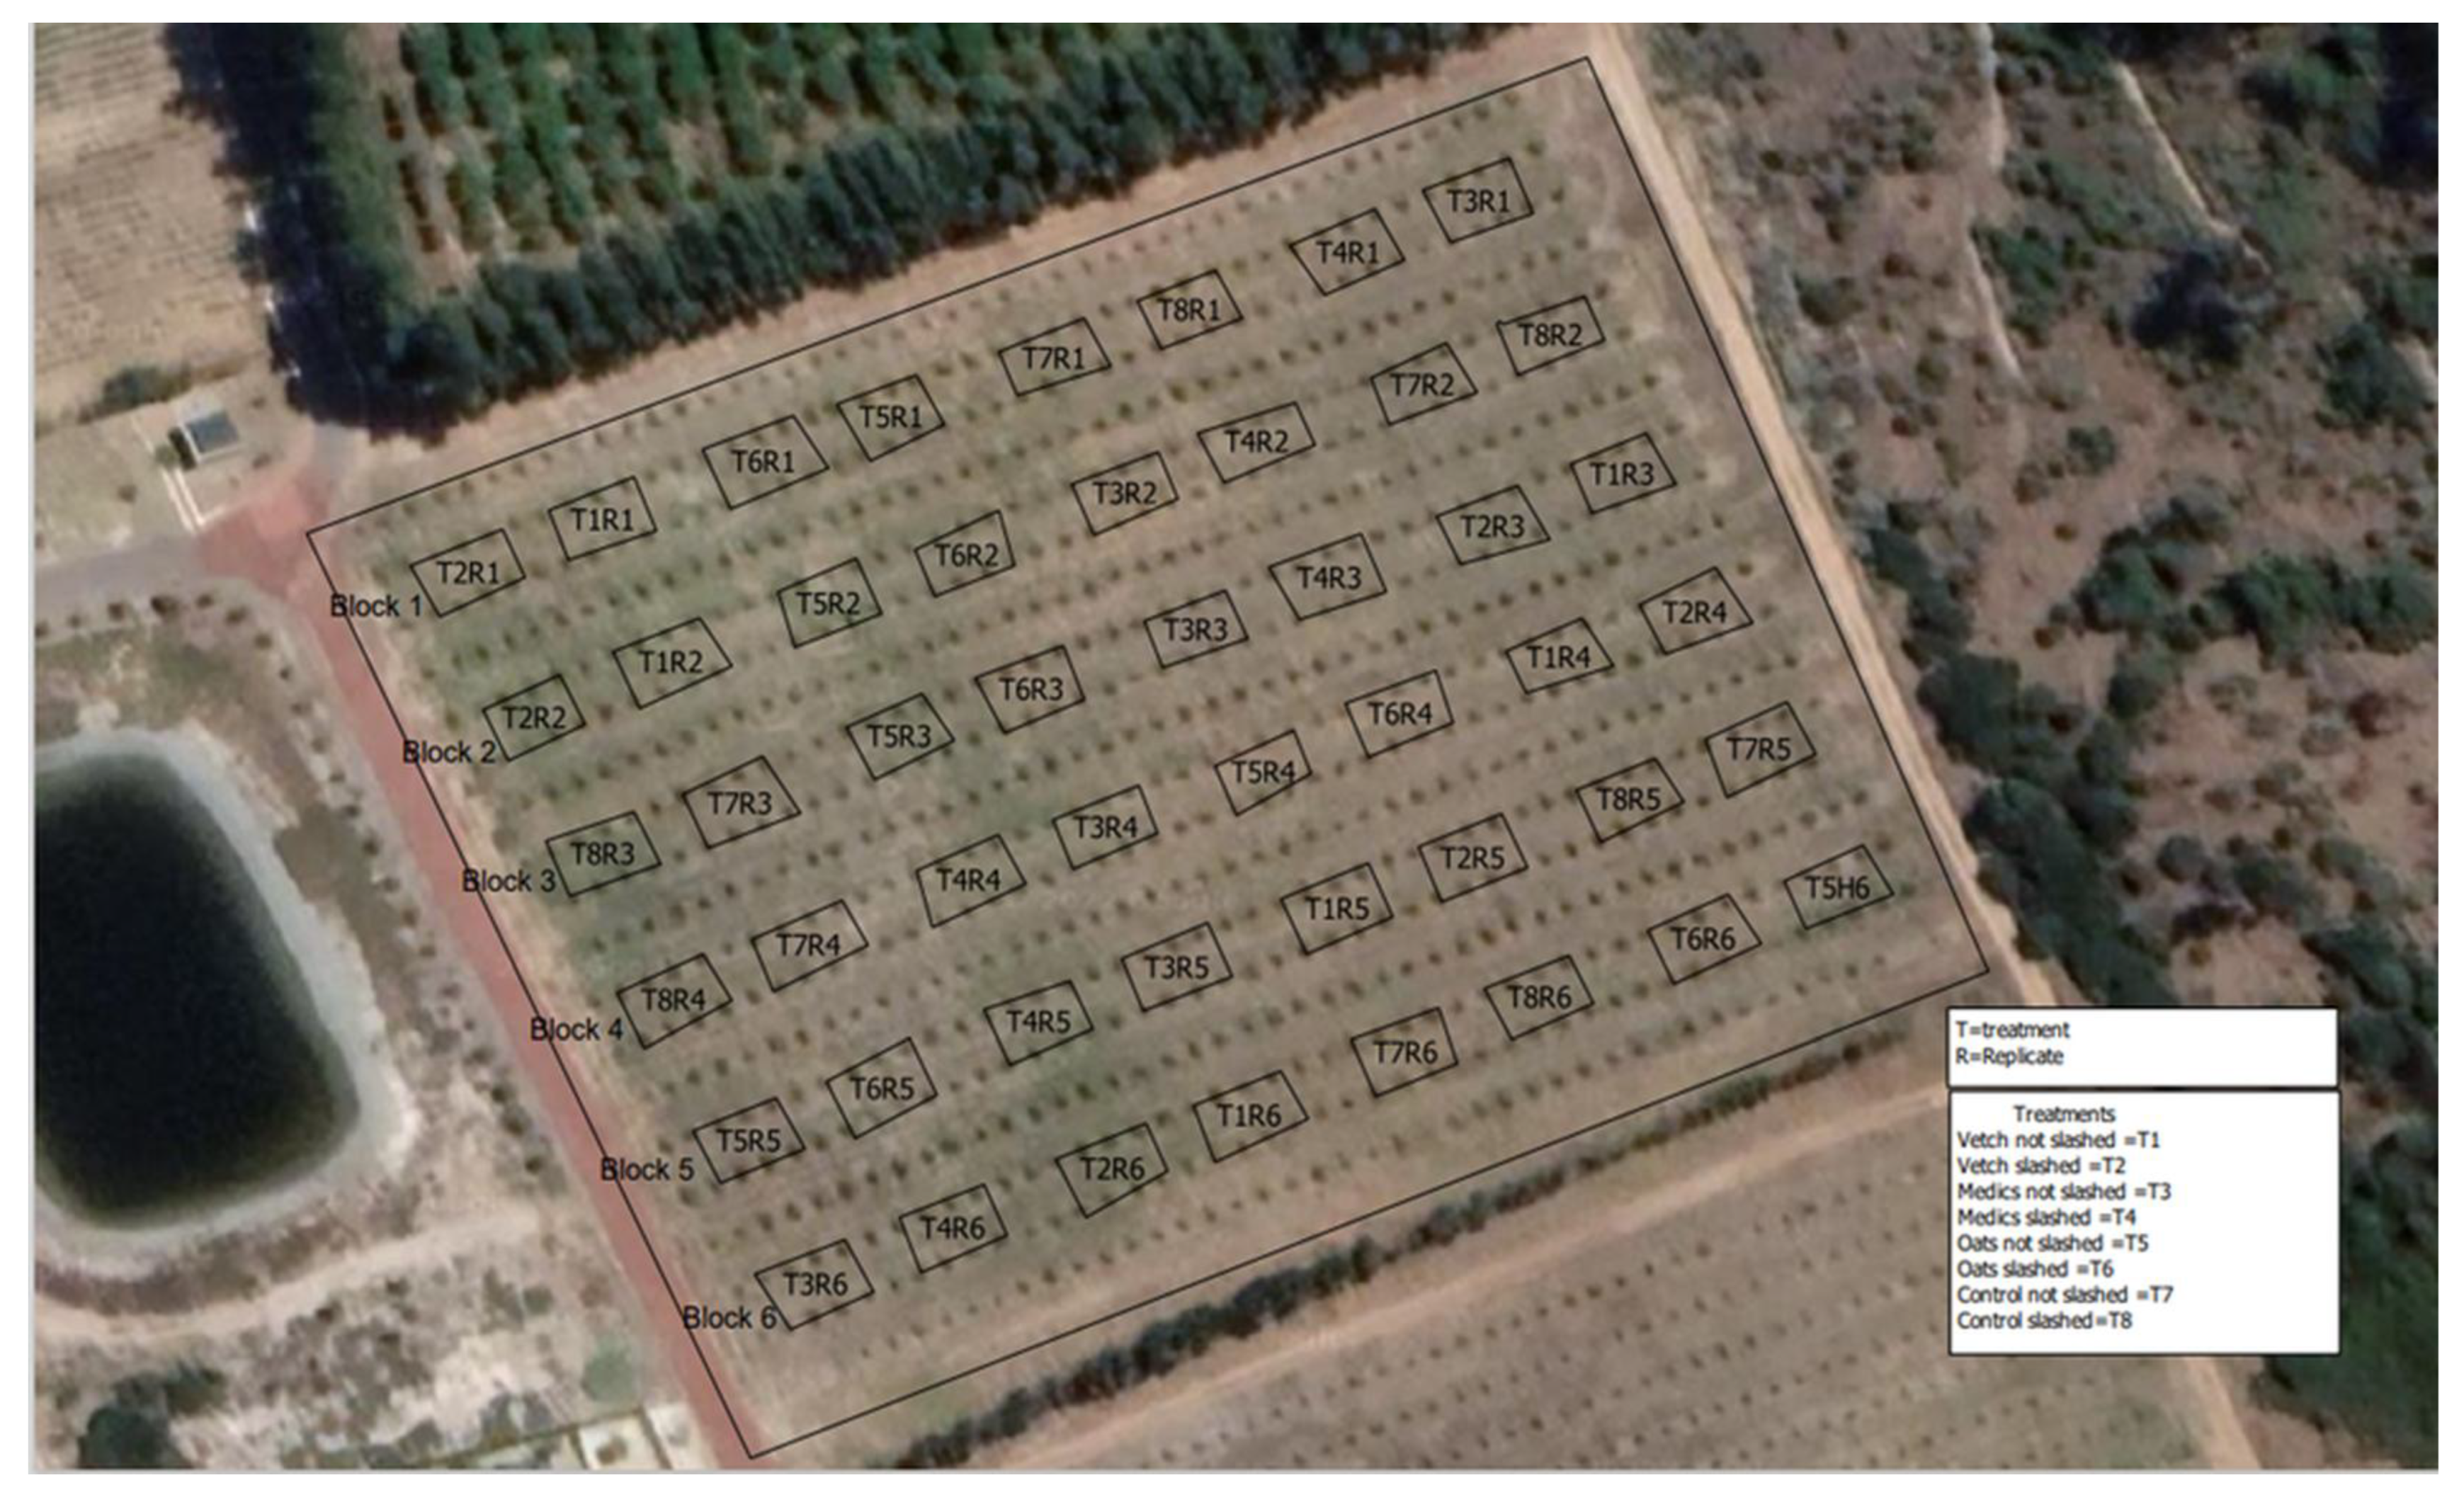
Three cover crop species, oats (Avena Sativa), medics (Medicago truncatula), and vetch (Vicia villosa), and a control (standard farmer’s practice) were used as treatments. The experiment was conducted using a factorial design, with the main factor being the cover crop species and the subfactor being slashed and non-slashed methods. A randomized complete block design was employed, with six replications of each treatment combination (Figure 2). Each sub-plot covered 54 m2 (8 trees per plot). The plot row was made up of 4 trees with 1 tree separating subplots (slash/non-slash), 2 trees separating the main plots (cover crop species) and 1 tree row separating the replicated blocks.

2.3. The Establishment of a Selection of Three Cover Crop Species

Potential cover crops were screened for suitability for use as cover crops in citrus orchards following a multi-criteria grid construction as described by Jannoyer et al. [23]. The selection was performed in three successive steps based on previously published research, expert assessments from scientists, technical staff and growers, agronomy experiments and eco-physiological measurements [23]. The following traits were assessed in each step: vegetative characteristics, which include a maximum plant height of 30 cm, practicality, which includes seed availability and non-invasive growth, and desired ecological function such as the ability to compete with weeds and N fixing properties [24]. Based on this process, oats, vetch and medics were selected for inclusion in the experiment and are commonly used in the Western Cape of South Africa.

2.4. Seed Sowing

Roundup herbicide (Glyphosate as the active ingredient) was sprayed at 5 L ha−1 to kill weeds before sowing. Cover crops were sown between the tree rows at the beginning of the rainy season (May 2022). All cover crops were evenly sown by hand using the following seeding rates: Pallinup oats, 90 kg ha−1; grazing vetch, 50 kg ha−1; and Parabinga medic, 25 kg ha−1. All cover crops received 100 kg ha−1 nitrogen after 30 days of planting [24].

2.5. Termination

Cover crops were terminated 90 days after sowing, just before flowering, and placed as mulch under the tree canopy for slashed plots following the methods used in the work by Oliveira et al. [25]. A tractor-mounted brush cutter was used to terminate cover crops in slashed plots while herbicide (roundup) was used to terminate them in non-slashed plots.

2.6. Data Collection

Soil Chemical Analysis

Prior to cover crop sowing, twelve composite soil samples (six from the topsoil and six from the subsoil) were randomly collected from the experimental orchard using a 3.5 cm diameter soil auger at two depths, 0–30 cm and 30–60 cm, to conduct soil enzyme and chemical analyses [26]. One year after sowing, a total of 96 soil samples (48 topsoil and 48 subsoil) were collected using soil auger from each subplot for laboratory analysis to assess changes in soil enzyme and chemical soil properties (Table 2). Soil pH(KCl) was determined in a 1:2.5 soil: KCl mixture (1M KCl solution) using a glass electrode pH meter.

2.7. Soil Enzyme Activity Assay

Initial soil enzyme activities of urease, β-glucosidase and acid phosphatase were analyzed before the application of treatments and later analyzed to see treatment effects. Urease activity (EC 3.5.1.5) associated with nitrogen cycling was determined by mixing 5.0 g of soil with 2.5 mL of 80 Mm solution and incubating for 2 h at 37 °C [27]. For controls, deionized water was used. The ammonium was extracted with 50 mL KCL solution and measured using a digital UV–Vis spectrophotometer against the reagent blank at 690 nm. Urease activity was expressed as μg ammonium g−1 soil 2 h−1.
β-glucosidase activity (EC 3.2.1.21), which plays a crucial role in C cycling, was determined by incubating 1.0 g of moist soil with p-nitrophenyl-β-D-glucopyranoside solution (pH 6.0) at 37 °C for 60 min [28]. The p-nitrophenyl amount during enzymatic hydrolysis was determined using a digital UV–Vis spectrophotometer at 410 nm. β-glucosidase activity was expressed as μg p-nitrophenol g−1 soil h−1.
Acid phosphatase (EC 3.1.3.2) associated with phosphorous cycling was determined as described for β-glucosidase activity with the exception of the reaction mixture consisting of 1.0 mL of 25 mM p-nitrophenol phosphate (substrate), 4.0 mL of modified universal buffer (MUB), and 0.25 mL of toluene and the released p-nitrophenol was extracted with 4 mL of 0.5 M NaOH at pH 6.5 [29]. Acid phosphate activity was expressed as μg p-nitrophenol g−1 soil h−1.

2.8. Soil Carbon, Dry Weight and Soil Moisture Measurements

The determination of soil organic carbon was based on the Walkley and Black chromic acid wet oxidation method.
The cover crop and weed samples were randomly collected from each sub-plot using a 0.5 m2 frame, stored in brown paper bags and oven-dried for 48 h at 90 °C. Thereafter, dried samples were weighed using an electronic balance to determine dry weights.
GPRS capacitance probes (DFM) were installed in the center of each plot to measure soil moisture. The probes were programmed to record measurements at hourly intervals for the duration of the cover crop growing season.

2.9. Statistical Analyses

A split-plot ANOVA was performed using the General Linear Model procedure (PROC GLM) of 9.4 SAS statistical software. The data were tested for normality using the Shapiro–Wilk test, histograms and normal probability plots of the Univariate procedure (PROC UNIVARIATE) of SAS statistical software [30]. Fisher’s least significant difference was calculated at the 5% level of significance to compare treatment means [31]. A probability level of 5% was considered significant for all significance tests.
The Pearson correlation method was used to examine variable relationships, as it is a widely used statistical method for measuring the strength and direction of linear relationships between two continuous variables. Principal Component Analysis (PCA) was applied to the dataset to identify patterns, groupings and major contributing variables. By using both Pearson correlation and PCA, this study ensured a comprehensive analysis of interactions and insights between variables.

3. Results and Discussion

3.1. Influence of Cover Crops on Soil pH After One Year

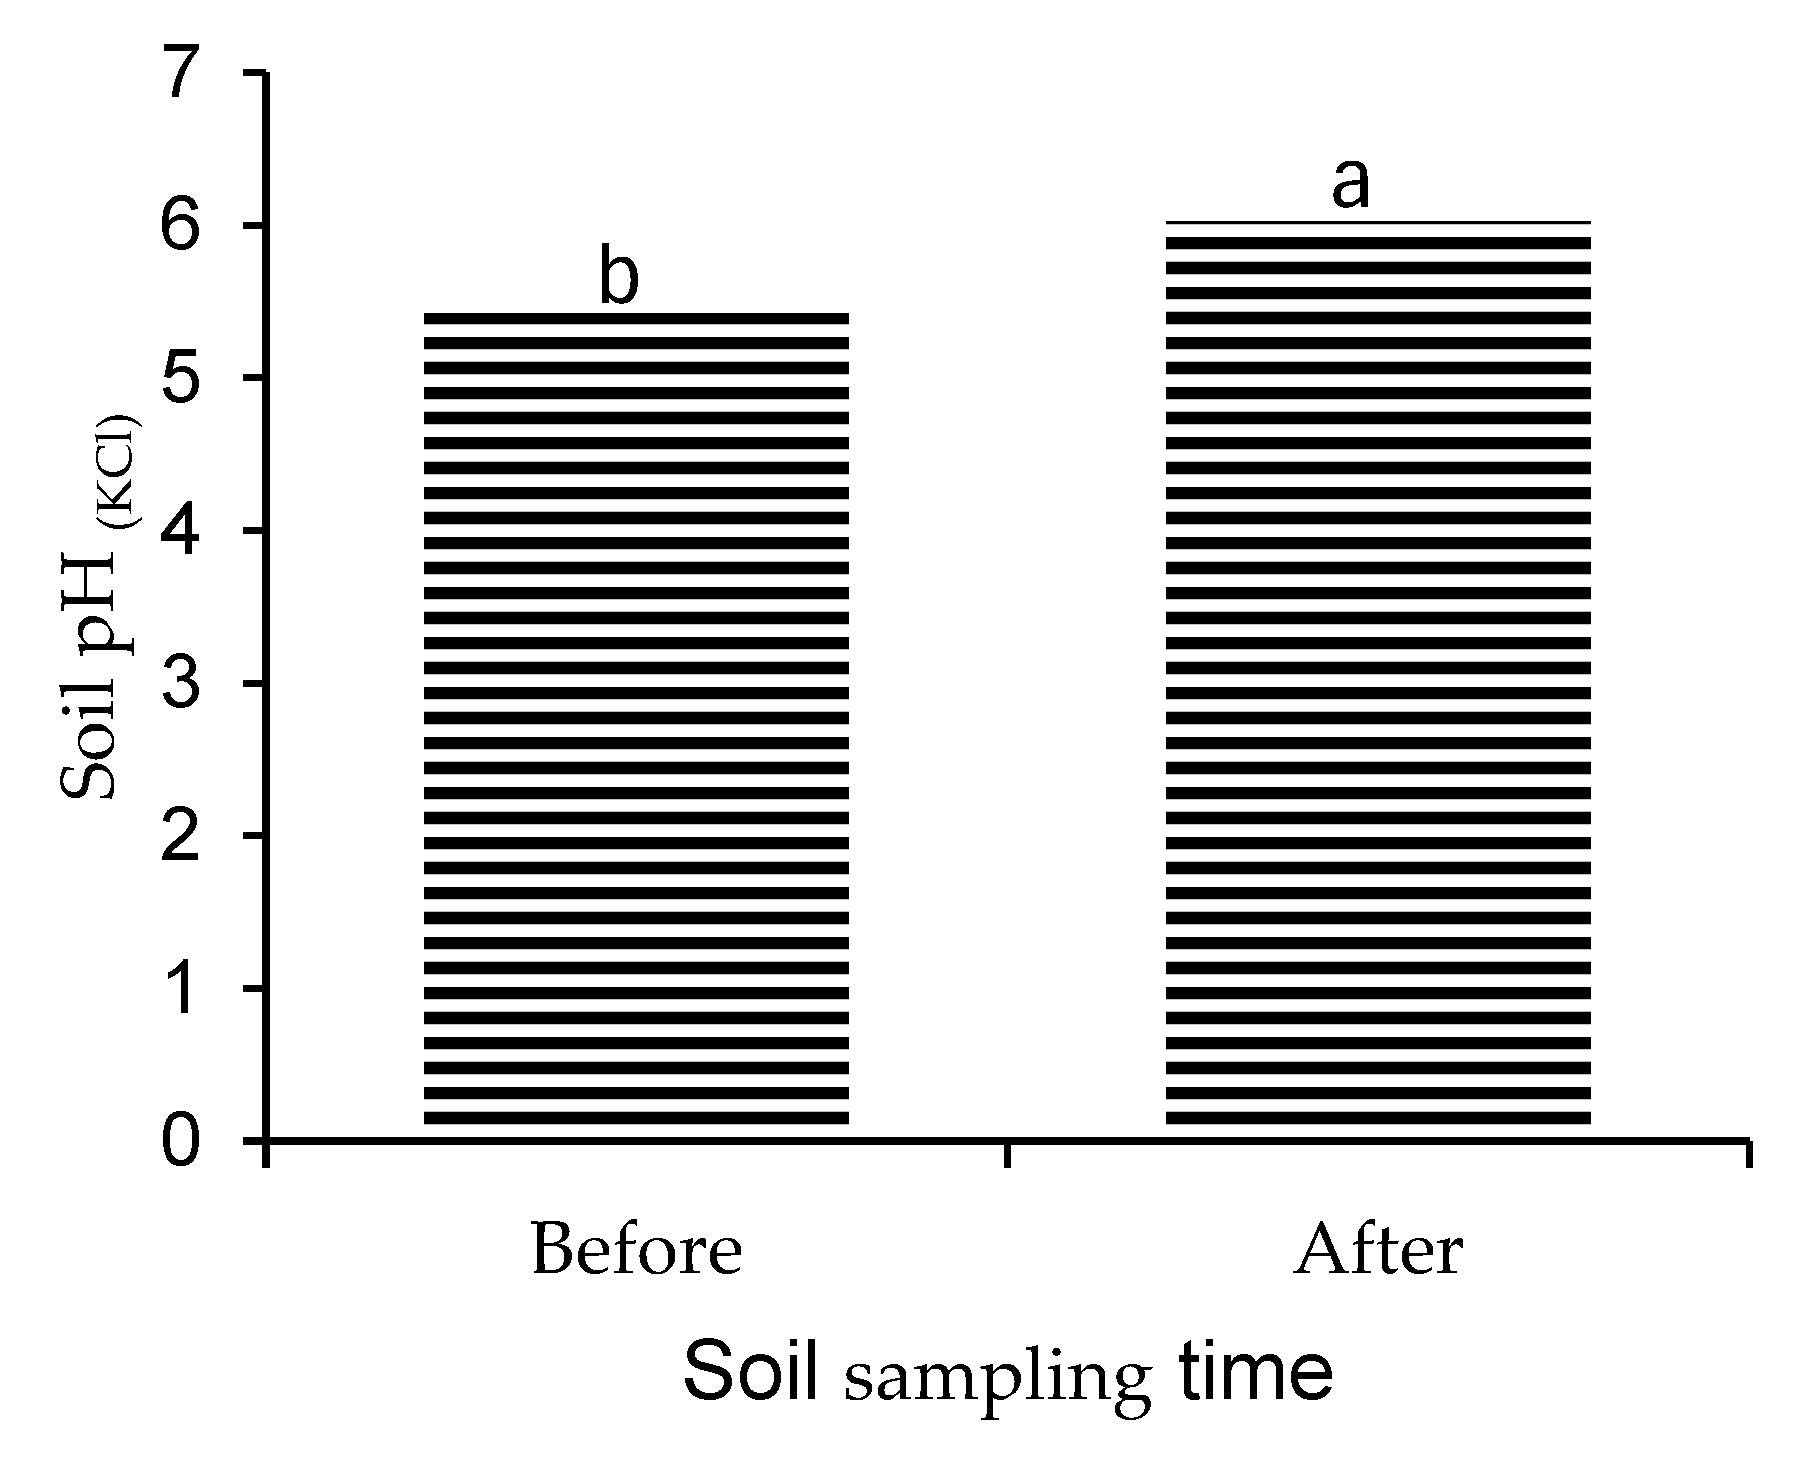
The initial soil pH prior to cover crop establishment was slightly below 5.5, which falls outside the optimal range (5.5–6.5) recommended for citrus production [32]. After one year, cover crop treatments significantly increased soil pH (p ≤ 0.05), with values falling within the recommended threshold for citrus growth (Figure 3). This indicates that even in the short term, cover crops can contribute to the amelioration of soil acidity in sandy citrus orchard soils.
The observed pH increase is likely related to the decomposition of cover crop residues, which contributed to higher organic matter inputs. The shift toward less acidic conditions is consistent with other studies reporting soil pH improvements under cover cropping in similar agroecosystems [33,34]. Organic matter inputs are known to influence soil pH through the release of basic cations and organic anions during microbial decomposition [35], which may explain the positive trend observed.
Despite the short study duration, these results suggest that cover cropping may be an effective strategy for improving pH-limited soils in citrus orchards. Additionally, the discussion of cover crop impacts on pH is complex and variable in the literature [36,37], these data clearly demonstrate that cover cropping can help alleviate soil acidity in citrus orchards.

3.2. Minimal Response of Soil pH After Planting Different Cover Crop Species

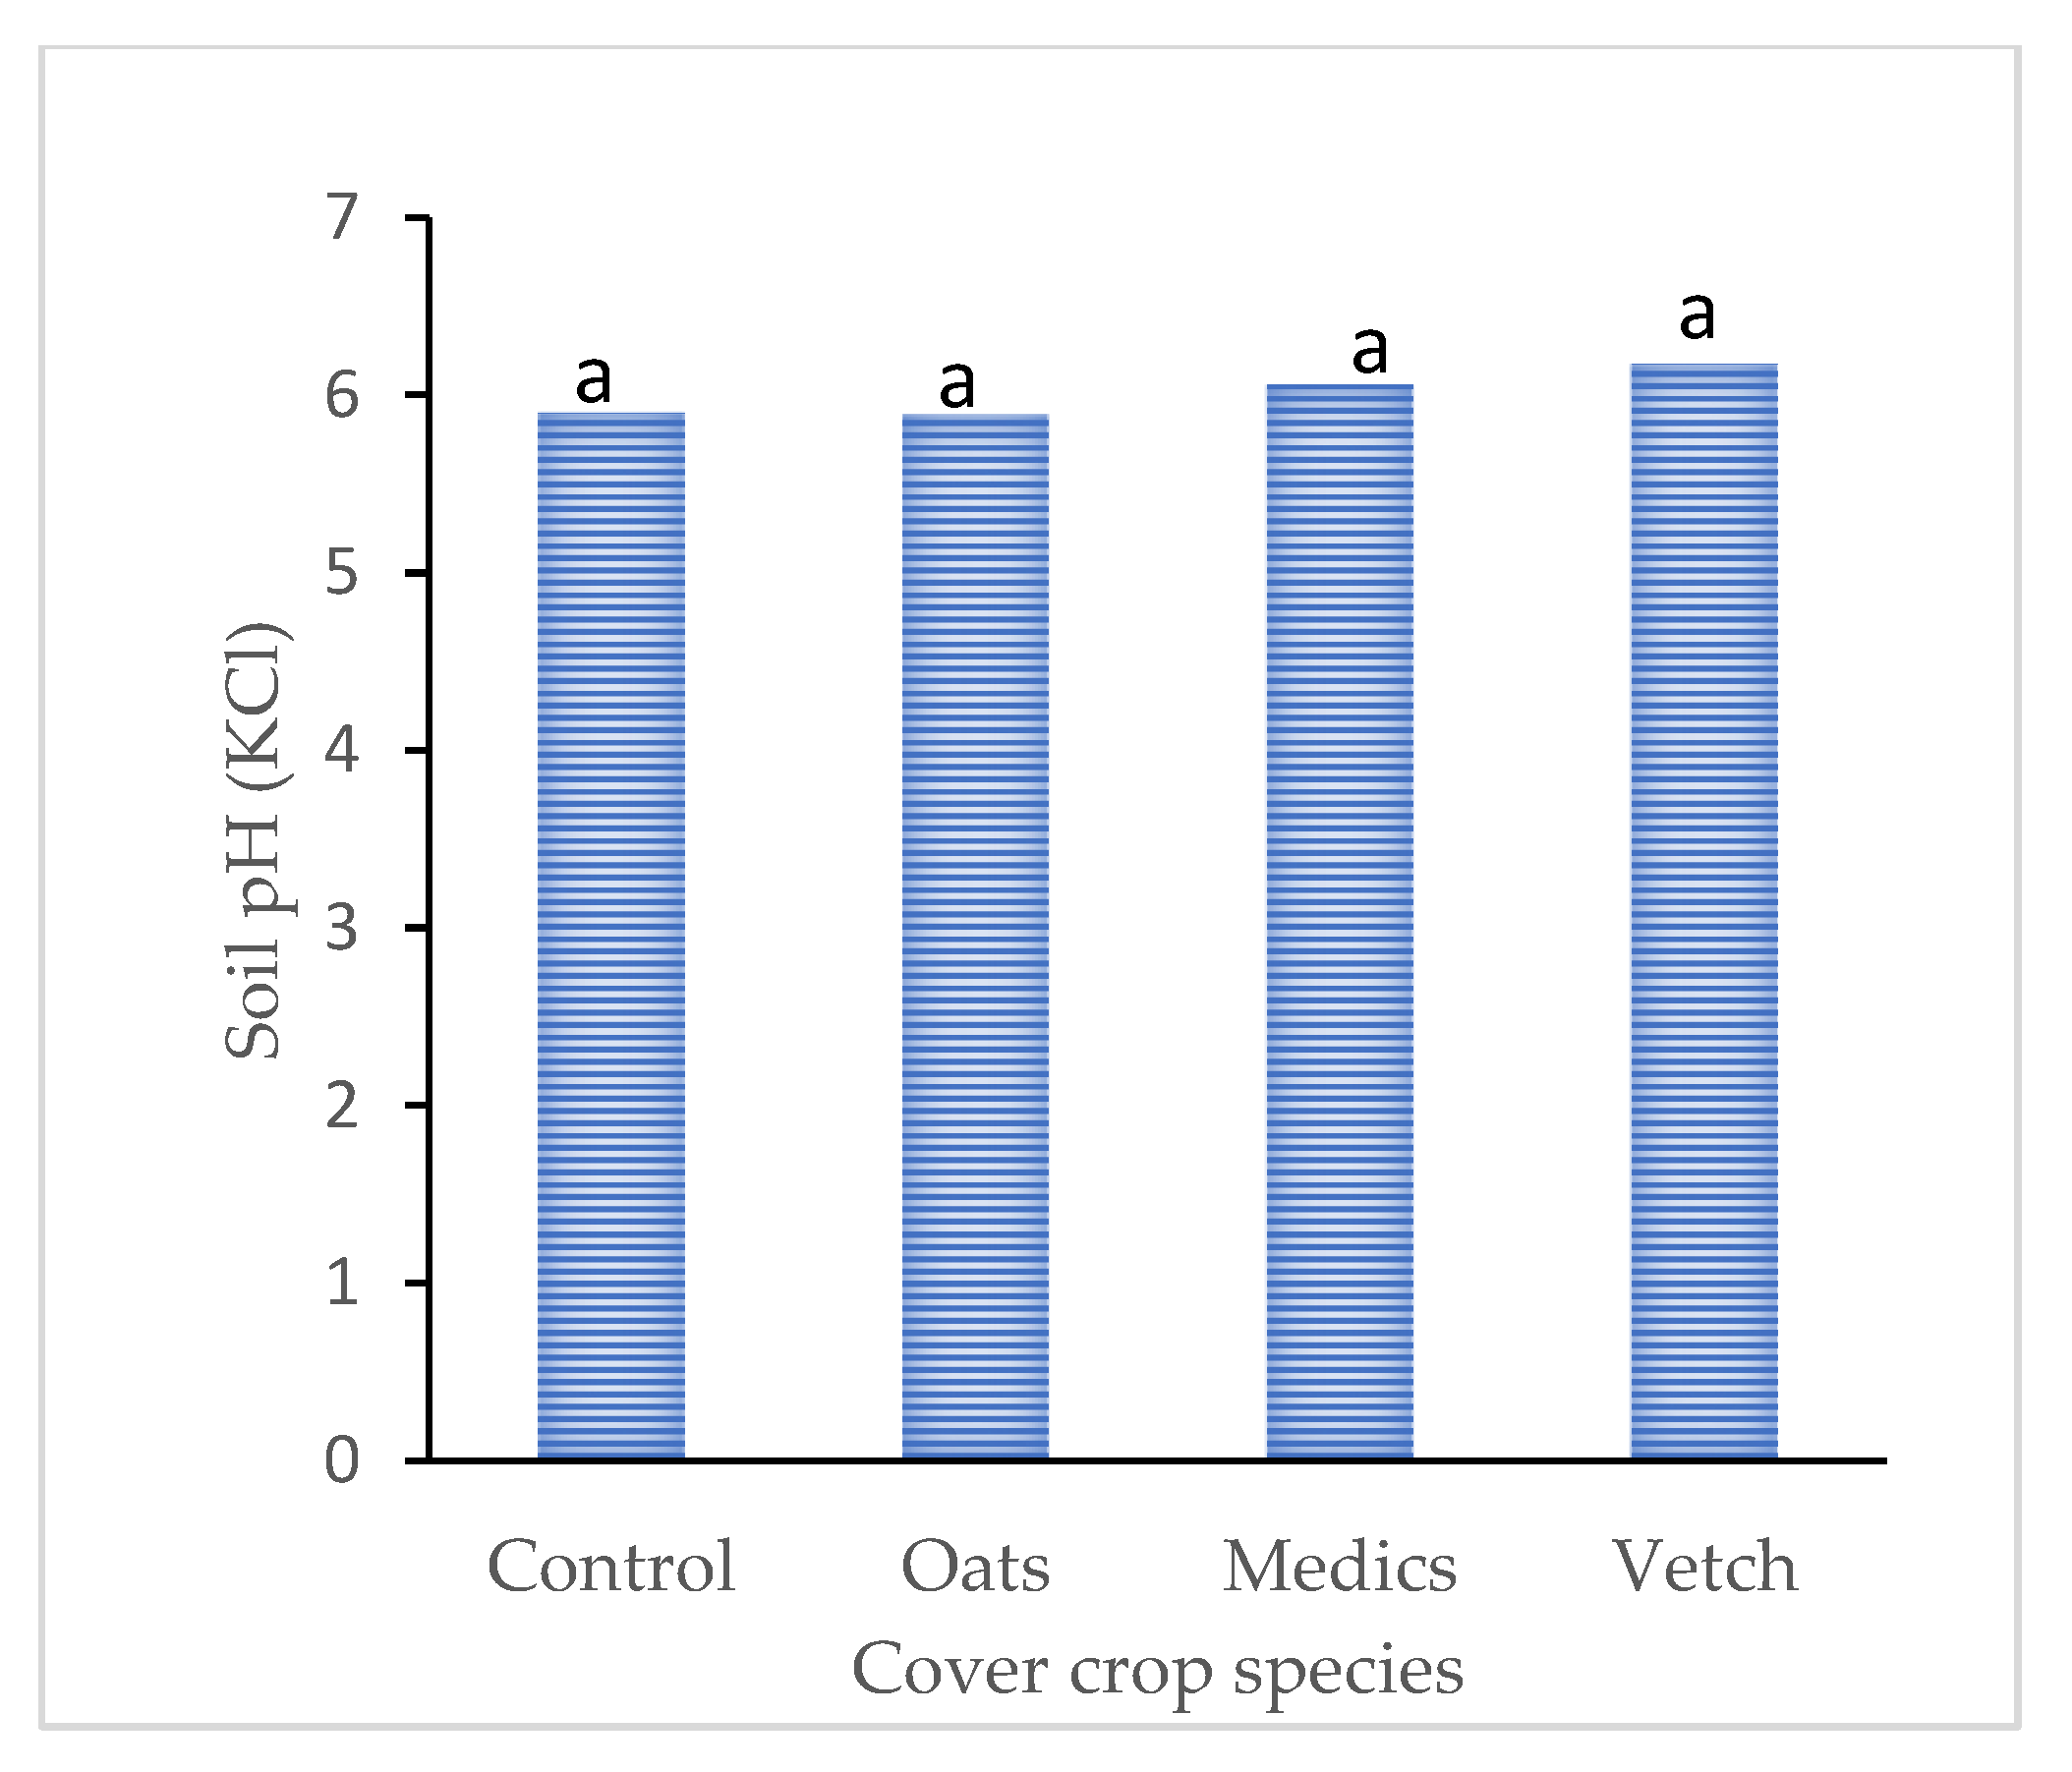
After one year of cover crop establishment, no statistically significant differences in soil pH were observed among the different cover crop species or compared to the no-cover control (Figure 4). However, a minimal trend was noted; leguminous species such as vetch and medics tended to increase soil pH marginally above 6, whereas the grass species (oats) maintained pH values below 6.
These findings suggest that, under the conditions of this study, the cover crop species evaluated had a minimal effect on modifying soil pH within the first year of implementation. The small increase observed in legume-based treatments may be attributed to the influence of biological nitrogen fixation and microbial decomposition processes that can temporarily elevate pH levels [34]. However, the absence of significant changes across treatments indicates that either the duration of cover cropping was insufficient to alter pH meaningfully or that the inherent buffering capacity of the sandy soil limited any species-specific effects.
Overall, these results align with previous studies reporting minimal changes in soil pH following cover crop incorporation, particularly in the short term [38]. However, some studies have reported increases or decreases in pH depending on residue type and decomposition dynamics [39,40]. Therefore, these findings reinforce the idea that such effects may be context-dependent and not universally observed.

3.3. Soil β-Glucosidase, Phosphatase and Urease Activities After One Year of Planting Cover Crops

There were no statistically significant effects on soil β-glucosidase, phosphatase or urease activities, regardless of soil depth (Table 3). However, relative to pre-planting levels, β-glucosidase activity showed a minimal decline, while phosphatase and urease activities exhibited minimal increases across both 0–10 cm and 10–20 cm depths.
The small decrease in β-glucosidase activity may be related to the modest increase in soil pH observed in legume-based treatments, as this enzyme is known to be sensitive to pH shifts [7]. In contrast, the minimal increases in phosphatase and urease activities could reflect improved microbial activity and enhanced organic matter inputs from cover crop biomass. Although these changes were not statistically significant, they suggest early-stage biological responses to cover cropping, particularly in surface soils where organic inputs are more concentrated.
These trends are consistent with previous findings that reported variable enzyme responses in the initial years of cover crop integration, often depending on soil type, organic matter turnover and microbial dynamics [41,42]. The greater activity at shallow depths also aligns with expectations, as surface layers typically receive higher inputs from both above-ground residues and root exudates [43].
While nitrogen and phosphorus cycling enzymes are critical for citrus production, particularly for fruit development and quality [44,45], the short duration of this study and the lack of significant effects suggest that longer-term monitoring is necessary to assess whether these early enzyme activity trends translate into meaningful soil fertility improvements.

3.4. Soil Urease, β-Glucosidase and Phosphatase Activities as Affected by Cover Crop Species

There were no statistically significant differences observed in β-glucosidase, phosphatase or urease activities at the 0–30 cm depth across the different cover crop species (Table 4). However, vetch exhibited the greatest numerical increases in β-glucosidase (22.45%) and urease (36.82%) activities compared to the control. Medics showed the highest increase in phosphatase activity (28.93%) at this depth. At 30–60 cm, enzyme activity remained largely unaffected, with the exception of urease, where medics showed significantly lower activity than vetch, oats and the control.
Although these changes were not statistically significant in most cases, the consistent trend of higher enzyme activities under legume species, particularly vetch, suggests a biological response to increased nitrogen input and improved residue quality. Legumes typically contribute residues with lower C:N ratios, which decompose more rapidly and enhance microbial activity factors known to stimulate enzyme production [46]. The higher β-glucosidase activity observed under vetch in the topsoil likely reflects the rapid decomposition of surface residues, while the relatively higher β-glucosidase under oats at depth may be attributed to greater root biomass input. Similar results were observed, whereby higher activities of β-glucosidase were obtained under legume cover crops [43].
These results are consistent with earlier studies that reported enhanced enzyme activities, particularly urease and phosphatase, under legume cover crops due to nitrogen fixation and increased microbial demand for nutrients [47,48]. However, the lack of statistically significant differences across most treatments indicates that either the duration of cover cropping was insufficient to generate strong enzyme responses or that enzyme activity is influenced more by overall biomass quantity and placement than species alone.

3.5. Soil Enzyme Activity and Termination Methods (Slashed and Non-Slashed Methods)

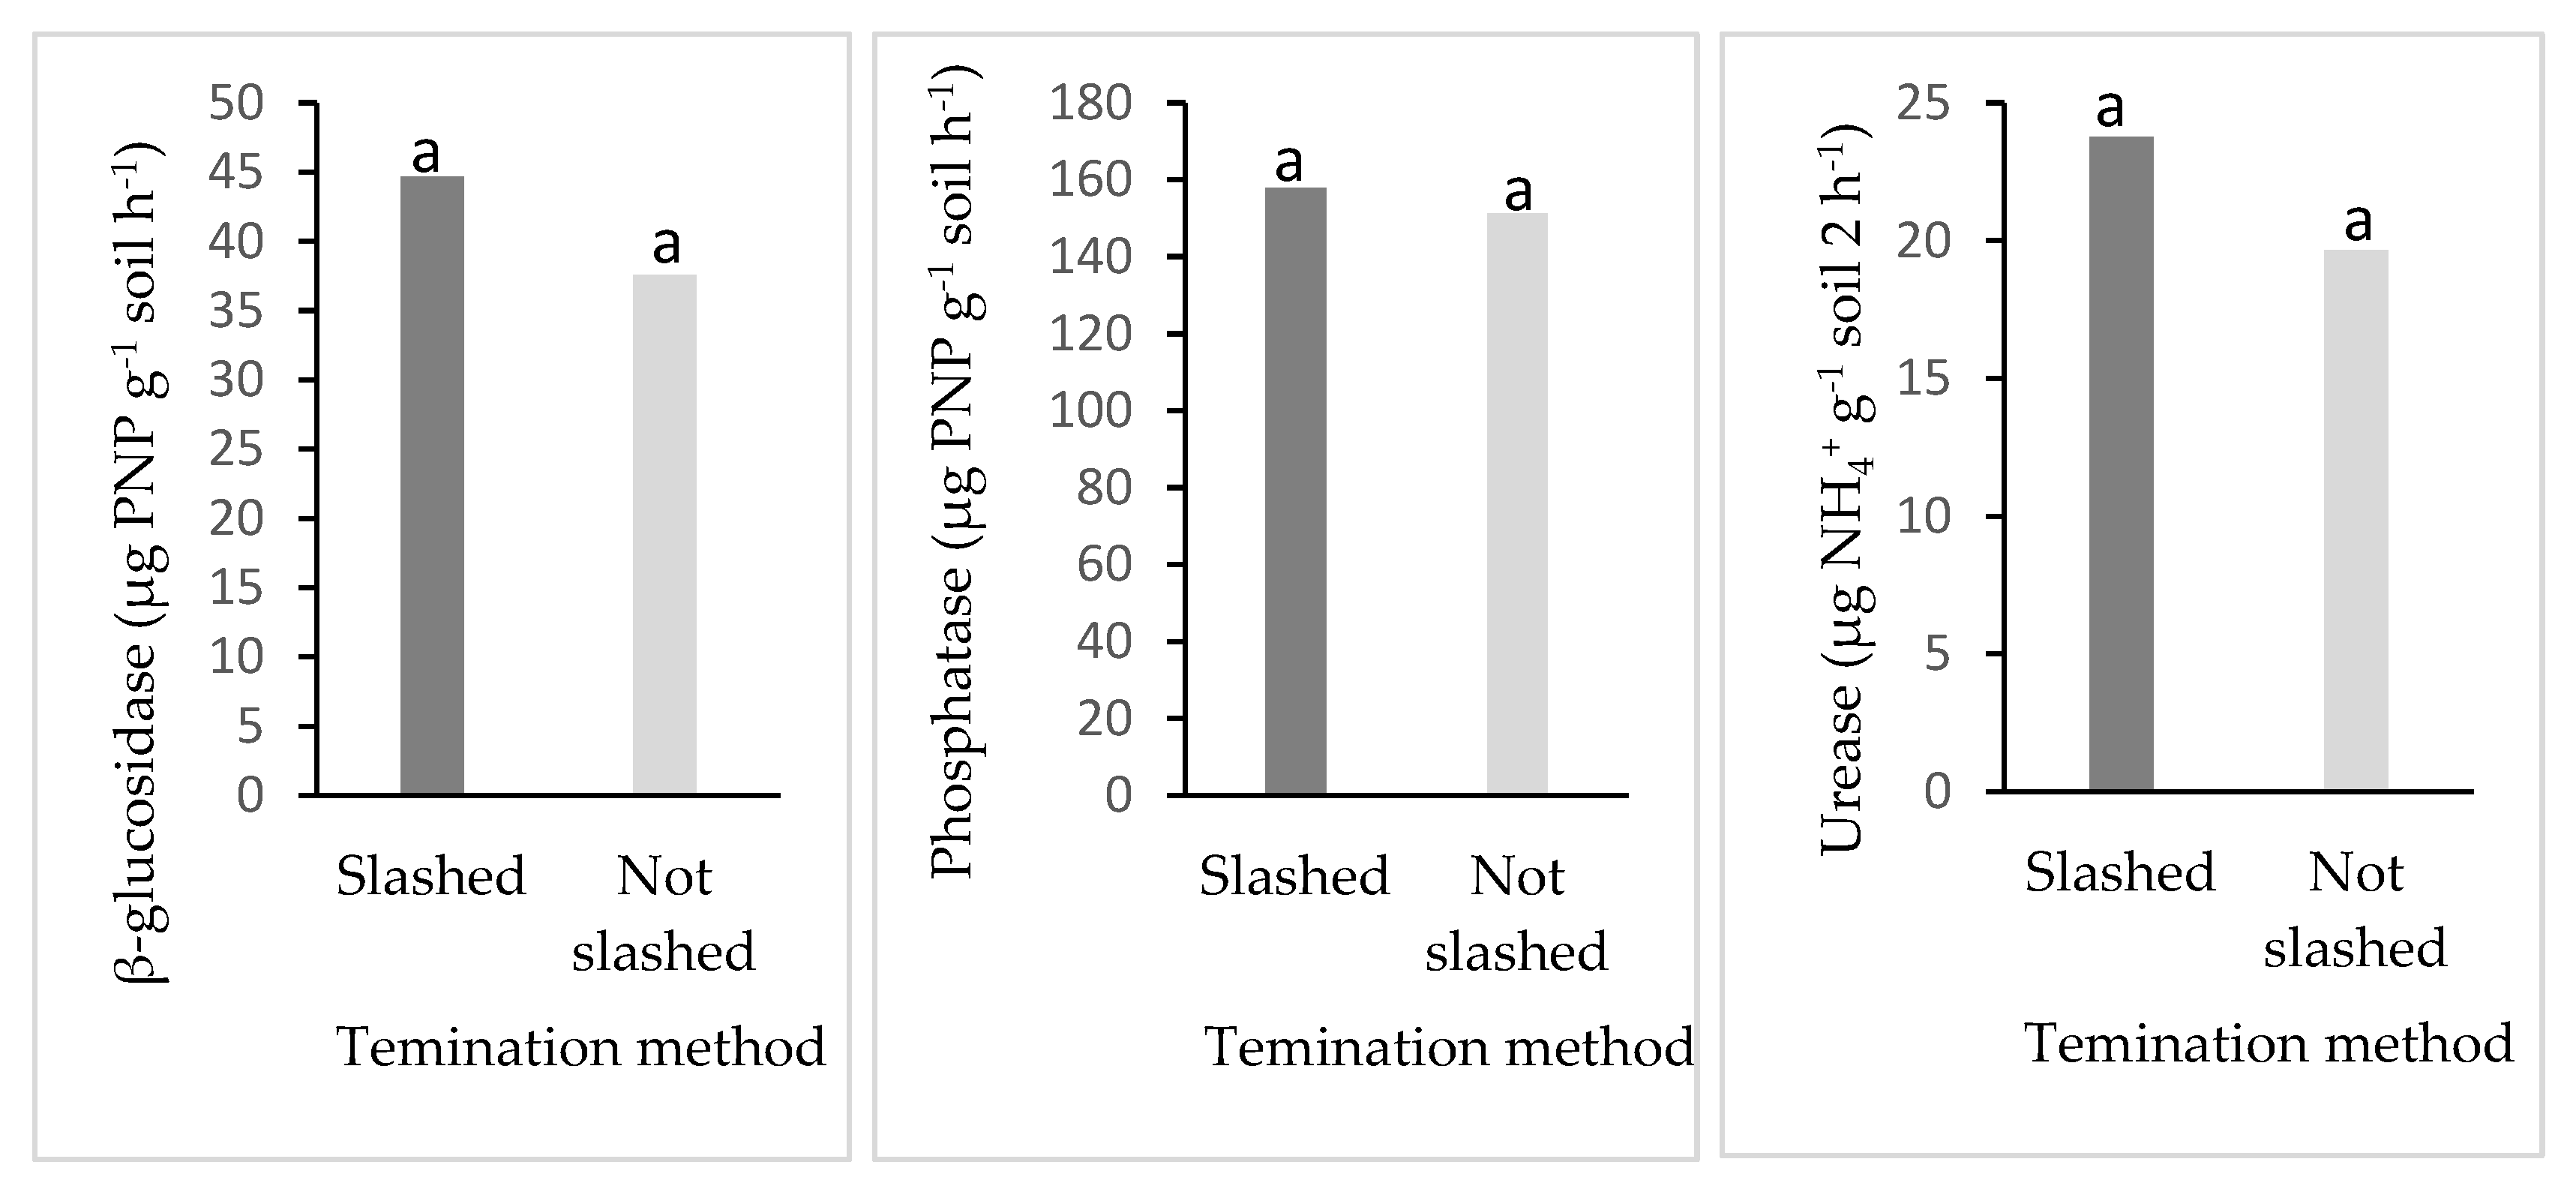
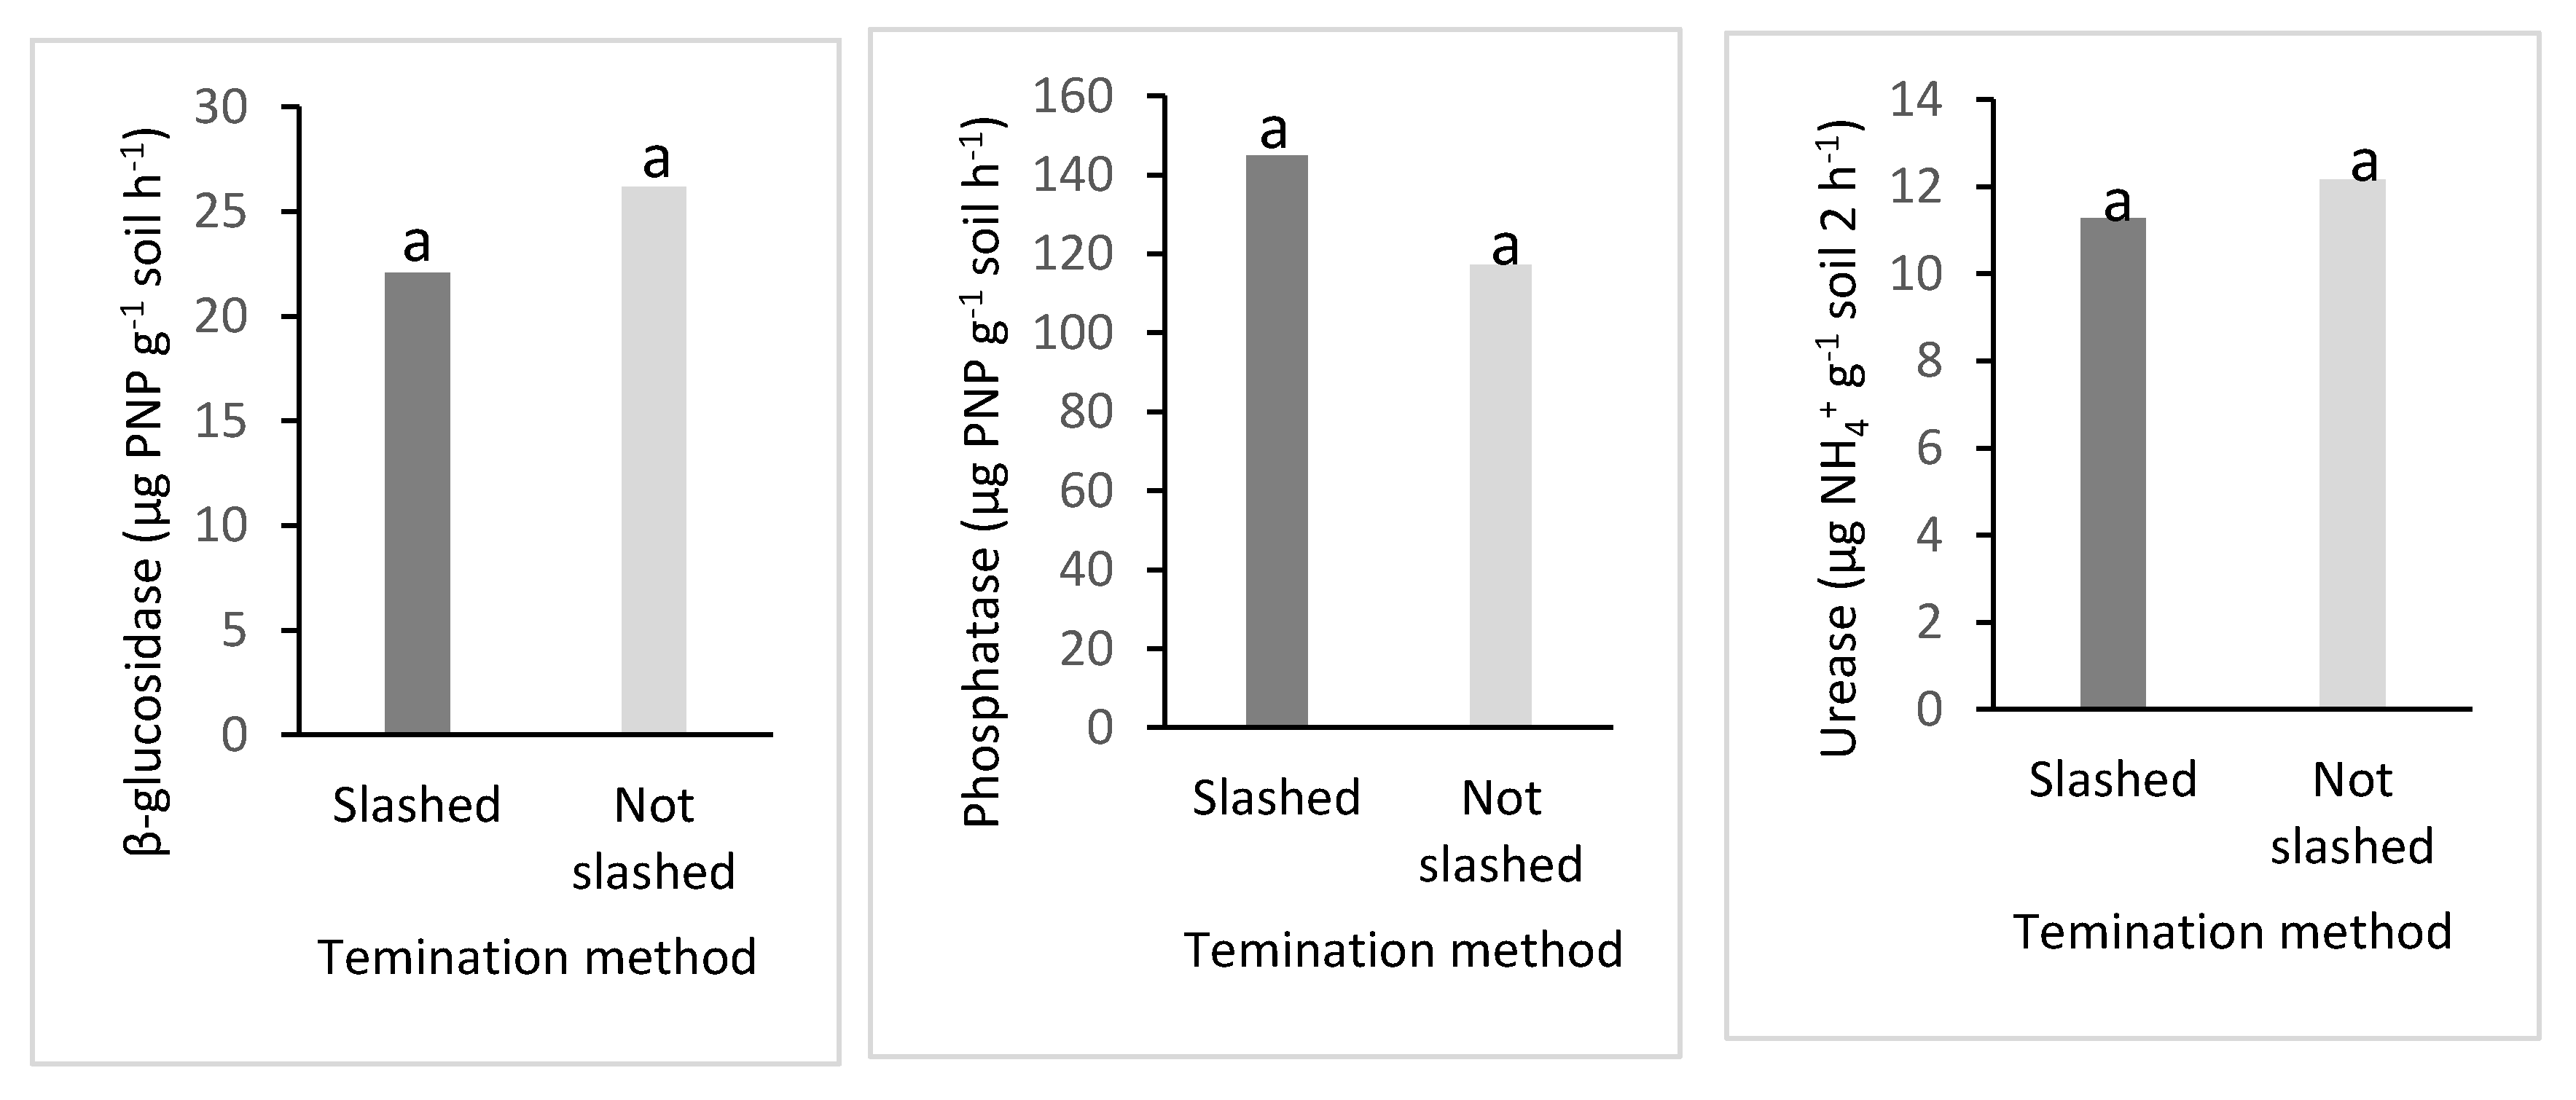
The method of cover crop terminations (slashed or non-slashed) had no statistically significant effect on the activities of β-glucosidase, phosphatase or urease at either soil depth (Figure 5 and Figure 6). Similar findings were observed where there was no significant difference in slashed and non-slashed methods after one year of introducing cover crops [26]. This suggests that, within the timeframe of this study, the placement of cover crop residues and mode of termination did not substantially influence soil microbial activity or associated enzymatic processes.
Although some previous studies have reported enhanced enzyme activity following mechanical termination due to faster residue decomposition and nitrogen mineralization [49,50], such effects were not evident in this trial. Likewise, concerns about potential inhibitory effects of herbicide-based termination on microbial function and enzyme activity [51] were not supported by these data, possibly due to limited herbicide persistence or microbial adaptation under field conditions.
These results indicate that, at least in the short term, the choice between slashed and non-slashed termination methods may not significantly impact soil biological indicators such as enzyme activity in citrus orchards. Longer-term studies may be required to determine whether cumulative effects emerge over multiple seasons.

3.6. Correlation Between Soil Carbon, Soil Moisture and Soil Enzyme Activities Using Pearson Method

The correlation between soil carbon, soil moisture, and enzyme activities plays a crucial role in understanding soil nutrient cycling. A negative correlation between soil carbon and soil moisture was observed, indicating that as soil carbon content increases, soil moisture decreases (Table 5). This inverse relationship suggests that higher organic carbon levels may modify soil structure, leading to changes in water retention capacity [52,53]. A weak correlation was observed between soil carbon and β-glucosidase, acid phosphatase, and urease activities. A negative correlation was also observed between soil moisture and β-glucosidase and urease activities, while acid phosphatase presented a weak relationship with soil moisture. This finding implies that soil moisture may have differential effects on enzyme activities, possibly due to the sensitivity of microbial communities [15].
Additionally, β-glucosidase exhibited a negative relationship with soil moisture and weak correlation with soil carbon but a strong positive relationship with acid phosphatase and urease activities. This strong relationship suggests that these enzymes may be influenced by similar soil or environmental conditions. Acid phosphatase displayed a weak correlation with soil carbon, moisture and urease, while it presented a strong positive correlation with β-glucosidase, indicating that phosphatase activity may be more closely linked to carbohydrate metabolism processes [7]. Urease activity demonstrated varied relationships, showing a negative correlation with soil moisture, a weak relationship with soil carbon and acid phosphatase and a strong positive correlation with β-glucosidase activity. These findings highlight the complexity of enzymatic interactions in soil and the potential regulatory role of carbon and moisture levels.
Overall, the results indicate that soil moisture is negatively affected by increases in soil carbon, β-glucosidase, and urease activities. However, strong positive relationships were observed among β-glucosidase, acid phosphates and urease activities, highlighting the interconnected nature of soil biochemical properties and nutrient cycling.

3.7. Contribution of Variables and Factors (Soil Carbon, Soil Moisture and Soil Enzyme Activities) Using Principal Component Analysis

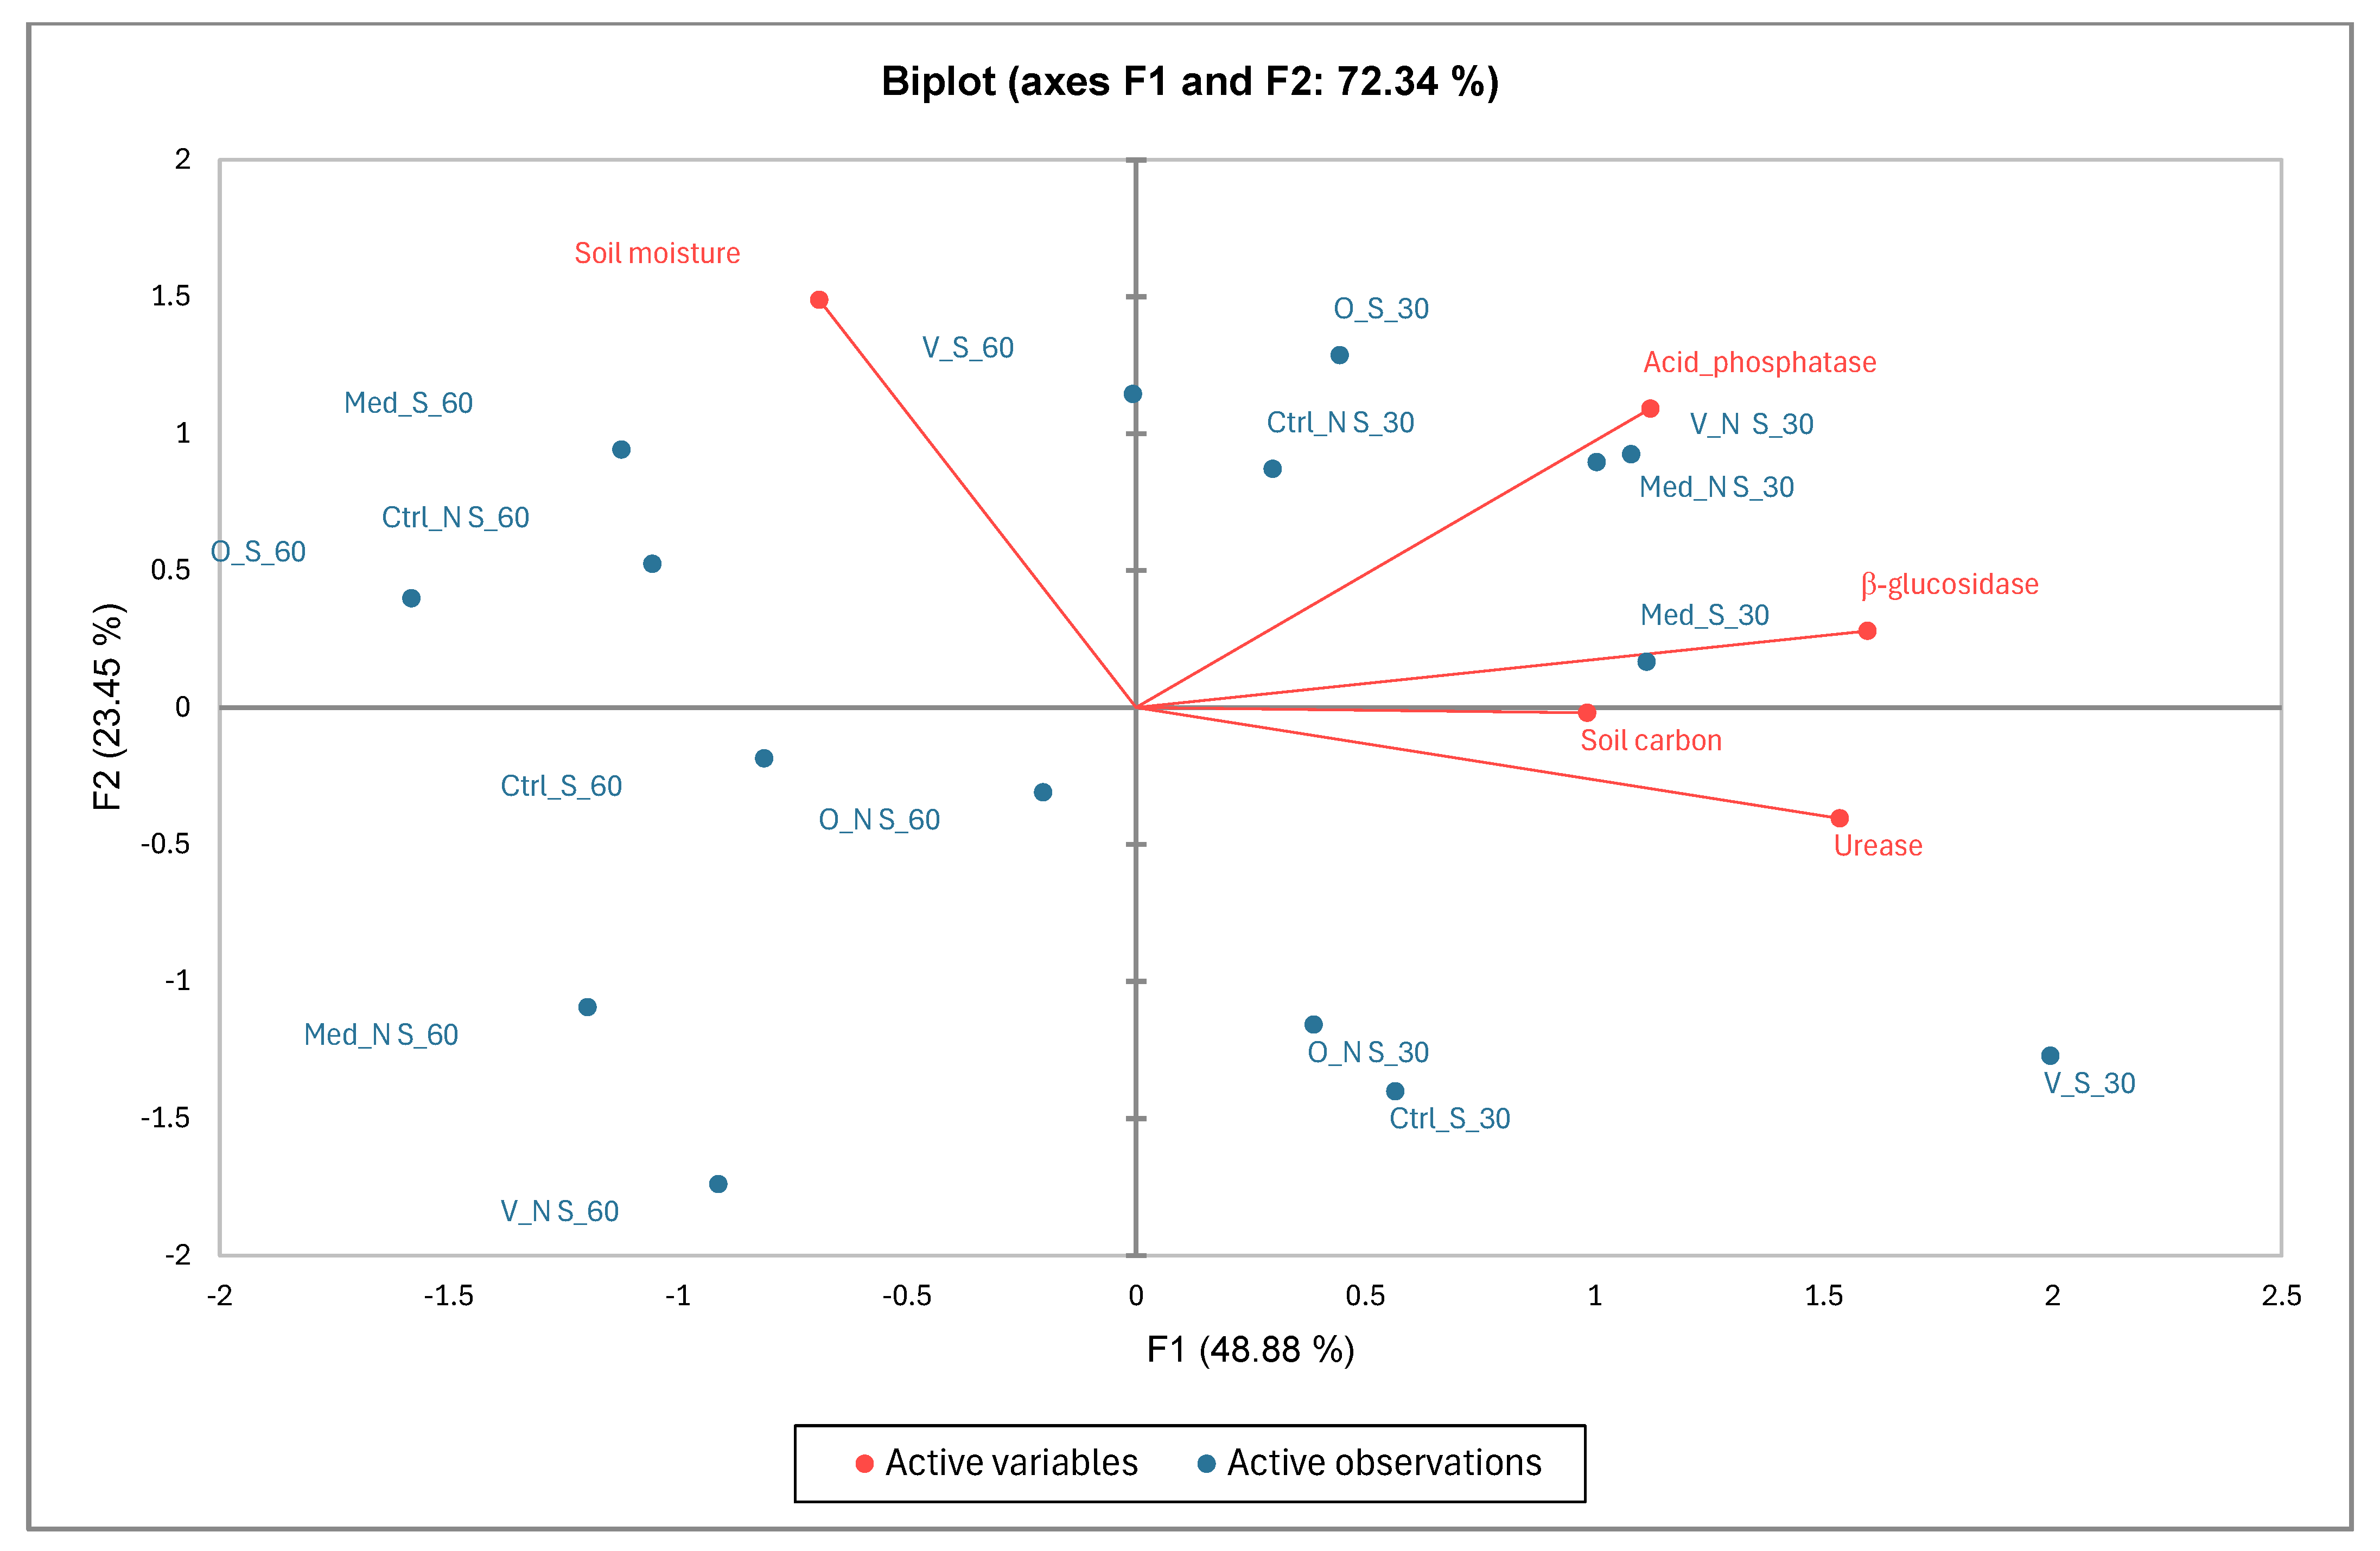
Soil moisture demonstrated a negative correlation with soil carbon, β-glucosidase, acid phosphatase, and urease activities (Figure 7). Notably, soil moisture was strongly correlated with deeper soil depths (60 cm), while soil carbon, β-glucosidase, acid phosphatase, and urease activities were more highly correlated with shallower depths (30 cm), irrespective of the cover crop type and termination method. This pattern shows that soil moisture had a weaker relationship with shallow depths, while soil carbon and enzymatic activities were less correlated with deeper soil depths. Additionally, the correlation between deeper and shallower soil depths remained weak across different cover cropping and termination methods. These findings align with previous research indicating that microbial activity and organic matter content are typically higher in surface soils due to greater organic inputs and root activity, whereas deeper soils retain more moisture due to lower evaporation rates and limited organic matter inputs [54,55].

3.8. Correlation Between Soil Carbon, Soil Moisture, Soil Activities, Cover Crop and Weed Dry Weights Using Pearson Method

Soil carbon displayed a negative relationship with soil moisture, acid phosphatase, urease activity, and cover crop dry weight, while showing a weak positive correlation with β-glucosidase activity and weed dry weight (Table 6). Soil moisture showed a weak positive relationship with both cover crop and weed dry weights but a negative relationship with soil carbon and enzyme activities. β-glucosidase activity was negatively correlated with soil moisture, cover crop and weed dry weight but showed a weak positive relationship with acid phosphatase and a strong positive correlation with urease activity. Acid phosphatase activity exhibited a weak positive correlation with both β-glucosidase and urease activities while negatively correlating with soil carbon, moisture, and both cover crop and weed dry weights. Urease activity was negatively correlated with soil carbon, moisture, and weed dry weight but showed weak to strong positive correlations with acid phosphatase and β-glucosidase activities, respectively. Cover crop dry weight was negatively related to soil carbon, weed dry weight and both acid phosphatase and β-glucosidase activities while showing a weak positive relationship with soil moisture and urease activity. Weed dry weight had negative correlations with soil enzyme activities and cover crop dry weight while displaying a weak positive correlation with soil carbon and moisture.

3.9. Contribution of Variables and Factors (Soil Carbon, Soil Moisture, Soil Activities, Cover Crop and Weed Dry Weights) Using Principal Component Analysis

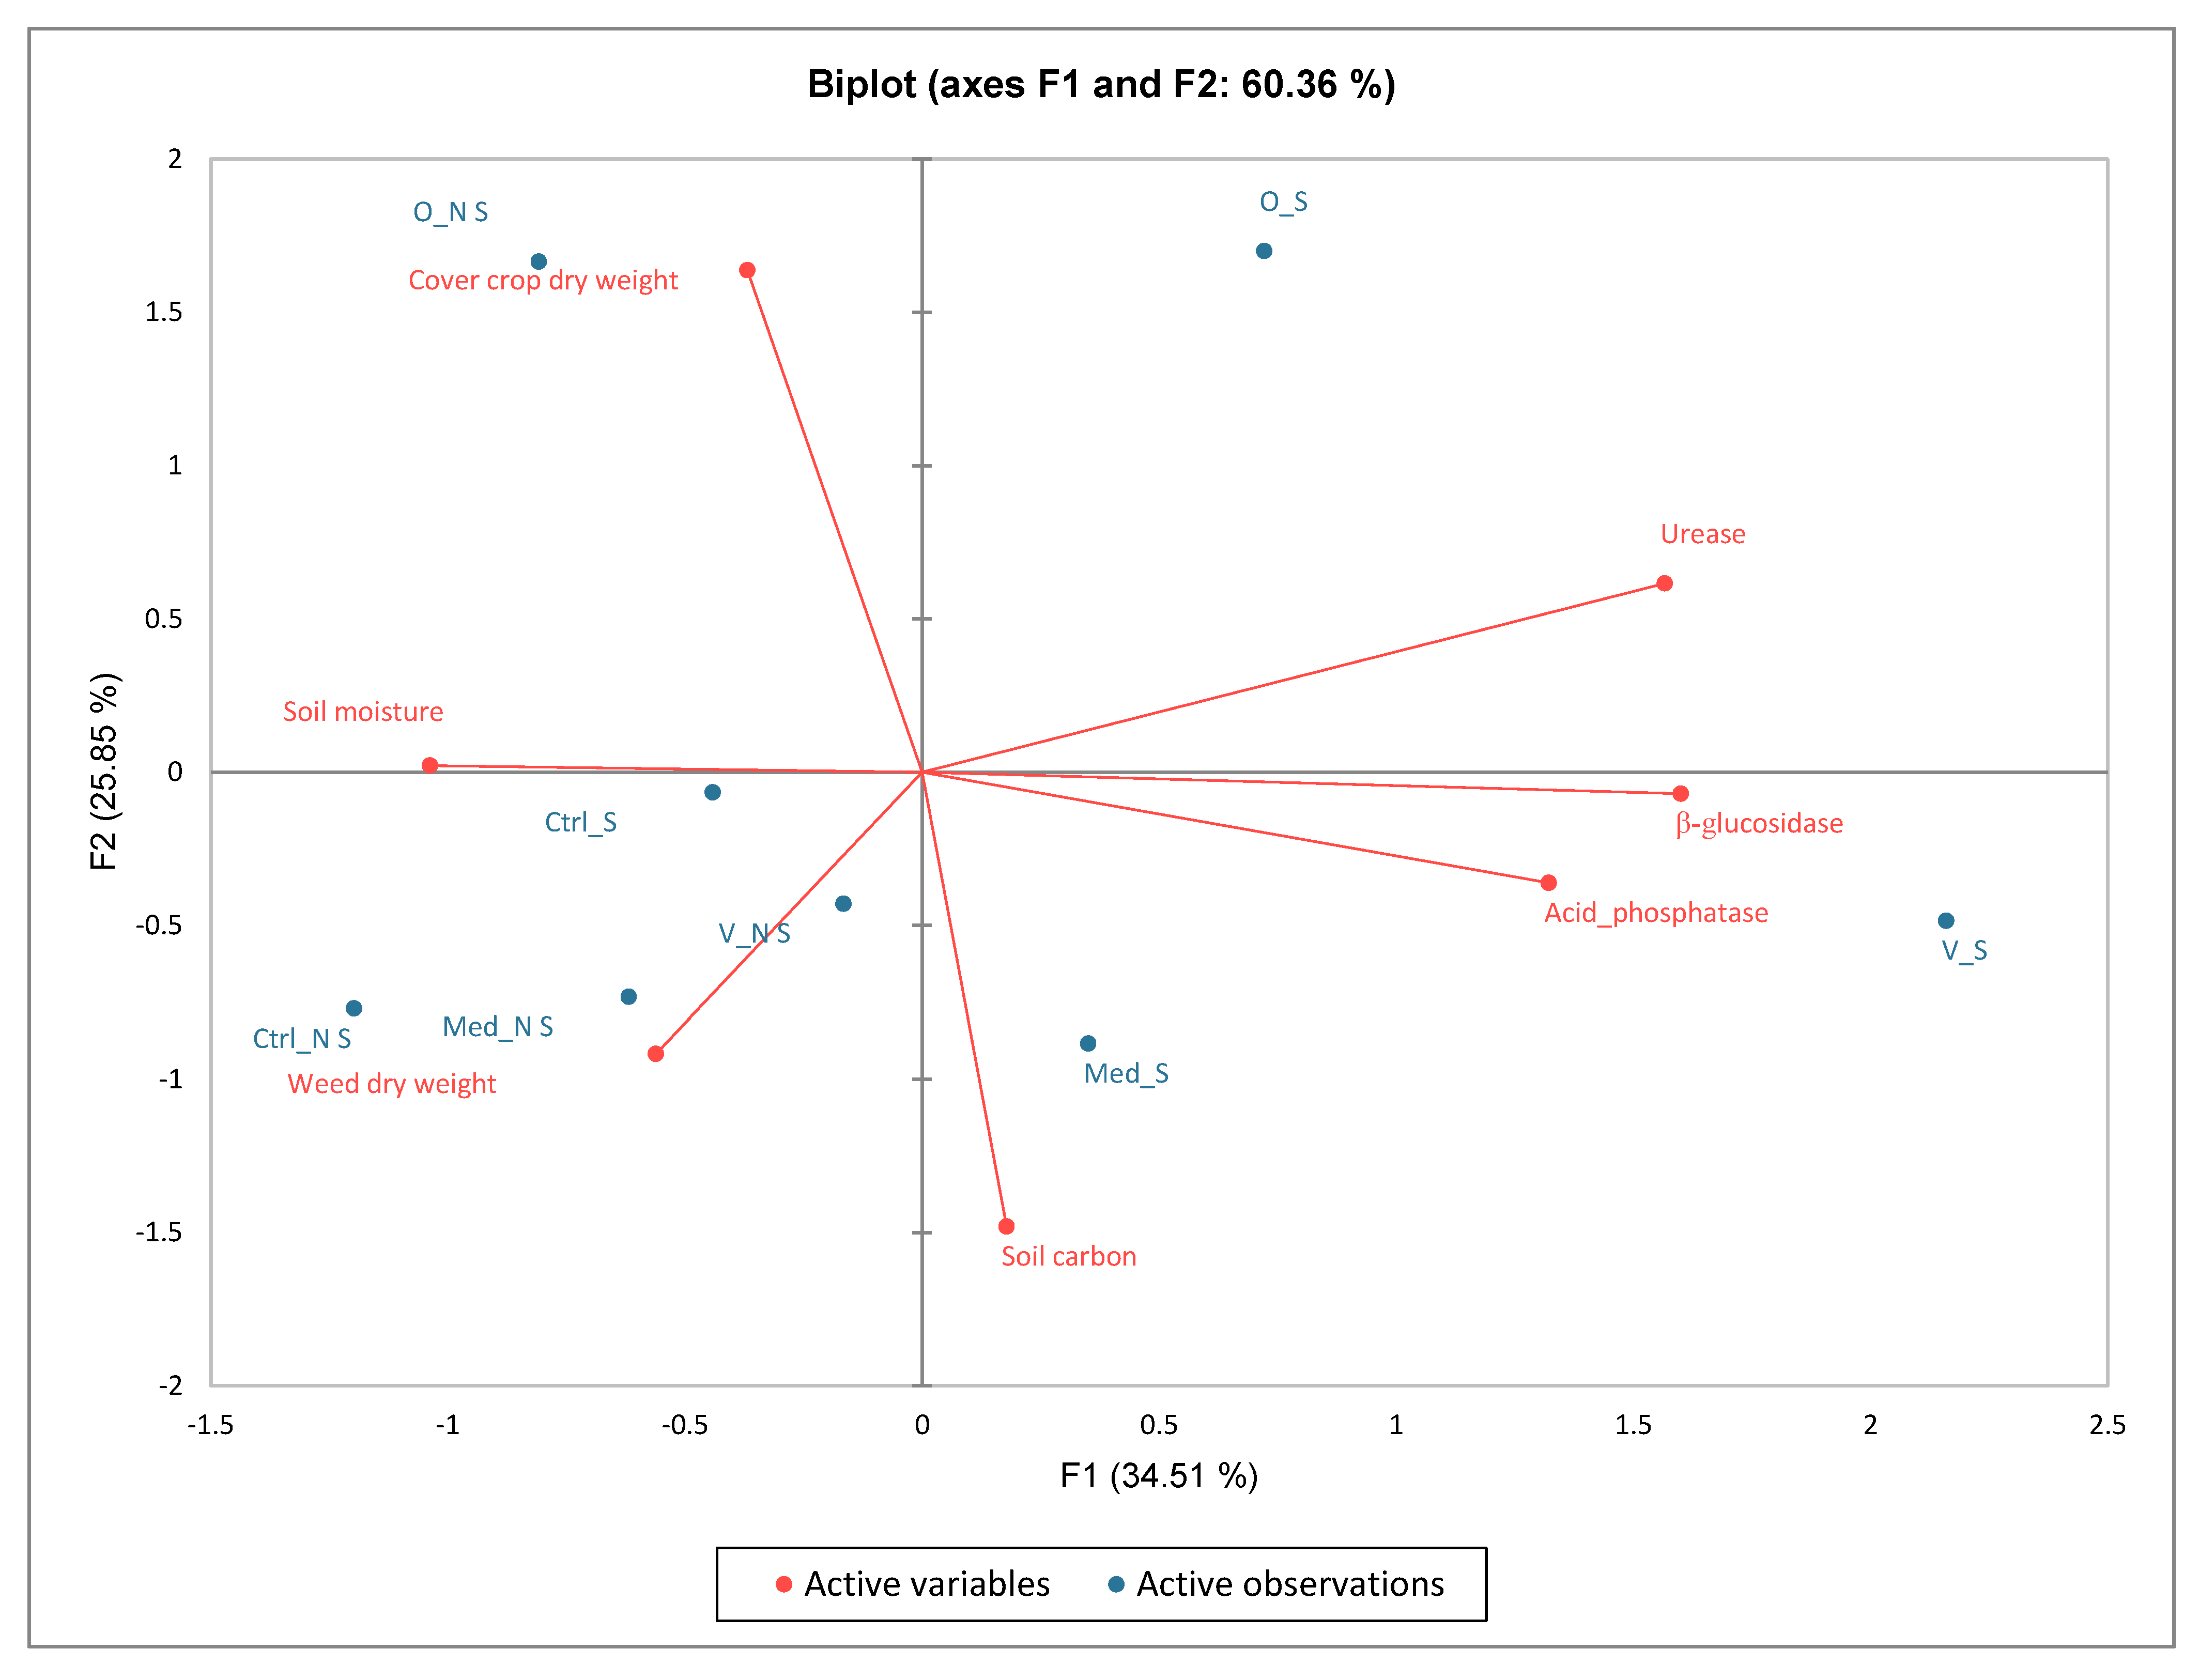
Soil moisture, cover crop, and weed dry weight displayed a low correlation with soil carbon and enzyme activities (Figure 8). Specifically, non-slashed treatments of cover crops and the control (both slashed and non-slashed) showed weak correlations with soil enzyme activities and soil carbon content. However, these treatments demonstrated strong positive correlations with soil moisture, cover crop dry weight, and weed dry weight. In contrast, slashed cover crops displayed higher correlations with both soil carbon content and enzyme activities, suggesting a more pronounced influence of cover crop management practices on soil properties [56]. These findings highlight the role of cover crop management, particularly slashing, in influencing soil quality indicators, including microbial activity and carbon sequestration [15].

4. Conclusions

This study assessed the short-term effects of different cover crop species and termination methods on soil pH and enzyme activities (β-glucosidase, phosphatase, and urease) in a citrus orchard with sandy soils. There was a positive influence on soil pH after planting cover crops compared to before planting after one year. However, no statistically significant differences were observed in soil pH or enzyme activities among cover crop species or between slashed and non-slashed termination methods. Although minimal trends were noted such as marginal increases in enzyme activities under leguminous cover crops, these changes were not sufficient to indicate a strong or consistent treatment effect. However, correlation and PCA analyses confirmed that soil enzyme responses were more influenced by intrinsic soil conditions (e.g., depth, carbon, moisture) than by cover crop species or termination strategy.
The findings suggest that the influence of cover crops on key biological soil indicators may be limited during early stages, especially in sandy soils with low organic matter. These results emphasize the importance of longer-term monitoring, the consideration of soil texture and residue management strategies in evaluating the benefits of cover cropping in citrus orchards. Future research should focus on multi-seasonal impacts, microbial community shifts and cumulative soil health benefits to better understand the pathways by which cover crops affect soil quality in citrus orchards.

Author Contributions

S.S.: conceived and designed the experiments; performed the experiments; and wrote the paper. N.J. and A.R.M.: conceived and designed the experiments and contributed to writing the paper. All authors have read and agreed to the published version of the manuscript.

Funding

This work was supported by the Agricultural Research Council (Project no: P04000297) and Citrus Research Institute (Project no:1372).

Data Availability Statement

The data that support the findings of this study are available from the corresponding author upon reasonable request.

Acknowledgments

We acknowledge the support of the Agricultural Research Council (ARC) and Citrus Research Institute (CRI) for funding the study. We thank Olwethu Sindesi for spending a lot of time reviewing this work. We would like to send a word of gratitude to Thembakazi Silwana and Simphiwe Mhlontlo from the Department of Rural Development and Agrarian Reform for their support and allowing me to work on this article. We also thank the technical team led by Karen Freitag (Soil Science Department, ARC—Infruitec/Nietvoorbij) for their technical support.

Conflicts of Interest

The authors declare no conflicts of interest.

References

  1. De Bruin, A.M. An Evaluation of the Risks in South African Citrus Farming. Ph.D. Thesis, North-West University, Potchefstroom, South Africa, 2023. [Google Scholar]
  2. Mukhametzyanov, R.R.; Brusenko, S.V.; Khezhev, A.M.; Kelemetov, E.M.; Kirillova, S.S. Changing the Global Production and Trade of Citrus Fruits. In Sustainable Development of the Agrarian Economy Based on Digital Technologies and Smart Innovations; Springer Nature: Cham, Switzerland, 2024; pp. 19–24. [Google Scholar]
  3. El-Otmani, M.; Ait-Oubahou, A.; Zacarías, L. Citrus spp.: Orange, mandarin, tangerine, clementine, grapefruit, pomelo, lemon and lime. In Postharvest Biology and Technology of Tropical and Subtropical Fruits; Woodhead Publishing: Cambridge, UK, 2011; pp. 437–516. [Google Scholar]
  4. Bindraban, P.S.; van der Velde, M.; Ye, L.; Van den Berg, M.; Materechera, S.; Kiba, D.I.; Tamene, L.; Ragnarsdóttir, K.V.; Jongschaap, R.; Hoogmoed, M.; et al. Assessing the impact of soil degradation on food production. Curr. Opin. Environ. Sustain. 2012, 4, 478–488. [Google Scholar] [CrossRef]
  5. Mulinge, J.; Saha, H.; Mounde, L.; Wasilwa, L. Effects of legume cover crops on orange (Citrus sinensis) fruit weight and brix. Int. J. Plant Soil Sci. 2018, 21, 1–9. [Google Scholar] [CrossRef]
  6. Karaca, A.; Cetin, S.C.; Turgay, O.C.; Kizilkaya, R. Soil enzymes as indication of soil quality. In Soil Enzymology; Springer: Berlin/Heidelberg, Germany, 2011; pp. 119–148. [Google Scholar]
  7. Adetunji, A.T.; Lewu, F.B.; Mulidzi, R.; Ncube, B. The biological activities of β-glucosidase, phosphatase and urease as soil quality indicators: A review. J. Soil Sci. Plant Nutr. 2017, 17, 794–807. [Google Scholar] [CrossRef]
  8. Knowler, D.; Bradshaw, B. Farmers’ adoption of conservation agriculture: A review and synthesis of recent research. Food Policy 2007, 32, 25–48. [Google Scholar] [CrossRef]
  9. Storr, T. The Effect of Cover Crops on Soil Quality Indicators in a Cereal and Salad Rotation. Ph.D. Thesis, Cranfield University, Cambridgeshire, UK, 2019. [Google Scholar]
  10. Thilakarathna, M.S.; Serran, S.; Lauzon, J.; Janovicek, K.; Deen, B. Management of manure nitrogen using cover crops. Agron. J. 2015, 107, 1595–1607. [Google Scholar] [CrossRef]
  11. Sievers, T.; Cook, R.L. Aboveground and root decomposition of cereal rye and hairy vetch cover crops. Soil Sci. Soc. Am. J. 2018, 82, 147–155. [Google Scholar] [CrossRef]
  12. Das, S.K.; Varma, A. Role of enzymes in maintaining soil health. In Soil Enzymology; Springer: Berlin/Heidelberg, Germany, 2011; pp. 25–42. [Google Scholar]
  13. Li, H.; Song, Y.; Li, Q.; He, J.; Song, Y. Effective microbial calcite precipitation by a new mutant and precipitating regulation of extracellular urease. Bioresour. Technol. 2014, 167, 269–275. [Google Scholar] [CrossRef]
  14. Gil-Sotres, F.; Trasar-Cepeda, C.; Leirós, M.C.; Seoane, S. Different approaches to evaluating soil quality using biochemical properties. Soil Biol. Biochem. 2005, 37, 877–887. [Google Scholar] [CrossRef]
  15. Adetunji, A.T. Impact of Cover Crop Species, Termination Stage and Termination Method on Soil Nitrogen, Organic Carbon and Enzyme Activities. Ph.D. Thesis, Cape Peninsula University of Technology, Cape Town, South Africa, 2019. [Google Scholar]
  16. Martinez, C.E.; Tabatabai, M.A. Decomposition of Biotechnology By-Products in Soils; American Society of Agronomy, Crop Science Society of America, and Soil Science Society of America: Madison, WI, USA, 1997; Volume 26, pp. 625–632. [Google Scholar]
  17. Ghosh, A.; Paul, R.; Sarkar, A.; Manna, M.C.; Bhattacharjya, S.; Alam, K.; Choudhury, S.; Mondal, P. Carbon-, Nitrogen-, Phosphorus-, and Sulfur-Cycling Enzymes and Functional Diversity in Agricultural Systems. In Agricultural Biocatalysis; Jenny Stanford Publishing: Uttar Pradesh, India, 2022; pp. 335–363. [Google Scholar]
  18. Merino, C.; Godoy, R.; Matus, F. Soil enzymes and biological activity at different levels of organic matter stability. J. Soil Sci. Plant Nutr. 2016, 16, 14–30. [Google Scholar]
  19. Makoi, J.H.; Ndakidemi, P.A. Selected soil enzymes: Examples of their potential roles in the ecosystem. Afr. J. Biotechnol. 2008, 7, 181–191. [Google Scholar]
  20. Gabasawa, A.I. Phosphorus cycle enzymes to remedy soil phosphorus deficiency. In Sustainable Agriculture Reviews 58: Phosphorus Use Efficiency for Sustainable Agriculture; Springer: Berlin/Heidelberg, Germany, 2022; pp. 177–205. [Google Scholar]
  21. Condron, L.M.; Turner, B.L.; Cade-Menun, B.J. Chemistry and dynamics of soil organic phosphorus. In Phosphorus: Agriculture and the Environment; Wiley Online Library: Hoboken, NJ, USA, 2005; Volume 46, pp. 87–121. [Google Scholar]
  22. Soil Classification Working Group (SCWG). Soil Classification: A Taxonomic System for South Africa; Department of Agricultural Development: Pretoria, South Africa, 1991; Volume 15.
  23. Jannoyer, M.L.; Le Bellec, F.; Lavigne, C.; Achard, R.; Malézieux, E. Choosing cover crops to enhance ecological services in orchards: A multiple criteria and systemic approach applied to tropical areas. Procedia Environ. Sci. 2011, 9, 104–112. [Google Scholar] [CrossRef]
  24. Silwana, S.; Mulidzi, A.R.; Jovanovic, N. Evaluating the effects and benefits of cover crops in citrus orchards: A review. S. Afr. J. Plant Soil 2023, 40, 117–126. [Google Scholar] [CrossRef]
  25. Oliveira, F.É.R.D.; Oliveira, J.D.M.; Xavier, F.A.D.S. Changes in soil organic carbon fractions in response to cover crops in an orange orchard. Rev. Bras. Cienc. Solo 2016, 40, e0150105. [Google Scholar] [CrossRef]
  26. Adetunji, A.T.; Ncube, B.; Meyer, A.H.; Olatunji, O.S.; Mulidzi, R.; Lewu, F.B. Soil pH, nitrogen, phosphatase and urease activities in response to cover crop species, termination stage and termination method. Heliyon 2021, 7, e05980. [Google Scholar] [CrossRef]
  27. Kandeler, E.; Gerber, H. Short-term assay of soil urease activity using colorimetric determination of ammonium. Biol. Fertil. Soils 1988, 6, 68–72. [Google Scholar] [CrossRef]
  28. Eivazi, F.; Tabatabai, M.A. Factors affecting glucosidase and galactosidase activities in soils. Soil Biol. Biochem. 1990, 22, 891–897. [Google Scholar] [CrossRef]
  29. Tabatabai, M.A.; Bremner, J.M. Use of p-nitrophenyl phosphate for assay of soil phosphatase activity. Soil Biol. Biochem. 1969, 1, 301–307. [Google Scholar] [CrossRef]
  30. Mishra, P.; Pandey, C.M.; Singh, U.; Gupta, A.; Sahu, C.; Keshri, A. Descriptive statistics and normality tests for statistical data. Ann. Card. Anaesth. 2019, 22, 67–72. [Google Scholar] [CrossRef]
  31. Ott, R.L.; Longnecker, M. An Introduction to Statistical Methods and Data Analysis; Cengage Learning: Boston, MA, USA, 2016. [Google Scholar]
  32. Srivastava, A.K.; Singh, S. Citrus decline: Soil fertility and plant nutrition. J. Plant Nutr. 2009, 32, 197–245. [Google Scholar] [CrossRef]
  33. Silva, M.B.D.; Kliemann, H.J.; Silveira, P.M.D.; Lanna, A.C. Biological attributes of the soil under the influence of vegetation cover and management system. Pesqui. Agropecu. Bras. 2007, 42, 1755–1761. [Google Scholar] [CrossRef]
  34. Vanzolini, J.I.; Galantini, J.A.; Martínez, J.M.; Suñer, L. Changes in soil pH and phosphorus availability during decomposition of cover crop residues. Arch. Agron. Soil Sci. 2017, 63, 1864–1874. [Google Scholar] [CrossRef]
  35. Dick, W.A.; Cheng, L.; Wang, P. Soil acid and alkaline phosphatase activity as pH adjustment indicators. Soil Biol. Biochem. 2000, 32, 1915–1919. [Google Scholar] [CrossRef]
  36. Maltais-Landry, G. Legumes have a greater effect on rhizosphere properties (pH, organic acids and enzyme activity) but a smaller impact on soil P compared to other cover crops. Plant Soil 2015, 394, 139–154. [Google Scholar] [CrossRef]
  37. Spera, S.T.; Escosteguy, P.A.V.; dos Santos, H.P.; Klein, V.A. The soil solution of a dystrophic red latosol subjected to three types of soil and crop management. Nativa. Sinop. 2014, 2, 58–64. [Google Scholar] [CrossRef]
  38. Medeiros, J.C.; Dalla Rosa, J.; Mafra, A.L.; de Sousa Mendes, W. Chemical attributes of agricultural soil after the cultivation of cover crops. Aust. J. Crop Sci. 2017, 11, 1497–1503. [Google Scholar]
  39. Hontoria, C.; García-González, I.; Quemada, M.; Roldán, A.; Alguacil, M.M. The cover crop determines the AMF community composition in soil and in roots of maize after a ten-year continuous crop rotation. Sci. Total Environ. 2019, 660, 913–922. [Google Scholar] [CrossRef] [PubMed]
  40. Ajwa, H.A.; Tabatabai, M.A. Decomposition of different organic materials in soils. Biol. Fertil. Soils 1994, 18, 175–182. [Google Scholar] [CrossRef]
  41. Singh, J.; Kumar, S. Seasonal changes of soil carbon fractions and enzyme activities in response to winter cover crops under long-term rotation and tillage systems. Eur. J. Soil Sci. 2021, 72, 886–899. [Google Scholar] [CrossRef]
  42. Turner, S.; Schippers, A.; Meyer-Stüve, S.; Guggenberger, G.; Gentsch, N.; Dohrmann, R.; Condron, L.M.; Eger, A.; Almond, P.C.; Peltzer, D.A.; et al. Mineralogical impact on long-term patterns of soil nitrogen and phosphorus enzyme activities. Soil Biol. Biochem. 2014, 68, 31–43. [Google Scholar] [CrossRef]
  43. Deng, J.; Ni, H.; Zhang, Z.; Usman, S.; Yang, X.; Shen, Y.; Li, Y. Designing productive, energy-efficient, and environmentally friendly production systems by replacing fallow period with annual forage cultivation on the Loess Plateau of China. J. Clean. Prod. 2021, 320, 128660. [Google Scholar] [CrossRef]
  44. Agustí, M.; Mesejo, C.; Reig, C.; Martínez-Fuentes, A. Citrus production. In Horticulture: Plants for People and Places, Volume 1: Production Horticulture; Springer: Dordrecht, The Netherlands, 2014; pp. 159–195. [Google Scholar]
  45. Zekri, M.; Obreza, T.A. Plant Nutrients for Citrus Trees; University of Florida Cooperative Extension Service, Institute of Food and Agricultural Sciences, EDIS: Gainesville, FL, USA, 2003; pp. 1–2. [Google Scholar]
  46. Schroth, A.W.; Bostick, B.C.; Graham, M.; Kaste, J.M.; Mitchell, M.J.; Friedland, A.J. Sulfur species behavior in soil organic matter during decomposition. J. Geophys. Res. Biogeosci. 2007, 112. [Google Scholar] [CrossRef]
  47. Qian, X.; Gu, J.; Pan, H.J.; Zhang, K.Y.; Sun, W.; Wang, X.J.; Gao, H. Effects of living mulches on the soil nutrient contents, enzyme activities, and bacterial community diversities of apple orchard soils. Eur. J. Soil Biol. 2015, 70, 23–30. [Google Scholar] [CrossRef]
  48. Maseko, S.T.; Dakora, F.D. Rhizosphere acid and alkaline phosphatase activity as a marker of P nutrition in nodulated Cyclopia and Aspalathus species in the Cape fynbos of South Africa. S. Afr. J. Bot. 2013, 89, 289–295. [Google Scholar] [CrossRef]
  49. Parr, M.; Grossman, J.M.; Reberg-Horton, S.C.; Brinton, C.; Crozier, C. Nitrogen delivery from legume cover crops in no-till organic corn production. Agron. J. 2011, 103, 1578–1590. [Google Scholar] [CrossRef]
  50. Jani, A.D.; Grossman, J.; Smyth, T.J.; Hu, S. Winter legume cover-crop root decomposition and N release dynamics under disking and roller-crimping termination approaches. Renew. Agric. Food Syst. 2016, 31, 214–229. [Google Scholar] [CrossRef]
  51. García-Orenes, F.; Guerrero, C.; Roldán, A.; Mataix-Solera, J.; Cerdà, A.; Campoy, M.; Zornoza, R.; Bárcenas, G.; Caravaca, F. Soil microbial biomass and activity under different agricultural management systems in a semiarid Mediterranean agroecosystem. Soil Tillage Res. 2010, 109, 110–115. [Google Scholar] [CrossRef]
  52. Lal, R. Soil carbon sequestration impacts on global climate change and food security. Science 2004, 304, 1623–1627. [Google Scholar] [CrossRef]
  53. Yadav, S.S.; Guzman, J.G.; Meena, R.S.; Lal, R.; Yadav, G.S. Long term crop management effects on soil organic carbon, structure, and water retention in a cropland soil in central Ohio, USA. J. Plant Nutr. Soil Sci. 2020, 183, 200–207. [Google Scholar] [CrossRef]
  54. Lajtha, K.; Bowden, R.D.; Nadelhoffer, K. Litter and root manipulations provide insights into soil organic matter dynamics and stability. Soil Sci. Soc. Am. J. 2014, 78, S261–S269. [Google Scholar] [CrossRef]
  55. Zhang, Y.; Ding, S.; Fan, J.; Wang, L. Depth-dependent soil microbial and enzymatic responses to land use changes in agroecosystems. Appl. Soil Ecol. 2020, 155, 103648. [Google Scholar]
  56. Pervaiz, Z.H.; Iqbal, J.; Zhang, Q.; Chen, D.; Wei, H.; Saleem, M. Continuous cropping alters multiple biotic and abiotic indicators of soil health. Soil Syst. 2020, 4, 59. [Google Scholar] [CrossRef]
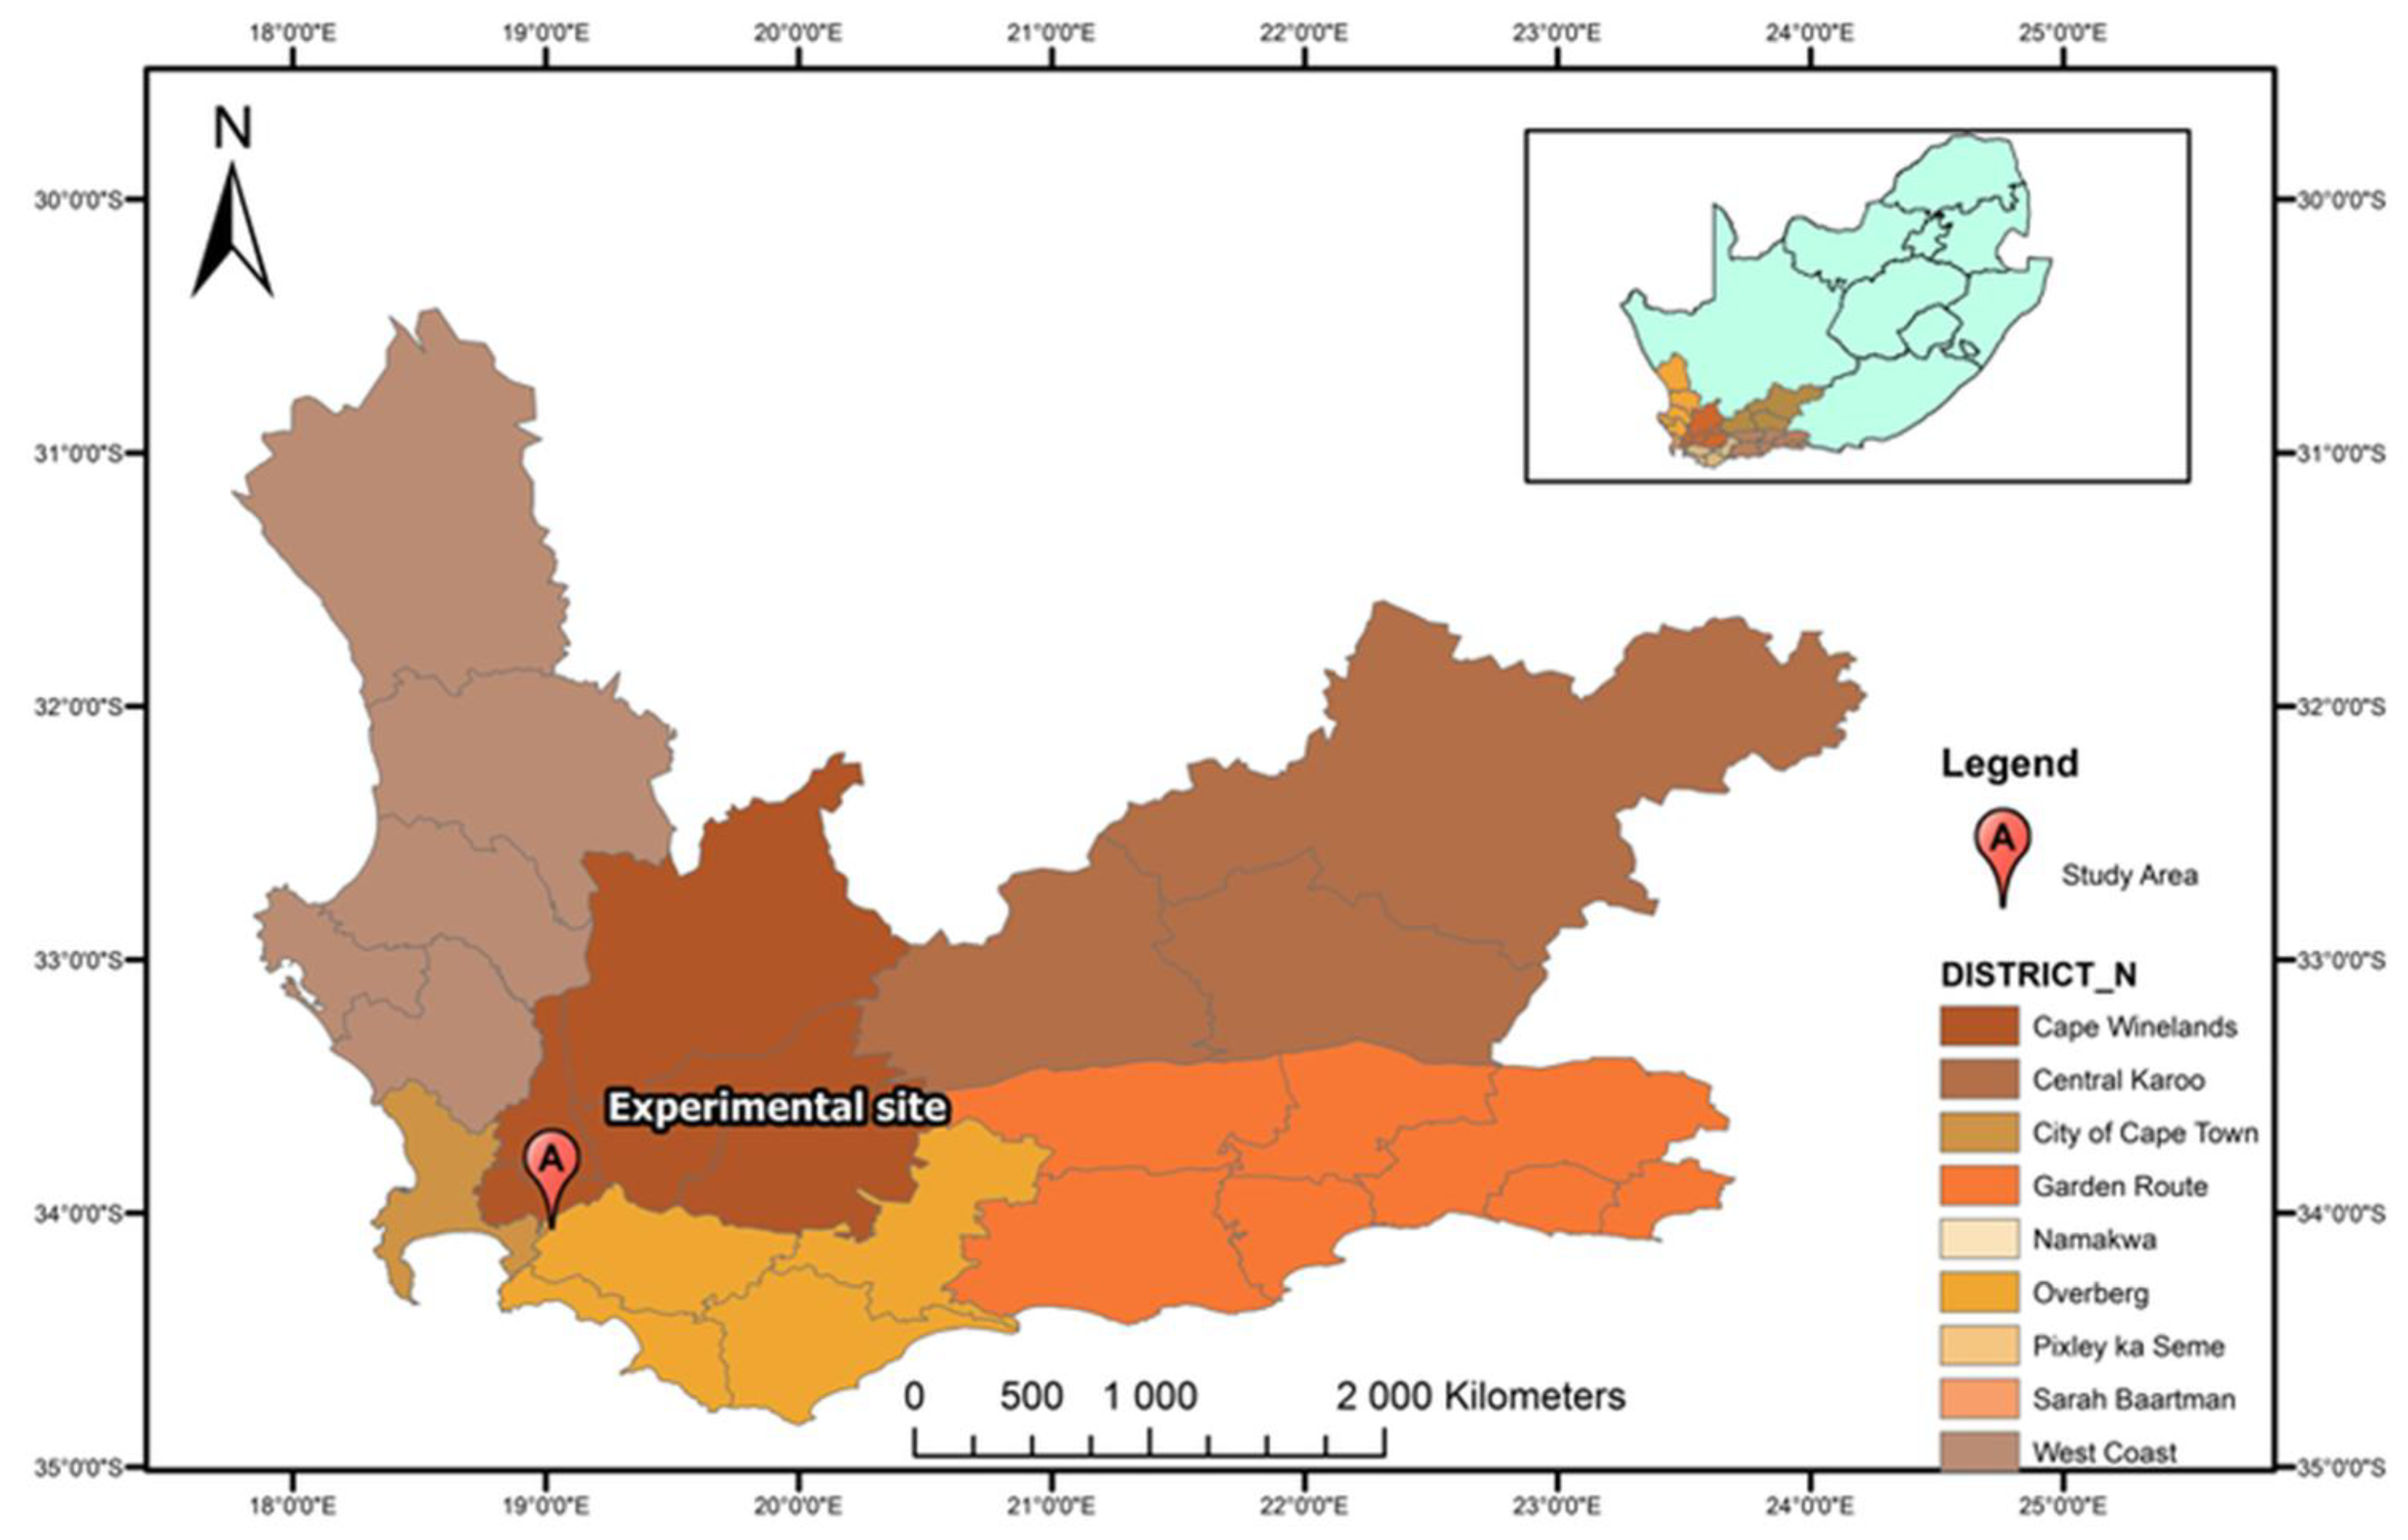
Figure 1. A map showing the study area.
Horticulturae 11 01014 g001
Figure 2. Experiment design layout. Treatments (T1 to T8) were replicated randomly in six blocks. Vetch not slashed is T1, vetch slashed is T2, medics not slashed is T3, medics slashed is T4, oats not slashed is T5, oats slashed is T6, control not slashed is T7 and control slashed is T8.
Horticulturae 11 01014 g002
Figure 3. The effect of the initiation of cover crops on soil pH after a year. Before stands for soil samples taken before planting cover crops (2022), while after stands for soil samples taken a year after planting cover crops (2023). Bars with different letters indicate significant differences (p < 0.05).
Horticulturae 11 01014 g003
Figure 4. The influence of different cover crops on soil pH after a year (2023). The significance between cover crop species is indicated using alphabetic letters, where different letters denote a difference (p < 0.05).
Horticulturae 11 01014 g004
Figure 5. The effect of the termination method on β-glucosidase, phosphatase and urease activities after one year (2023) at 0–30 cm. Bars with the same letter are not significantly different based on Fisher’s LSD (p < 0.05).
Horticulturae 11 01014 g005
Figure 6. Effect of termination method on β-glucosidase, phosphatase and urease activities after one year (2023) at 30–60 cm. Bars with the same letter are not significantly different based on Fisher’s LSD (p < 0.05).
Horticulturae 11 01014 g006
Figure 7. Principal component analysis (PCA): correlation between soil moisture, soil carbon and soil enzyme activities (urease, acid phosphatase and β-glucosidase) and type of cover crops (medics—Med, vetch—V, oats—O and control—Ctrl), soil depth (30 and 60 cm) and termination methods (slashed—S and non-slashed—N S).
Horticulturae 11 01014 g007
Figure 8. Principal component analysis (PCA): correlation between soil moisture, weed and cover dry weight, soil carbon and soil enzyme activities (urease, acid phosphatase and β-glucosidase) and type of cover crops (medics—Med, vetch—V, oats—O and control—Ctrl) and termination methods (slashed—S and non-slashed—N S).
Horticulturae 11 01014 g008
Table 1. Rainfall (mm) received monthly from April to August (cover crop growing months) measured over a period of two years.
YearAprilMayJuneJulyAugustTotal (mm)
202221.379.8169.2101.3111.3482.9
2023107160390.1123.92.1783.1
Table 2. Soil characteristics before (2022/23) and after (2023/24) sowing cover crops from Lamara farm, Franschhoek, Western Cape, South Africa.
Soil Characteristics20222023
Soil textureSandSand
Carbon% (Walkley back)0.46%0.59%
PH (KCl)5.426.02
P (Ambic 1)24.5 mg kg−128.4 mg kg−1
K (ammonium acetate extraction)64 mg kg−154 mg kg−1
NO3-N (KCl)-3.95 mg kg−1
NH4-N (KCl-11.88 mg kg−1
Table 3. Soil enzyme activities before and after planting cover crops at different soil depths. Mean values within a column followed with the same letter are not significantly different based on Fisher’s LSD (p < 0.05). Standard deviation values are presented in parenthesis.
Soil DepthSampling TimeSeasonβ-Glucosidase
(µg PNP g−1 Soil h−1)
Phosphatase
(µg PNP g−1 Soil h−1)
Urease
(μg NH4+ g−1 Soil 2 h−1)
0–30 cmBefore planting a cover crop.202259.66 (±18.34) a98.57 (±42.85) a16.53 (±4.42) a
A year after planting cover crops.202341.12 (±17.56) a154.52 (±83.01) a21.71 (±3.83) a
30–60 cmBefore planting a cover crop.202235.76 (±7.61) a82.28 (±20.10) a8.22 (±3.95) a
A year after planting cover crops.202324.12 (±16.50) a131.01 (±59.46) a11.72 (±5.20) a
Table 4. The cover crop effect on soil enzyme activities after a year (2023) of planting cover crop species. Mean values within a column followed with the same letter are not significantly different based on Fisher’s LSD (p < 0.05). Standard deviation values are presented in parenthesis.
Soil DepthSampling TimeCover Cropsβ-Glucosidase
(µg PNP g−1 Soil h−1)
Acid Phosphatase
(µg PNP g−1 Soil h−1)
Urease
(μg NH4+ g−1 Soil 2 h−1)
0–30 cmAfter one yearMedics41.60 (±22.59) a173.29 (±134.50) a20.29 (±8.85) a
Vetch47.78 (±29.55) a 156.24 (±90.129) a25.77 (±14.56) a
Oats36.06 (±26.81) a154.14 (±105.35) a 21.97 (±10.78) a
Control39.02 (±32.522) a134.40 (± 120.61) a18.83 (±11.15) a
30–60 cmAfter one yearMedics19.75 (±14.04) a132.76 (±116.71) a7.30 (±4.86) b
Vetch24.62 (±17.74) a132.36 (±98.01)) a13.96 (±7.49) a
Oats28.67 (±34.63) a127.45 (±90.76) a13.17 (±8.93) a
Control23.50 (±23.89) a131.46 (±131.46) a12.46 (±7.65) a
Table 5. Pearson correlation method: soil carbon%, soil moisture and enzyme activities.
VariablesSoil Carbon %Soil Moisture %β-Glucosidase
(µg PNP g−1 Soil h−1)
Acid Phosphatase
(µg PNP g−1 Soil h−1)
Urease
(μg NH4+ g−1 Soil 2 h−1)
Soil carbon 1−0.1760.3480.2580.296
Soil moisture −0.1761−0.1750.114−0.439
β-glucosidase0.348−0.17510.5780.777
Acid phosphatase0.2580.1140.57810.341
Urease0.296−0.4390.7770.3411
Values in bold are different from 0 with a significance level alpha = 0.05.
Table 6. Pearson correlation method: soil carbon%, soil moisture, enzyme activities, cover crop and weed dry weight.
VariablesSoil Carbon %Soil Moisture %β-Glucosidase
(µg PNP g−1 Soil h−1)
Acid Phosphatase
(µg PNP g−1 Soil h−1)
Urease
(μg NH4+ g−1 Soil 2 h−1)
Cover Crop Dry Weight (g m−2)Weed Dry Weight (g m−2)
Soil carbon1−0.0530.226−0.009−0.139−0.5380.237
Soil moisture−0.0531−0.177−0.255−0.4220.1720.203
β-glucosidase0.226−0.17710.4870.861−0.068−0.043
Acid phosphatase−0.009−0.2550.48710.313−0.452−0.307
Urease−0.139−0.4220.8610.31310.202−0.156
Cover crop dry weight−0.5380.172−0.068−0.4520.2021−0.253
Weed dry weight0.2370.203−0.043−0.307−0.156−0.2531
Values in bold are different from 0 with a significance level alpha = S0.05.
Disclaimer/Publisher’s Note: The statements, opinions and data contained in all publications are solely those of the individual author(s) and contributor(s) and not of MDPI and/or the editor(s). MDPI and/or the editor(s) disclaim responsibility for any injury to people or property resulting from any ideas, methods, instructions or products referred to in the content.