Article

Physiological Responses and Determination of Harvest Maturity in ‘Daehong’ Peach According to Days After Full Bloom

1
Department of Plant Biotechnology, College of Life Sciences and Biotechnology, Korea University, Seoul 02841, Republic of Korea
2
Agricultural and Life Science Research Institute, Kangwon National University, Chuncheon 24341, Republic of Korea
3
Interdisciplinary Program in Smart Agriculture, Kangwon National University, Chuncheon 24341, Republic of Korea
4
Waksman Institute of Microbiology, The State University of New Jersey, Rutgers, Piscataway, NJ 08854, USA
5
Horticultural Research Division, Gangwon-do Agricultural Research & Extension Services, Chuncheon 24203, Republic of Korea
*
Author to whom correspondence should be addressed.
These authors contributed equally to this work.
Horticulturae 2025, 11(9), 1013; https://doi.org/10.3390/horticulturae11091013
Submission received: 20 June 2025 / Revised: 16 August 2025 / Accepted: 18 August 2025 / Published: 26 August 2025

Abstract

This study examined the physiological development of the red-fleshed peach cultivar ‘Daehong’ at different stages of fruit maturation to determine the optimal harvest time. Fruit samples were collected at five intervals—50, 80, 100, 120, and 140 days after full bloom (DAFBs)—and evaluated for external attributes (weight, size, and color) and internal attributes (soluble solids, sugar–acid ratio, firmness, sugars, and organic acids). Internal quality parameters, including soluble solids content and firmness, reached commercially acceptable levels at 120 DAFB. Sucrose was the predominant sugar, increasing steadily during maturation, while malic acid levels declined, resulting in an improved sugar–acid balance. Respiratory activity and ethylene production peaked at 140 DAFB, marking the onset of full ripening. Additionally, Hunter a* values and anthocyanin content increased progressively, intensifying the red coloration of the fruit. Principal component analysis (PCA) indicated that overall fruit quality was highest between 120 and 140 DAFB; however, reduced firmness at later stages suggests that delayed harvesting could impair postharvest storability. Considering both physiological indicators and climate variability, harvesting ‘Daehong’ peaches when growing degree days (GDDs) approach 1800 °C is recommended, as this provides a more consistent and objective maturity index than DAFB alone.

1. Introduction

The peach (Prunus persica L.) is a widely cultivated and economically significant fruit crop, renowned for its diverse physicochemical characteristics [1]. Peaches are classified into pubescent (fuzzy) and glabrous (non-fuzzy) types based on the presence or absence of skin trichomes, and are further categorized as melting-flesh or non-melting-flesh types according to flesh firmness. In South Korea, a broad diversity of cultivars is grown, including white-flesh, yellow-flesh, nectarines, and flat peaches [2].
The ‘Daehong’ cultivar, developed in 2006, was the first privately bred fruit tree variety officially registered by the Korea Seed and Variety Service. Characterized by red skin and uniquely red flesh, this pubescent variety differs from conventional peaches, which typically have white or yellow flesh. Its cultivation area has been steadily expanding in regions such as Chuncheon and Hongcheon in Gangwon Province, South Korea. The cultivar’s vibrant color and favorable sugar–acid ratio contribute to its popularity among consumers [3]. Its firm, non-melting flesh also provides enhanced storability, as it resists softening [4]. By contrast, the ‘Yumyeong’ peach—another pubescent, white-flesh variety—was the first crossbred cultivar developed in South Korea in 1977. Unlike cultivars such as ‘Daegubo’ or ‘Changbangjosaeng’, ‘Yumyeong’ is recognized for its firm texture, making it a major commercial variety [5]. Although ‘Yumyeong’ is widely cultivated and commercially important, research on its heat accumulation requirements, expressed as growing degree days (GDDs), remains limited.
Globally, peach consumption has been declining, partly due to differences in ripening stages among cultivars, which affect sensory attributes such as aroma and flavor. Postharvest physiological disorders also compromise fruit quality, influencing consumer acceptance [6]. Therefore, determining the optimal harvest timing is a critical factor affecting consumer preference, fruit quality, and storage life [7].
Traditionally, harvest timing for peaches has been based on external indicators such as fruit size and skin color [7]. However, this approach may lead to harvesting fruit before full physiological maturity, necessitating additional assessment of physical attributes (fruit length, diameter, and firmness) and biochemical traits (anthocyanin and phenolic content) [8]. Moreover, recent climate variability has complicated the prediction of flowering and harvest dates. Consequently, it is important to incorporate accumulated temperature data alongside growers’ empirical assessments when establishing the optimal harvest period.
Peach fruit quality is influenced by a combination of genetic factors, environmental conditions, and harvest timing. During fruit development, stone fruits follow a double-sigmoid growth curve comprising three stages: Stage I (S1), characterized by cell division and early cell expansion; Stage II (S2), a pit-hardening phase with slowed growth and stone lignification; and Stage III (S3), marked by renewed cell expansion leading to final fruit size and ripeness. Environmental conditions strongly affect the duration of these stages—warm spring temperatures accelerate development but can reduce carbohydrate accumulation and final fruit size—making the first 30 days after full bloom especially critical [9].
Days after full bloom (DAFBs) serve as a key indicator of fruit maturity and quality, influencing parameters such as size, color, and firmness [9,10]. Understanding the relationship between DAFB and these quality traits is essential for optimizing harvest time and improving marketability. Principal component analysis (PCA) is frequently applied to identify the most influential factors [11]. Biochemically, peaches are climacteric fruits; ripening is accompanied by elevated respiration and ethylene production. As fruit matures, the soluble sugar profile shifts from a higher proportion of glucose and fructose to sucrose dominance [12], while organic acids such as malic and citric acid decrease. Free amino acid composition also changes, serving as precursors for aroma volatiles, and phenolic compounds (including chlorogenic acid, catechins, epicatechins, and rutin) accumulate. In red-flesh cultivars, anthocyanins and other phenolics increase during ripening [12].
Fruit softening is driven by cell-wall disassembly, involving pectin depolymerization and solubilization and the loss of neutral sugar side chains, catalyzed by enzymes such as polygalacturonase, pectin methylesterase, β-galactosidase, cellulase, and xyloglucan endotransglycosylase; these processes are promoted by ethylene signaling [13]. Since external appearance may not accurately reflect internal quality, recent guidelines emphasize using multiple maturity indices. These include background color changes, decreases in skin chlorophyll measured by the index of absorbance difference (IAD), increases in fruit diameter, reductions in flesh firmness, and shifts in soluble solids and titratable acidity, all of which improve maturity assessment reliability. Many cultivars reach commercial maturity between 100 and 130 DAFB, although this range can vary by 5–20 days depending on seasonal conditions; furthermore, the degree of red blush is heavily influenced by sunlight and cultivar, making it an unreliable maturity indicator. Integrating DAFB with internal quality attributes—such as sugar–acid ratio, anthocyanin accumulation, and flesh firmness—offers a more objective basis for determining optimal harvest timing.
While previous reports suggest that the storage potential of ‘Daehong’ peaches surpasses that of other cultivars, little research has addressed how harvest timing relates to its physiological changes during storage. Therefore, this study aimed to determine the optimal harvest period for ‘Daehong’ peaches by evaluating postharvest internal and external quality parameters and accumulated temperature, with ‘Yumyeong’ peaches serving as a control.

2. Materials and Methods

2.1. Experimental Materials

This study was conducted from 26 May to 24 August 2022. The experimental materials included ‘Daehong,’ a red-flesh peach cultivar grown in Dongnae-myeon, Chuncheon-si, Gangwon Province, South Korea. As a control, ‘Yumyeong,’ a white-flesh peach cultivar, was used. For both cultivars, 10 fruits were randomly sampled at each stage (50, 80, 100, 120, and 140 days after full bloom, DAFB) from approximately 100 trees per cultivar. Fruits were hand-picked from a height of around 3 m, and only those with similar weight, size, coloration, and position were selected (Figure 1).

2.2. External Quality

After harvest, external quality parameters, including fresh weight, fruit length, width, and shape, were measured. Fresh weight was recorded using an electronic balance (PB602-S, Mettler Toledo, Greifensee, Switzerland). Fruit length and width were measured with a digital vernier caliper. Fruit shape was expressed as the length-to-width ratio.

2.3. Internal Quality

Internal quality parameters—mesocarp firmness, soluble solids content, total acidity, and sugar–acid ratio—were measured. Firmness was determined using an 8 mm stainless-steel probe with a Sun Rheo Meter Compac-100 II (Sun Scientific Co., Ltd., Tokyo, Japan) and expressed in Newtons (N). Soluble solids content was measured with a pocket refractometer (PAL-1, Atago, Tokyo, Japan) and expressed in °Brix. Total acidity was determined by titration with sodium hydroxide and expressed as malic acid content (%). The sugar–acid ratio was calculated as follows:
Brix and Acid Ratio (BAR) = (soluble solid (°Brix))/(total acid content (%))

2.4. Analysis of Reducing Sugars, Non-Reducing Sugars, and Organic Acid

For sugar analysis, 20 mL of triple-distilled water was added to a 2 g sample, which was homogenized using a pestle and mortar. The mixture was centrifuged at 3461× g for 1.5 min using a fixed-angle rotor (6 × 50 mL, rotor radius: 8.6 cm), followed by centrifugation at 1538× g for 10 min at 4 °C. A 2 mL aliquot of the supernatant was filtered through a 0.22 μm membrane filter. The analysis was conducted using a ZORBAX Eclipse XDB-C18 column (4.6 cm × 250 mm × 5 μm; Agilent, Santa Clara, CA, USA) with EDTA as the mobile phase at 0.2 mL/min, column temperature 65 °C, and injection volume 10 μL. Measurements were performed on an HPLC system (Waters Associates, Milford, MA, USA) with a refractive index detector (Waters 410, Waters, Milford, MA, USA) [14]. Sugar contents were calculated using linear regression equations for each sugar:
Fructose: y = 5.0682x + 1497.2, R2 = 0.9833
Glucose: y = 4.9174x − 442.6, R2 = 0.9833
Sucrose: y = 5.1574x + 695, R2 = 0.9978
For organic acid analysis, 10 mL of triple-distilled water was added to a 1 g sample, which was homogenized at 2404× g for 1.5 min. The mixture was centrifuged at 2404× g for 15 min at 4 °C, and 2 mL of the supernatant was filtered through a 0.22 μm membrane filter. The analysis used the same column as above, with 0.02 mol/L KH2PO4 as the mobile phase at 0.8 mL/min, column temperature 40 °C, and injection volume 10 μL. Detection was performed at 210 nm using a UV/Visible detector (Waters 2489, Waters, Milford, MA, USA) [15]. L-malic acid content was quantified using the following equation:
y = 2977.3x + 6 × 10⁶ (R2 = 0.9676)

2.5. Respiration Rate and Ethylene Production Rate

To measure respiration and ethylene production rates, each of 10 fruits was placed in a separate sealed container (1080 mL) at room temperature for 3 h. Gas samples were analyzed for CO2 concentration using an infrared single-beam sensor (Checkpoint3, AMTEK Mocon, Brooklyn Park, MN, USA). For ethylene measurement, 1 mL of headspace gas was collected using a syringe and injected into a gas chromatography system (GC-2010, Shimadzu, Kyoto, Japan) equipped with a BP 20 Wax column (30 m × 0.25 mm × 0.25 μm, SGE Analytical Science, Ringwood, Australia) and a flame ionization detector (FID). The detector and injector were maintained at 127 °C, and the oven temperature was set at 50 °C [11].

2.6. Hunter a* Analysis of Exocarp and Mesocarp with Anthocyanin Analysis

Hunter a* values of the exocarp were measured on surfaces below the equator, while mesocarp values were measured around the core using a Chroma Meter (CR-400, Konica Minolta Sensing, Inc., Osaka, Japan). Ten replicates were recorded for each location. The Hunter a* value indicates redness (+) or greenness (−) relative to a neutral reference [2].
For total anthocyanin content, 2 g of peach tissue was ground and mixed with 95% ethanol and 1.5 N HCl at an 85:15 (v/v) ratio. After mixing, 5 mL of the extract was stored at 4 °C for 24 h, centrifuged at 16,259× g for 20 min (Heraeus Fresco 17, Thermo Fisher, Osterode am Harz, Germany), and the supernatant was analyzed. Absorbance was measured at 535 nm using a spectrophotometer (Biomate 3S, Thermo Fisher Scientific, Madison, WI, USA), and anthocyanin content was calculated using the method described by [16]:
Anthocyanin (mg/100 g FW) = Abs530 × Volume of extraction solution (mL) × 100/Sample weight (g) × 98.2

2.7. Accumulated Temperature

Growing degree days (GDDs) were calculated by summing daily mean temperatures exceeding the base temperature of 7 °C using climatological data for the cultivation site and study period. Historical GDD data for the same phenological window were obtained for 2012, 2017, and 2019, corresponding to 10, 5, and 3 years prior to 2022, respectively [17].

2.8. Statistical Analysis

Data were analyzed using SPSS Statistics ver. 26 (IBM Corp., Armonk, NY, USA). Duncan’s multiple range test was applied to determine significant differences at p < 0.05. Principal component analysis (PCA) was conducted using XLSTAT version 2022 (Addinsoft Inc., New York, NY, USA).

3. Results and Discussions

3.1. External Quality

Both cultivars exhibited progressive changes in external quality parameters as days after full bloom (DAFBs) advanced (Table 1). For ‘Daehong,’ fruits weighing over 300 g are generally classified as commercial grade [4]. However, as shown in Table 2, fruit weight remained below 150 g until 100 DAFB, thereby failing to meet the commercial grade threshold. By 120 DAFB, fruit weight increased sharply to exceed 300 g, meeting the commercial classification. This trend is in agreement with a previous report [18], which noted rapid increases in both exocarp and mesocarp size after 100 DAFB, attributable to lignification of the fruit flesh.
Fruit weight reached its maximum at 140 DAFB in both cultivars, with ‘Daehong’ averaging 352.7 g; however, this value was not significantly different from its weight at 120 DAFB (343.1 g) (Table 1). The control cultivar, ‘Yumyeong,’ showed a continuous increase in fruit weight over the maturation period, with the highest weight recorded at 140 DAFB, though not significantly different from its weight at 120 DAFB. Fruit length and width were greatest at 140 DAFB for both cultivars, but did not differ significantly from those measured at 120 DAFB. In contrast, the fruit shape index (height/width ratio) decreased with maturation, reaching 0.75 for ‘Daehong’ and 0.79 for ‘Yumyeong’ at the final harvest.
Values represent mean ± standard deviation. Mean separation within the cultivars was performed using Duncan’s multiple range test (p < 0.05). Fruit shape values below 1 indicate an ovoid form, with 1 representing a perfect sphere, consistent with previous reports examining DAFB-related morphological changes [19].

3.2. Internal Quality

The internal quality of both cultivars was assessed beginning at 120 DAFB, when fruit size was deemed suitable for maturity evaluation. Previous studies have reported that with increasing DAFB, flavor and aroma intensify in parallel with rising sugar content and decreasing acidity [20]. In both cultivars, the soluble solids content increased while total acidity declined between 120 and 140 DAFB, leading to a higher sugar–acid ratio at 140 DAFB—considered the optimal consumption stage for consumers. Notably, at 140 DAFB, the sugar–acid ratio of ‘Daehong’ was approximately twice that of ‘Yumyeong’ (Table 2), consistent with reports that consumers prefer fruits with higher sugar content [3].
Fruit firmness is widely regarded as one of the most practical indicators of maturity [21], with optimal harvest typically occurring when firmness ranges from 35 to 40 N [22]. ‘Daehong’ peaches reached this range at 120 DAFB, registering 36.4 N, while ‘Yumyeong’ peaches recorded a firmness of 34.5 N at 140 DAFB (Table 2). According to [23], postharvest decreases in firmness are associated with increased exocarp and mesocarp mass, which promote cell wall relaxation through expansin activation or hemicellulose degradation.

3.3. Analyses of Reducing Sugars, Non-Reducing Sugars, and Organic Acid

Sugars accumulated in peach fruit primarily consist of fructose, glucose, and sucrose [24]. The analysis of reducing sugars during the first year is presented in Figure 2. In ‘Daehong’ peaches, the concentrations of all sugars increased as DAFB advanced, with sucrose showing particularly high levels—ranging from 32.1 mg g−1 to 52.7 mg g−1—compared with other sugars (Figure 2A). Sucrose is the predominant sugar in ripe peaches, followed by glucose and fructose. Previous studies have reported that sucrose accounts for 40–85% of the total sugar content in peaches [25], while fructose and glucose are generally present in lower proportions. Consistent with these reports, sucrose was identified as the dominant sugar in both the ‘Daehong’ and ‘Yumyeong’ cultivars (Figure 2).
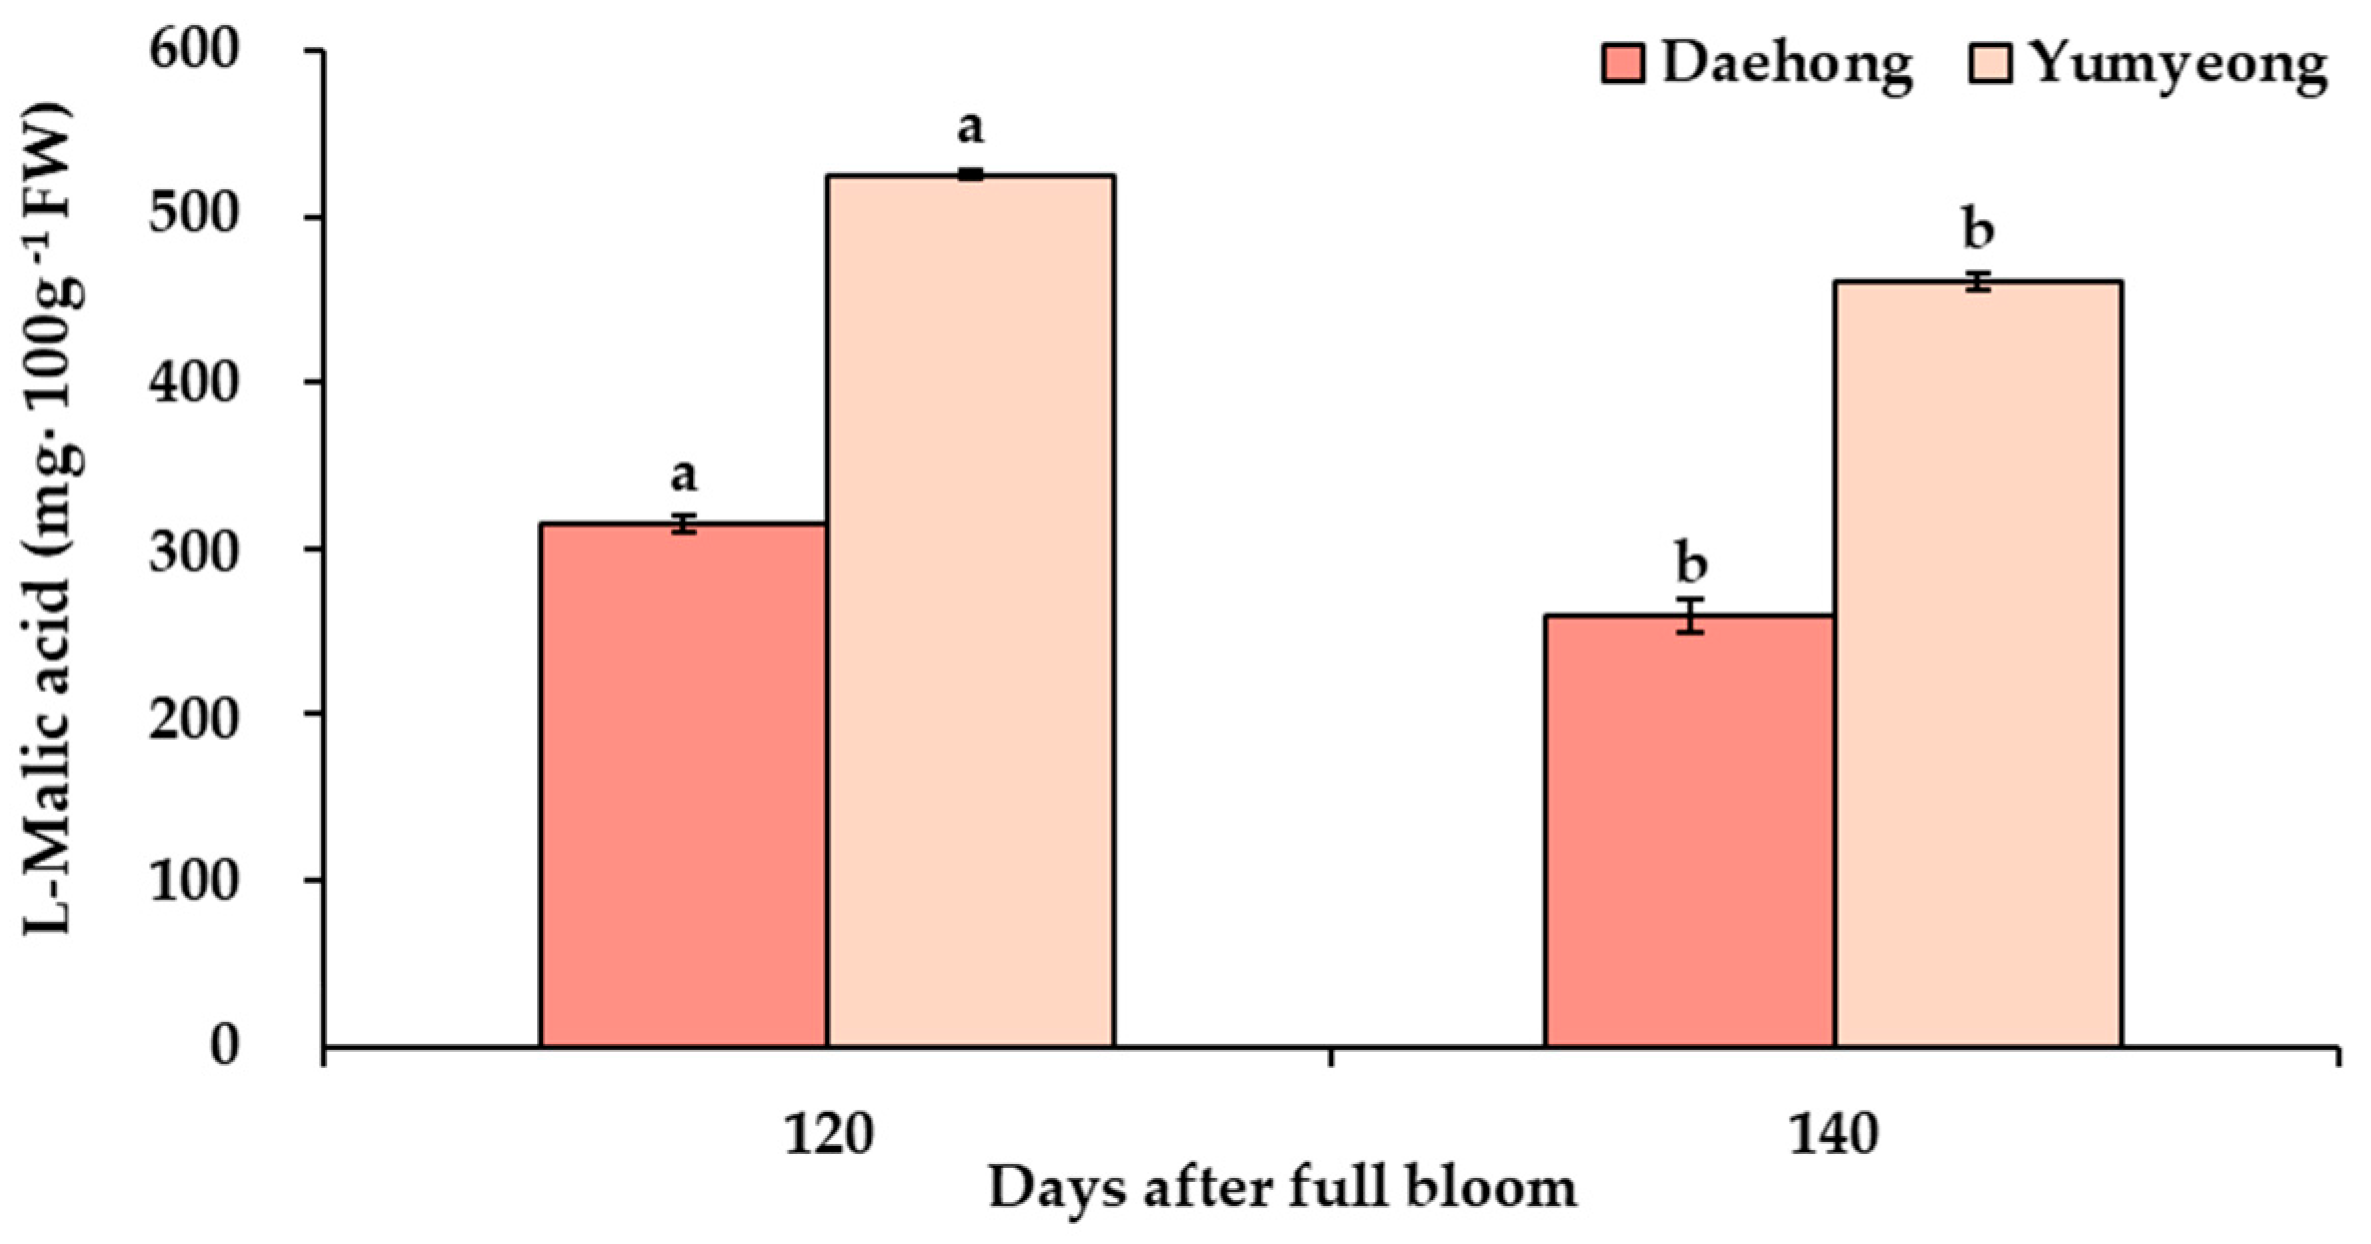
The organic acid analysis focused on malic acid, the most abundant organic acid in ‘Daehong’ peaches, with the results shown in Figure 3. In both cultivars, the malic acid concentration declined as DAFB increased. Malic acid is the principal organic acid in peach fruit [26], and its decrease during ripening is attributed to utilization as a respiratory substrate, together with citrate, and activation of gluconeogenesis pathways, leading to a reduction in acidity [27]. Typically, peach acidity follows a pattern of accumulation followed by a decline, with cultivar-specific variation in the timing of maximum acid accumulation. Nonetheless, acidity generally decreases during ripening [28]. The malic acid levels measured in South Korean peach cultivars in this study were within the range previously reported (0.3–1.0 g per 100 g fresh weight).
In addition to quantifying sugar concentrations, the metabolic relationships among sucrose, glucose, and fructose were considered. Sucrose and sorbitol are the primary photosynthates imported into peach fruit. Cytosolic sucrose synthase and cell-wall or vacuolar invertases hydrolyze sucrose into fructose and glucose, while sorbitol dehydrogenase and sorbitol oxidase convert sorbitol into fructose and glucose. During development, sucrose levels increase sharply, becoming the dominant sugar, while glucose remains relatively stable, and fructose initially decreases before rising later. Because sucrose synthesis and hydrolysis regulate the relative proportions of glucose and fructose, the sucrose-to-glucose ratio can serve as an indicator of maturity. In ‘Daehong’ fruit, a higher sucrose-to-glucose ratio at 120–140 DAFB suggests reduced sucrose hydrolysis during late ripening, which coincides with increased sweetness and reduced acidity. These metabolic patterns support the combined use of sucrose and glucose dynamics, rather than fructose alone, as complementary indicators to reducing sugar data when evaluating maturity [12].

3.4. Respiration Rate and Ethylene Production Rate

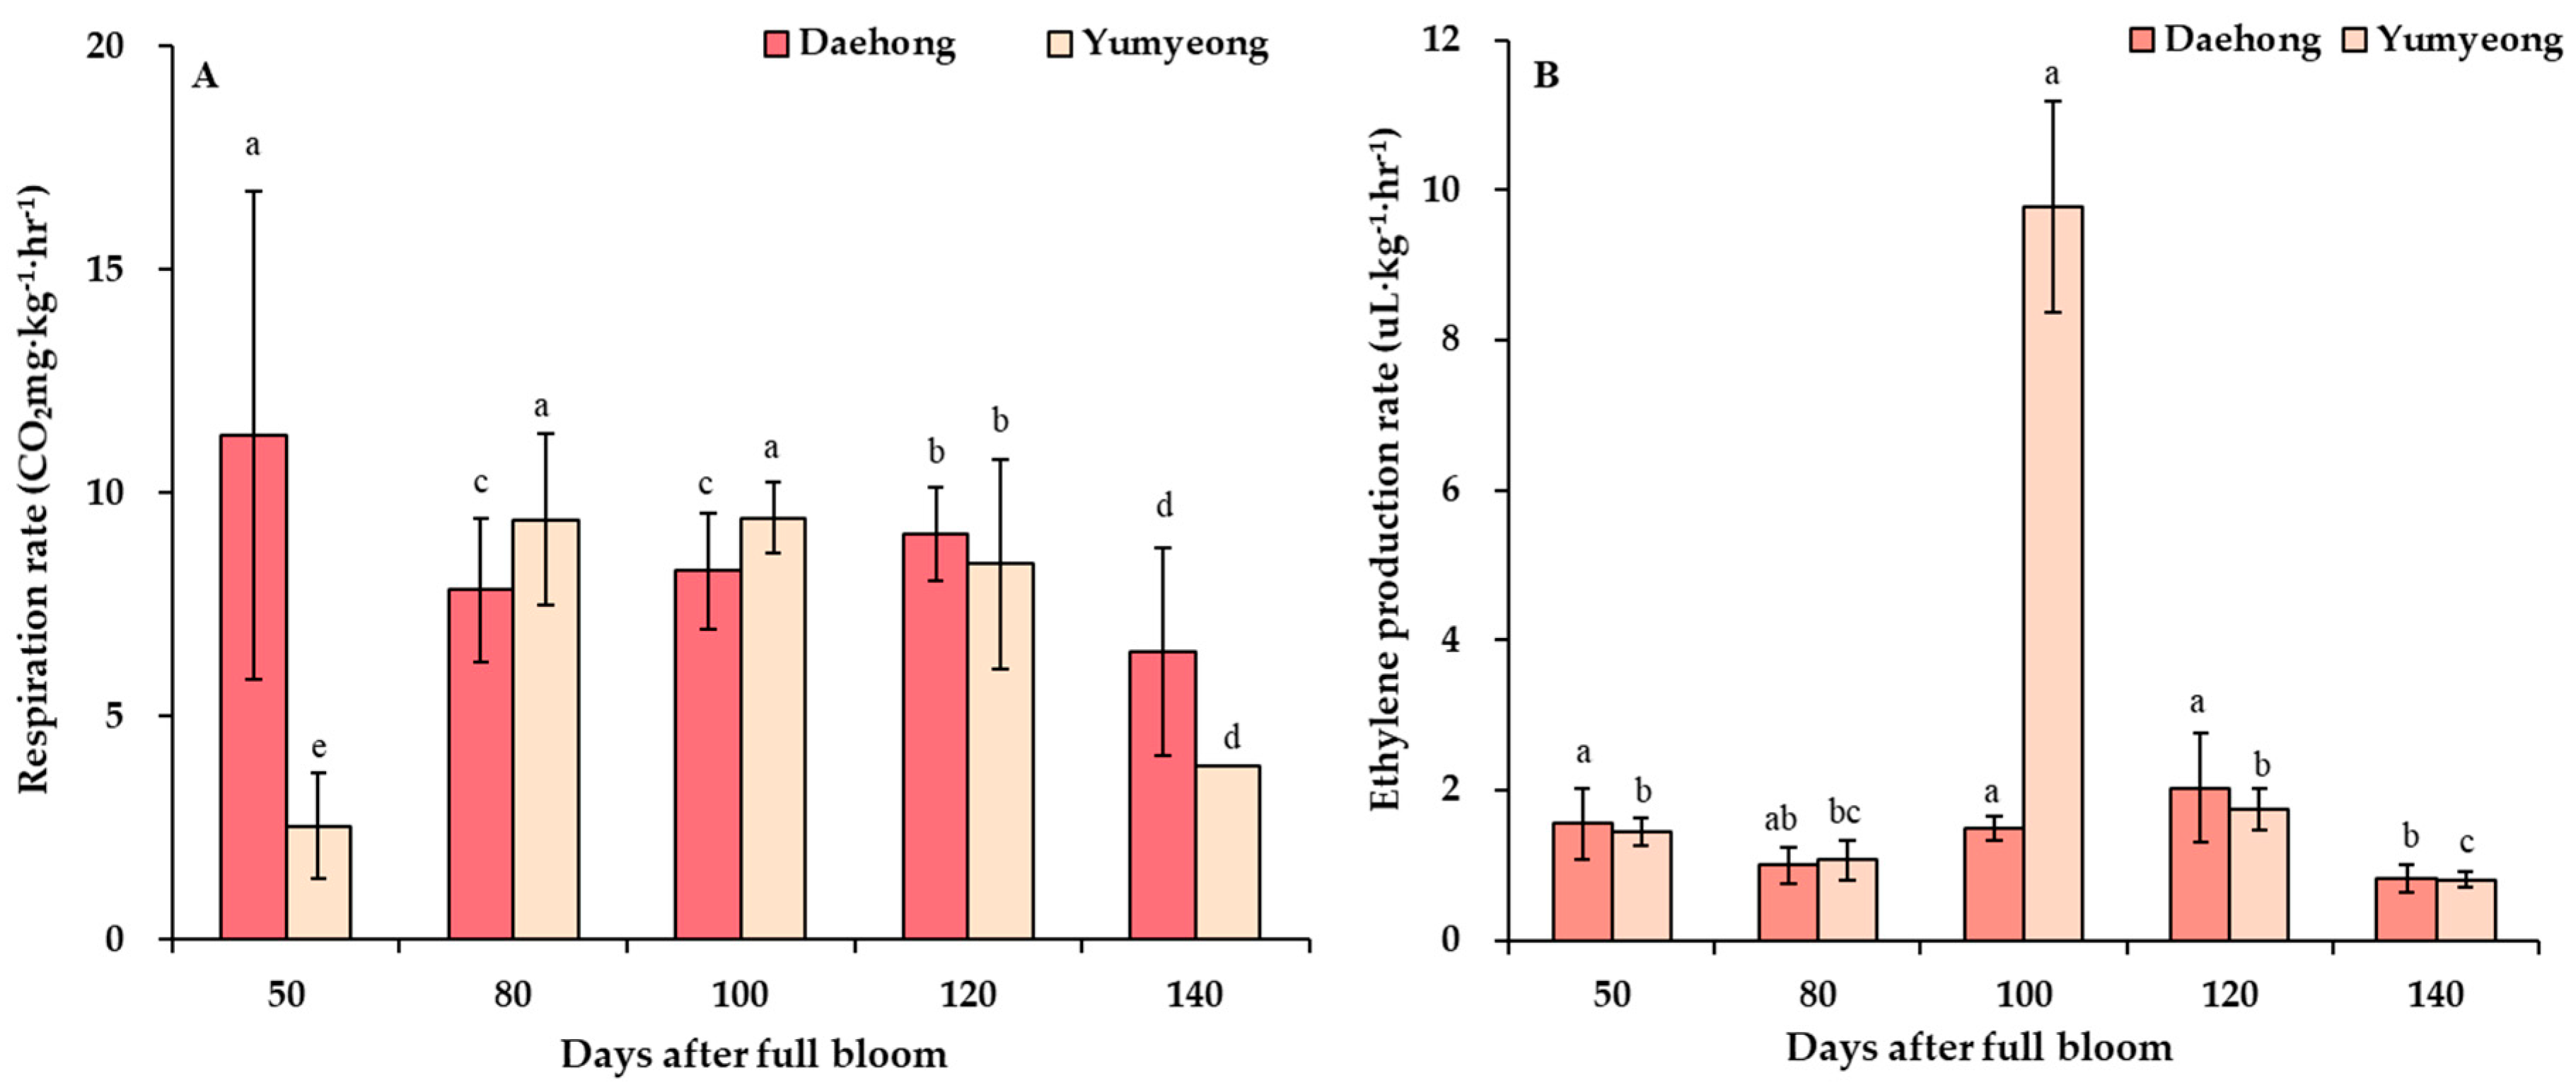
The respiration rate of ‘Daehong’ peaches was highest at 50 DAFB, followed by a sharp decline at 80 DAFB and a gradual increase thereafter, reaching its lowest value at 140 DAFB (Figure 4A). In contrast, ‘Yumyeong’ exhibited the lowest respiration rate at 50 DAFB, followed by a sharp increase at 80 DAFB and a continuous decline until the end of harvest (Figure 4A). For ‘Daehong,’ ethylene production rates showed no statistically significant variation across sampling dates, except for a notable peak at 140 DAFB (Figure 4B). In ‘Yumyeong,’ ethylene production increased sharply at 100 DAFB, reaching 9.77 μL·kg−1·h−1 (Figure 4B). These patterns align with previous reports that respiration rate generally increases during fruit ripening and subsequently declines as ripening progresses [29].
In climacteric fruits, ethylene biosynthesis plays a central role in initiating ripening. Ethylene is synthesized from methionine via S-adenosyl-L-methionine (SAM) and 1-aminocyclopropane-1-carboxylic acid (ACC) through the sequential actions of ACC synthase (ACS) and ACC oxidase (ACO). Two distinct regulatory systems operate during development: system 1, an autoinhibitory mechanism active during early fruit growth, and system 2, an autocatalytic mechanism activated shortly before ripening. The transition from system 1 to system 2 involves the upregulation of ACS and ACO gene expression, triggering the climacteric ethylene surge. In ‘Daehong,’ the elevated ethylene production observed near 100 DAFB suggests the onset of system 2 and the initiation of climacteric ripening, while the subsequent decline may indicate progression into post-climacteric senescence. Understanding these regulatory pathways offers insight into how ethylene interacts with sugar metabolism and cell wall-modifying enzymes, ultimately influencing firmness, sweetness, and overall fruit quality [30].

3.5. Analysis of Exocarp and Mesocarp Hunter a* Values with Anthocyanin Content Analysis

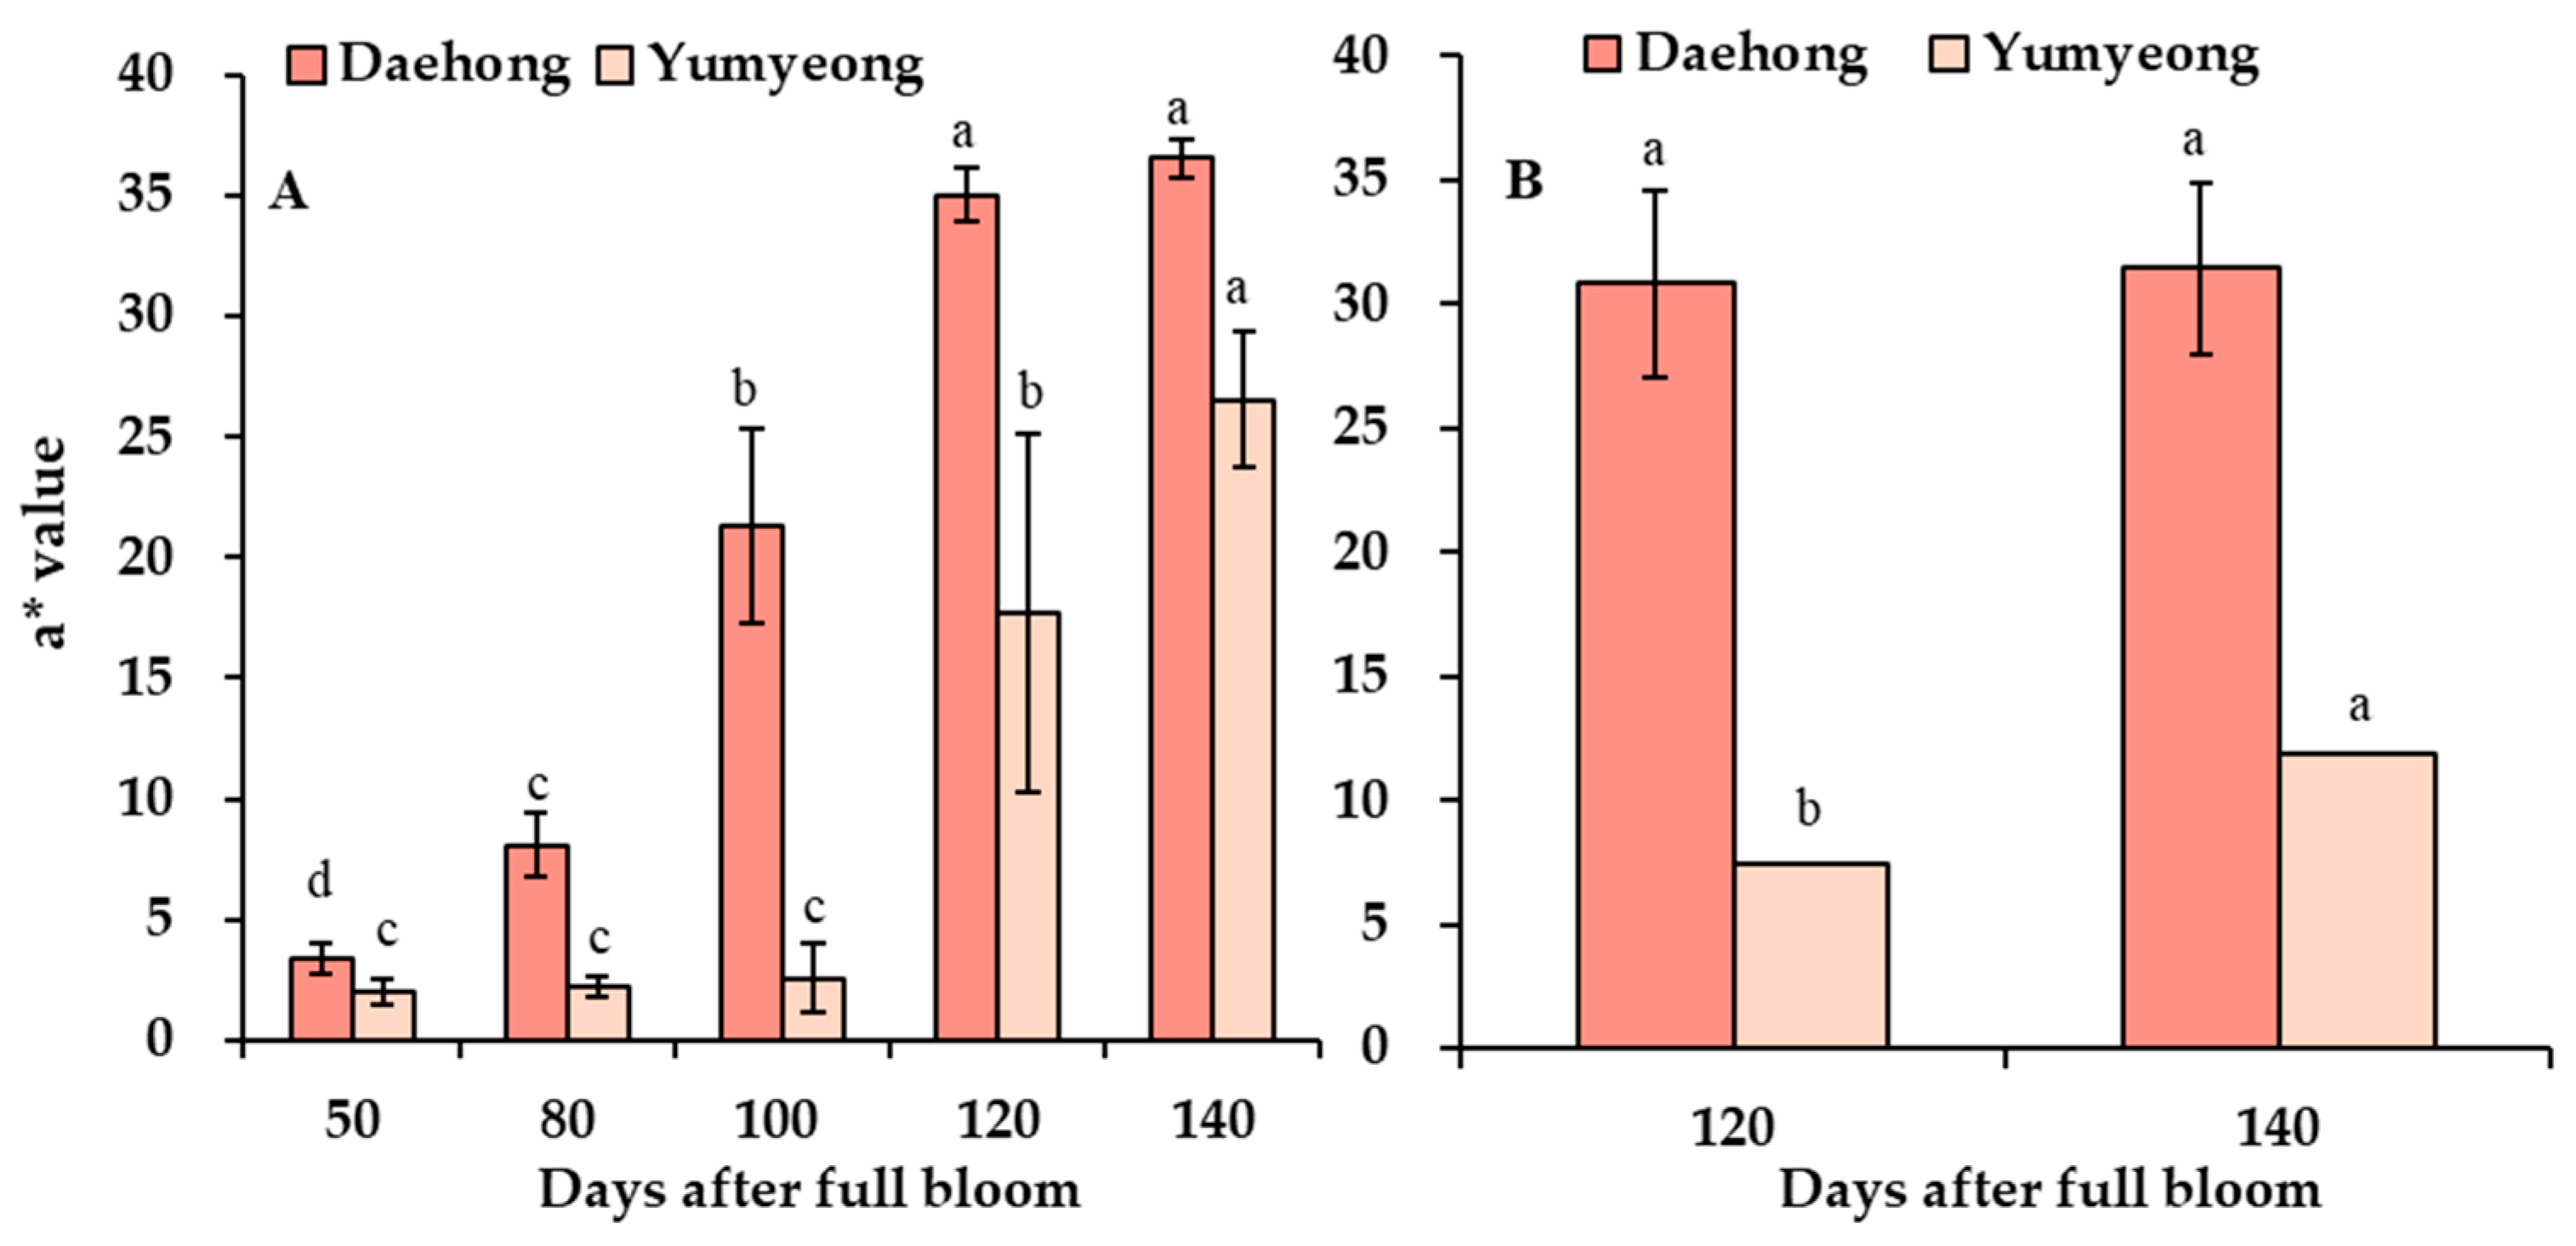
Hunter a* values of the peach exocarp and mesocarp serve as indicators of redness, a key attribute influencing consumer sensory perception [31]. Previous studies have reported that Hunter a* values in the exocarp increase markedly after approximately 110 DAFB [32], a trend that was confirmed in the present study. In our results, both cultivars exhibited significant increases in exocarp Hunter a* values after 120 DAFB (Figure 5A). In the mesocarp, Hunter a* values began to increase at 120 DAFB, coinciding with the initial appearance of red pigmentation (Figure 1 and Figure 5B). For ‘Daehong,’ no statistically significant difference was observed between 120 and 140 DAFB, whereas ‘Yumyeong’ exhibited a significant increase at 140 DAFB compared to 120 DAFB (Figure 5B).
Although Hunter a* values increased as the fruit matured, most values—particularly in the mesocarp—remained within the neutral gray zone (−30 to +30), where visual redness is generally not perceived. Only the exocarp of the ‘Daehong’ cultivar exceeded +30 after 120 DAFB, indicating the onset of a visibly red hue. However, more comprehensive chromaticity metrics such as chroma (C*) and hue angle (h°) were not included in this study; these parameters could have provided a more detailed assessment of color intensity. To enhance color evaluation in future studies, it is recommended to incorporate chromaticity analyses as well as hedonic color scales supported by photographic references.
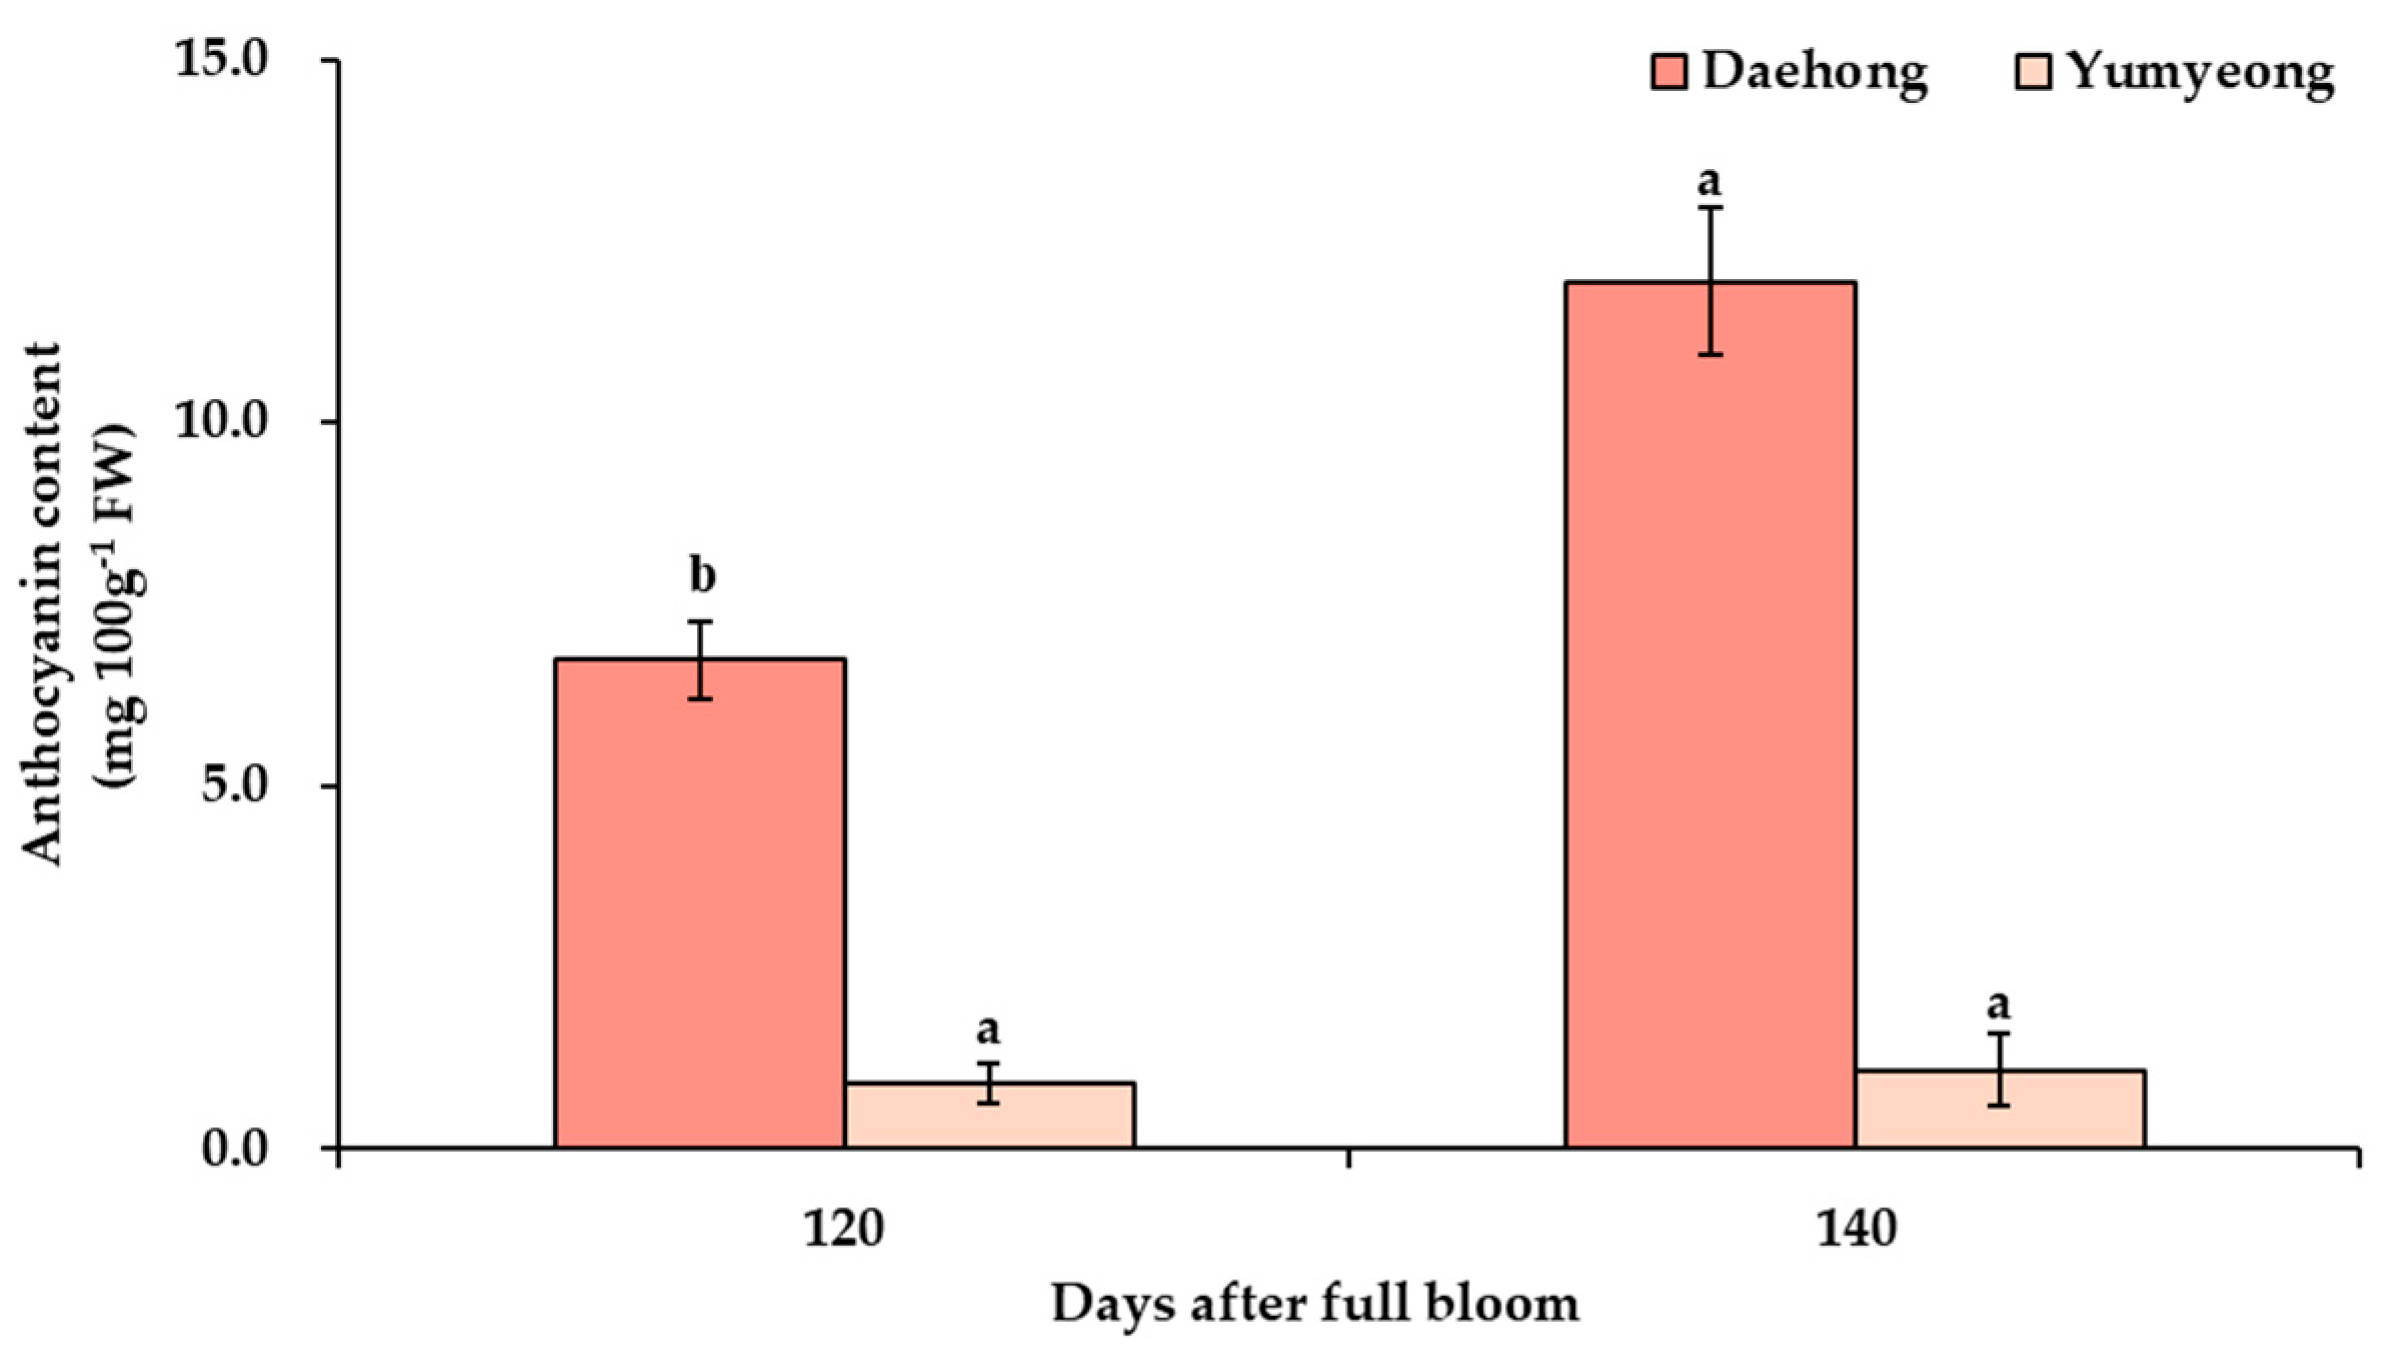
The anthocyanin content displayed similar levels in the two cultivars at 120 DAFB. However, by 140 DAFB, ‘Daehong’ exhibited a significant increase, surpassing that of ‘Yumyeong’ (Figure 6). This trend may be related to the concurrent rise in Hunter a* values, as reported by [33], who observed a positive association between redness and anthocyanin accumulation in peaches. Generally, anthocyanin concentrations range from 1 to 20 mg∙100 g−1 FW in peach flesh and 5–100 mg∙100 g−1 FW in the peel, while yellow- and white-fleshed cultivars often contain extremely low or undetectable levels [31,34].
Anthocyanin biosynthesis is regulated by a combination of genetic factors, transcriptional control, and environmental conditions. In red-fleshed cultivars, cyanidin-3-glucoside is typically the predominant anthocyanin, primarily accumulated in the mesocarp [35]. The anthocyanin levels recorded in this study are consistent with previously reported ranges.

3.6. Principal Component Analysis

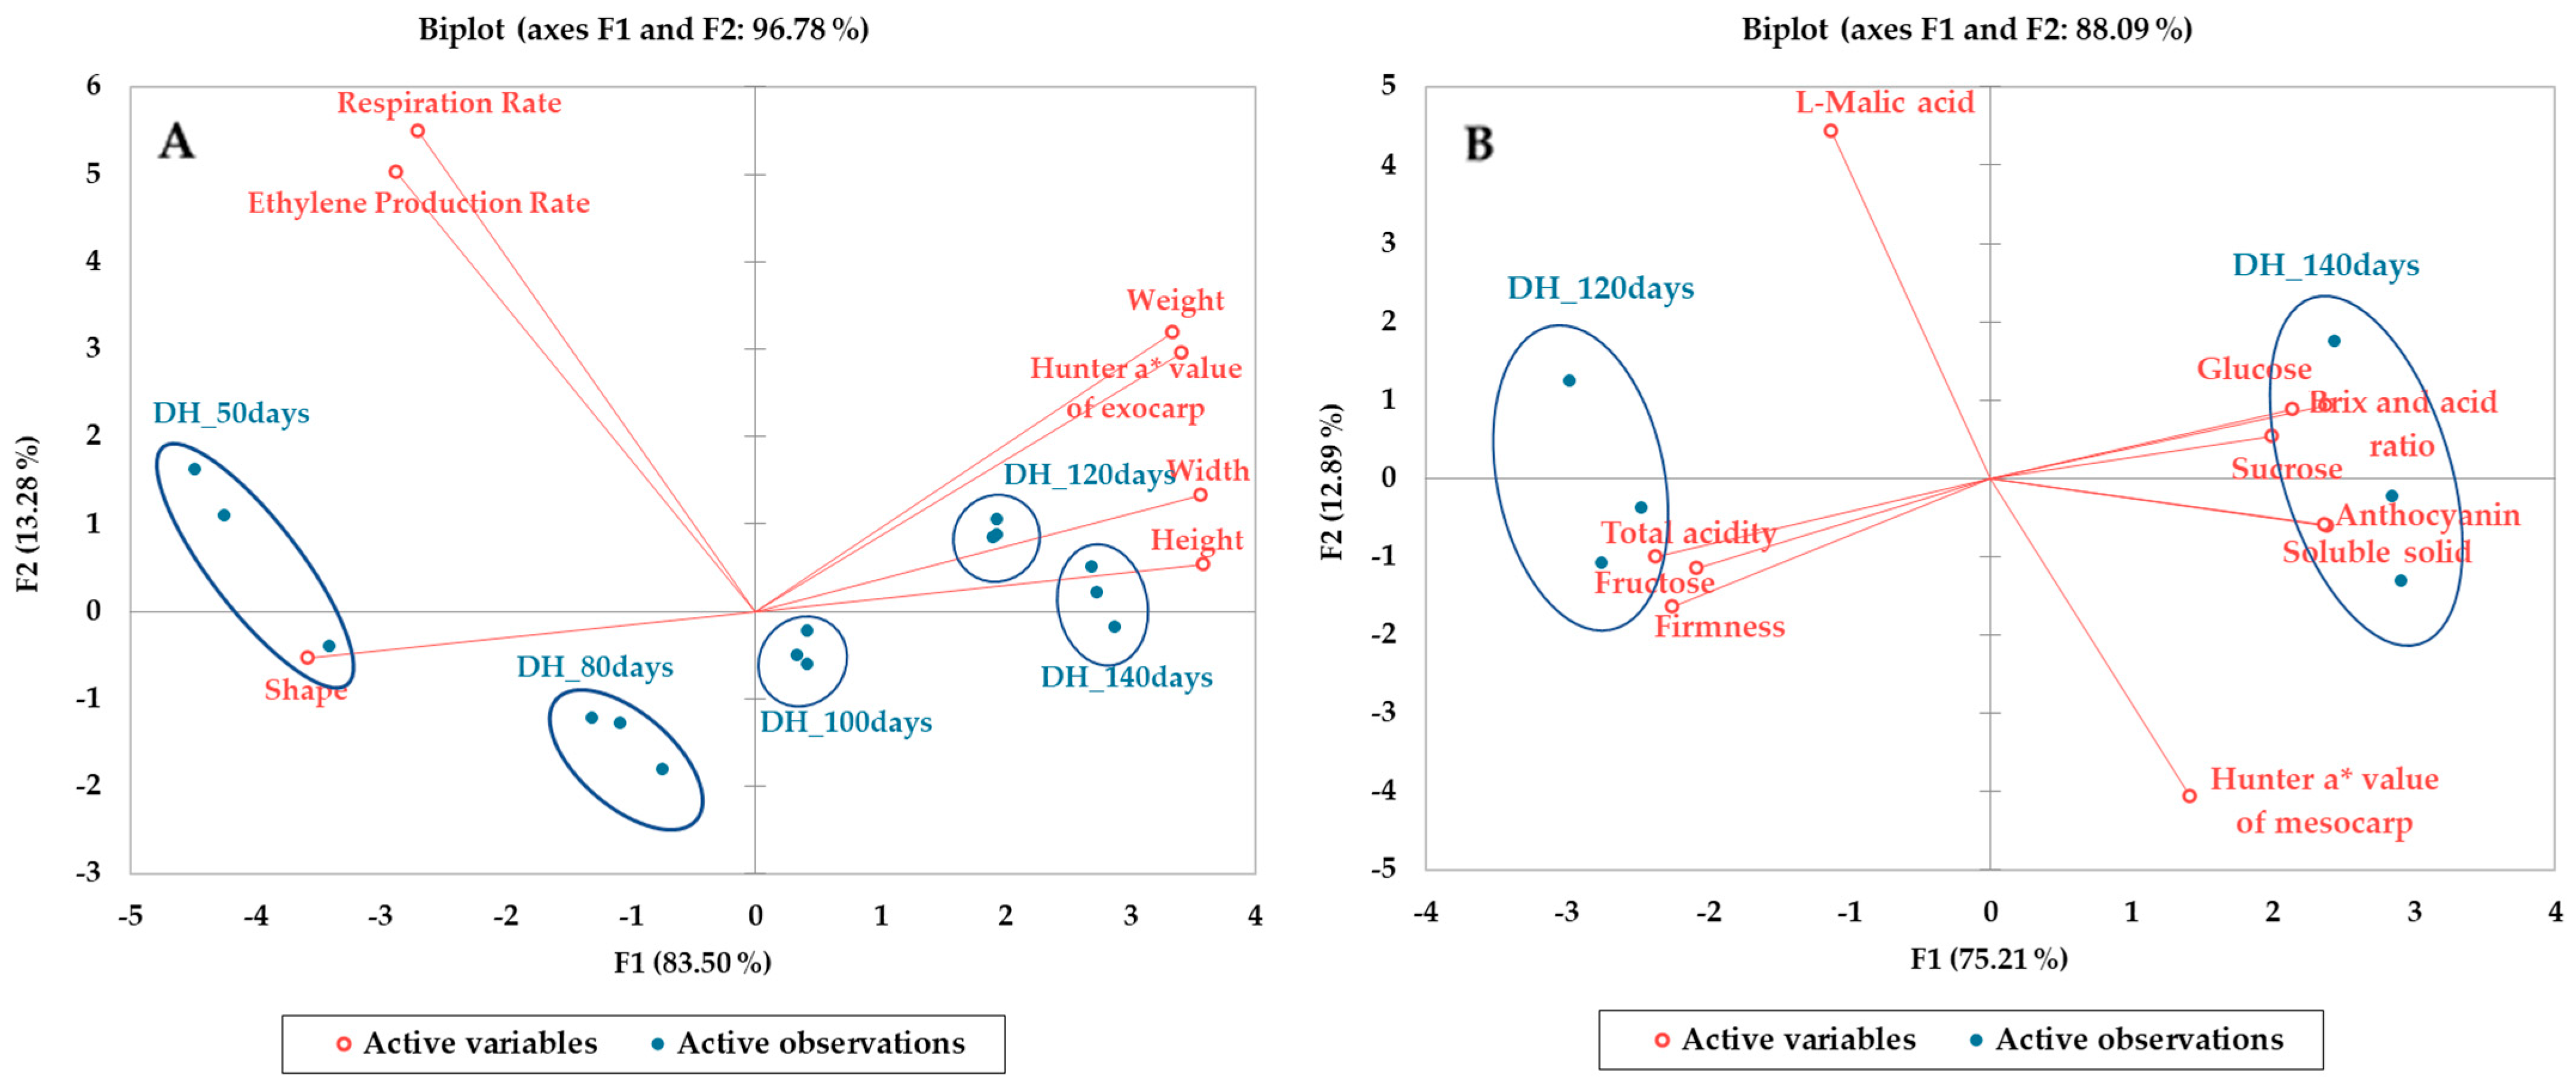
Principal component analysis (PCA) was conducted to evaluate the external quality of ‘Daehong’ peaches at 50, 80, 100, 120, and 140 DAFB, aiming to identify patterns that could aid in determining the optimal harvest time. The first principal component (F1) explained 83.50% of the variance, and the second principal component (F2) explained 13.28%, accounting for a cumulative variance of 96.78%. The score plot showed a clear progression from negative to positive values along F1 as DAFB increased, with 120 and 140 DAFB located in the positive dimension (first quadrant). The primary external quality variables contributing to this dimension included fruit weight, width, height, and exocarp Hunter a* values (Figure 7A).
PCA of internal quality at 120 and 140 DAFB was performed to assess the biochemical attributes of ‘Daehong’ peaches. F1 and F2 explained 75.21% and 12.89% of the variance, respectively, for a cumulative variance of 88.09%. As shown in Table 3 and Figure 2A, sweetness, sugar–acid ratio, and reducing sugars were all higher at 140 DAFB than at 120 DAFB. Variables such as glucose, sucrose, soluble solids content (SSC), Brix, sugar–acid ratio, and anthocyanin concentration were positioned in the positive dimension (first quadrant) at 140 DAFB (Figure 7B).
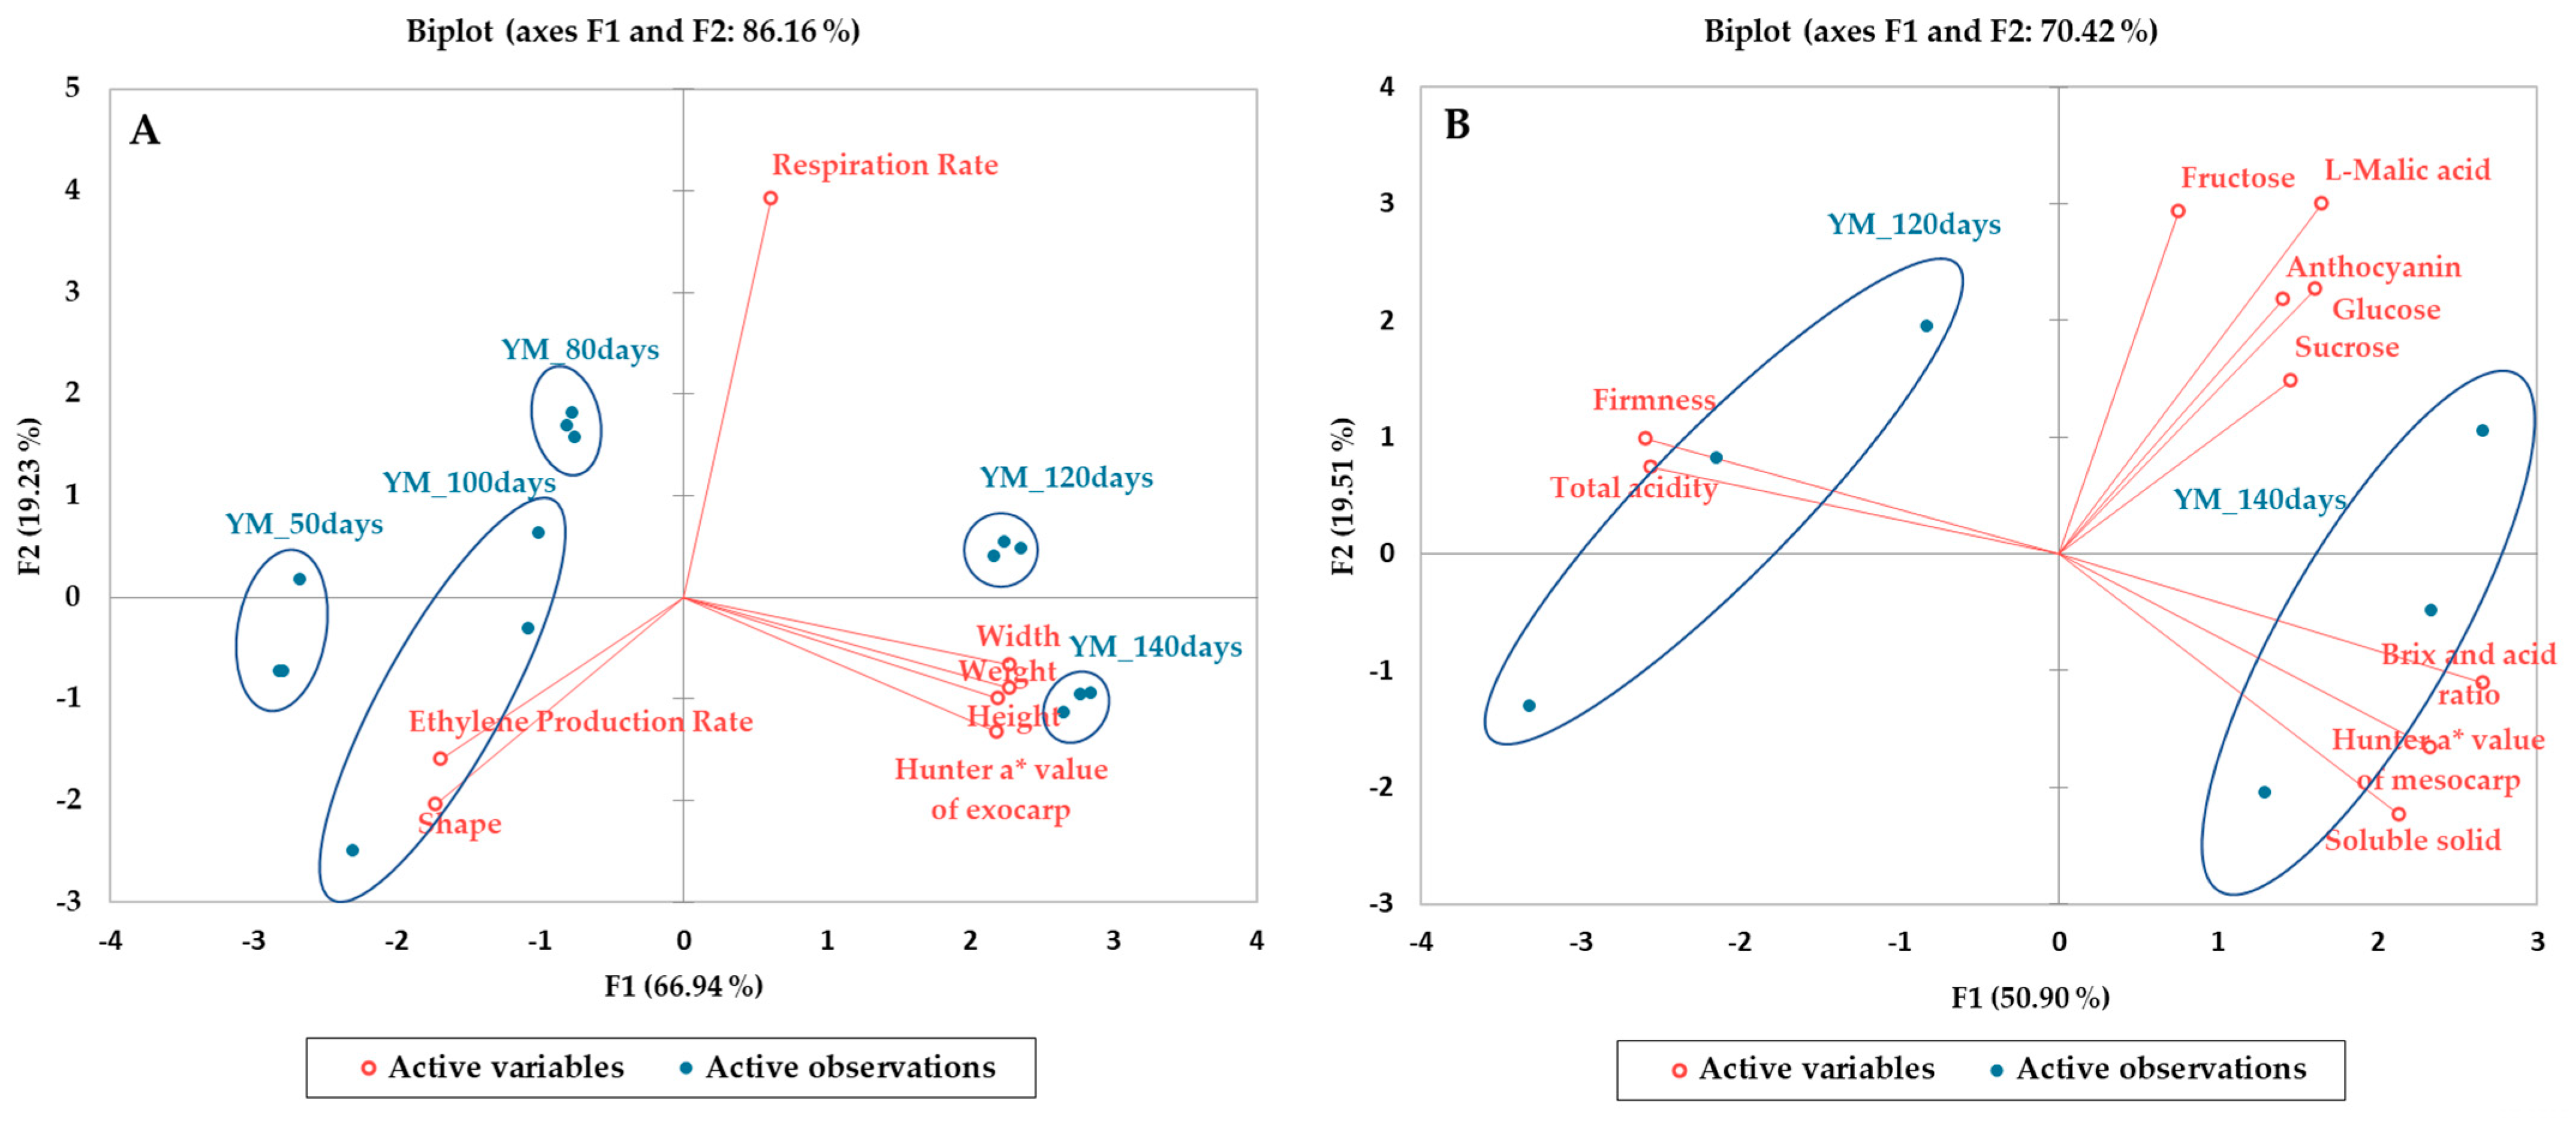
Similarly, PCA was applied to the external quality parameters of ‘Yumyeong’ peaches at 50, 80, 100, 120, and 140 DAFB. F1 explained 66.94% of the variance, and F2 explained 19.23%, for a total of 86.16%. In the score plot, 120 DAFB fell within the positive dimension (first quadrant), although no strongly correlated active variables were observed. At 140 DAFB, the positive F1 dimension (second quadrant) was associated with weight, width, height, and exocarp Hunter a* values (Figure 8A).
PCA of internal quality for ‘Yumyeong’ peaches at 120 and 140 DAFB revealed that F1 and F2 accounted for 50.90% and 19.51% of the variance, respectively, for a total of 70.42%. At 120 DAFB, firmness and total acidity were located in the negative dimension (third and fourth quadrants), whereas at 140 DAFB, the sugar–acid ratio, mesocarp Hunter a* values, and SSC were positioned in the positive dimension (first and second quadrants) (Figure 8B). This pattern closely resembled that of ‘Daehong’ peaches (Figure 7).
Overall, the PCA results for both cultivars indicate that as peaches matured, they exhibited increases in size, weight, SSC, and color intensity, accompanied by declines in firmness and physiological activities such as respiration and ethylene production. These maturity-related changes highlight the importance of optimizing harvest timing to minimize postharvest quality deterioration during storage and distribution [31].

3.7. Accumulated Temperature

Past GDD values calculated for a 120-day period after full bloom were 1651.7 °C in 2012, 1728.5 °C in 2017, 1788.3 °C in 2019, and 1814.8 °C in 2021, while the 2022 value reached 1826.1 °C, indicating a continuous upward trend in thermal accumulation over the past decade (Table 3) [17].
The growing degree day (GDD) requirement for late-maturing peach cultivars has been reported to be approximately 1800 °C [10]. The results of this study show that GDD accumulation in 2022 exceeded this threshold, reflecting a long-term trend toward greater thermal accumulation in the region. Similar patterns have been reported for other fruit crops, where higher mean daily and accumulated temperatures in 2019 compared with 2018 advanced harvest dates and affected fruit quality, as observed in pears [35].
GDD is widely used as a predictive tool for crop growth and maturation, with cultivar-specific thresholds determining harvest readiness. As GDD accumulates, sugar content typically increases, acidity decreases, and visible color development intensifies—changes that serve as reliable indicators of optimal harvest timing [36,37].
The GDD values accumulated by 120 and 140 DAFB correspond to critical maturity thresholds for both cultivars, influencing multiple physiological and quality-related traits. At 120 DAFB, the sharp increase in fruit weight and SSC, along with a marked reduction in TA, indicates the onset of commercial maturity. By 140 DAFB, maximum values of fruit weight, soluble solids, and red coloration (Hunter a*) were achieved, signifying full physiological ripeness. These observations suggest that GDD is a reliable predictor of harvest timing and fruit development, aligning with previous reports in peach and other fruit crops [18,34,35].

4. Conclusions

This study examined the physiological changes in the ‘Daehong’ peach cultivar across different days after full bloom (DAFBs) and identified optimal harvest timing by integrating internal and external quality parameters with growing degree days (GDDs). The findings showed that fruit size, weight, and coloration reached commercial standards around 120 DAFB. Internal quality traits—such as soluble solids content, sugar–acid ratio, and firmness—also reached desirable levels at this stage, indicating harvest readiness. Sucrose was the predominant sugar and increased with maturity, while malic acid content declined, producing a favorable sweetness–acidity balance, particularly at 120 and 140 DAFB. However, the reduction in firmness observed at 140 DAFB could compromise postharvest storability and elevate the risk of quality loss during distribution.
Hunter a* values and anthocyanin content increased over time, especially in ‘Daehong’, enhancing its market appeal through intensified red pigmentation. Principal component analysis (PCA) confirmed that both ‘Daehong’ and ‘Yumyeong’ exhibited peak overall quality between 120 and 140 DAFB. Nonetheless, the potential for postharvest deterioration beyond 120 DAFB underscores the need for more objective maturity indices. Given the increasing variability of climate conditions, relying solely on DAFB may be insufficient. Therefore, we recommend determining harvest timing for ‘Daehong’ peaches using accumulated GDD, with optimal harvest occurring when GDD reaches approximately 1800 °C. This climate-resilient criterion offers a more consistent basis for ensuring fruit quality and marketability.

Author Contributions

Conceptualization and methodology, Y.H.R., I.-L.C., H.N.J. and H.-M.K.; experiment performance and data curation, Y.H.R., J.H.L., Y.B.K. and I.-L.C.; writing, Y.H.R. and I.-L.C.; writing—review and editing, I.-L.C., H.S.Y., H.N.J. and H.-M.K. All authors have read and agreed to the published version of the manuscript.

Funding

This work was supported by the project “Stable Production and Value-added Commercialization Technology Development of ‘Daehong’ Peaches in Hongcheon”, funded by Rural Development Administration (RDA) (Project No. PJ016670) and the Basic Science Research Program through the National Research Foundation of Korea (NRF), which is funded by the Ministry of Education (RS-2021-NR060130).

Data Availability Statement

The original contributions presented in this study are included in the article. Further inquiries can be directed to the corresponding author.

Acknowledgments

The authors sincerely thank the reviewers and editors for their valuable feedback and efforts. They also appreciate the support of the laboratory members, whose contributions were essential to this research.

Conflicts of Interest

The authors declare no conflicts of interest.

References

  1. Korean Statistical Information Serveice (KOSIS). Available online: https://kosis.kr/statHtml/statHtml.do?orgId=101&tblId=DT_1ET0014&conn_path=I2 (accessed on 29 June 2023).
  2. Roh, Y.H.; Lee, J.H.; Kwon, Y.B.; Choi, I.L.; Jeong, H.N.; Kang, H.M. Effect of 1-Methylcyclopropene (1-MCP) Treatment and MAP on Quality Changes of Peach ‘Daehong’ during Cold Storage. J. Bio-Environ. Control 2023, 32 (Suppl. S4), 267–277. [Google Scholar] [CrossRef]
  3. Kim, J.H.; Jeong, H.N.; Lee, J.C.; Lee, K.O.; Lee, J.Y.; Choi, J.S.; Kwon, H.J.; Won, J.H.; Choi, J.Y. Effects of physical properties of bagging papers on coloration and quality of ‘Daehong’ peach cultivar during rainy season. Hortic. Sci. Technol. 2022, 40 (Suppl. S2), 119–120. [Google Scholar]
  4. Kim, Y.B.; Noh, H.S.; Shin, D.H.; Ahn, Y.J.; Jeong, J.S. Use the results of market tests of new varieties of peach ‘Daehong’ as marketing materials. Hortic. Sci. Technol. 2019, 37 (Suppl. S2), 119–120. [Google Scholar]
  5. Cho, M.D.; Park, H.S.; Kim, Y.K. Changes of Fruit Structure and Sugar Contents during the Fruit Growth and Development in ‘Yumyeong’ Peach [Prunus persica (L.) Batsch]. Hortic. Sci. Technol. 2000, 18 (Suppl. S3), 353–359. [Google Scholar]
  6. Anthony, B.M.; Sterle, D.G.; Minas, I.S. Robust non-destructive individual cultivar models allow for accurate peach fruit quality and maturity assessment following customization in phenotypically similar cultivars. Postharvest Biol. Technol. 2023, 195, 112148. [Google Scholar] [CrossRef]
  7. Zhang, P.; Wei, Y.; Xu, F.; Wang, H.; Chen, M.; Shao, X. Changes in the chlorophyll absorbance index (I AD) are related to peach fruit maturity. N. Z. J. Crop Hortic. Sci. 2020, 48, 34–46. [Google Scholar] [CrossRef]
  8. Minas, I.S.; Tanou, G.; Molassiotis, A. Environmental and orchard bases of peach fruit quality. Sci. Hortic. 2018, 235, 307–322. [Google Scholar] [CrossRef]
  9. Anthony, B.M.; Minas, I.S. Redefining the impact of preharvest factors on peach fruit quality development and metabolism: A review. Sci. Hortic. 2022, 297, 110919. [Google Scholar] [CrossRef]
  10. Verma, P.; Singh, J.; Sharma, S.; Thakur, H. Phenological growth stages and growing degree days of peach [Prunus persica (L.) Batsch] in sub-temperate climatic zone of North-Western Himalayan region using BBCH scale. Ann. Appl. Biol. 2022, 182, 284–294. [Google Scholar] [CrossRef]
  11. Choi, I.L.; Lee, J.H.; Choi, D.H.; Wang, L.X.; Kang, H.M. Evaluation of the Storage Characteristics in Maintaining the Overall Quality of Whole and Fresh-Cut Romaine Lettuce during MA Storage. Horticulturae 2021, 7, 461. [Google Scholar] [CrossRef]
  12. Qin, Q.; Wang, L.; Wang, Q.; Wang, R.; Li, C.; Qiao, Y.; Liu, H. Postharvest Flavor Quality Changes and Preservation Strategies for Peach Fruits: A Comprehensive Review. Plants 2025, 14, 1310. [Google Scholar] [CrossRef] [PubMed]
  13. Liu, H.; Qian, M.; Song, C.; Li, J.; Zhao, C.; Li, G.; Wang, A.; Han, M. Down-Regulation of PpBGAL10 and PpBGAL16 Delays Fruit Softening in Peach by Reducing Polygalacturonase and Pectin Methylesterase Activity. Front. Plant Sci. 2018, 9, 1015. [Google Scholar] [CrossRef] [PubMed]
  14. Aslam, M.M.; Deng, L.; Wang, X.; Wang, Y.; Pan, L.; Liu, H.; Niu, L.; Lu, Z.; Cui, G.; Zeng, W.; et al. Expression patterns of genes involved in sugar metabolism and accumulation during peach fruit development and ripening. Sci. Hortic. 2019, 257, 108633. [Google Scholar] [CrossRef]
  15. Zheng, B.; Zhao, L.; Jiang, X.; Cherono, S.; Liu, J.J.; Ogutu, C.; Ntini, C.; Zhang, X.; Han, Y. Assessment of organic acid accumulation and its related genes in peach. Food Chem. 2021, 334, 127567. [Google Scholar] [CrossRef]
  16. Fuleki, T.; Francis, F.J. Quantitative methods for anthocyanins. 1. Extraction and determination of total anthocyanin in cranberries. J. Food Sci. 1968, 33, 72–77. [Google Scholar] [CrossRef]
  17. Korea Meteorological Administration (KMA). 2022. Available online: http://www.weather.go.kr (accessed on 17 April 2025).
  18. Pinzón Sandoval, E.H.; Balaguera López, H.E.; Becerra González, M.E. Phenological and physicochemical changes during fruit development in two peach cultivars in the high tropics. Rev. UDCA Actual. Divulg. Cient. 2022, 25, e1942. [Google Scholar] [CrossRef]
  19. Cirilli, M.; Rossini, L. Many candidates for a single chair: A critical review of the genetic determinant of flat fruit shape trait in peach (Prunus persica L. Batsch). Tree Genet. Genomes 2021, 17, 34. [Google Scholar] [CrossRef]
  20. Martínez-González, M.E.; Balois-Morales, R.; Alia-Tejacal, I.; Cortes-Cruz, M.A.; Palomino-Hermosillo, Y.A.; López-Gúzman, G.G. Poscosecha de frutos: Maduración, ablandamiento y control transcripcional. Rev. Mex. Cienc. Agríc. 2017, 19, 4089–4101. [Google Scholar]
  21. Africano-Pérez, K.L.; Balaguera-López, H.E.; Almanza-Merchán, P.J.; Cárdenas-Hernández, J.F.; Herrera-Arévalo, A. Caracterizacion poscosecha del fruto de durazno [Prunus persica (L.) Bastch] cv. Dorado producido bajo condiciones de tropico alto. Rev. Colomb. Cienc. Hortic. 2016, 10, 232–240. [Google Scholar] [CrossRef]
  22. Hayama, H.; Shimada, T.; Fujii, H.; Ito, A.; Kashimura, Y. Ethylene-regulation of fruit softening and softening-related genes in peach. J. Exp. Bot. 2006, 57, 4071–4077. [Google Scholar] [CrossRef]
  23. Payasi, A.; Mishra, N.N.; Chaves, A.L.S.; Singh, R. Biochemistry of fruit softening: An overview. Physiol. Mol. Biol. Plants 2009, 15, 103–113. [Google Scholar] [CrossRef]
  24. Xu, G.; Li, C.; Qin, S.; Xiao, W.; Fu, X.; Chen, X.; Li, D. Changes in Sucrose and Sorbitol Metabolism Cause Differences in the Intrinsic Quality of Peach Fruits Cultivated in Field and Greenhouse Environments. Agronomy 2022, 12, 2877. [Google Scholar] [CrossRef]
  25. Kroger, M.; Meister, K.; Kava, R. Low-calorie sweeteners and other sugar substitutes: A review of the safety issues. Compr. Rev. Food Sci. Food Saf. 2006, 5, 35–47. [Google Scholar] [CrossRef]
  26. Walker, R.P.; Famiani, F. Organic acids in fruits: Metabolism, functions and contents. Hortic. Rev. 2018, 45, 371–430. [Google Scholar] [CrossRef]
  27. Famiani, F.; Baldicchi, A.; Moscatello, S.; Battistelli, A.; Walker, R.P. The contribution of stored malate and citrate to the substrate requirements of metabolism of ripening peach (Prunus persica L. Batsch) flesh is negligible. Implications for the occurrence of phosphoenolpyruvate carboxykinase and gluconeogenesis. Plant Physiol. Biochem. 2020, 151, 313–324. [Google Scholar] [CrossRef]
  28. Zheng, Y.; Xu, L.; Yang, S.; Zhang, S.; Wang, Y. Comparative network analysis reveals the dynamics of organic acid diversity during fruit ripening in peach (Prunus persica L. Batsch). BMC Plant Biol. 2023, 23, 240. [Google Scholar] [CrossRef]
  29. Kays, S.J.; Paull, E.R. Postharvest Biology; Exon Press: Athens, GA, USA, 2004. [Google Scholar]
  30. Tatsuki, M.; Nakajima, N.; Fujii, H.; Shimada, T.; Nakano, M.; Hayashi, K.; Hayama, H.; Yoshioka, H.; Nakamura, Y. Increased levels of IAA are required for system 2 ethylene synthesis causing fruit softening in peach (Prunus persica L. Batsch). J. Exp. Bot. 2013, 64, 1049–1059. [Google Scholar] [CrossRef]
  31. Pan, L.; Zeng, W.; Niu, L.; Lu, Z.; Liu, H.; Cui, G.; Wang, Z. PpYUC11, a strong candidate gene for the stony hard phenotype in peach (Prunus persica L. Batsch), participates in IAA biosynthesis during fruit ripening. J. Exp. Bot. 2015, 66, 7031–7044. [Google Scholar] [CrossRef]
  32. Andreotti, C.; Ravaglia, D.; Ragaini, A.; Costa, G. Phenolic compounds in peach (Prunus persica) cultivars at harvest and during fruit maturation. Ann. Appl. Biol. 2018, 153, 11–23. [Google Scholar] [CrossRef]
  33. Predieri, S.; Ragazzini, P.; Rondelli, R. Sensory evaluation and peach fruit quality. VI Int. Peach Symp. 2005, 713, 429–434. [Google Scholar] [CrossRef]
  34. Liu, H.; Cao, J.; Jiang, W. Changes in phenolics and antioxidant property of peach fruit during ripening and responses to 1-methylcyclopropene. Postharvest Biol. Technol. 2015, 108, 111–118. [Google Scholar] [CrossRef]
  35. Cho, J.H.; Yang, U.; Wi, S.G.; Lee, B.R.; Oh, S.W.; Kim, M.S.; Lee, S.H. Potential Effects of Temperature Differences on the Soluble Sugar Content in Pear Fruit during the Growing Seasons of 2018 and 2019. Hortic. Sci. Technol. 2021, 39, 560–571. [Google Scholar] [CrossRef]
  36. Amaral, M.H.; McConchie, C.; Dickinson, G.; Walsh, K.B. Growing degree day targets for fruit development of australian mango cultivars. Horticulturae 2023, 9, 489. [Google Scholar] [CrossRef]
  37. Marra, F.P.; DeJong, T.M.; Marini, R.P. Predicting peach maturity with thermal time models. Acta Hortic. 2002, 592, 465–472. [Google Scholar] [CrossRef]
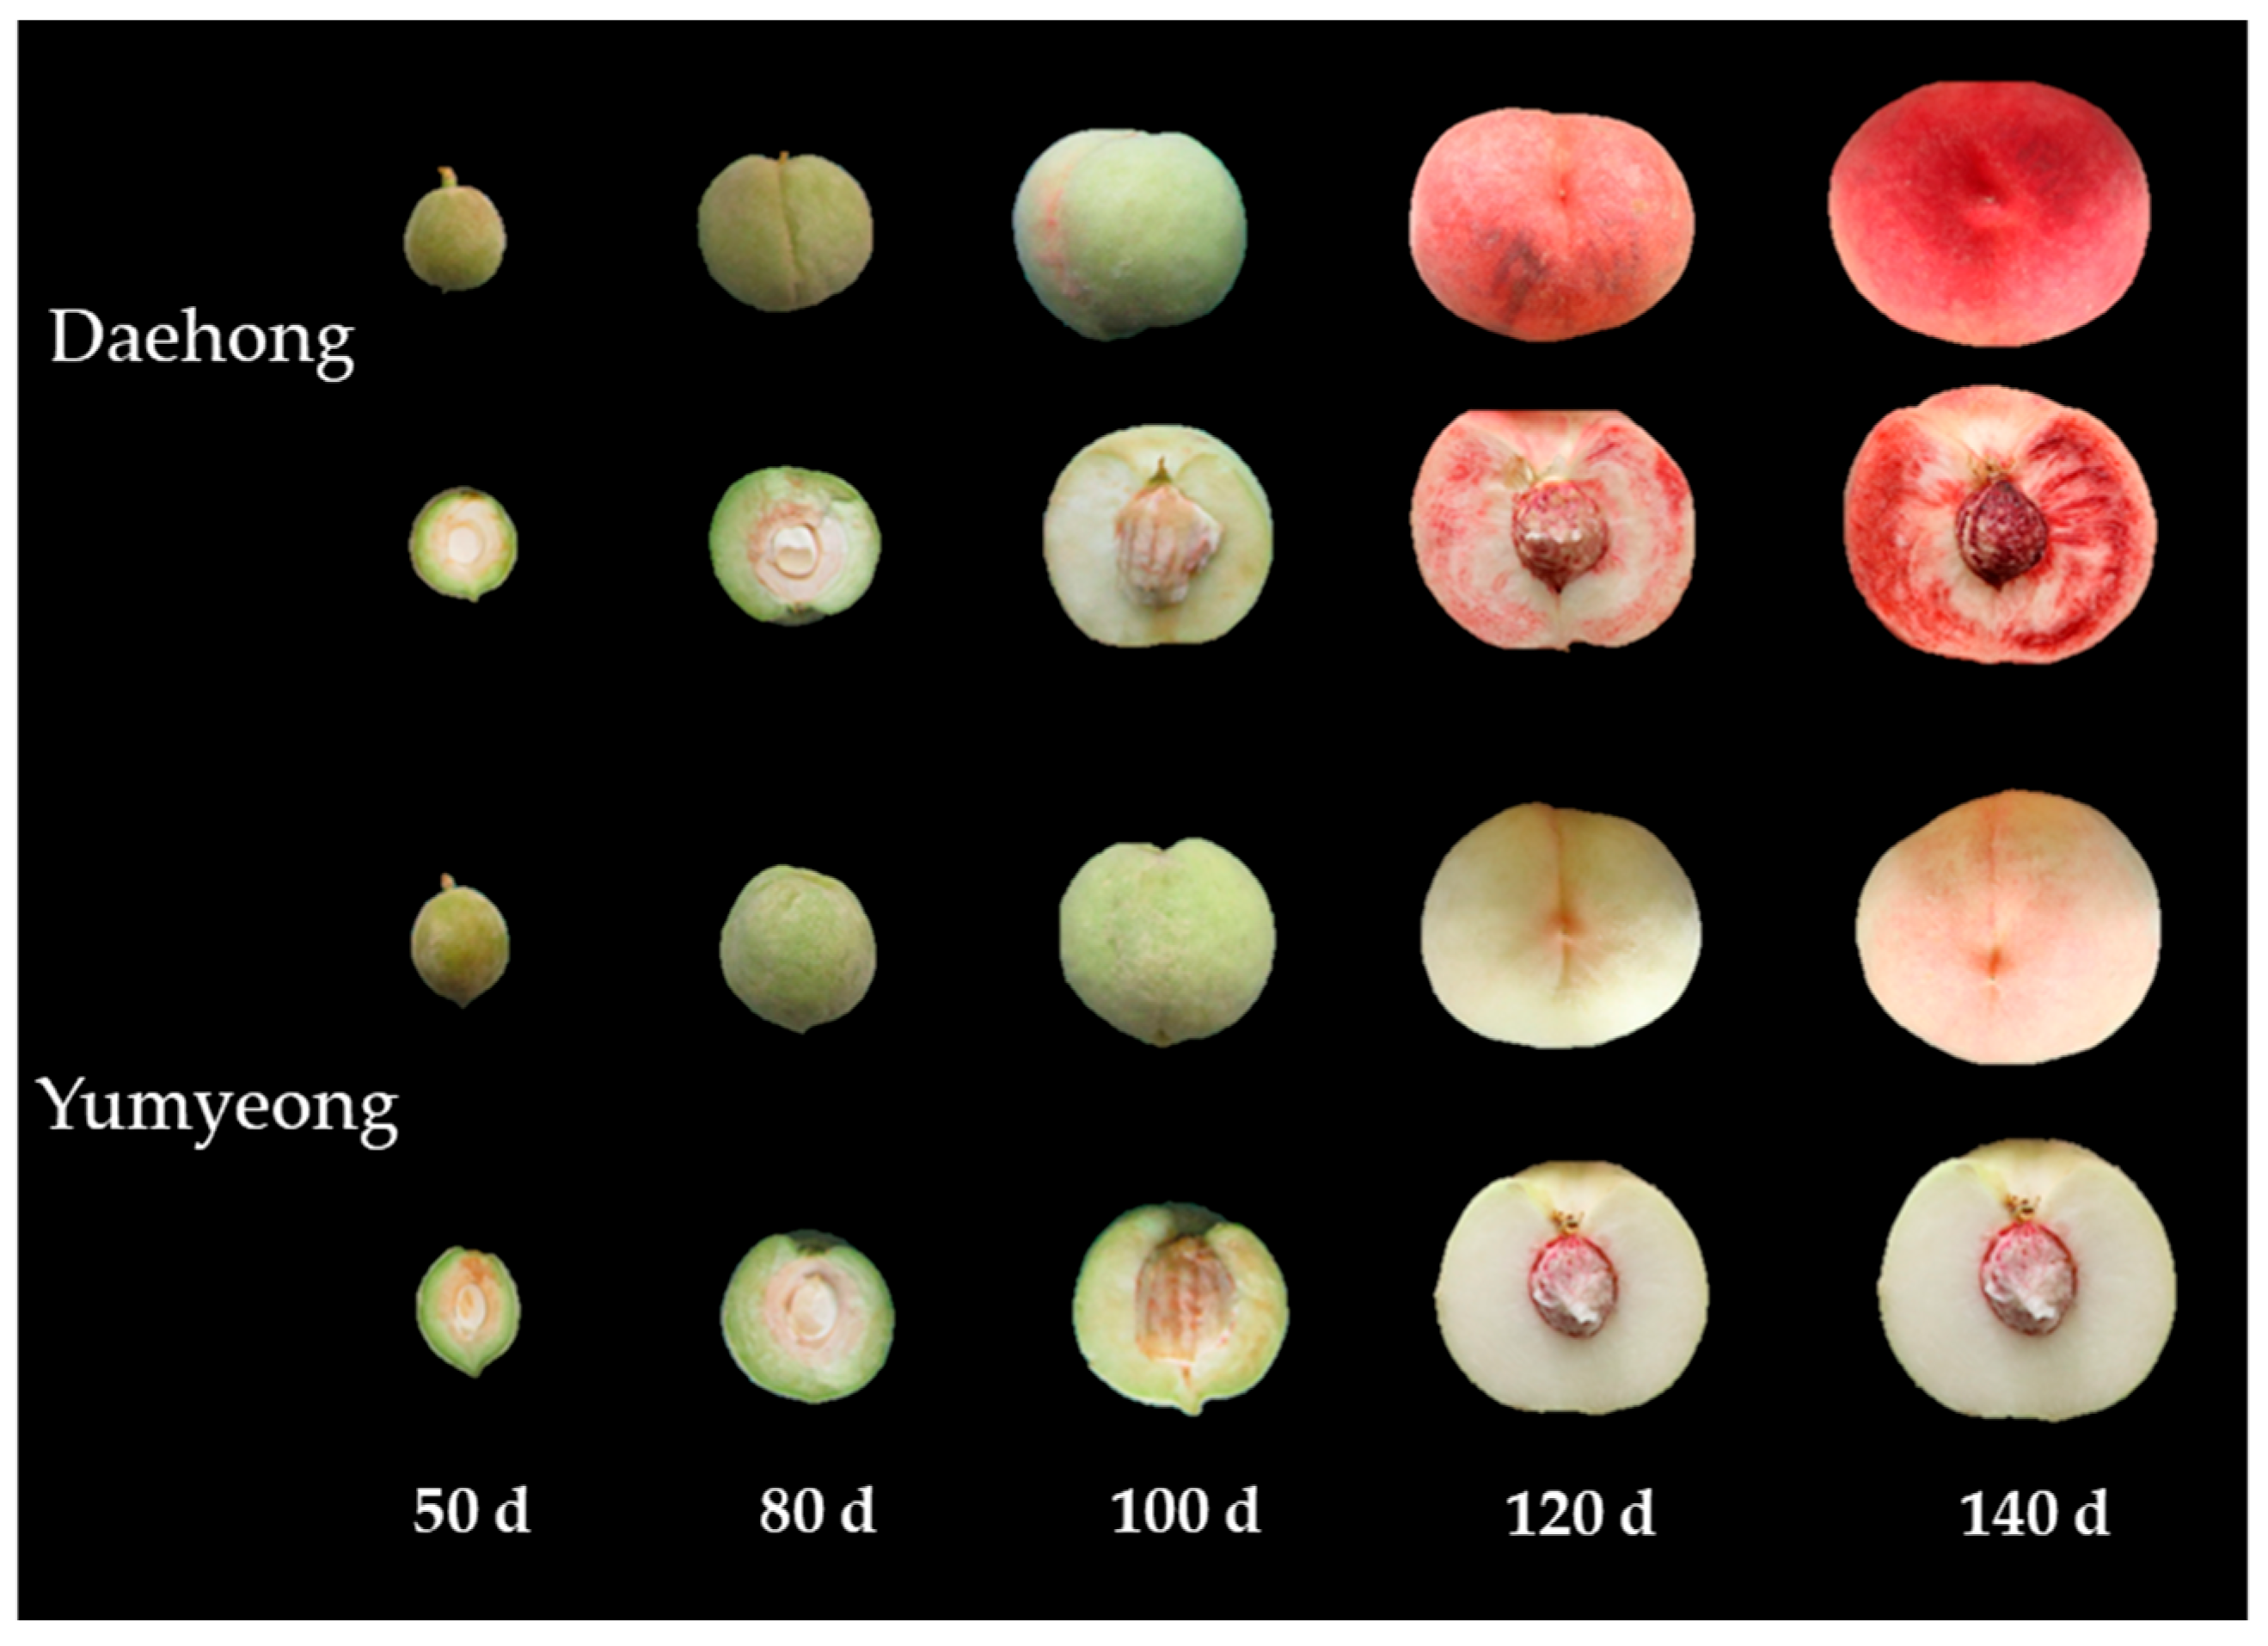
Figure 1. Peach fruits at different developmental stages (50 to 140 DAFB) in the 2022 harvest, showing the exocarp and mesocarp of ‘Daehong’ and ‘Yumyeong’.
Horticulturae 11 01013 g001
Figure 2. Fructose, glucose, and sucrose contents (mg g−1 FW) in ‘Daehong’ (A) and ‘Yumyeong’ (B) peaches during fruit development and ripening in the 2022 harvest. Lowercase letters indicate significant differences among the DAFB stages within each cultivar, p < 0.05. Vertical bars represent ± SE (n = 4).
Horticulturae 11 01013 g002
Figure 3. L-malic acid (mg∙100 g−1 FW) in the ‘Daehong’ and ‘Yumyeong’ peaches during fruit development and ripening in the 2022 harvests. Lowercase letters indicate significant differences among the DAFB stages within each cultivar, p < 0.05. Vertical bars represent ± SE (n = 4).
Horticulturae 11 01013 g003
Figure 4. Respiration rate (A) and ethylene production rate (B) in the ‘Daehong’ and ‘Yumyeong’ peach cultivars at different days after full bloom during the 2022 harvest. Lowercase letters indicate significant differences among the DAFB stages within each cultivar, p < 0.05. Vertical bars represent ± SE (n = 10).
Horticulturae 11 01013 g004
Figure 5. Changes in Hunter a* values of the exocarp (A) and mesocarp (B) in the ‘Daehong’ and ‘Yumyeong’ peach cultivars at different days after full bloom during the 2022 harvest. Lowercase letters indicate significant differences among the DAFB stages within each cultivar, p < 0.05. Vertical bars represent ± SE (n = 10).
Horticulturae 11 01013 g005
Figure 6. Anthocyanin content (mg∙100 g−1 FW) in the ‘Daehong’ and ‘Yumyeong’ peach fruits at 120 and 140 days after full bloom during the 2022 harvest. Lowercase letters indicate significant differences among the DAFB stages within each cultivar, p < 0.05. Vertical bars represent ± SE (n = 10).
Horticulturae 11 01013 g006
Figure 7. PCA biplots for the ‘Daehong’ peach cultivar: (A) external quality parameters across 50, 80, 100, 120, and 140 DAFB; (B) internal biochemical attributes at 120 and 140 DAFB.
Horticulturae 11 01013 g007
Figure 8. The biplot shows the PCA results for external quality factors of the ‘Yumyeong’ peach variety across different days after full bloom (50, 80, 100, 120, and 140 days) (A). This biplot represents the PCA for internal fruit quality, particularly focusing on biochemical attributes across different days after full bloom (120 and 140 days) (B).
Horticulturae 11 01013 g008
Table 1. Changes in physical properties of the ‘Daehong’ and ‘Yumyeong’ peach cultivars on different days after full bloom during the 2022 harvest.
CultivarsDays After Full Bloom zFresh Weight
(g)
Fruit Length
(mm)
Fruit Width
(mm)
Fruit Shape
(Height/Width)
Daehong50 days10.3 ± 0.81 d y34.5 ± 2.29 d25.7 ± 0.89 d1.26 ± 1.27 a
80 days55.4 ± 7.10 c52.6 ± 1.53 c43.1 ± 2.57 c1.05 ± 1.45 b
100 days134.1 ± 6.25 b64.4 ± 2.58 b51.4 ± 1.88 b1.02 ± 2.11 b
120 days343.1 ± 7.11 a73.5 ± 2.84 a76.2 ± 2.79 a0.96 ± 2.17 c
140 days352.7 ± 5.90 a74.0 ± 4.61 a80.1 ± 2.94 a0.75 ± 1.19 c
Yumyeong50 days11.7 ± 0.90 d34.9 ± 1.29 d27.9 ± 1.25 d1.25 ± 0.03 a
80 days56.1 ± 6.24 c50.5 ± 1.15 c48.7 ± 1.94 c1.05 ± 0.02 b
100 days101.6 ± 5.41 b58.2 ± 0.65 b58.1 ± 1.43 b1.00 ± 0.02 b
120 days342.4 ± 4.41 a75.2 ± 0.78 a86.6 ± 4.86 a0.82 ± 0.04 c
140 days348.2 ± 5.13 a78.1 ± 1.79 a91.3 ± 1.99 a0.79 ± 0.01 c
z days after full bloom of ‘Daehong’ included days after full bloom (50, 80, 100, 120, and 140 days). y lowercase letters indicate significant differences among DAFB stages within each cultivar, p < 0.05.
Table 2. Internal quality parameters of the ‘Daehong’ and ‘Yumyeong’ peach cultivars at different days after full bloom during the 2022 harvest.
CultivarsDays After Full Bloom zSoluble Solid
(°Brix)
Total Acidity
(%)
Sugar–Acid Ratio
(BAR)
Firmness
(N)
Daehong120 days10.4 ± 0.07 b y2.37 ± 0.08 a3.96 ± 0.23 b36.4 ± 0.56 a
140 days10.8 ± 0.03 a1.56 ± 0.06 b6.32 ± 0.92 a35.6 ± 0.24 a
Yumyeong120 days9.2 ± 0.12 b3.21 ± 1.21 a2.98 ± 0.22 b41.8 ± 1.38 a
140 days9.6 ± 0.14 a2.68 ± 0.09 b3.59 ± 0.18 a34.5 ± 1.62 b
z days after full bloom of ‘Daehong’ included days after full bloom (50, 80, 100, 120, and 140 days). y lowercase letters indicate significant differences among DAFB stages within each cultivar, p < 0.05.
Table 3. Accumulated temperatures (°C) in the ‘Daehong’ peach production region (Chuncheon) at different days after full bloom in 2012, 2017, 2019, 2021, and 2022.
Days After Full Bloom zAccumulated Temperature (°C)
20122017201920212022
50 days438.6474.3489.7487.8491.2
80 days908.4969.1998.81017.51027.3
100 days1098.91144.61179.21204.61218.0
120 days1651.71728.51788.31814.81826.1
140 days1949.82044.22098.72129.32146.4
z days after full bloom of ‘Daehong’ included days after full bloom (110, 120, and 130 days).
Disclaimer/Publisher’s Note: The statements, opinions and data contained in all publications are solely those of the individual author(s) and contributor(s) and not of MDPI and/or the editor(s). MDPI and/or the editor(s) disclaim responsibility for any injury to people or property resulting from any ideas, methods, instructions or products referred to in the content.