Article

Cherry Tomato Bunch and Picking Point Detection for Robotic Harvesting Using an RGB-D Sensor and a StarBL-YOLO Network

1
College of Mechatronics and Control Engineering, Shenzhen University, Shenzhen 518060, China
2
College of Computer and Information Science, Chongqing Normal University, Chongqing 401331, China
*
Authors to whom correspondence should be addressed.
Horticulturae 2025, 11(8), 949; https://doi.org/10.3390/horticulturae11080949
Submission received: 7 July 2025 / Revised: 3 August 2025 / Accepted: 6 August 2025 / Published: 11 August 2025
(This article belongs to the Special Issue Advanced Automation for Tree Fruit Orchards and Vineyards)

Abstract

For fruit harvesting robots, rapid and accurate detection of fruits and picking points is one of the main challenges for their practical deployment. Several fruits typically grow in clusters or bunches, such as grapes, cherry tomatoes, and blueberries. For such clustered fruits, it is desired for them to be picked by bunches instead of individually. This study proposes utilizing a low-cost off-the-shelf RGB-D sensor mounted on the end effector and a lightweight improved YOLOv8-Pose neural network to detect cherry tomato bunches and picking points for robotic harvesting. The problem of occlusion and overlap is alleviated by merging RGB and depth images from the RGB-D sensor. To enhance detection robustness in complex backgrounds and reduce the complexity of the model, the Starblock module from StarNet and the coordinate attention mechanism are incorporated into the YOLOv8-Pose network, termed StarBL-YOLO, to improve the efficiency of feature extraction and reinforce spatial information. Additionally, we replaced the original OKS loss function with the L1 loss function for keypoint loss calculation, which improves the accuracy in picking points localization. The proposed method has been evaluated on a dataset with 843 cherry tomato RGB-D image pairs acquired by a harvesting robot at a commercial greenhouse farm. Experimental results demonstrate that the proposed StarBL-YOLO model achieves a 12% reduction in model parameters compared to the original YOLOv8-Pose while improving detection accuracy for cherry tomato bunches and picking points. Specifically, the model shows significant improvements across all metrics: for computational efficiency, model size (−11.60%) and GFLOPs (−7.23%); for pickable bunch detection, mAP50 (+4.4%) and mAP50-95 (+4.7%); for non-pickable bunch detection, mAP50 (+8.0%) and mAP50-95 (+6.2%); and for picking point detection, mAP50 (+4.3%), mAP50-95 (+4.6%), and RMSE (−23.98%). These results validate that StarBL-YOLO substantially enhances detection accuracy for cherry tomato bunches and picking points while improving computational efficiency, which is valuable for resource-constrained edge-computing deployment for harvesting robots.

1. Introduction

The cherry tomato is a popular fruit widely cultivated around the world because of its sweet taste, rich nutrients, and convenient consumption. It is rich in lycopene, which can reduce the risk of cancers and cardiovascular diseases, and its daily consumption is beneficial to health [1]. The harvesting of cherry tomatoes is currently performed by humans. As they are small in size and large in quantity, cherry tomato picking by hand is time-consuming and laborious and prone to fruit damage. In addition, with a labor shortage, the harvesting cost is also increasing. As such, automatic and unmanned picking of cherry tomatoes can improve farming efficiency and quality while reducing the cost [2].
Fruit detection technology is very important for a fruit-picking robot, which can be roughly divided into two categories. One is the traditional segmentation approach based on fruit features, and the other is deep learning based on various neural networks [3].
The traditional feature-based methods utilize fruit features such as color, shape, and texture to segment fruits and the background. Bulanon et al. proposed a method for automatically selecting the best threshold to segment apples by using the red color difference histogram [4]. The successful recognition rate was above 88%, but the average error rate in the backlight environment was only 18%. Lin et al. used bidirectional partial shape matching and probabilistic Hough transform to obtain regions that may be fruits and then excluded the background and identified the fruits by a support vector machine [5]. It has been applied to detect citrus, tomato, pumpkin, bitter melon, loofah, and mango. However, due to the limitations of the probabilistic Hough transform, the recognition of fruits with large-scale changes is poor. Chaivivatraku et al. employed 24 feature extraction and description methods to detect two different textures of pineapple and bitter gourd [6]. However, it is greatly affected by ambient light and performs poorly in an outdoor environment. In general, traditional feature-based methods are greatly affected by the environment, severe occlusion, fruit color similarity to the background, and lighting changes.
Deep learning, a branch of machine learning, employs multi-layer neural network architectures that simulate the connection patterns of neurons to automatically learn feature representations and pattern recognition from vast amounts of data. In recent years, deep learning has found increasingly widespread applications in agriculture [7,8], demonstrating remarkable advantages, particularly in automated fruit recognition systems. Deep learning methods do not depend on feature engineering, which can adapt to various picking environments and overcome the limitations of traditional methods. As such, many studies have used deep learning to identify various fruits. Lyu et al. proposed YOLOv5-CS to identify green citrus. YOLOv5 was improved by adding the CBAM module, a small object detection layer, and optimizing the loss function, which improved the recall rate, average precision, and detection speed of the model [9]. Jia et al. combined ResNet and DenseNet as the backbone network to improve Mask R-CNN, making the network more suitable for the identification of overlapping apples [10]. Fu et al. proposed MSOAR-YOLOv10 based on YOLOv10 to address the challenges of detecting small-target and severely occluded apples, improving apple detection accuracy [11]. Yan et al. proposed the Si-YOLO model to detect cherry tomatoes. The SIMAM attention module was added to the backbone of the YOLOv5 model, and the Generative Adversarial Network (GAN) and the traditional image data enhancement method were used to increase the number of datasets to improve the generalization ability of the model [12]. Wu et al. proposed an improved version of YOLOv8, named LEFF-YOLO, which incorporates SiMAM-C2f and VanillaNet modules along with a novel loss function. This enhancement achieves higher detection accuracy for cherry tomatoes while reducing computational parameters [13]. Chen et al. introduced a lightweight GA-YOLO model to identify grapes and optimized the feature fusion and loss function [14]. Yuan et al. used InceptionV2 as the backbone to improve SSD to identify cherry tomato bunches. Six different samples were tested, and the average accuracy reached 98.85% [15]. Cui et al. proposed a method to detect cherry tomatoes by combining color and depth information from an RGB-D sensor. The RGB images were transformed into the LAB color space and combined with the depth map as the input of a modified YOLOv7 [16,17]. Similarly, Rong et al. proposed an improved YOLO network to improve the detection accuracy of cherry tomato clusters by combining RGB and depth images [18]. Chai et al. proposed a dual-path feature fusion cherry tomato bunch detection network, DCFA-YOLO, based on YOLOv8, which improves the fusion efficiency of color and depth information [19].
For single-growing fruits such as apples, pears, and oranges, detecting individual fruits is sufficient to enable robotic grasping for harvesting tasks. However, for cluster-growing fruits such as grapes, cherry tomatoes, and lychees, identifying and harvesting clusters is more efficient than detecting and picking individual fruits. To harvest clustered fruits, detecting the fruits alone is not enough; it is also necessary to identify the picking locations or grabbing locations. Li et al. employed HRNet to detect seven points on the stems of cherry tomatoes, using the connected lines of these seven points as the motion trajectory for a specially designed end-effector, with the second point selected as the picking point for harvesting [20]. Zhao et al. modified YOLOv4 into YOLO-GP, enabling simultaneous detection of grape clusters and picking points, with a picking point detection error of less than 40 pixels [21]. Qin et al. used an improved YOLOv8-Pose, named YOLO-PP, to detect picking points on cherry tomato clusters, achieving a 0.81% improvement in mAP compared to YOLOv8-Pose, and deployed it on the edge computing device NVIDIA Jetson [22]. Chen et al. enhanced YOLOv8-Pose by incorporating FasterNet Block, EMA (Efficient Multi-Scale Attention), and BiFPN for detecting grape clusters and picking points, achieving an mAP50 of 89.7%, with picking point errors below 30 pixels and a 47.73% reduction in model parameters [23]. Zhang et al. used an improved YOLOv8 combined with the SAM (Segment Anything Model), where the stems of cherry tomatoes detected by YOLOv8 served as prompts for SAM to segment the stems, and the shape center of the stem mask was used as the picking point. However, due to the introduction of SAM, the inference time of the model will increase significantly and cannot meet the requirements of real-time detection [24].
To sum up, many papers have studied the detection of cherry tomato clusters and picking points based on deep learning methods. However, for the detection of picking points, all of them use a single RGB image to complete the task, which has significant limitations. Moreover, for overlapping clusters of cherry tomatoes, the situation is similar, making it difficult to distinguish each cluster. Additionally, most of the methods for identifying picking points are multi-step processes. First, an object detection network is used to identify the clusters of cherry tomatoes or the fruit stem regions, and then semantic segmentation is used to extract the fruit stalks and thereby identify the picking points. For practical deployment, it is necessary to meet real-time performance while reducing the hardware cost. Meanwhile, in the real farming environment, the detection and positioning accuracy still face challenges. For the detection of the cherry tomato bunches and picking points, there are cases where the bunches are severely occluded by leaves, which may lead to missed detection, and when the stalk is obstructed by the main stem or leaves, it is difficult for robots to pick.
To address these challenges and the limitations identified in prior research, this paper proposes a lightweight simultaneous detection model for cherry tomato bunches and picking points based on YOLOv8-Pose [25], which achieves end-to-end detection while improving accuracy in mutually occluded bunch scenarios and enhancing deployment capability on computation-constrained platforms. Specifically, our work makes the following contributions:
  • A practical classification and detection framework for cherry tomato harvesting: We propose StarBL-YOLO, which explicitly divides cherry tomato bunches into pickable and non-pickable categories. This design addresses the limitations of previous works where fully occluded stems often lead to unreliable picking point predictions, improving the practical applicability of automated harvesting.
  • Single-stream RGB-D integration for efficient occlusion-aware detection: To balance accuracy and efficiency, we employ a single-stream RGB-D fusion strategy, directly combining color and depth data. This approach enables robust detection of occluded bunches while avoiding dual-stream complexity.
  • Lightweight architecture with enhanced spatial feature representation: The Starblock from StarNet [26] is used to replace the Bottleneck in the C2f structure in YOLOv8-Pose, and the coordinate attention mechanism [27] is integrated into the backbone network. These two components work synergistically to enhance detection robustness in complex backgrounds by efficiently extracting features and reinforcing spatial information, delivering enhanced detection accuracy with reduced computational complexity.
  • Task-specific loss optimization for accurate picking point localization: We replace the original OKS loss function with the L1 loss function, better suited for the requirements of single-point robotic picking.
The proposed method has been evaluated on a dataset with 843 cherry tomato RGB-D image pairs acquired by an AGV-based harvesting robot at a commercial greenhouse farm. The StarBL-YOLO, with only 2.72 M parameters, has decreased by nearly 12% compared with the YOLOv8-Pose and significantly improves the detection accuracy of cherry tomato bunches and picking points compared with several popular detection models.

2. Materials and Methods

2.1. Datasets

2.1.1. Data Acquisition

The dataset was acquired in a commercial greenhouse cherry tomato farm [16,17]. RGB-D images were captured using the Azure Kinect DK camera mounted on the end effector of the harvesting robot; the RGB and depth image resolutions are 2048×536. The data were collected in early April and early July 2022, corresponding to the peak and final stages of cherry tomato maturity, respectively. Due to the significantly reduced number of tomato bunches available during the final stage, we selected data exclusively from the peak maturity period for this study. A total of 843 RGB-D image pairs were collected. As shown in Figure 1, the collected images include a variety of complex situations.

2.1.2. Data Augmentation Methods and Data Split

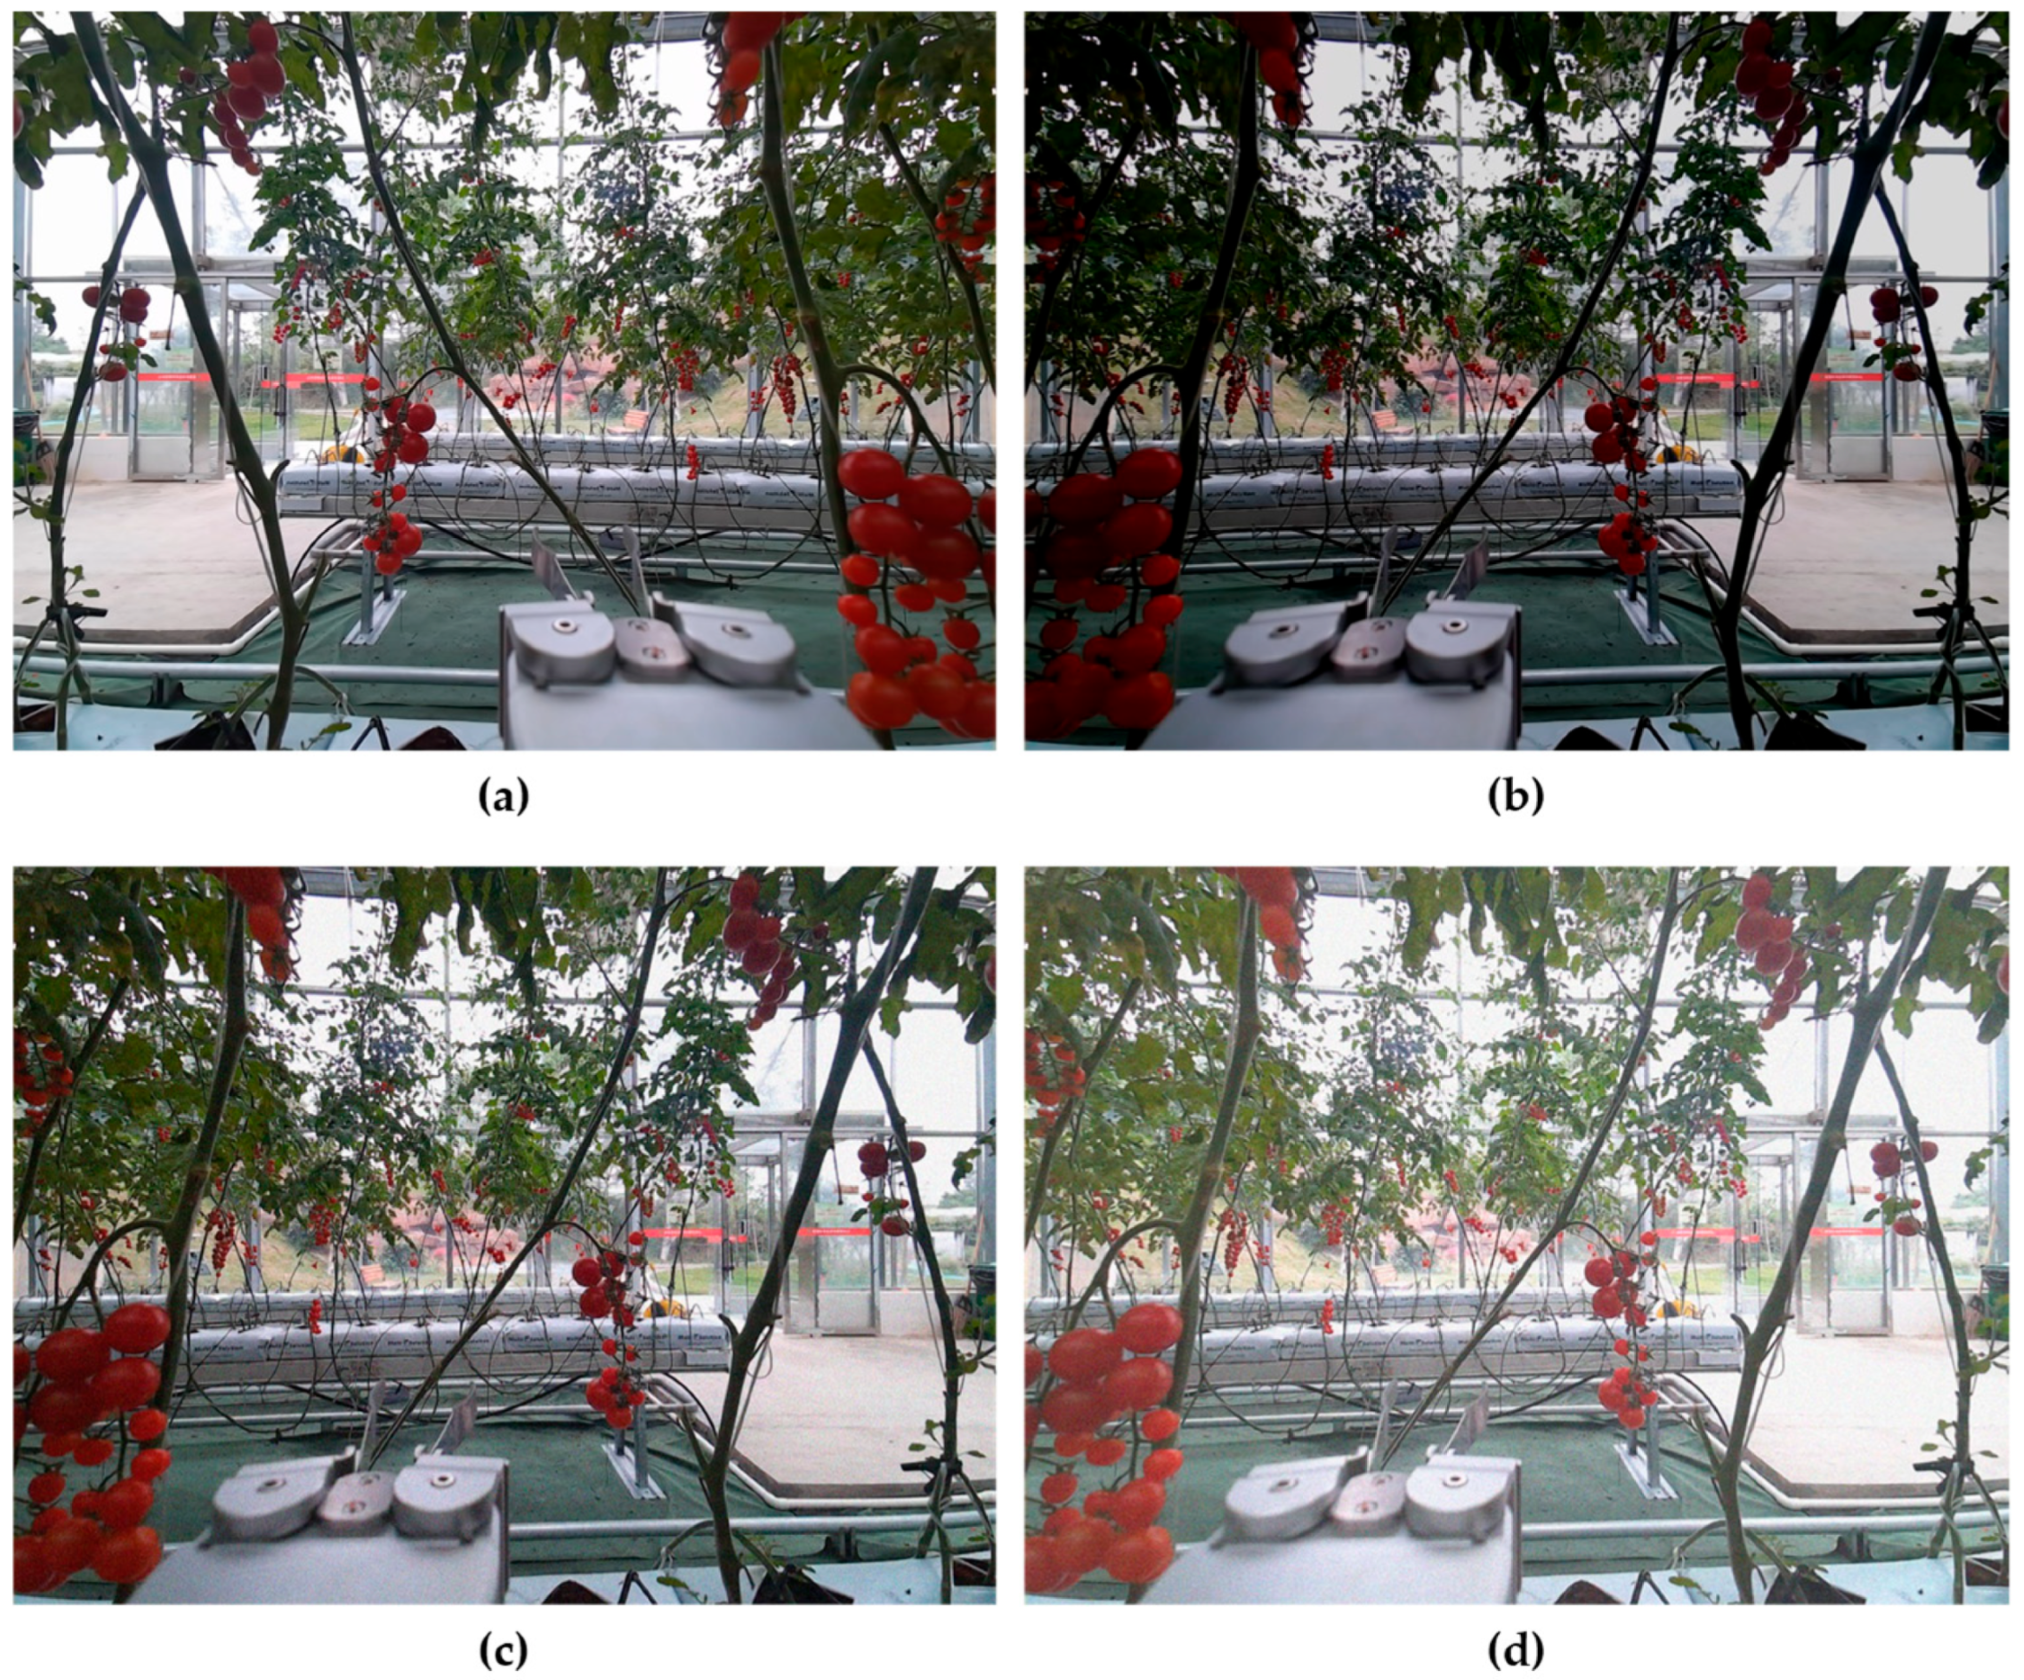
To prevent model overfitting and enhance generalization capability, typical data augmentation methods, such as horizontal flipping, random brightness, adding Gaussian noise, and a combination of random brightness and adding Gaussian noise, were used to expand the dataset. The 843 RGB-D image pairs were expanded to 4215 image pairs. Figure 2 illustrates the data augmentation effect. Then, given our dataset’s limited size, we adopted an 8:1:1 ratio for partitioning the data into training, validation, and test sets, respectively, to maximize the amount of data available for model training while maintaining rigorous evaluation standards. Finally, the enhanced dataset is divided into 3370 training sets, 840 validation sets, and 845 test sets.

2.1.3. Data Labeling Strategy

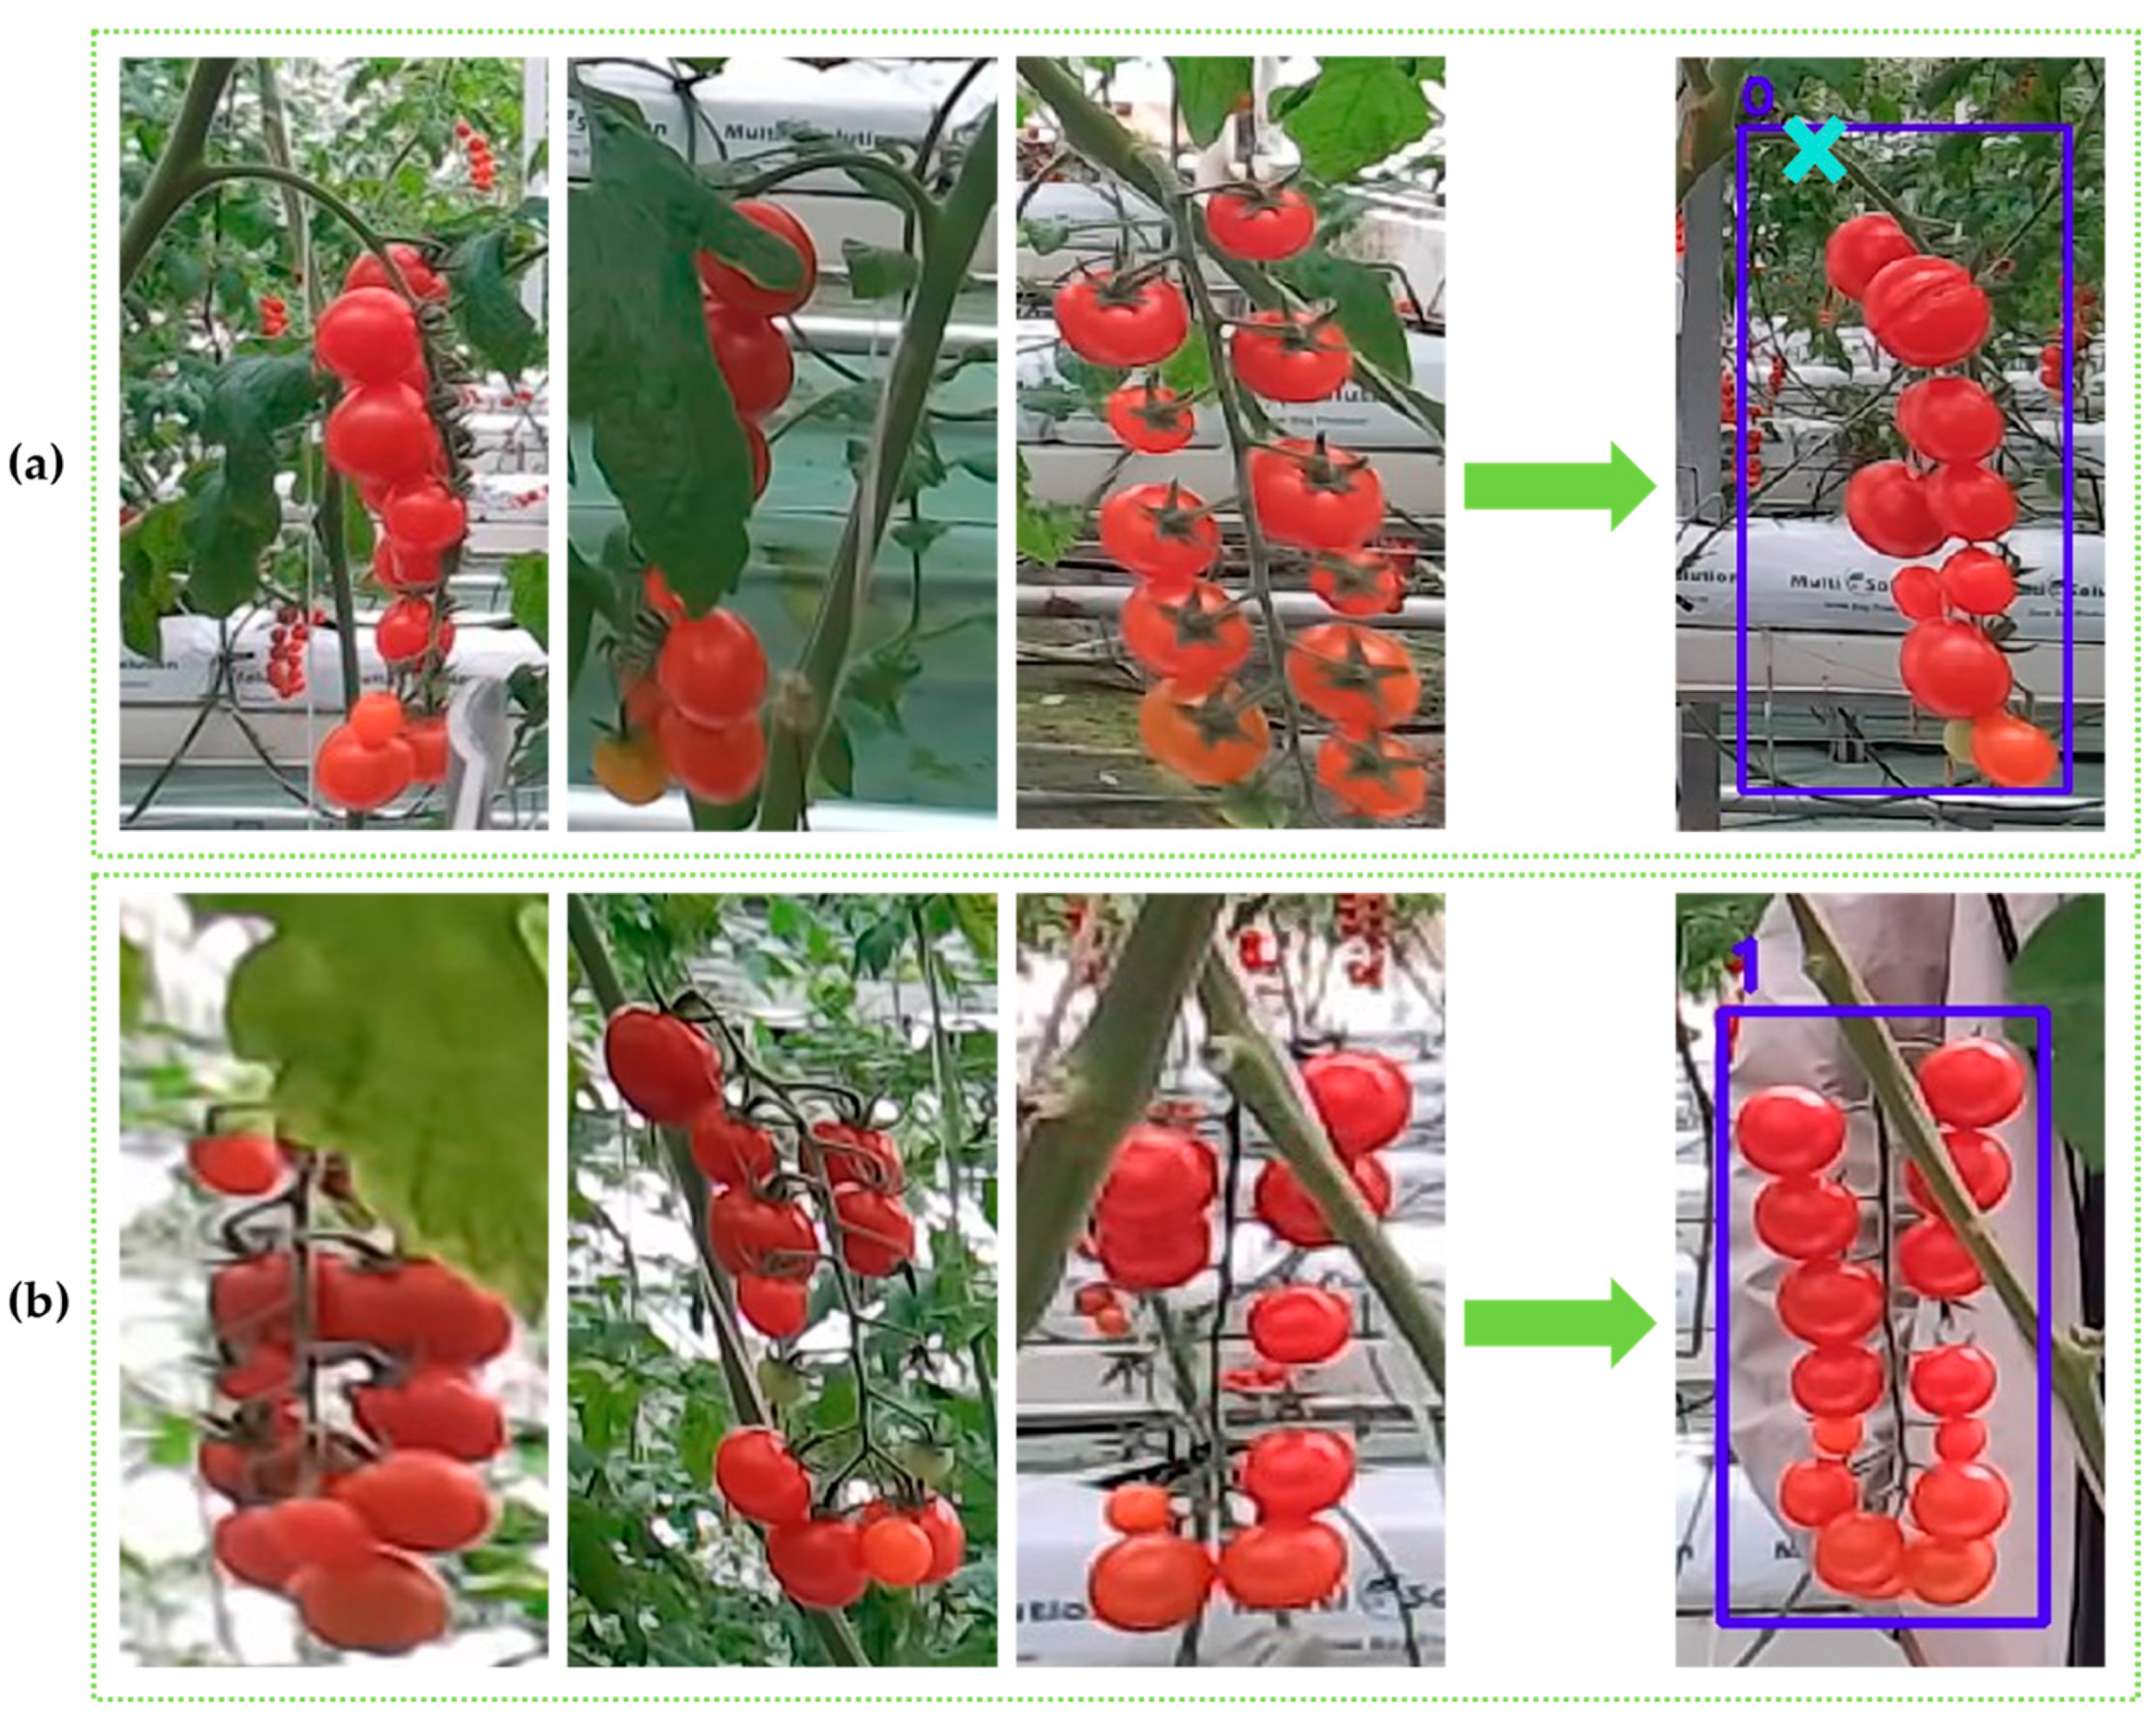
Cherry tomato bunch images were labeled by the LabelImg software (ver 1.8.6) [28]. Only cherry tomato bunches on the nearest truss were labeled. During actual robotic harvesting, there is currently no effective method for picking cherry tomatoes with obscured stems with typical single-arm robotic systems. It is possible to use two-arm collaboration to solve the problem, as is typically performed using two hands by humans, which involves designing new robotic harvesting hardware and is beyond the scope of this study. Considering the above issue, we classify the cherry tomato bunches into two categories for typical single-arm robotic harvesting systems, as shown in Figure 3; bunches with unobstructed stems are categorized as pickable, while those with obscured stems are categorized as non-pickable. For non-pickable bunches, the picking points can only serve as predicted picking points, and single-arm robotic harvesting is not feasible; therefore, only the cherry tomato bunches are detected, without identifying picking points. In this way, the annotation strategy we designed can complete the picking task by identifying cherry tomato bunches and picking points when the fruit stems are not occluded. In addition, we only label the cherry tomato bunches on the nearest truss when the fruit stems are occluded.

2.2. Improved YOLOv8-Pose: StarBL-YOLO

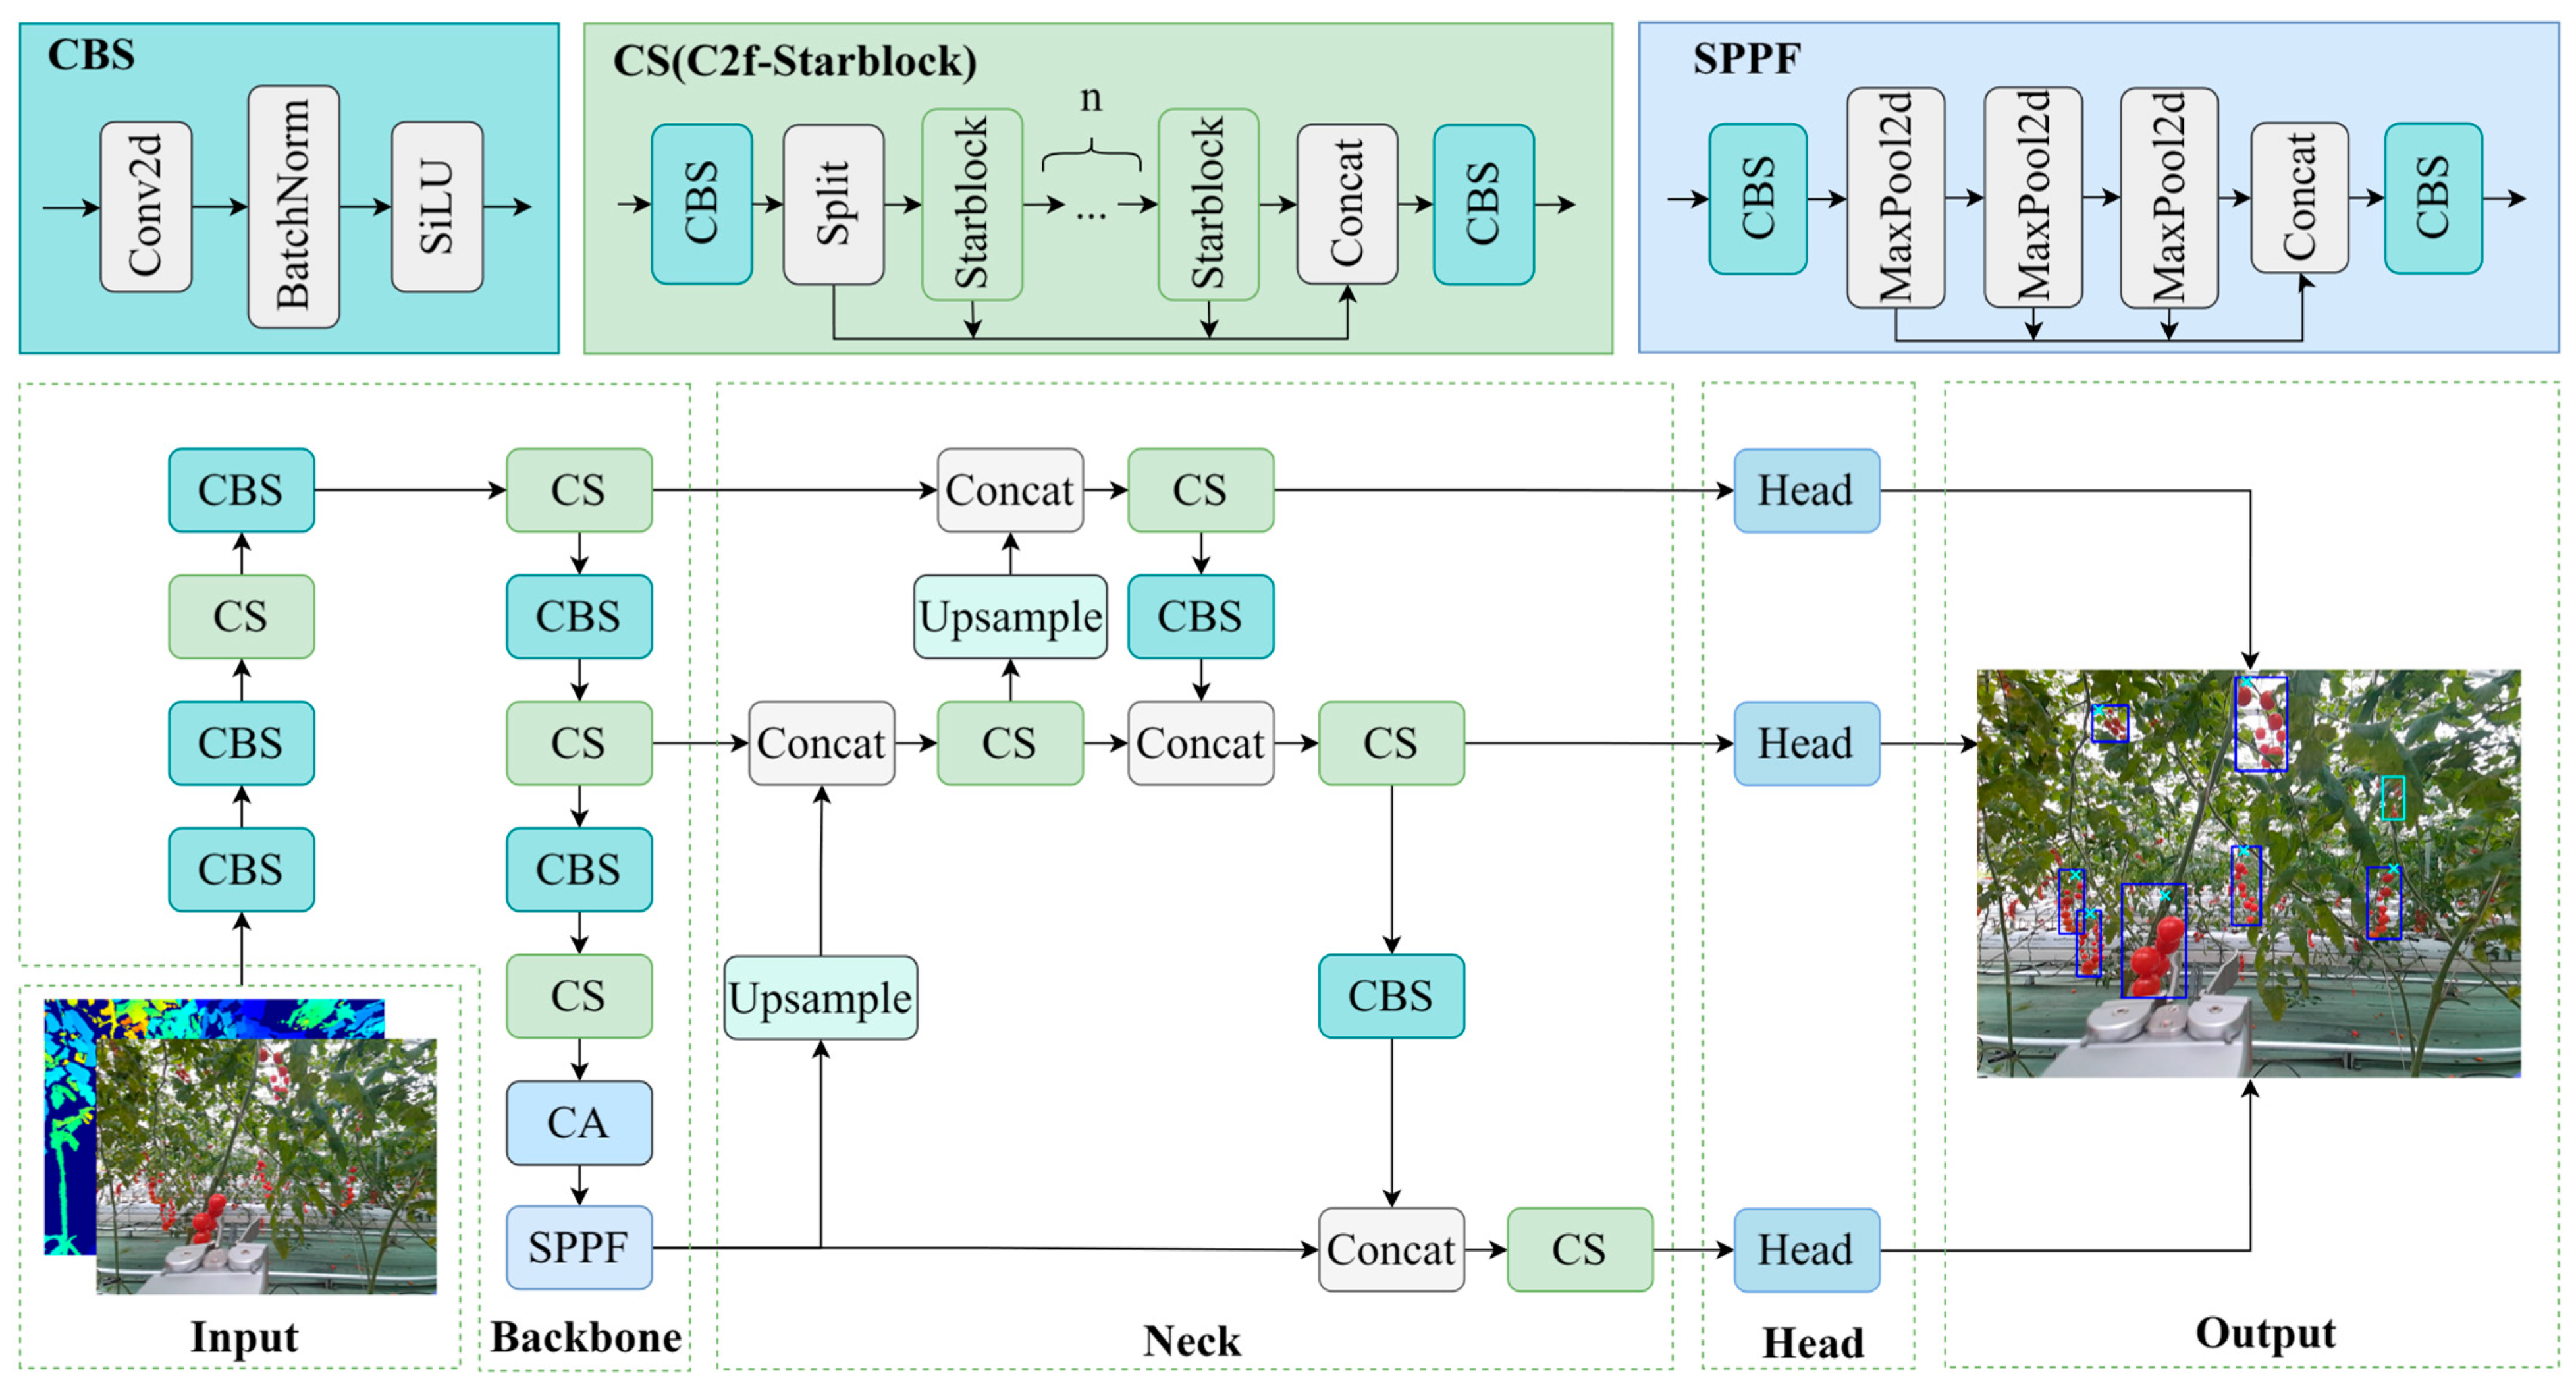
For cherry tomato bunch and picking point detection, the existing YOLOv8-Pose model is not ideal due to the influence of complex conditions such as illumination change, leaf occlusion, and bunch overlapping. To improve the detection performance of the network under complex conditions and make it more compact, we modify YOLOv8-Pose from four different aspects to form the new StarBL-YOLO network (Figure 4). The network adopts a single-stream 4-channel RGB-D input, which sequentially passes through (1) a CBS block for initial feature extraction; (2) a lightweight backbone enhanced by the synergistic optimization of Starblock and coordinate attention mechanisms for feature extraction; (3) a neck network employing an FPN-PAN [29] structure for multi-scale feature fusion; and (4) the output detection head simultaneously predicts the bounding boxes of cherry tomato bunches (classified as pickable or non-pickable) and the coordinates of picking points (optimized using the L1 loss function).

2.2.1. The Single-Stream Fusion of RGB and Depth Images

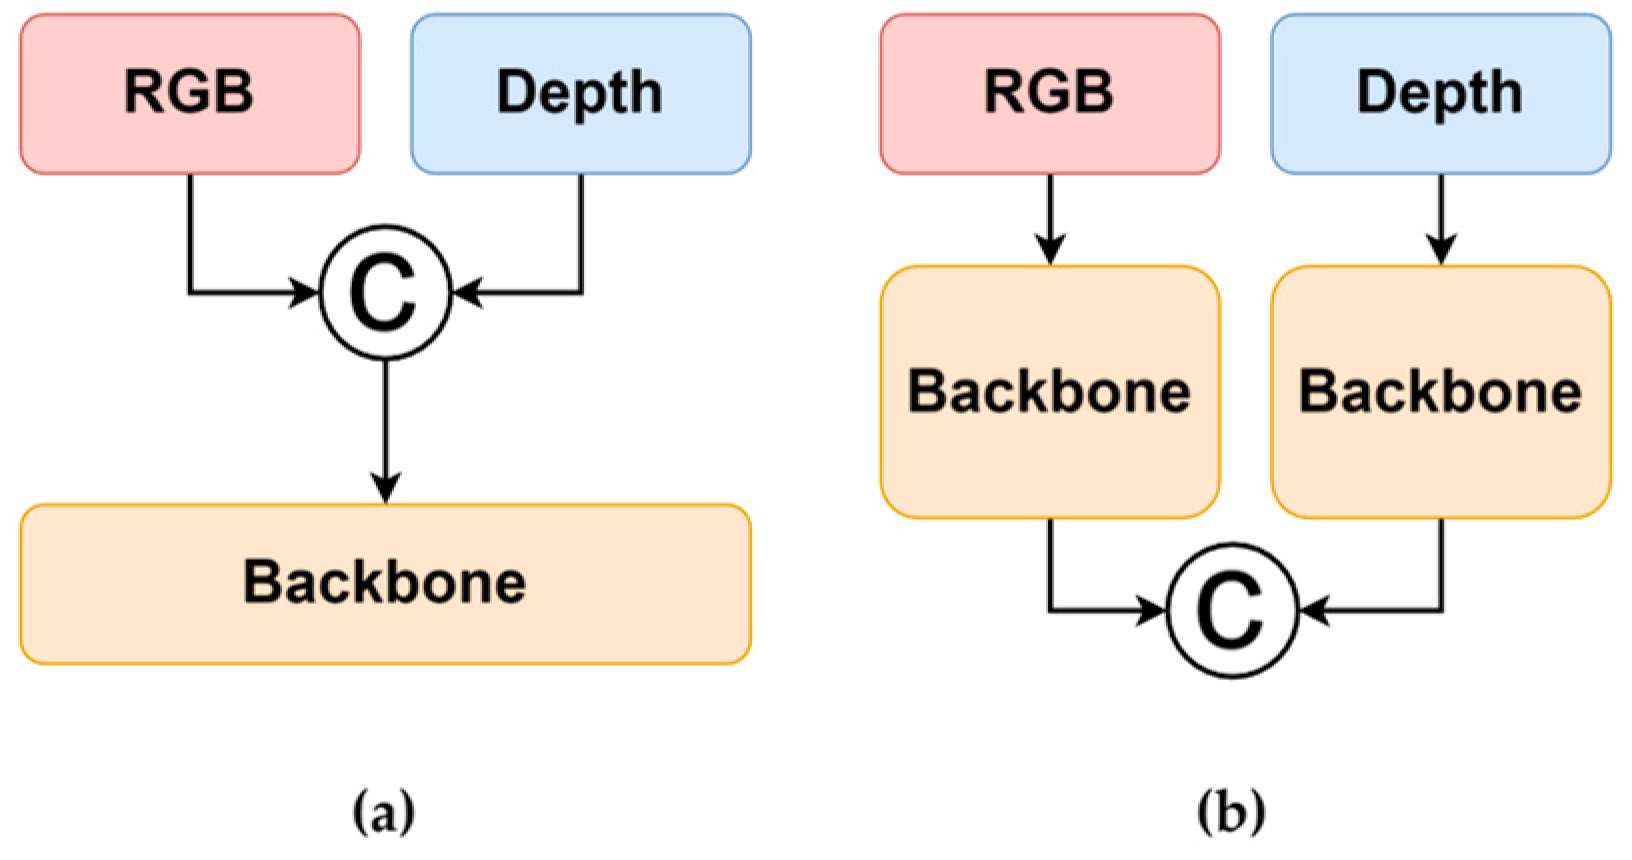
The application of multimodal fusion in deep learning is becoming increasingly widespread. By using multimodal fusion, information can be complemented to enhance the model’s detection performance for specific tasks. Common methods for fusing color and depth information include single-stream and dual-stream approaches [30]. As illustrated in Figure 5, single-stream methods generally combine RGB and depth images in a specific way and use the merged data as the input for neural networks, extracting color and depth features using the feature extraction backbones. The dual-stream methods, on the other hand, extract features from RGB and depth images separately and then fuse the extracted features. The latter approach requires designing additional multi-backbone branches, which significantly increases the model complexity. Considering the need for a lightweight model, we used the single-stream method to fuse RGB and depth images. The RGB-D image pairs are obtained from a low-cost RGB-D sensor (see the dataset for details). They are transformed and aligned using the intrinsic and extrinsic matrices from camera calibration [31]. The original depth map is in 16 bits, and only depth values within a proper range are retained, such that those too close and too far are discarded. The retained depth values are converted into 8 bits and concatenated to form a new 4-channel image.

2.2.2. Starblock in StarNet

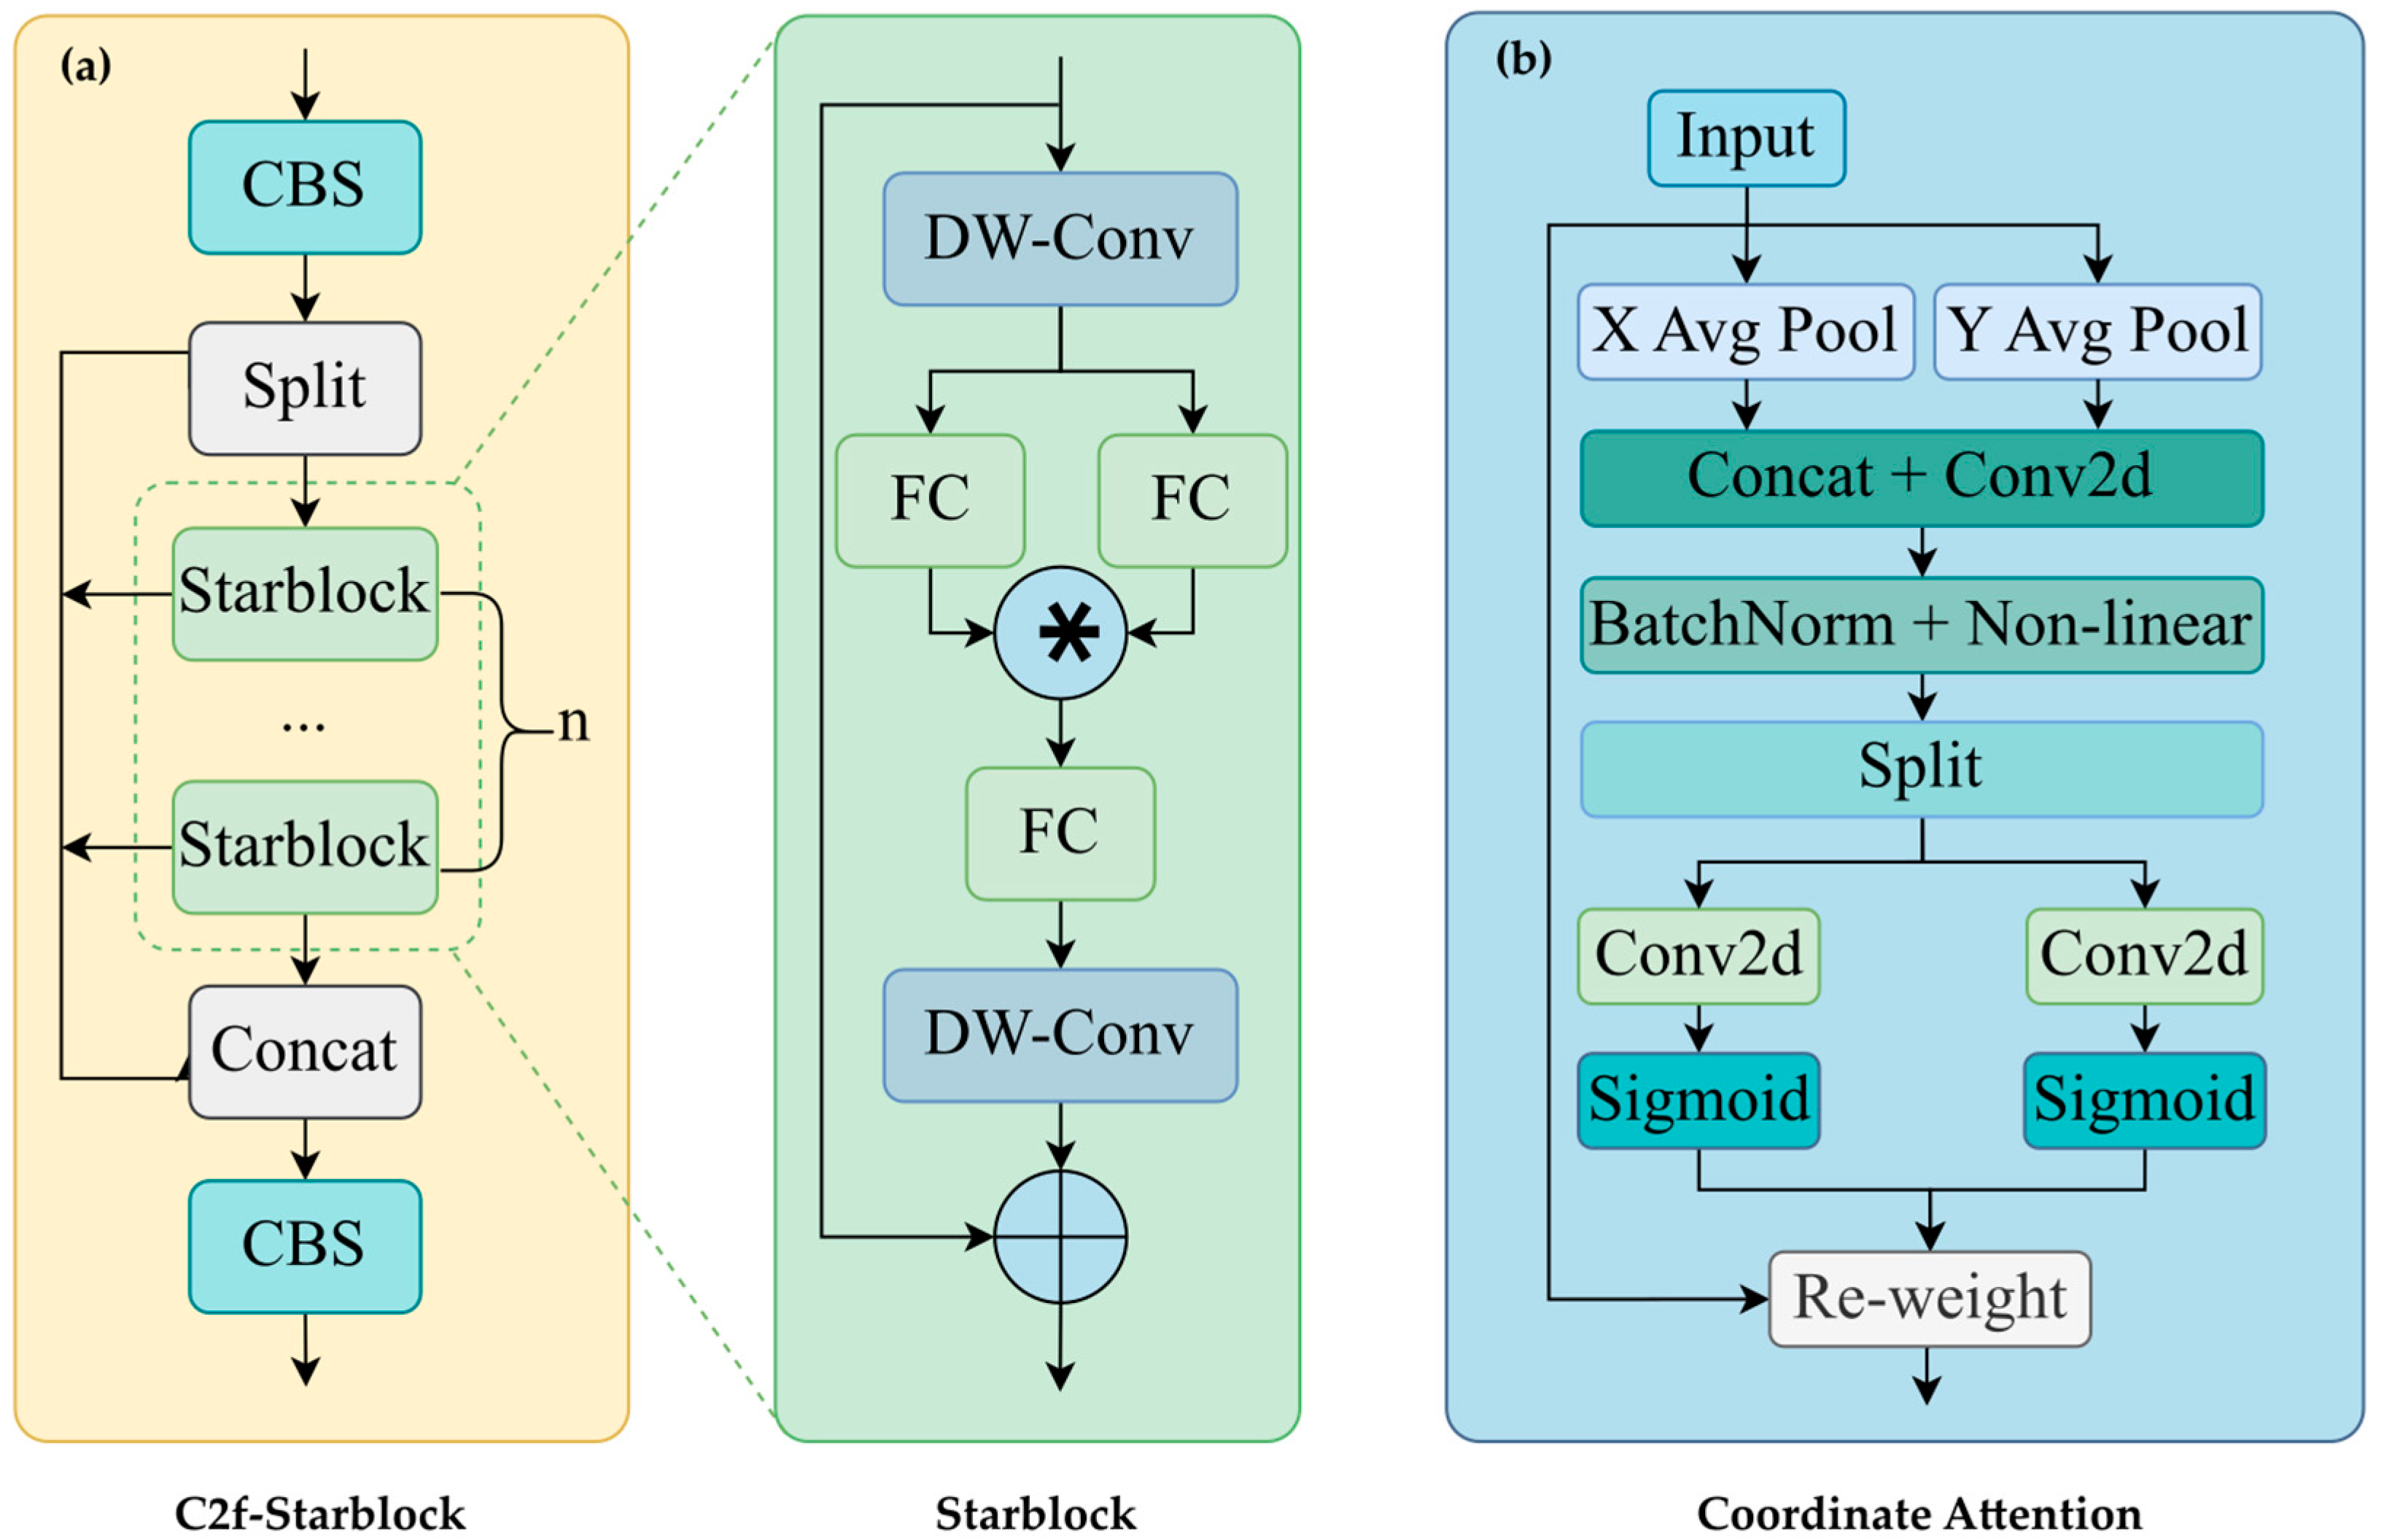
Starblock is the basic module in StarNet; the structure of Starblock is illustrated in Figure 6a. DW-Conv is the depth-wise convolution [32]. Starblock uses DW-Conv for downsampling. DW-Conv has fewer parameters than ordinary convolution. FC is a 1 × 1 convolution; the first two FCs are responsible for channel expansion, and the latter FC is responsible for channel compression. Finally, a DW-Conv is added at the end of the structure. Starblock fuses inputs by element-wise multiplication to fuse branch features. It can map low-dimensional features to nonlinear, high-dimensional implicit features and use features with fewer channels, which reduces the number of parameters of the network and improves the efficiency of feature extraction so that it can be run on lower-cost devices. Considering this characteristic, we replace the Bottleneck in the C2f of YOLOv8-Pose with the Starblock to reduce the complexity of the model and meet the requirements of network lightweight.

2.2.3. Coordinate Attention

In order to solve the loss of location information when using channel attention, Hou et al. [27] proposed a coordinate attention (CA) mechanism, as shown in Figure 6b. It considers not only the channel information but also the spatial information and embeds the latter into the channel attention to improve detection accuracy. We also incorporate the coordinate attention mechanism into the backbone of YOLOv8-Pose.
The input feature map is used to perform the averaged pooling in the X and Y directions, respectively, to obtain the long-range dependence in one direction and retain the position information in the other. Then, the coordinate attention generation operation is used to make full use of the position information and obtain the relationship between the channels. Finally, spatial attention and channel attention are applied to the input feature map to enhance the expression of the effective region.
In Section 2.2.2, we introduced the replacement of Bottleneck blocks with Starblocks in the C2f module. While the Starblock’s depthwise separable convolutions and element-wise multiplication operations may potentially smooth spatial details, the coordinated integration of the coordinate attention mechanism compensates for this effect through its orientation-aware pooling mechanism, which explicitly reinforces spatial information. This synergistic combination significantly enhances the model’s robustness when handling complex scenarios, such as heavily occluded cherry tomato bunches. Therefore, we add coordinate attention to the last convolution layer of the YOLOv8-Pose backbone before the Spatial Pyramid Pooling-Fast (SPPF) module. With all three modifications to YOLOv8-Pose, the StarBL-YOLO is obtained.

2.2.4. Loss Function

YOLOv8-Pose uses OKS (Object Keypoint Similarity) loss as the key point loss function by default for human pose estimation of 17 key points. OKS loss is designed to be used for multi-key point detection, which takes into account the weight and object scale of different key points, so OKS is more suitable for the degree of similarity between multiple key points. The formula for the OKS loss function is as follows:
O K S = i   exp d i 2 2 S k 2 σ i 2 · δ ν i > 0 i   δ ν i > 0
δ = 1 ( ν i > 0 ) 0 ( ν i 0 )
where d i represents the Euclidean distance between the predicted position and the actual position of the i-th key point; s k is a scale factor, usually selected as the area of the object’s bounding box; σ i is the standard error of the i-th key point, used to reflect the importance and scale uncertainty of different key points; and ν i is the visibility identifier of the i-th key point.
In our cherry tomato bunch picking point identification task, only one picking point on a single truss cherry tomato is detected, and the target scale does not change much, so the effect of importance and scale becomes less obvious, which may introduce unnecessary additional calculations. To solve this problem, we replace the OKS loss function with the L1 loss function, also known as the mean absolute value error (MAE), which is the average of the absolute difference between the predicted value and the true value, as follows:
M A E = i n   | y i     y i p | n
where y i and y i p , respectively, represent the i-th true value and the predicted value.

2.3. Evaluations of Model Performance

The following common metrics are used to evaluate the performance of the cherry tomato bunch and the picking point detection model. (1) mAP50: mean average precision (mAP) calculated at an intersection over union (IoU) threshold of 0.50. It is a measure of the model’s accuracy considering only “easy” detection. (2) mAP50-95: mAP calculated at varying IoU thresholds, ranging from 0.50 to 0.95. It gives a comprehensive view of the model’s performance across different levels of detection difficulty. (3) The number of parameters in the deep learning model and the Giga floating point operations per second (GFLOPs) are also compared as indicators of model efficiency or complexity.
m A P = 1 n i = 1 n   A P i ,
A P = 0 1   ( P r e c i s i o n × R e c a l l ) d x ,
P r e c i s i o n = T P T P + F P ,
R e c a l l = T P T P + F N
where true positive (TP) refers to the number of instances correctly identified as tomato bunches or picking points (i.e., they are indeed tomato bunches or picking points and are predicted as such); false positive (FP) represents the number of instances mistakenly predicted as tomato bunches or picking points when they are not; and false negative (FN) indicates the number of instances that are actual tomato bunches or picking points but were not detected by the model.
For the detection of cherry tomato bunches, P-mAP50 and P-mAP50-95 represent the performance metrics for the pickable category, while NP-mAP50 and NP-mAP50-95 represent the performance metrics for the non-pickable category. For the detection of picking points, we use mAP based on OKS (Object Keypoint Similarity) as the performance metric (replacing the IoU threshold with the OKS threshold). PP-mAP50 and PP-mAP50-95 represent the performance metrics for picking point detection.
The performance of StarBL-YOLO on cherry tomato bunch and picking point detection is compared with several widely used keypoint detection models, including YOLOv5-Pose [33], YOLOv7-Pose [34], YOLOv8-Pose, YOLOv11-Pose [35], and YOLOv12-Pose [36].

3. Results

3.1. Experiment Environment

All experiments were carried out in the same environment. The computing platform is a PC with an Intel (R) Xeon (R) Gold 6226R CPU @ 2.90 GHz, an NVIDIA GeForce RTX4090 GPU, and 128 G RAM. The programming language is Python v3.8.18, and the deep learning framework is Pytorch 2.0.0 with CUDA v11.7.
In order to verify the learning effect of the model, all experiments did not use pre-trained weights for training. Each batch was trained using 16 images. The SGD optimizer was used, the initial learning rates were set to 0.001, and the momentum and weight attenuation rates were set to 0.937 and 0.0005, respectively. Using the early stopping mechanism, patience was set to 100.

3.2. Ablation Experiments

To verify the effect of each of the modifications made to YOLOv8-Pose, several ablation experiments were carried out by removing one or more of the modules from the full model, as shown in Table 1. The algorithm naming convention is defined as follows: YOLOv8-P denotes the baseline YOLOv8-Pose model, D represents RGB-D input, S indicates the integration of Starblock in C2f modules, C signifies the incorporation of coordinate attention in the backbone network, and L denotes the replacement of OKS loss with the L1 loss function.
By combining the depth and RGB images as the input, StarBL-YOLO enhances the capability to distinguish overlapping fruit clusters, with all mAP metrics showing improvement, especially for cherry tomato bunch detection. NP-mAP50 saw the greatest improvement, increasing by 4.5%. The synergistic integration of Starblock and coordinate attention mechanisms significantly enhances the model’s recognition capability in complex backgrounds, particularly for non-pickable cherry tomato clusters. This combined approach achieves NP-mAP50 and NP-mAP50-95 scores of 0.692 and 0.45, respectively, representing improvements of 3.3% and 4.4% over the baseline network, while simultaneously reducing model parameters by approximately 0.36 M. Furthermore, replacing the OKS loss with L1 loss optimizes single-picking-point detection, yielding PP-mAP50 and PP-mAP50-95 scores of 0.909 and 0.901. When all four modifications are implemented concurrently, the model achieves optimal performance across most evaluation metrics while maintaining an effective balance between accuracy and computational complexity.

3.3. Comparison of Cherry Tomato Bunch and Picking Point Detection

Although the addition of coordinate attention increases model parameters, the increased number is far less than the number of parameters reduced by replacing Bottleneck with Starblock. When all three network modifications act simultaneously, the number of parameters is still 12% less than that of YOLOv8-Pose (2.72 vs. 3.07 million); thus, StarBL-YOLO is a relatively efficient network.
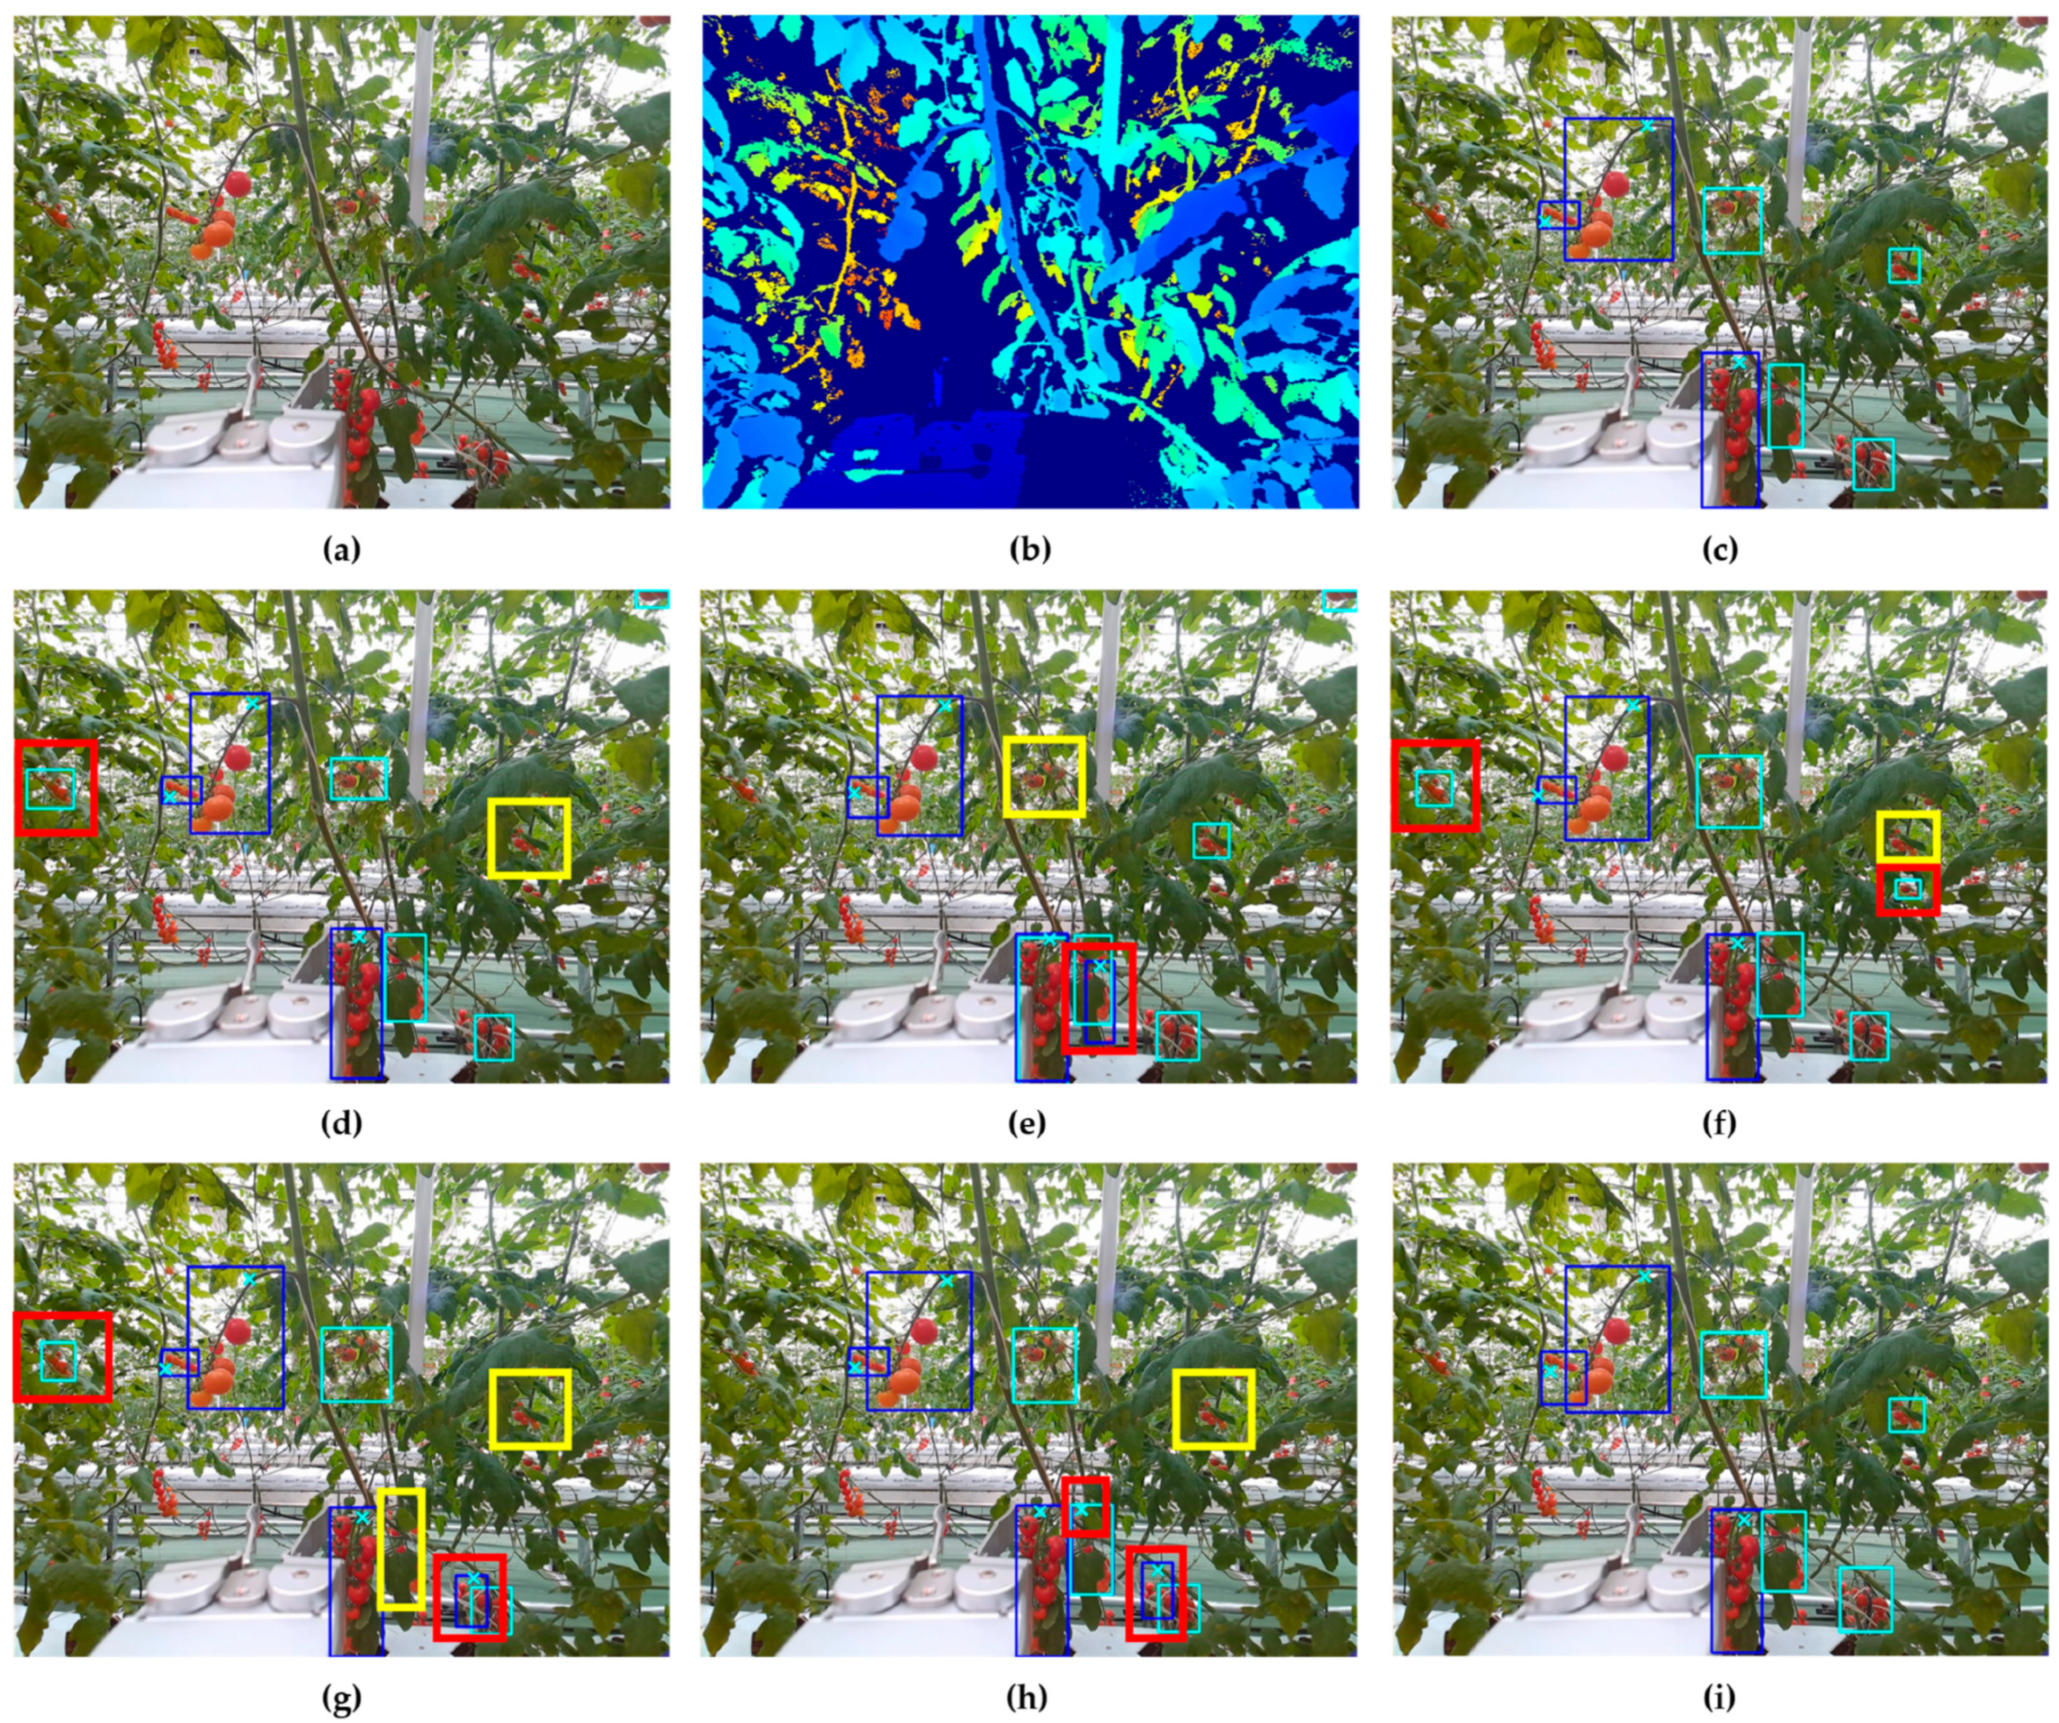
We compare StarBL-YOLO with several widely used keypoint detection models, as summarized in Table 2. In both cherry tomato bunch detection and picking point detection, StarBL-YOLO achieves the best performance in terms of mAP, outperforming the second-best model by at least 0.9% and up to 3.6%. Regarding model complexity, StarBL-YOLO also performed well, only 0.09 M more than the YOLOv12-Pose with the fewest parameters. It is worth noting that StarBL-YOLO has seen significant improvements in all indicators compared to the baseline network YOLOv8-Pose. With the number of parameters reduced by 0.36 M, the detection indicators have increased by up to 8%, which can be regarded as a considerable improvement. Figure 7 illustrates an example of cherry tomato bunch detection by the compared deep neural networks. Blue boxes indicate pickable cherry tomato bunches, aqua boxes indicate non-pickable cherry tomato bunches, and red and yellow boxes are manually added to indicate false detections and missed detections. In this example, all models have one false detection and one missed detection (with a red box) except for StarBL-YOLO.
In the comparative experiments, StarBL-YOLO achieves the best results in each detection index and even performs better than YOLOv5-Pose and YOLOv7-Pose, which have much higher model complexity. StarBL-YOLO was slightly inferior to YOLOv11-Pose and YOLOv12-Pose in model complexity. In general, expanding the depth and width of the model can increase its complexity, which can improve the detection effect of the model. To verify whether YOLOv11-Pose and YOLOv12-Pose can perform better than our proposed StarBL-YOLO in the case of increasing model complexity, we used YOLOv11s-Pose and YOLOv12s-Pose with higher model complexity to carry out experiments on the detection of cherry tomato bunches and picking points, and the experimental results are shown in Table 3. The results show that, with model parameters only about one-quarter of those of the above two models, StarBL-YOLO’s P-mAP50, NP-mAP50, PP-mAP50, and PP-mAP50-95 are, respectively, 2%, 2.5%, 1.4%, and 1.8% higher than those of the second-best model. Only in P-mAP50-95 and NP-mAP50-95, it is 1.3% and 0.4% lower than the best model, respectively. However, considering all detection indicators comprehensively, StarBL-YOLO still has significant advantages.

3.4. Model Generalization Validation Experiments

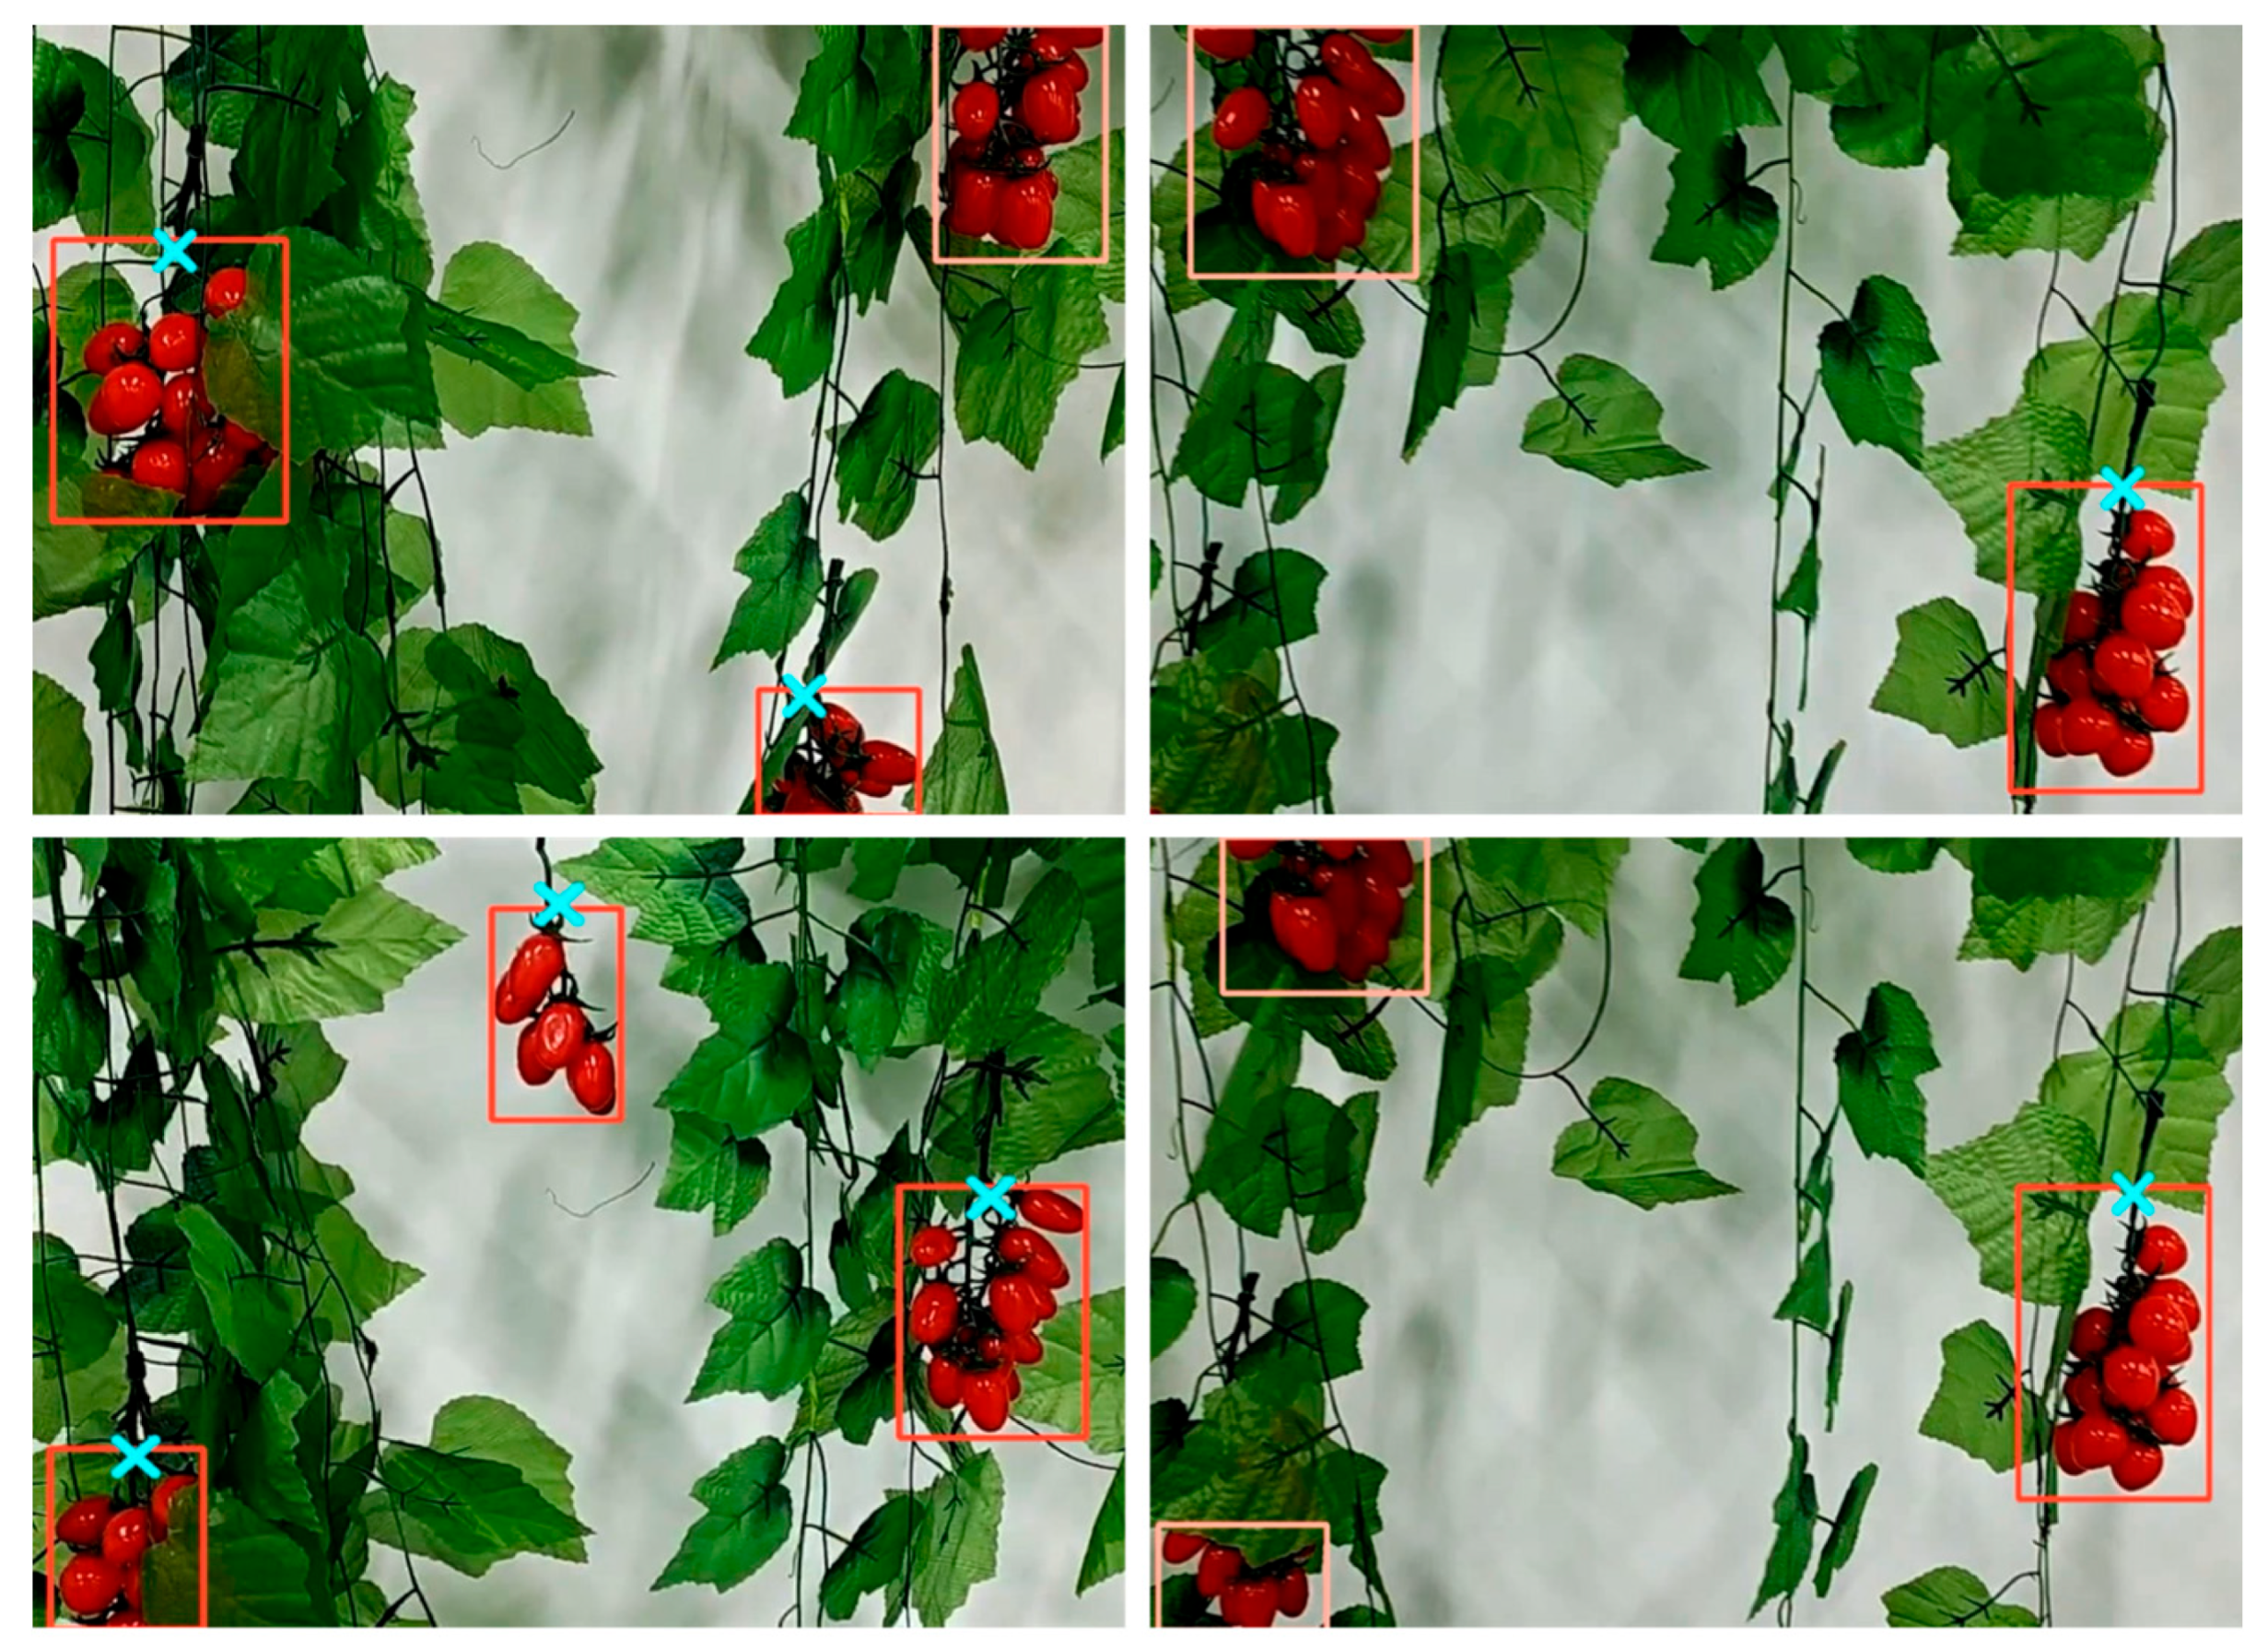
To verify the generalization ability of the StarBL-YOLO model, we built a simulated scenario of cherry tomatoes using plastic dummy plants and used trained StarBL-YOLO to identify cherry tomato bunches and picking points on the new samples directly. Some examples are shown in Figure 8. The red bounding boxes represent the bunches of cherry tomatoes that can be picked, and the picking points have been identified as the blue crosses. The light salmon bounding box represents unpickable bunches of cherry tomatoes and only recognizes bunches of cherry tomatoes. StarBL-YOLO can identify cherry tomato bunches and picking points in the simulation scene, which also proves that this model has a strong generalization ability.

3.5. Failure Case Analysis

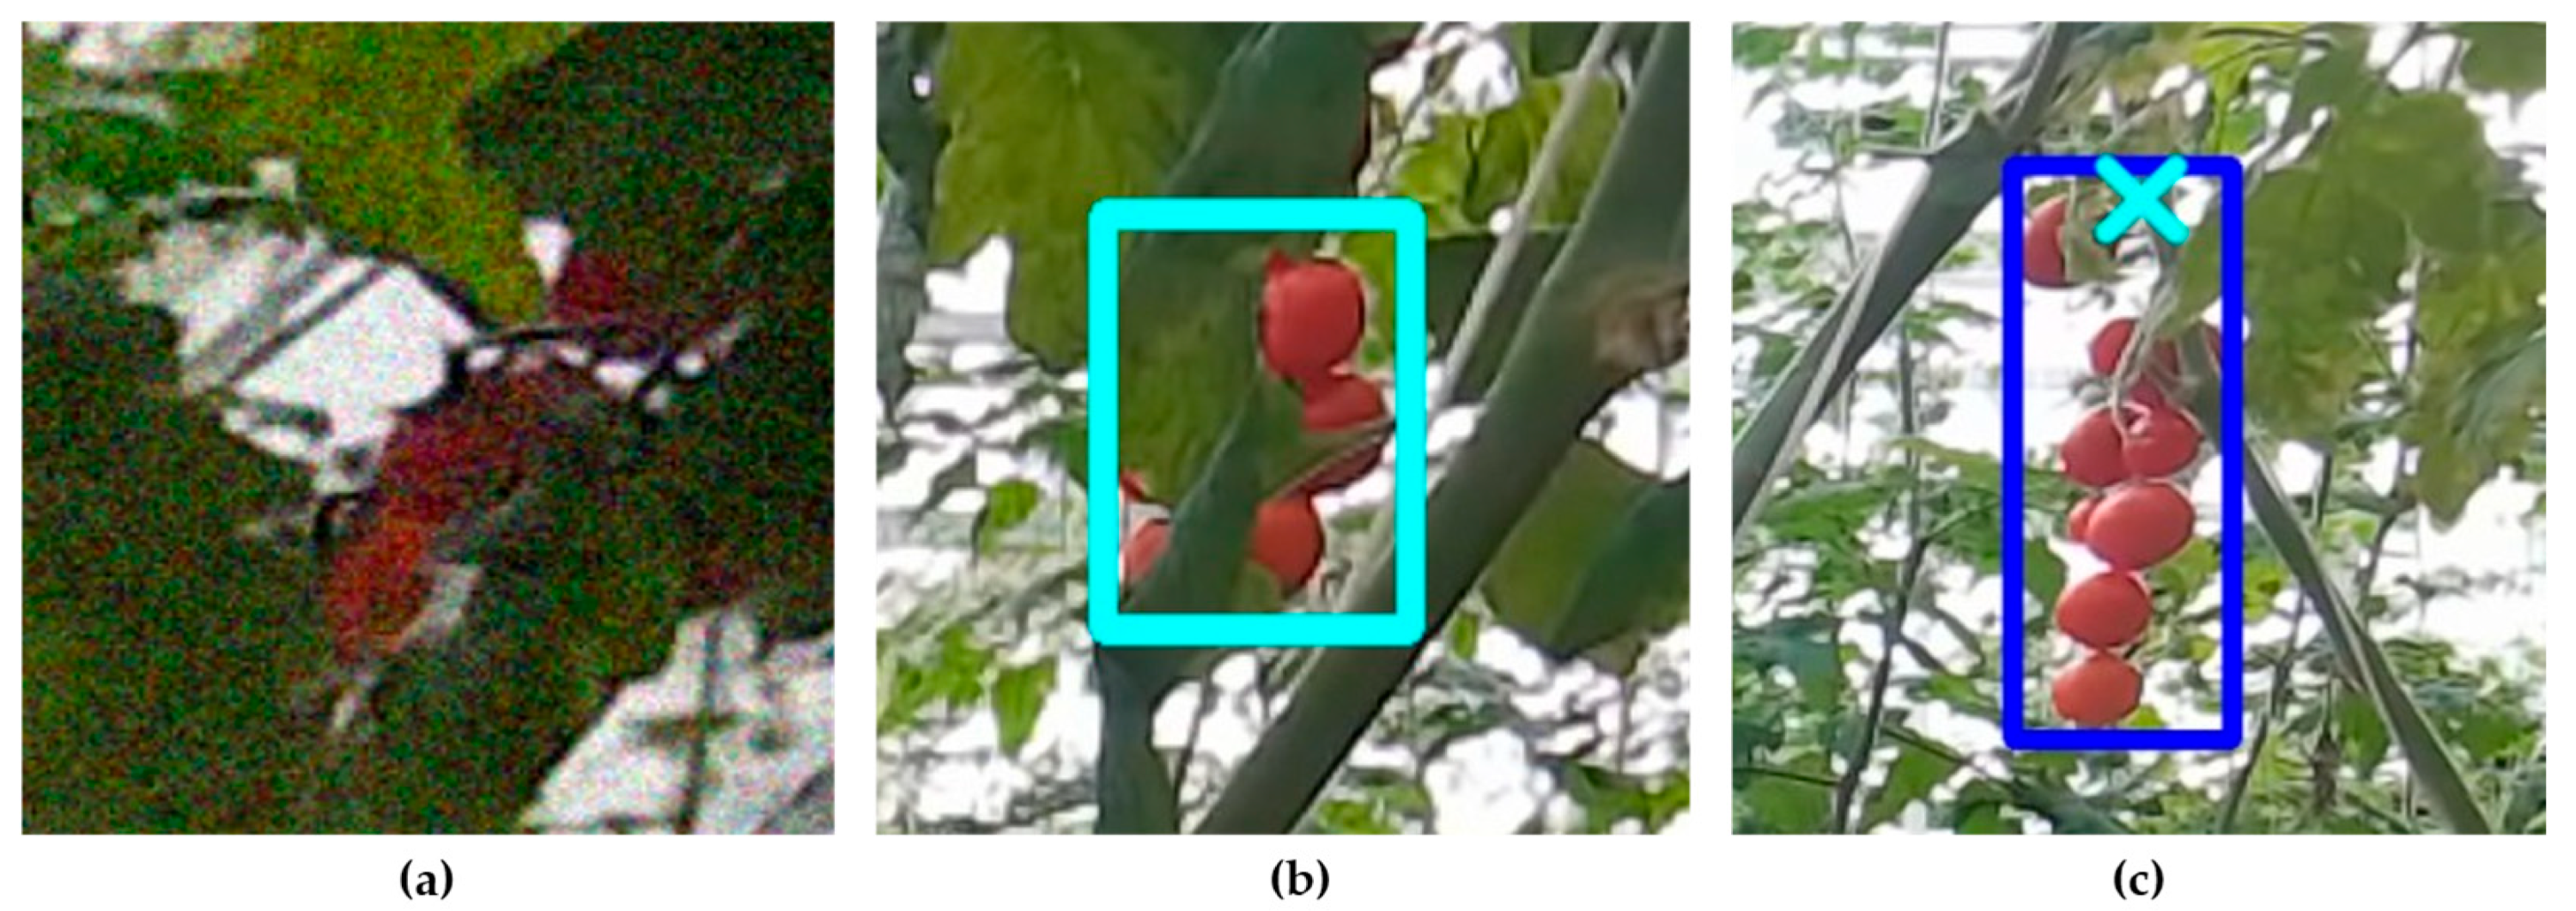
Although StarBL-YOLO demonstrates excellent performance in cherry tomato bunch and picking point detection, it still encounters detection failures in certain complex scenarios, as shown in Figure 9. This section analyzes the following three typical failure cases: (1) missed detection under severe noise and occlusion; (2) false detection of distant bunch; and (3) incorrect picking point detection on the main stem.
In Figure 9a, with significant noise and leaf occlusion interference, the model failed to detect targets. This failure may occur because the color information in RGB images becomes highly similar to the background, while the depth data become fragmented or unreliable due to physical obstructions. In Figure 9b, when cherry tomato bunches are occluded by leaves, the model detected targets beyond our predefined distance range. This phenomenon may occur due to depth measurement errors or sensor noise from the depth camera, where the system mistakenly substitutes the depth value of obstructing leaves for that of the actual fruit clusters. Consequently, the model erroneously identifies these occluded bunches as falling within our operational distance range. In Figure 9c, when fruit pedicels are occluded by main stems or leaves, the model erroneously identifies points on the main stem as picking locations. This misidentification predominantly occurs when the main stem and pedicel overlap in the current field of view, creating visual ambiguity that challenges differentiation. While depth information helps mitigate this issue, detection failures may still occur when pedicels are completely occluded.
In summary, these failure cases highlight the model’s limitations in extreme conditions. Further optimizations in dataset diversity, sensor accuracy, and model architecture are expected to partially address these challenges in future work.

4. Discussion

In this study, we proposed StarBL-YOLO, a lightweight RGB-D-based detection model for cherry tomato bunches and picking points. Compared with previous approaches that relied heavily on RGB-only images, our method benefits from the complementary nature of depth information, which significantly reduces the negative impact of severe occlusions and overlapping bunches. As depth sensing is already necessary for executing precise picking actions in robotic harvesting, its integration does not incur additional hardware costs.
Despite the improvements, some limitations remain. The dataset used in this work consisted of 843 RGB-D image pairs collected from a single commercial greenhouse and was later expanded to 4215 pairs through data augmentation. While this dataset includes a variety of occlusion and illumination conditions, its limited sample size and insufficient scenarios may compromise the model’s generalization capability and potentially lead to overfitting issues. Although the generalization validation experiments using unseen plastic dummy plants (Section 3.4) demonstrated that StarBL-YOLO can adapt to new scenarios, further evaluation on larger and more diverse datasets—across different farms, cultivars, and environmental conditions—is necessary. It should be noted that the dataset primarily contains uniformly ripened cherry tomatoes and does not include significant variations in fruit maturity stages as a result of the data acquisition time. In real-world settings, however, tomatoes may exhibit non-uniform ripeness within a single bunch or across the field, which can potentially confuse the model in distinguishing between pickable and non-pickable targets. Future work should consider expanding maturity-level variations into the training dataset and exploring models that jointly estimate ripeness and harvestability.
For practical applications, another important aspect that should be explored is transferring the trained model from one farm to another. Thus far, multiple studies have all been conducted at one single greenhouse or farm. When transferring such trained models to different farms, environments, or fruit varieties, there may be a significant negative impact on the detection accuracy. In addition, whether and how models trained for one type of fruit can be transferred to another one, for example, from cherry tomatoes to grapes, should also be explored in the future.
It should be noted that the NP-mAP50-95 of various detection models for the non-pickable category are all very low. Although StarBL-YOLO shows a 10.8% improvement over YOLOv5-Pose, it still achieves only 0.468, which remains relatively low. This indicates that the confidence of the detection is not high for complex cases, and there is still room for significant improvement.
Overall, the proposed lightweight model StarBL-YOLO shows great potential in the field of agricultural automation. With the growing adoption of agricultural robotics, there is an increasing demand for real-time, cost-effective, and efficient models. StarBL-YOLO meets these needs with fewer model parameters and lower computational complexity while maintaining high detection accuracy.
Compared with traditional methods, StarBL-YOLO does not rely on handcrafted features (e.g., color and shape), making it more robust. Moreover, while traditional methods often require separate detection of fruits and picking points, StarBL-YOLO can simultaneously perform classification (pickable/non-pickable) and keypoint localization, thereby simplifying the system pipeline. However, StarBL-YOLO also has some limitations compared to traditional methods. As a deep learning-based method, it requires a large amount of annotated data for training, which is time-consuming and labor-intensive. Additionally, its performance may degrade in unseen scenarios (e.g., fruit varieties not included in the training set).
Our future research will focus on the following directions: (1) expanding and diversifying the dataset to include different farms, cultivars, and environmental conditions, thereby enhancing the model’s generalization ability and mitigating overfitting risks; (2) improving detection performance under challenging scenarios, such as dense foliage occlusion, extreme lighting conditions, and irregular fruit cluster morphology; (3) extending the proposed framework to other clustered fruits (e.g., grapes and blueberries) to broaden its applicability in precision agriculture; and (4) developing integrated models that simultaneously consider maturity levels and occlusion conditions to jointly estimate ripeness and harvestability, thereby enabling more robust field applications.

5. Conclusions

In the current study, a lightweight model, StarBL-YOLO, based on YOLOv8-Pose, has been introduced for detecting cherry tomato bunches and picking points in multimodal images acquired by an off-the-shelf RGB-D sensor at a commercial farm. To solve the problem of missing detection caused by the overlapping of cherry tomato bunches and to filter out the distant cherry bunches, depth maps and RGB images are fused together as the input. The adoption of Starblock from StarNet to replace the Bottleneck module in YOLOv8-Pose achieves model lightweighting while enhancing feature extraction capability, enabling real-time operation on low-cost hardware with improved detection performance. At the same time, the coordinate attention mechanism is incorporated into the network to compensate for potential spatial detail loss caused by Starblock and enhance the model’s robustness in complex backgrounds, thereby improving detection performance. Finally, we modified the loss function of YOLOv8-Pose to make it more suitable for the task of detecting a single picking point. Experimental results demonstrate that StarBL-YOLO achieves state-of-the-art performance in cherry tomato bunch and picking point detection, with P-mAP50 and P-mAP50-95 reaching 0.908 and 0.665, NP-mAP50 and NP-mAP50-95 attaining 0.739 and 0.468, and PP-mAP50 and PP-mAP50-95 achieving 0.928 and 0.925, respectively. Moreover, the model maintains remarkable efficiency with computational parameters and FLOPs of merely 2.72 M and 7.7 G, respectively. It outperformed several widely used keypoint detection models. In summary, the proposed StarBL-YOLO lightweight network demonstrates compact architecture, high efficiency, and superior accuracy in cherry tomato bunch and picking point detection. This work provides valuable insights for advancing autonomous and reliable fruit harvesting robots.

Author Contributions

Conceptualization, Y.T. and Z.Z.; methodology, P.L.; software, P.L.; validation, P.L. and M.W.; formal analysis, P.L.; investigation, M.W.; resources, M.W.; data curation, P.L.; writing—original draft preparation, P.L.; writing—review and editing, M.W., Z.Z. and Y.T.; visualization, P.L.; supervision, Y.T.; project administration, M.W.; funding acquisition, Y.T. All authors have read and agreed to the published version of the manuscript.

Funding

This research was funded by Shenzhen University, grant number 20230300.

Data Availability Statement

The code used for this study is made public on Github at: https://github.com/SeiriosLab/StarYOLO (accessed on 7 July 2025).

Conflicts of Interest

The authors declare no conflicts of interest. The funders had no role in the design of this study; in the collection, analyses, or interpretation of data; in the writing of this manuscript; or in the decision to publish the results.

References

  1. Agarwal, S.; Rao, A.V. Tomato lycopene and its role in human health and chronic diseases. CMAJ Can. Med. Assoc. J. J. De L Assoc. Medicale Can. 2000, 163, 739–744. [Google Scholar]
  2. Taqi, F.; Al-Langawi, F.; Abdulraheem, H.; El-Abd, M. A cherry-tomato harvesting robot. In Proceedings of the 2017 18th International Conference on Advanced Robotics (ICAR), Hong Kong, China, 10–12 July 2017; pp. 463–468. [Google Scholar]
  3. Jiang, P.; Ergu, D.; Liu, F.; Cai, Y.; Ma, B. A Review of Yolo Algorithm Developments. Procedia Comput. Sci. 2022, 199, 1066–1073. [Google Scholar] [CrossRef]
  4. Sozzi, M.; Cantalamessa, S.; Cogato, A.; Kayad, A.; Marinello, F. Automatic Bunch Detection in White Grape Varieties Using YOLOv3, YOLOv4, and YOLOv5 Deep Learning Algorithms. Agronomy 2022, 12, 319. [Google Scholar] [CrossRef]
  5. Lin, G.; Tang, Y.; Zou, X.; Cheng, J.; Xiong, J. Fruit detection in natural environment using partial shape matching and probabilistic Hough transform. Precis. Agric. 2020, 21, 160–177. [Google Scholar] [CrossRef]
  6. Jocher, G.; Chaurasia, A.; Qiu, J. Ultralytics YOLO, 8.0.0; 2023. Available online: https://github.com/ultralytics/ultralytics (accessed on 5 August 2025).
  7. OĞUztÜRk, G.E. AI-driven irrigation systems for sustainable water management: A systematic review and meta-analytical insights. Smart Agric. Technol. 2025, 11, 100982. [Google Scholar] [CrossRef]
  8. Kumari, K.; Mirzakhani Nafchi, A.; Mirzaee, S.; Abdalla, A. AI-Driven Future Farming: Achieving Climate-Smart and Sustainable Agriculture. AgriEngineering 2025, 7, 89. [Google Scholar] [CrossRef]
  9. Lyu, S.; Li, R.; Zhao, Y.; Li, Z.; Fan, R.; Liu, S. Green Citrus Detection and Counting in Orchards Based on YOLOv5-CS and AI Edge System. Sensors 2022, 22, 576. [Google Scholar] [CrossRef]
  10. Tu, S.; Xue, Y.; Zheng, C.; Qi, Y.; Wan, H.; Mao, L. Detection of passion fruits and maturity classification using Red-Green-Blue Depth images. Biosyst. Eng. 2018, 175, 156–167. [Google Scholar] [CrossRef]
  11. Fu, H.; Guo, Z.; Feng, Q.; Xie, F.; Zuo, Y.; Li, T. MSOAR-YOLOv10: Multi-Scale Occluded Apple Detection for Enhanced Harvest Robotics. Horticulturae 2024, 10, 1246. [Google Scholar] [CrossRef]
  12. Kaukab, S.; Komal; Ghodki, B.M.; Ray, H.; Kalnar, Y.B.; Narsaiah, K.; Brar, J.S. Improving real-time apple fruit detection: Multi-modal data and depth fusion with non-targeted background removal. Ecol. Inform. 2024, 82, 102691. [Google Scholar] [CrossRef]
  13. Wu, X.; Tian, Y.; Zeng, Z. LEFF-YOLO: A Lightweight Cherry Tomato Detection YOLOv8 Network with Enhanced Feature Fusion. In Proceedings of the Advanced Intelligent Computing Technology and Applications, Ningbo, China, 26–29 July 2025; pp. 474–488. [Google Scholar]
  14. Aguiar, A.S.; Magalhães, S.A.; dos Santos, F.N.; Castro, L.; Pinho, T.; Valente, J.; Martins, R.; Boaventura-Cunha, J. Grape Bunch Detection at Different Growth Stages Using Deep Learning Quantized Models. Agronomy 2021, 11, 1890. [Google Scholar] [CrossRef]
  15. Yuan, T.; Lv, L.; Zhang, F.; Fu, J.; Gao, J.; Zhang, J.; Li, W.; Zhang, C.; Zhang, W. Robust Cherry Tomatoes Detection Algorithm in Greenhouse Scene Based on SSD. Agriculture 2020, 10, 160. [Google Scholar] [CrossRef]
  16. Cui, B.; Zeng, Z.; Tian, Y. A Yolov7 Cherry Tomato Identification Method That Integrates Depth Information; SPIE: Bellingham, WA, USA, 2023; Volume 12747. [Google Scholar]
  17. Cai, Y.; Cui, B.; Deng, H.; Zeng, Z.; Wang, Q.; Lu, D.; Cui, Y.; Tian, Y. Cherry Tomato Detection for Harvesting Using Multimodal Perception and an Improved YOLOv7-Tiny Neural Network. Agronomy 2024, 14, 2320. [Google Scholar] [CrossRef]
  18. Rong, J.; Zhou, H.; Zhang, F.; Yuan, T.; Wang, P. Tomato cluster detection and counting using improved YOLOv5 based on RGB-D fusion. Comput. Electron. Agric. 2023, 207, 107741. [Google Scholar] [CrossRef]
  19. Chai, S.; Wen, M.; Li, P.; Zeng, Z.; Tian, Y. DCFA-YOLO: A Dual-Channel Cross-Feature-Fusion Attention YOLO Network for Cherry Tomato Bunch Detection. Agriculture 2025, 15, 271. [Google Scholar] [CrossRef]
  20. Li, X.; Ma, N.; Han, Y.; Yang, S.; Zheng, S. AHPPEBot: Autonomous Robot for Tomato Harvesting based on Phenotyping and Pose Estimation. In Proceedings of the 2024 IEEE International Conference on Robotics and Automation (ICRA), Yokohama, Japan, 13–17 May 2024; pp. 18150–18156. [Google Scholar]
  21. Wang, L.; Zhao, Y.; Xiong, Z.; Wang, S.; Li, Y.; Lan, Y. Fast and precise detection of litchi fruits for yield estimation based on the improved YOLOv5 model. Front. Plant Sci. 2022, 13, 965425. [Google Scholar] [CrossRef] [PubMed]
  22. Qin, X.; Cao, J.; Zhang, Y.; Dong, T.; Cao, H. Development of an Optimized YOLO-PP-Based Cherry Tomato Detection System for Autonomous Precision Harvesting. Processes 2025, 13, 353. [Google Scholar] [CrossRef]
  23. Miao, Z.; Yu, X.; Li, N.; Zhang, Z.; He, C.; Li, Z.; Deng, C.; Sun, T. Efficient tomato harvesting robot based on image processing and deep learning. Precis. Agric. 2023, 24, 254–287. [Google Scholar] [CrossRef]
  24. Zhang, G.; Cao, H.; Jin, Y.; Zhong, Y.; Zhao, A.; Zou, X.; Wang, H. YOLOv8n-DDA-SAM: Accurate Cutting-Point Estimation for Robotic Cherry-Tomato Harvesting. Agriculture 2024, 14, 1011. [Google Scholar] [CrossRef]
  25. Sohan, M.; Sai Ram, T.; Rami Reddy, C.V. A Review on YOLOv8 and Its Advancements. In Proceedings of the Data Intelligence and Cognitive Informatics, Tirunelveli, India, 18–20 November 2024; pp. 529–545. [Google Scholar]
  26. Ma, X.; Dai, X.; Bai, Y.; Wang, Y.; Fu, Y. Rewrite the Stars. In Proceedings of the 2024 IEEE/CVF Conference on Computer Vision and Pattern Recognition (CVPR), Seattle, WA, USA, 16–22 June 2024; pp. 5694–5703. [Google Scholar]
  27. Hou, Q.; Zhou, D.; Feng, J. Coordinate Attention for Efficient Mobile Network Design. In Proceedings of the 2021 IEEE/CVF Conference on Computer Vision and Pattern Recognition (CVPR), Nashville, TN, USA, 20–25 June 2021; pp. 13708–13717. [Google Scholar]
  28. Pande, B.; Padamwar, K.; Bhattacharya, S.; Roshan, S.; Bhamare, M. A Review of Image Annotation Tools for Object Detection. In Proceedings of the 2022 International Conference on Applied Artificial Intelligence and Computing (ICAAIC), Salem, India, 9–11 May 2022; pp. 976–982. [Google Scholar]
  29. Liu, S.; Qi, L.; Qin, H.; Shi, J.; Jia, J. Path Aggregation Network for Instance Segmentation. In Proceedings of the 2018 IEEE/CVF Conference on Computer Vision and Pattern Recognition, Salt Lake City, UT, USA, 18–23 June 2018; pp. 8759–8768. [Google Scholar]
  30. Rong, J.; Zheng, W.; Qi, Z.; Yuan, T.; Wang, P. RTMFusion: An enhanced dual-stream architecture algorithm fusing RGB and depth features for instance segmentation of tomato organs. Measurement 2025, 239, 115484. [Google Scholar] [CrossRef]
  31. Guan, L.; Wang, F.; Li, B.; Tang, R.; Wei, R.; Deng, H.; Tian, Y. Adaptive Automotive Chassis Welding Joint Inspection Using a Cobot and a Multi-modal Vision Sensor: Adaptive welding joint inspection robotic vision system. In Proceedings of the 2024 Guangdong-Hong Kong-Macao Greater Bay Area International Conference on Digital Economy and Artificial Intelligence, Hongkong, China, 19–21 January 2024; pp. 841–849. [Google Scholar]
  32. Sifre, L.; Mallat, S.J.A. Rigid-Motion Scattering for Texture Classification. arXiv 2014, arXiv:1403.1687. [Google Scholar]
  33. Maji, D.; Nagori, S.; Mathew, M.; Poddar, D. Yolo-pose: Enhancing yolo for multi person pose estimation using object keypoint similarity loss. In Proceedings of the IEEE/CVF Conference On Computer Vision and Pattern Recognition, New Orleans, LA, USA, 18–24 June 2022; pp. 2637–2646. [Google Scholar]
  34. Wang, C.Y.; Bochkovskiy, A.; Liao, H.Y.M. YOLOv7: Trainable Bag-of-Freebies Sets New State-of-the-Art for Real-Time Object Detectors. In Proceedings of the 2023 IEEE/CVF Conference on Computer Vision and Pattern Recognition (CVPR), Vancouver, BC, Canada, 17–24 June 2023; pp. 7464–7475. [Google Scholar]
  35. Khanam, R.; Hussain, M.J.A. YOLOv11: An Overview of the Key Architectural Enhancements. arXiv 2024, arXiv:2410.17725. [Google Scholar]
  36. Tian, Y.; Ye, Q.; Doermann, D.S.J.A. YOLOv12: Attention-Centric Real-Time Object Detectors. arXiv 2025, arXiv:2502.12524. [Google Scholar]
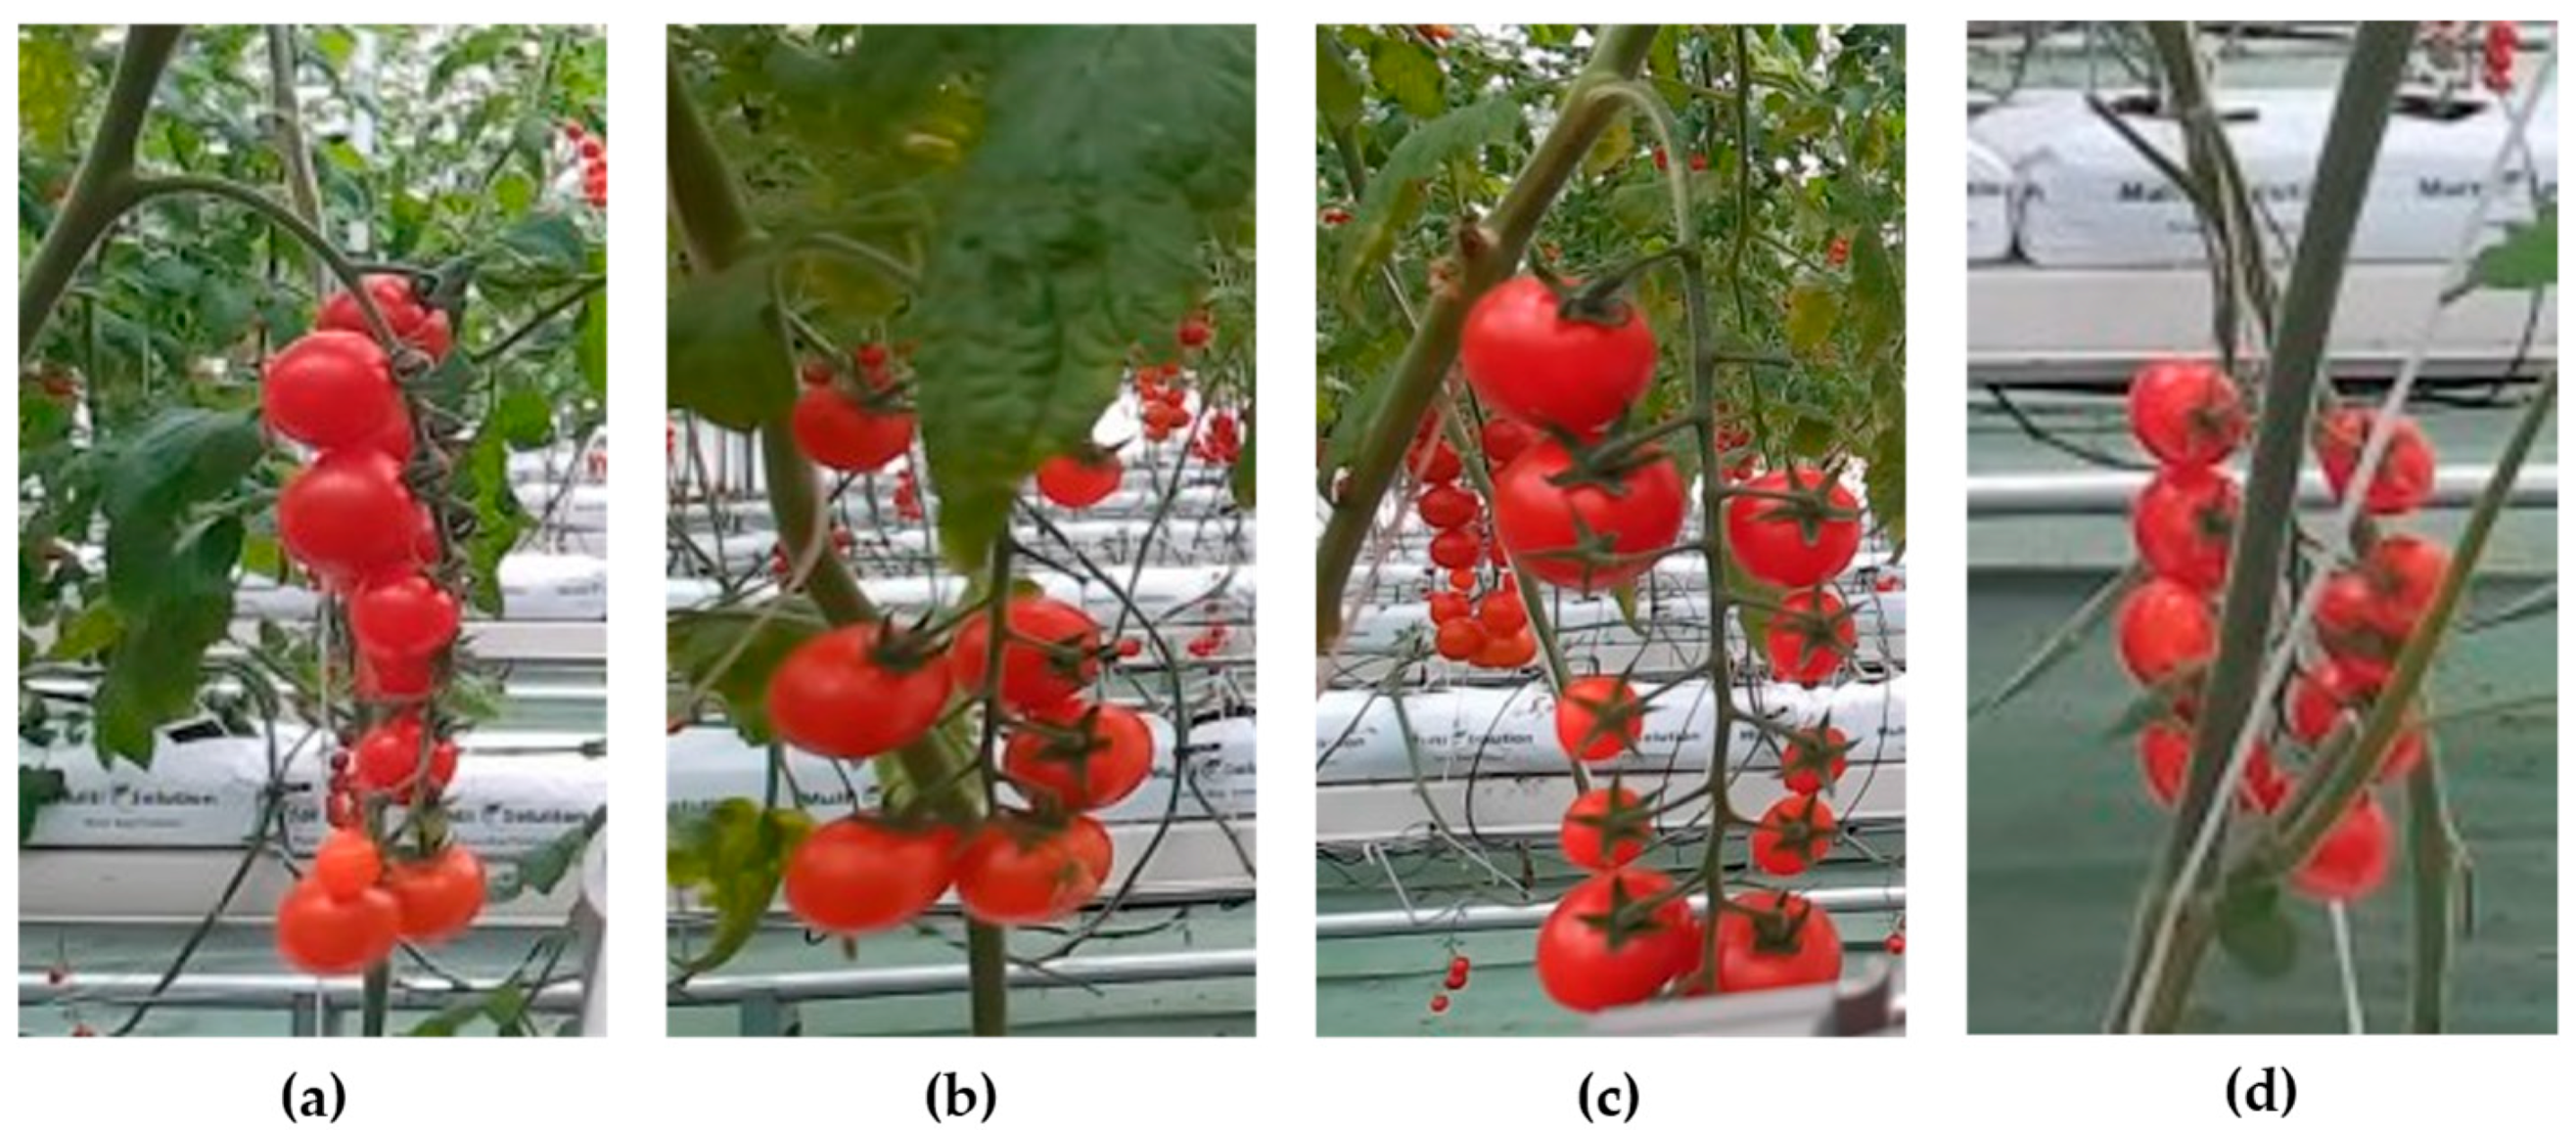
Figure 1. Examples from the dataset. (a) Normal situation; (b) occlusion by leaves; (c) fruit clusters overlapping; and (d) occlusion by stems.
Horticulturae 11 00949 g001
Figure 2. Data augmentation effect. (a) Horizontally flipped image; (b) image with added Gaussian noise; (c) image with random brightness variation; and (d) image with added Gaussian noise and random brightness variation.
Horticulturae 11 00949 g002
Figure 3. Examples of pickable and non-pickable cherry tomato bunches: (a) pickable, the stem is not obscured; (b) non-pickable, the stem is obscured.
Horticulturae 11 00949 g003
Figure 4. The network structure of the proposed StarBL-YOLO.
Horticulturae 11 00949 g004
Figure 5. Multimodal fusion strategies. (a) Single-stream approach. (b) Two-stream approach. (The symbol © represents concatenation).
Horticulturae 11 00949 g005
Figure 6. The structures of the C2f-Starblock module and coordinate attention. (a) The structure of the C2f-Starblock module. (b) The structure of the coordinate attention.
Horticulturae 11 00949 g006
Figure 7. An example of cherry tomato bunches and picking points detection. (a) RGB image. (b) Depth image. (c) Ground truths. (di) Detection outputs from YOLOv5-Pose, YOLOv7-Pose, YOLOv8-Pose, YOLOv11-Pose, YOLOv12-Pose, and StarBL-YOLO, respectively. Blue boxes indicate pickable cherry tomato bunches, aqua boxes indicate non-pickable cherry tomato bunches, and red boxes and yellow boxes are manually added to indicate false detections and missed detections.
Horticulturae 11 00949 g007
Figure 8. The detection results of StarBL-YOLO in the simulation using plastic dummy plants.
Horticulturae 11 00949 g008
Figure 9. Some failure cases encountered by StarBL-YOLO in cherry tomato detection. (a) Missed detection; (b) false detection; and (c) picking point localization failure. Blue boxes indicate pickable cherry tomato bunches, aqua boxes indicate non-pickable cherry tomato bunches.
Horticulturae 11 00949 g009
Table 1. Ablation results for cherry tomato bunch and picking point detection (bold values indicate the best performance in each column).
ModelPickable ButchNon-Pickable ButchPicking PointPara (M)GFLOPs
mAP50mAP50-95mAP50mAP50-95mAP50mAP50-95RMSER2
Baseline0.8640.6180.6590.4060.8850.87926.15290.99663.0788.3
+D0.8910.6630.6950.4420.9140.90924.61290.99693.0788.4
+S0.8770.6320.6760.420.90.89625.96610.99642.7157.7
+C0.8660.6290.6660.4190.8810.87726.98150.99623.0848.3
+L0.8720.6260.670.4090.9090.90121.74150.99723.0788.3
+D+S0.8830.6540.7040.4510.9140.90924.61290.99692.7157.7
+S+C0.860.640.6920.450.8910.88224.68630.99692.7217.7
+D+C0.8870.6660.7290.4780.9110.90621.92190.99753.0858.4
+D+S+C0.9010.6670.7010.450.9210.91826.28620.99652.7217.7
Full model0.9080.6650.7390.4680.9280.92519.88100.99792.7217.7
Table 2. Comparison of results for cherry tomato bunch and picking point detection: starBL-YOLO vs. other models (bold and underlined values indicate the best and 2nd best in each column).
ModelPickable ButchNon-Pickable ButchPicking PointPara (M)GFLOPs
mAP50mAP50-95mAP50mAP50-95mAP50mAP50-95RMSER2
YOLOv5-Pose0.8720.5920.6670.360.9030.88829.17260.994914.9119.8
YOLOv7-Pose0.8870.6120.6840.410.9190.91129.36930.995179.82100.7
YOLOv8-Pose0.8640.6180.6590.4060.8850.87926.15290.99663.088.3
YOLOv11-Pose0.8730.6520.7030.4520.8940.8923.28030.99712.656.6
YOLOv12-Pose0.890.6530.7020.4440.910.90725.94200.99652.636.6
StarBL-YOLO0.9080.6650.7390.4680.9280.92519.88100.99792.727.7
Table 3. Comparison of experimental results: StarBL-YOLO vs. YOLOv11s-Pose and YOLOv12-Pose models (bold values indicate the best in each column).
ModelPickable ButchNon-Pickable ButchPicking PointPara (M)GFLOPs
mAP50mAP50-95mAP50mAP50-95mAP50mAP50-95RMSER2
YOLOv11s-Pose0.8880.6780.7140.4720.9140.90721.75250.99759.6922.3
YOLOv12s-Pose0.8860.6760.710.470.9090.90521.93490.99759.5122.2
StarBL-YOLO0.9080.6650.7390.4680.9280.92519.88100.99792.727.7
Disclaimer/Publisher’s Note: The statements, opinions and data contained in all publications are solely those of the individual author(s) and contributor(s) and not of MDPI and/or the editor(s). MDPI and/or the editor(s) disclaim responsibility for any injury to people or property resulting from any ideas, methods, instructions or products referred to in the content.