Article

The Influence of Bud Positions on the Changes in Carbohydrates and Nitrogen in Response to Hydrogen Cyanamide During Budbreak in Low-Chill Kiwifruit

1
M.Sc. Programme in Plant Sciences, Faculty of Graduate Studies, Mahidol University, Nakhon Pathom 73170, Thailand
2
Department of Plant Science, Faculty of Science, Mahidol University, Bangkok 10400, Thailand
3
Department of Pharmaceutical Botany, Faculty of Pharmacy, Mahidol University, Bangkok 10400, Thailand
4
Graduate School of Horticulture, Chiba University, Matsudo, Chiba 271-8510, Japan
5
Department of Biochemistry, Faculty of Medicine, Srinakharinwirot University, Bangkok 10110, Thailand
*
Author to whom correspondence should be addressed.
Horticulturae 2025, 11(7), 847; https://doi.org/10.3390/horticulturae11070847
Submission received: 27 May 2025 / Revised: 30 June 2025 / Accepted: 15 July 2025 / Published: 17 July 2025
(This article belongs to the Section Fruit Production Systems)

Abstract

Climate change has contributed to a decline in winter chilling accumulation, a critical requirement for budbreak in temperate fruit crops. Its consequence has been a reduction in fruit production. To compensate for insufficient chilling, hydrogen cyanamide (HC) is widely applied, though its effectiveness remains limited. This study investigated the effect of HC application on budbreak in low-chill kiwifruit under warm conditions by correlating phenological responses with changes in carbohydrate and nitrogen concentrations in bark tissues across bud positions. Phenological observations revealed the highest budbreak percentage and total flower buds at the apical position. HC significantly increased budbreak by 58.82% at the apical position and by 375% at the middle position, with corresponding increases in total flower buds by 148.78% and 1066.67%, respectively. Additionally, shoot lengths were uniform among bud positions in HC-treated canes, whereas non-treated canes showed shoot length heterogeneity. Moreover, HC treatment triggered an earlier and more pronounced reduction in soluble sugars (sucrose and hexoses) concentrations along the gradient from apical to basal bud positions, where the response was strongest at the apical position, which was strongly associated with enhanced budbreak percentages and total flower bud formation. While total nitrogen content was highest in the apical position, it was unaffected by HC application. These findings indicate that HC may promote budbreak by enhancing the mobilization and consumption of soluble sugars for bud growth, thereby improving budbreak performance, flower bud production, and uniform shoot development in low-chill kiwifruit under warm conditions.

1. Introduction

Bud dormancy represents a critical transition and initiation phase in the phenological cycle of deciduous plants, including kiwifruit. During winter, chilling exposure is essential for releasing buds from dormancy and facilitating subsequent growth and development. Sufficient chilling accumulation directly determines the uniformity of budbreak, flowering, and fruiting [1]. However, climate change has led to a steady global increase in temperature and a concurrent reduction in chilling duration, thereby disrupting budbreak processes in kiwifruit [2,3,4] and other deciduous species [5]. In response, low-chill kiwifruit cultivars have been introduced as an alternative, particularly in regions where insufficient winter chilling is anticipated. ‘Bruno’ is recognized as a low-chill kiwifruit cultivar, but it still requires approximately 750 chilling hours to adequately fulfill its dormancy release requirement and around 950 chilling hours to initiate floral emergence [6]. In the highland tropical climate of northern Thailand, where average chilling hours are approximately 350 [7], suboptimal chilling conditions severely constrain budbreak, flower bud development, and ultimately yield. These limitations are reflected in the low average budbreak per cane, reaching only 13.9% [8], compared to up to 59% under optimal chilling conditions [9]. To mitigate this problem, hydrogen cyanamide (HC), a dormancy-breaking agent, has been widely applied to compensate for chilling insufficiency and to advance budbreak in kiwifruit cultivation [10,11,12,13,14]. Although the extensive use of HC has partially alleviated this issue, challenges such as heterogeneous budbreak, early emergence of apical buds, and inconsistent flowering persist, ultimately leading to reduced productivity. Furthermore, inadequate budbreak results in extensive canopy gaps, allowing excessive sunlight penetration and heat accumulation beneath the canopy, which in turn complicates subsequent orchard management.
Non-structural carbohydrates (NSCs), which accumulate in plants throughout the winter, serve as crucial energy reserves for reactivating dormant buds and supporting early shoot growth. In kiwifruit canes, starch is the primary storage form of carbohydrates and undergoes substantial fluctuations throughout the growing season, particularly during budbreak and early shoot development [15]. During dormancy, chilling exposure triggers the hydrolysis of starch into soluble sugars, which often accumulate at high concentrations in the bark tissue adjacent to the bud [16,17,18,19]. Therefore, the bark tissues may function as the nearest accessible compartment providing a carbon source for bud growth. In addition to serving as a vital carbon source, these soluble sugars also participate in the regulation of apical dominance, in conjunction with plant hormones [20,21,22].
Nitrogen (N) is similarly critical for plant growth and development. Approximately 60% of nitrogen is remobilized from reserved compartments to support the early stages of new growth in kiwifruit [23,24]. This corresponds with a notable increase in nitrogen content within kiwifruit buds prior to bud enlargement and budbreak [25], whereas nitrogen uptake from the roots during this initial phase appears minimal [26]. A previous study indicated that 15N-labeled nitrogen applied in autumn was not detected in the xylem sap of one-year-old kiwifruit canes until budbreak had substantially progressed [27]. Accordingly, the bark tissues surrounding the buds likely serve as a primary nitrogen source, supporting the initiation of bud growth and the advancement of budbreak, as observed in other deciduous species such as apple shoots [28]. This internal nitrogen storage is established prior to dormancy, during autumn, when nitrogen is sequestered in the form of bark storage proteins (BSPs) within the phloem parenchyma and xylem ray cells of the bark in woody plant. These protein reserves progressively decline with the onset of shoot growth in spring [29].
Previous studies suggested a potential role of carbohydrate and nitrogen reserves in bark tissues in relation to budbreak and phenological development. However, research examining the interaction between these reserves and bud development remains limited. Relatively few studies have investigated the relationship between carbohydrate reserves in bark tissues and budbreak patterns, as reported in walnut [17]. Additional research has examined the spatial and temporal dynamics of carbohydrate and nitrogen distribution in peach trees during dormancy and their transition into shoot development in the following growing season [30]. However, only one study reported a correlation between carbohydrate concentrations in bark tissues and budbreak heterogeneity in kiwifruit [8], leaving the underlying mechanisms largely unexplored. Moreover, the distinct environmental conditions of tropical highland climates underscore the need for further research to clarify how bud position and hydrogen cyanamide (HC) application influence non-structural carbohydrate and nitrogen concentrations in bark tissues, and how these factors may collectively affect budbreak.
This study is based on the hypothesis that the protective bark tissue adjacent to developing buds may undergo temporal changes in non-structural carbohydrates and total nitrogen contents during the budbreak period. These patterns may be influenced by hydrogen cyanamide (HC) application and bud position. Accordingly, the present study aimed to (1) investigate the effects of hydrogen cyanamide (HC) application on budbreak across different bud positions and (2) examine the relationship between phenological development and changes in carbohydrate and nitrogen content in the bark tissues of kiwifruit canes, thereby contributing to a better understanding of the factors involved in budbreak heterogeneity in low-chill kiwifruit under highland tropical conditions.

2. Materials and Methods

2.1. Plant Material, Treatment, and Sampling

This experiment was conducted in the kiwifruit orchard at the Royal Agricultural Station Angkhang, Chiang Mai, Thailand (19°54.334′ N, 99°02.249′ E; altitude: 1400 m). The vines were trained on a T-bar trellis system and were annually supplied with fertilizer containing 0.9 kg N, 0.3 kg P, and 0.9 kg K per vine.
Six kiwifruit vines of low-chill cultivar ‘Bruno’ (Actinidia deliciosa (A. Chev.) C.F. Liang et A.R. Ferguson), grafted onto the ‘Hayward’ rootstock, were used in this study. Two one-year-old canes with uniform length, diameter, and six visible buds, positioned similarly on the same vine, were selected as a pair consisting of treated and untreated cane (Figure 1). To induce dormancy release, 5% (w/v) hydrogen cyanamide was applied to the dormant buds on the treated canes (HC), while the non-treated canes (NHC) did not receive any chemical treatment. Each cane was treated individually to ensure consistent and localized application. The HC application was performed on February 6th, 2018, at the onset of warmer dew point temperatures to minimize the risk of frost.
Paired canes were randomly sampled at 0, 7, 14, 21, and 28 days after treatment (DAT) for a biochemical analysis and were separated based on treatment (HC, NHC) and bud position (apical, middle, basal). Bud position was determined by dividing each cane into three equal segments: apical (distal end), middle, and basal (proximal end). To ensure clear differentiation among bud positions along the cane, specific buds were consistently selected to represent each position. The first, third, and fifth buds from the distal end were designated as the apical, middle, and basal positions, respectively. This approach enabled consistent spatial separation and facilitated accurate comparisons of phenological and biochemical responses.

2.2. Phenological Observation

At 55 DAT, approximately 50% of the apical buds under the non-treated condition had been released from dormancy. At that stage, shoot development had progressed sufficiently to allow for the assessment of budbreak incidence, flower bud counts, and shoot length. Distinct differences in phenological development between HC-treated and non-treated canes were apparent, as illustrated in Figure 2A. Budbreak was defined by the emergence of green tissues extending at least 10 mm [31]. Shoots were further categorized based on their morphological features. Reproductive shoots referred to emerged shoots bearing visible flower structures, whereas unidentifiable shoots were defined as a newly emerged shoot with reproductive structures not discernible through external observation due to concealment within the leaf cluster, resembling the stage of bud break (BB), advanced bud break (ABB) and open cluster (OC) stage (Figure 2B) [32]. Five pairs of canes, comprising five HC-treated and five non-treated canes, were randomly selected from each of the six vines. Budbreak, reproductive budbreak, shoot type, total flower bud, and shoot length were recorded separately for each cane. Data were then averaged across all 30 canes per treatment, regardless of the vine origin.

2.3. Weather and Chilling Calculation

Daily temperature data were acquired from the meteorological station located at the Royal Agricultural Station Angkhang, while hourly temperature data were continuously recorded in the field using a data logger programmed at 30 min intervals. Chilling hour accumulation was calculated for the period from 1 October 2017 to 31 March 2018, a time frame considered critical for bud phenological development. Chilling hours (CHs) were defined as the cumulative number of hours during which temperatures ranged between 0 °C and 7.2 °C [33].

2.4. Biochemical Analysis

For biochemical analyses, three pairs of canes (three HC-treated and three non-treated) were collected from each vine and pooled to form one replicate. At each time point, six replicates were obtained, corresponding to the six vines used for phenological observations. Four replicates were used for the analysis of non-structural carbohydrates, while three were analyzed for nitrogen content. The remaining samples were retained as spare. The protective bark tissues surrounding the buds, along with the internodal bark adjacent to each bud, were collected. All bark tissues were immediately frozen in liquid nitrogen and stored at –20 °C until further analysis.

2.4.1. Non-Structural Carbohydrate Concentrations

Bark tissues were dried and ground into a fine powder. Fibrous structure was removed by passing the powder through a 250 µm sieve. Subsequently, 50 mg of the powdered sample was extracted with 5 mL of 80% (v/v) ethanol and stirred for 10 min. The solution mixture was then filtered, and both the solid residue and the supernatant were collected. The solid residue was re-extracted two more times, and the supernatant fractions were combined for further analysis.
The starch content was determined following the methods described in [34]. In brief, the solid residue was enzymatically hydrolyzed using α-amylase (3000 U ml−1, Megazyme Ltd., Bray, Ireland) in acetate buffer, followed by amyloglucosidase (3260 U ml−1, Megazyme Ltd., Bray, Ireland) to convert starch into glucose. Glucose was reacted with a PGO reagent (Sigma-Aldrich Corp., St. Louis, MO, USA), and the reaction was terminated by adding 75% (v/v) sulfuric acid. Glucose absorbance was measured at 530 nm using a UV–vis spectrophotometer (Hitachi High-Tech Analysis Corp., Tokyo, Japan). Starch content was calculated from the glucose absorbance and expressed in mg gDW−1.
The supernatant was analyzed for soluble sugar concentration. Solvent removal was carried out using a rotary evaporator (Büchi Labortechnik AG, Flawil, Switzerland), and the dried residue was redissolved in 500 µL of deionized water. The solution was subsequently filtered through a 0.45 µm cellulose acetate disposable syringe filter. Samples were injected into an HPLC system (Waters Corp., Milford, MA, USA) equipped with a refractive index (RI) detector (Waters Corp., Milford, MA, USA). Sugar separation was achieved using a 250 mm × 4.6 mm i.d. Asahipak NH2P-50 4E column (Shodex, Showa Denko K.K., Tokyo, Japan) maintained at 30 °C, with 75% (v/v) acetonitrile as the mobile phase at a flow rate of 1 mL min−1. Chromatogram peaks were identified with references to three major sugars, including sucrose, glucose, and fructose. Sugar concentrations were calculated using standard curves prepared for each sugar.

2.4.2. Total Nitrogen Content

Total nitrogen content was determined from 250 mg of dried, powdered bark sample using a combustion-based method with a nitrogen determinator (FP-528, LECO Corp., St Joseph, MI, USA). The instrument was calibrated using an ethylenediaminetetraacetic acid (EDTA) standard (LECO Corp., St Joseph, MI, USA) containing 9.56 ± 0.05% nitrogen. Results are expressed as the percentage of nitrogen relative to the dry matter.

2.5. Statistical Analysis

Statistical analyses were performed using GraphPad Prism version 10.0.0 (GraphPad Software, Boston, MA, USA). Assumptions of normality and homogeneity of variance were evaluated using the Shapiro–Wilk test and Levene’s test, respectively. Phenological observation parameters, including the percentage of budbreak, percentage of reproductive budbreak, and the proportion of emerging shoot types, were compared between treatments using Fisher’s exact test. Additional parameters, specifically, the number of flower buds per dormant bud and the length of emerging shoots, were analyzed using the Mann–Whitney U test for non-parametric data. Means ± standard error of the mean (SEM) are presented in the result figures.
Differences in non-structural carbohydrate concentrations between HC-treated and non-treated canes at each sampling day were evaluated using an independent-sample t-test. Furthermore, the nitrogen content across bud positions within each treatment group was analyzed using a one-way analysis of variance (ANOVA), followed by Tukey’s multiple-comparison test to identify differences among groups. Statistical significance was determined at the level of p < 0.05 for all analyses.

3. Results

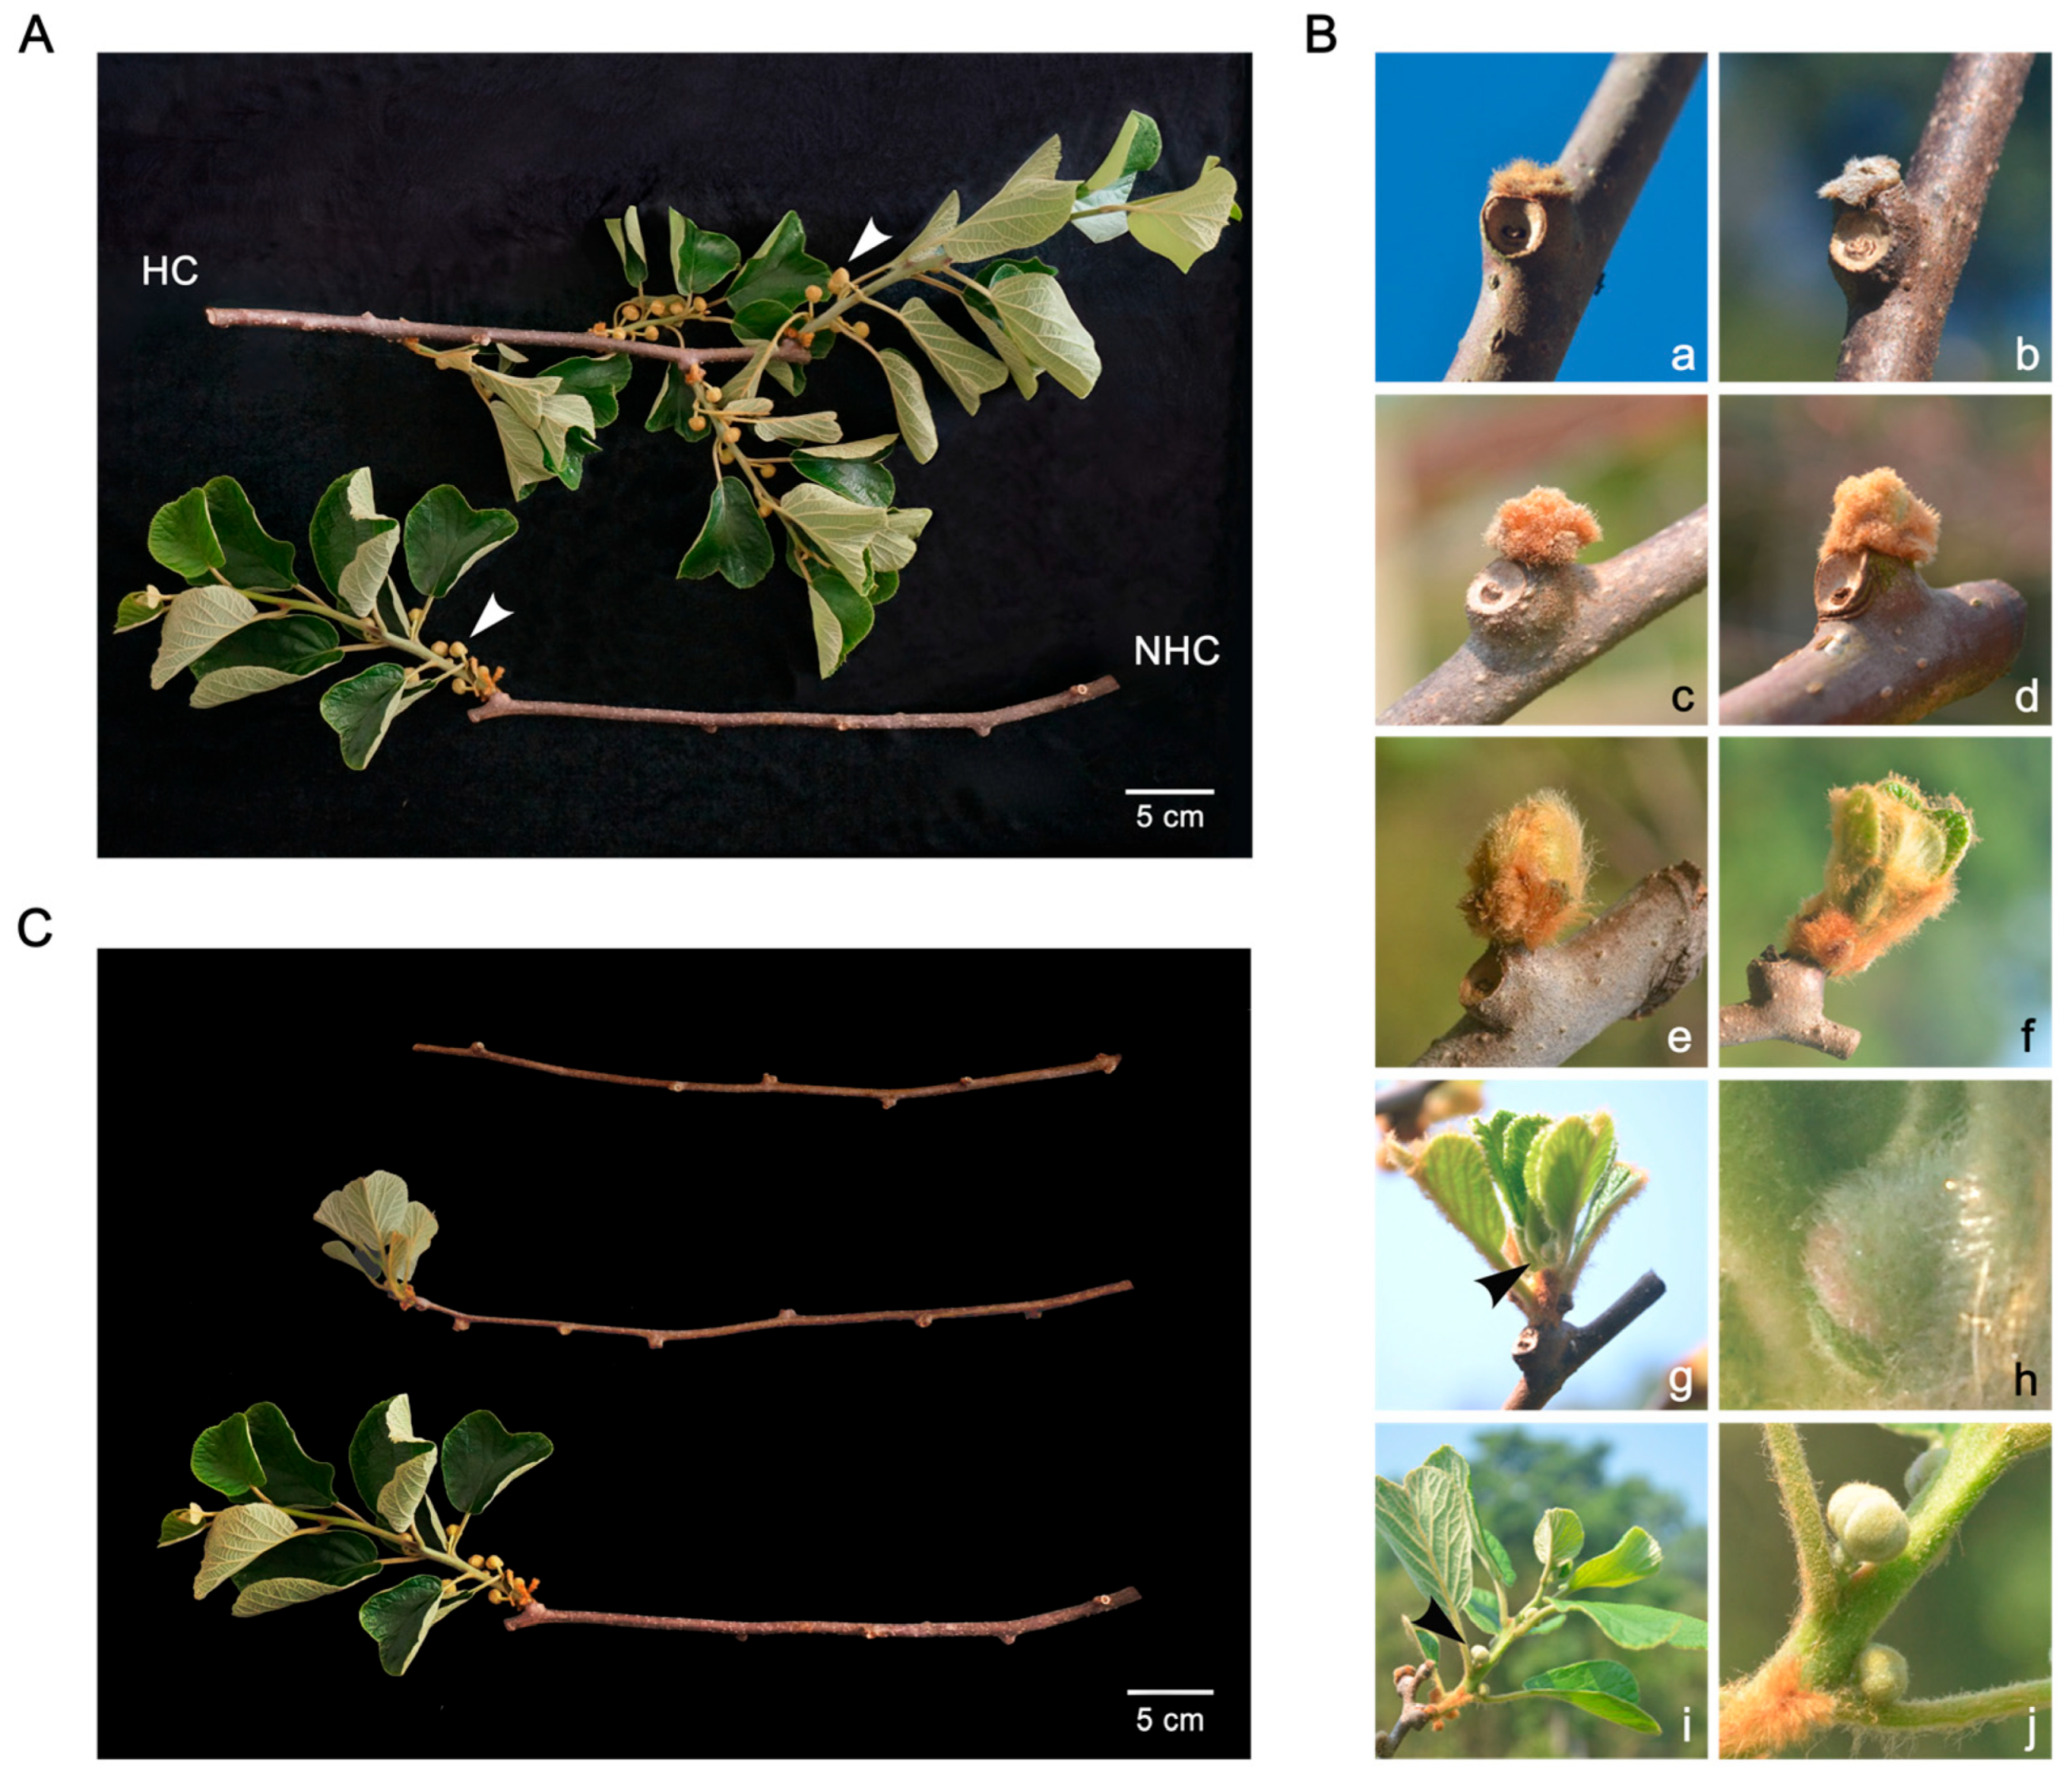
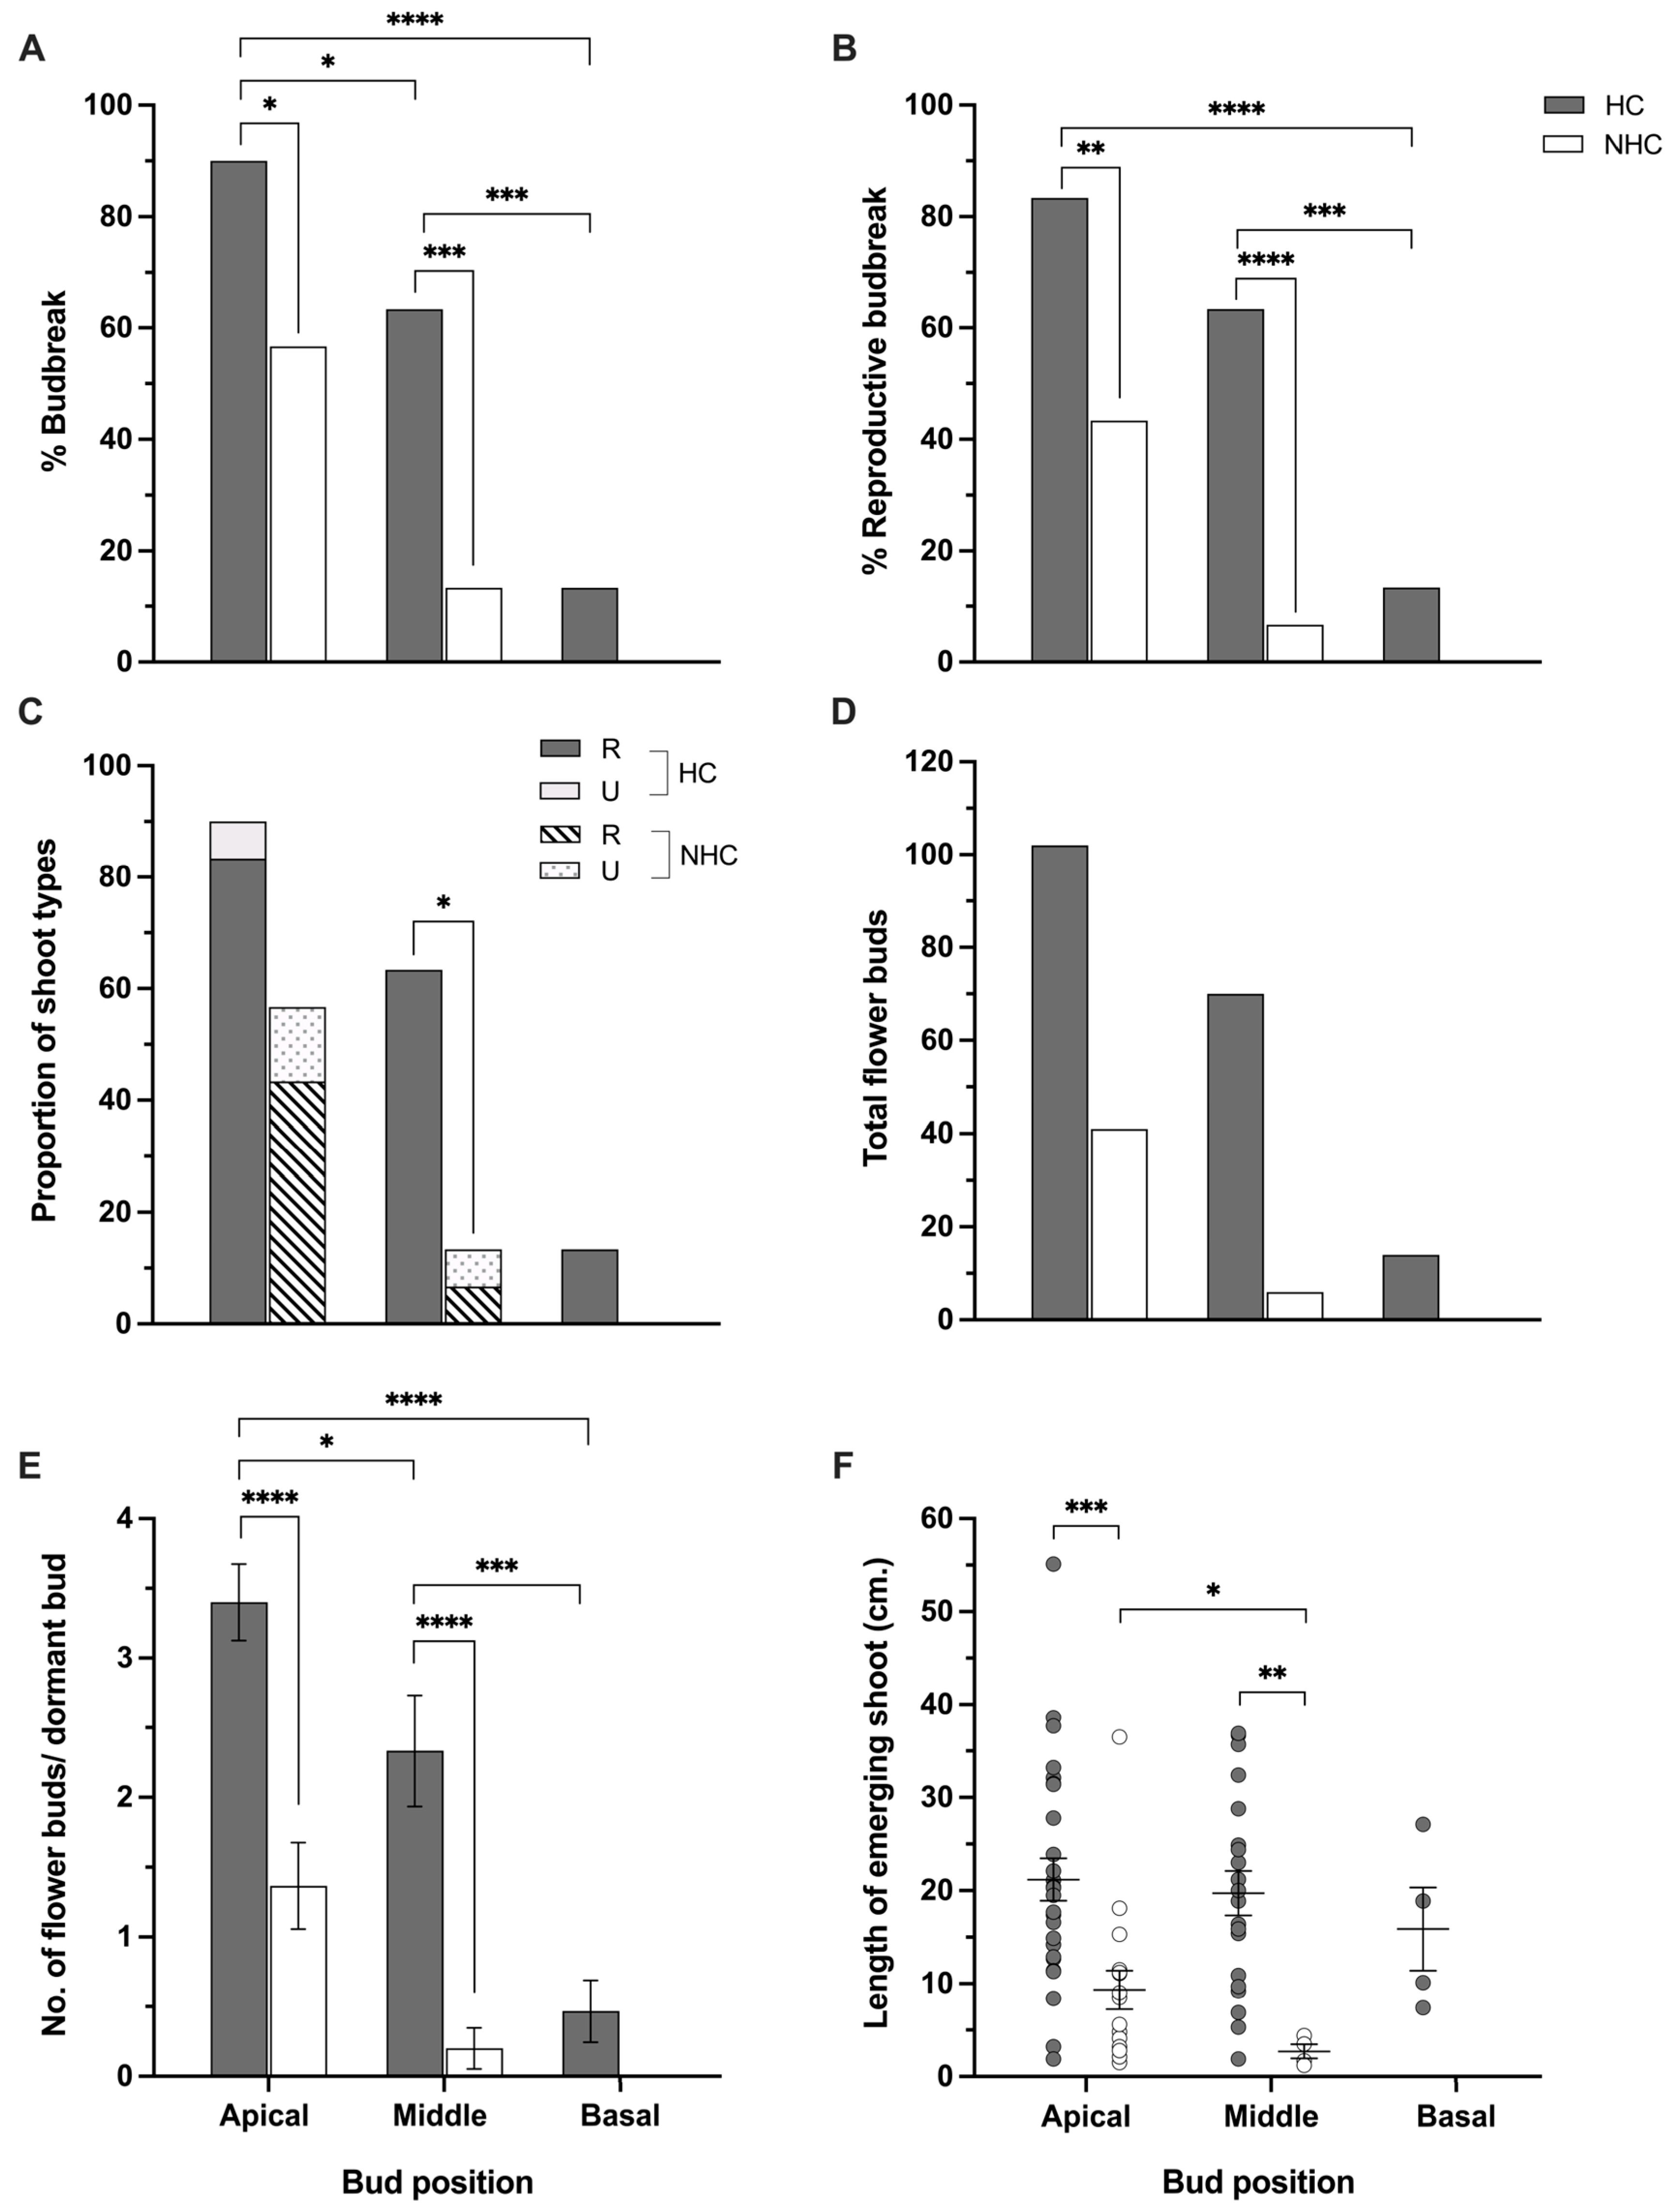
3.1. Budbreak and Phenological Development

Under highland tropical conditions, budbreak and subsequent growth development typically exhibited strong apical dominance, as illustrated in Figure 2C. This physiological response occurred under climatic conditions in which the average maximum, minimum, and mean temperatures during the 2017–2018 growing season were 22.4 °C, 10.2 °C, and 16.3 °C, respectively (Figure 3A), reflecting a noticeable increase compared to the corresponding averages of 21.9 °C, 9.3 °C, and 15.6 °C recorded in the previous decade. Under the warmer condition, approximately 350 chilling hours were accumulated in the highland tropical climate of Thailand (Figure 3B). At 28 DAT, the percentage of budbreak at the apical position of HC-treated canes reached 50%. Notably, advanced budbreak was observed at the apical and middle bud positions of HC-treated canes, corresponding to the open cluster and advanced budbreak stages, respectively (Figure 3C). Conversely, no signs of budbreak were detected at any bud position in the non-treated canes at this time point. By 55 DAT, field observations revealed that the highest percentage of budbreak occurred at the apical position, followed by middle and basal positions, respectively (Figure 4A). In non-treated canes, budbreak at the apical position reached nearly 56%, whereas only 13% was observed at the middle position, and no budbreak occurred at the basal position. In contrast, HC-treated canes exhibited approximately 90% budbreak at the apical position, followed by 63% at the middle and 13% at the basal position. Therefore, HC application significantly increased budbreak percentages by 58.82% and 375% at the apical and middle positions, respectively.
A similar trend was observed in the percentage of reproductive budbreak, total flower buds, and the number of flower buds per dormant bud (Figure 4B,C,E). At the apical position, HC-treated canes produced a total of 102 flower buds, representing an increase of 148.78% compared to the 41 buds observed in non-treated canes. An even greater response was observed at the middle position, where HC-treated canes developed 70 flower buds, corresponding to an increase of 1066.67% relative to the 6 buds recorded in non-treated canes. Additionally, unidentifiable shoots were notably observed in non-treated canes, especially at the middle positions (Figure 4C).
Furthermore, the emerging shoots in HC-treated canes were significantly longer than those in non-treated canes at all bud positions. However, the average of shoot lengths was not significantly different among bud positions in HC-treated canes (Figure 4F)

3.2. Biochemical Analysis

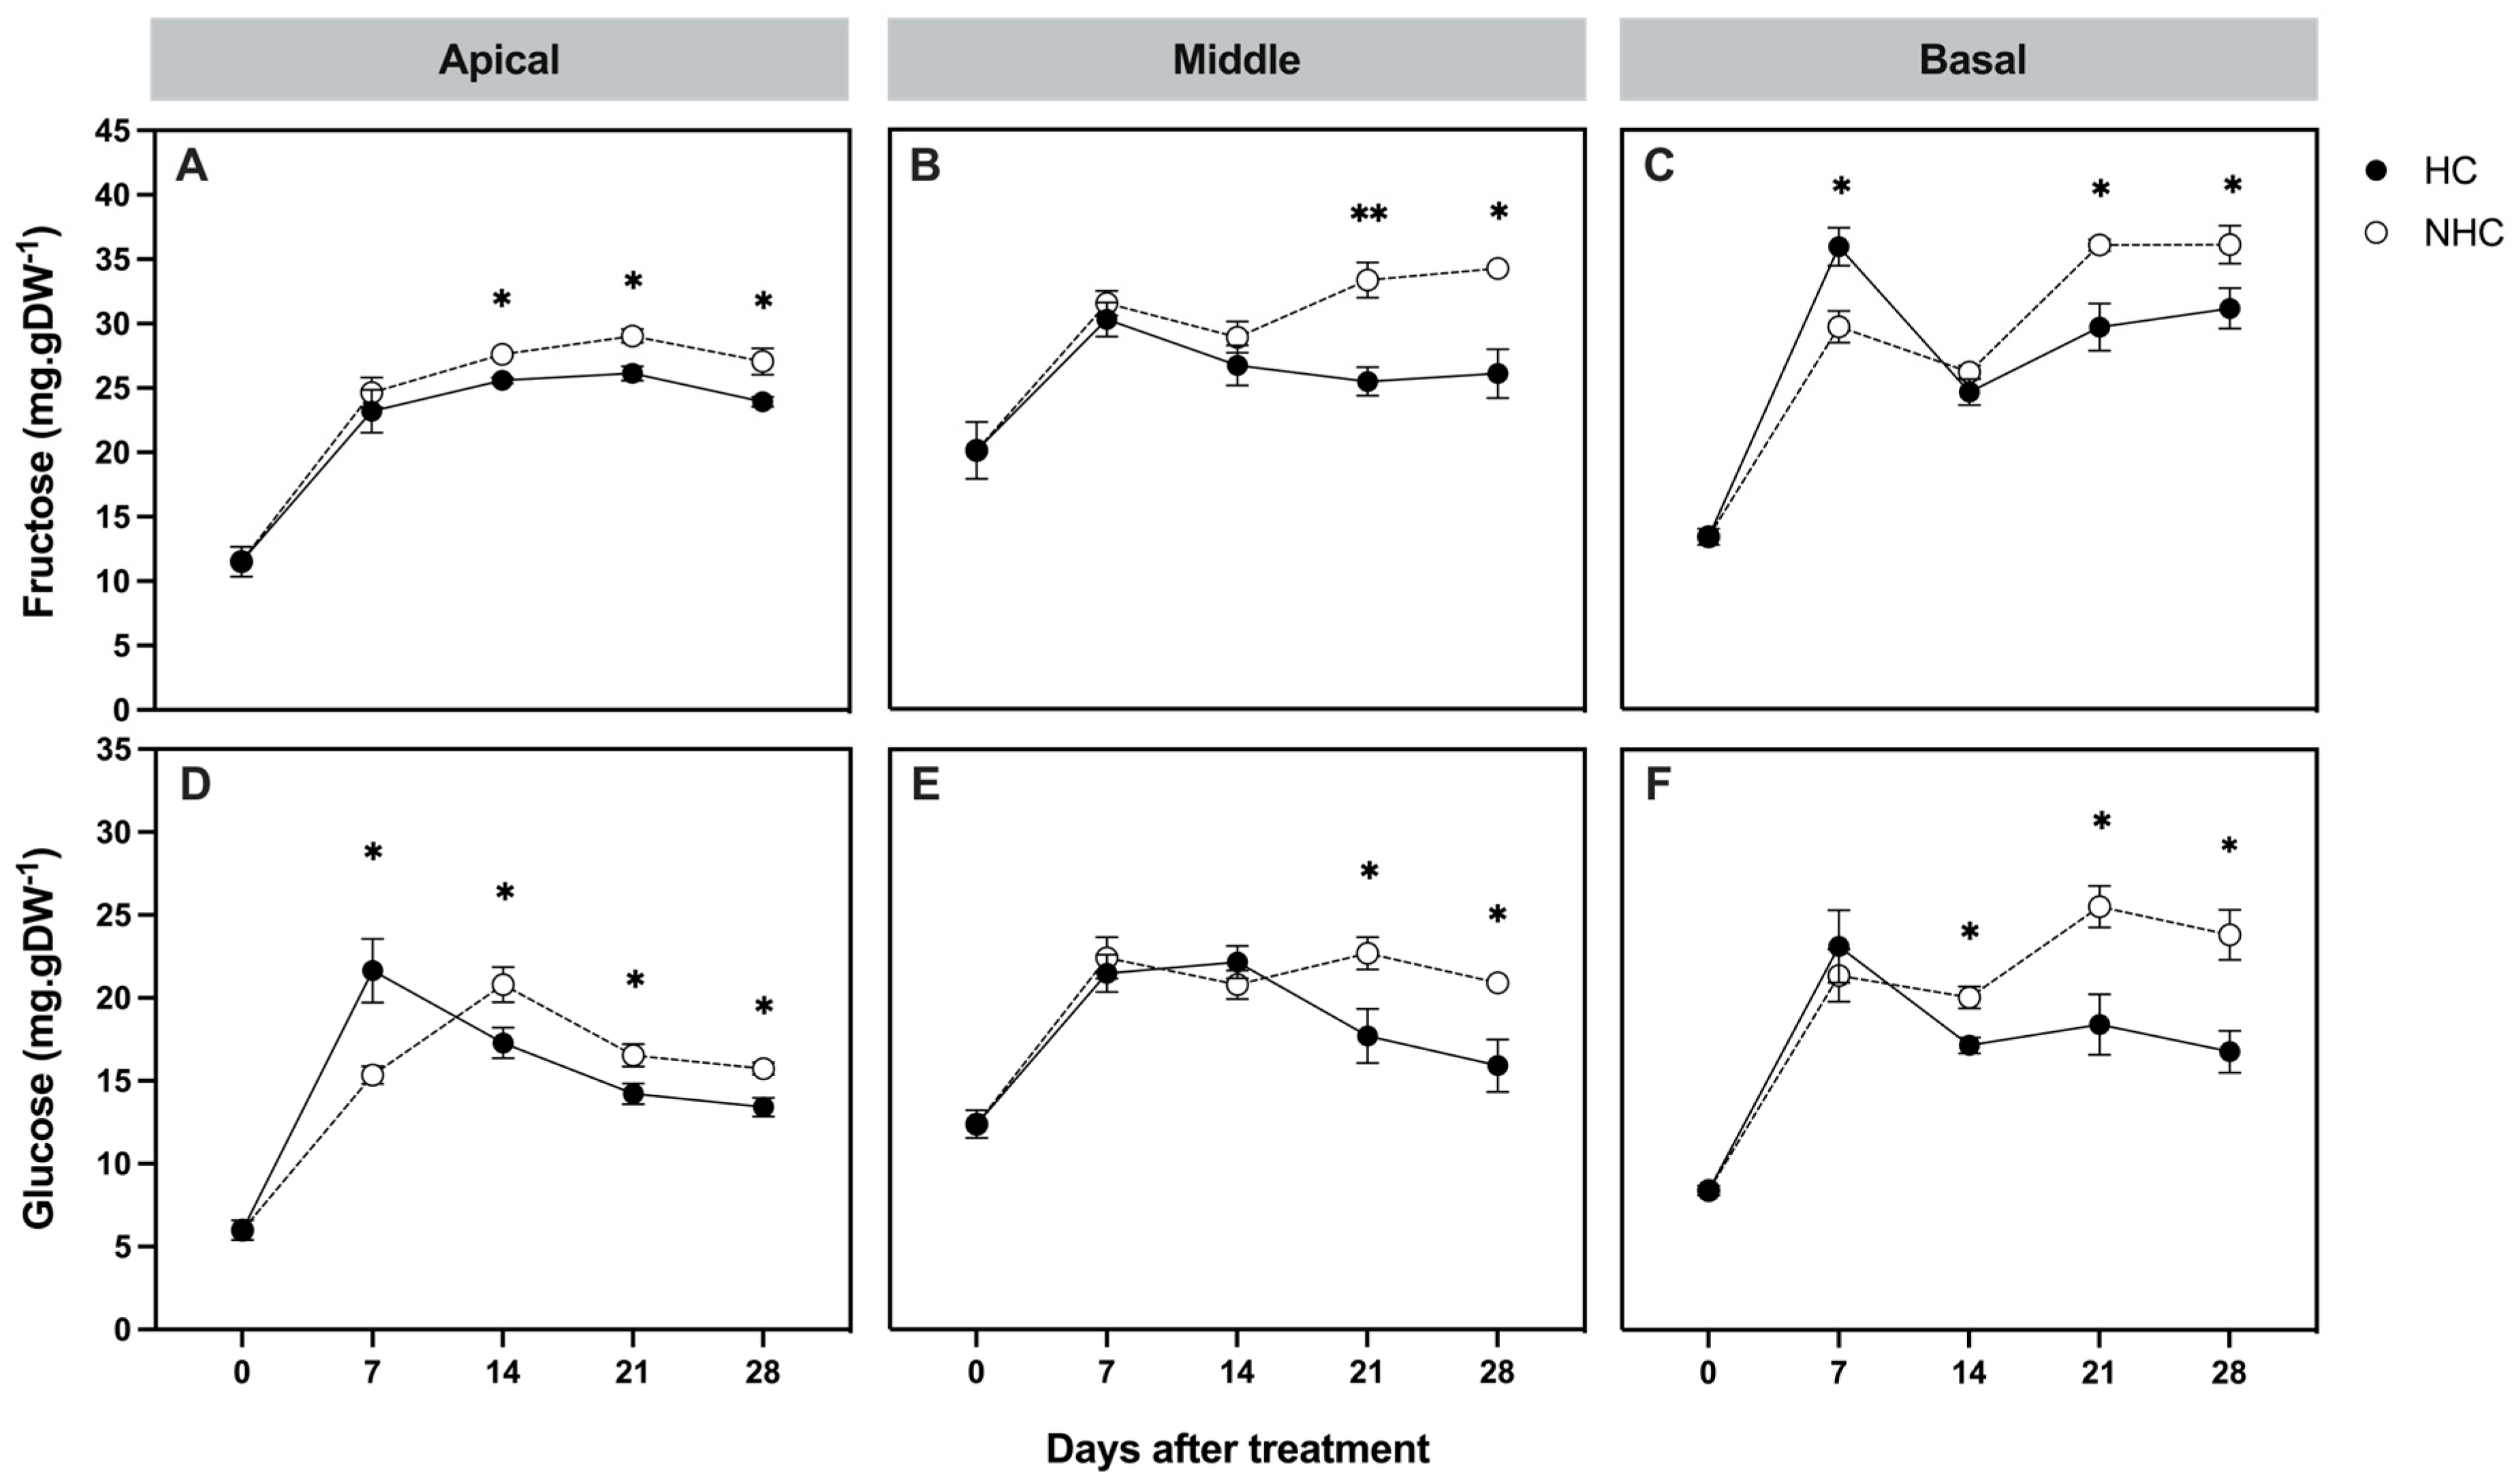
3.2.1. Non-Structural Carbohydrate Concentrations

Starch concentration in the bark tissue gradually decreased over the period prior to HC application at all bud positions, subsequently reaching the lowest levels between 7 and 14 DAT (Figure 5A–C). Following that period, starch concentration strongly increased and peaked at 28 DAT, particularly in HC-treated cane. Overall, the starch concentration dynamics were comparable in HC-treated and non-treated canes across bud positions. However, starch concentrations at the apical position were significantly lower in HC-treated canes from 7 to 14 DAT (Figure 5A). In contrast, starch concentrations at the middle and basal positions were significantly higher in HC-treated canes after 21 DAT and remained constantly higher until 28 DAT (Figure 5B,C). Moreover, the shift toward an increasing trend in starch concentration was observed earlier in HC-treated canes compared to non-treated canes.
Sucrose concentration continuously declined throughout the sampling period, showing a rapid drop at 7 DAT (Figure 5D–F). Interestingly, the lowest sucrose concentration was observed at the apical position in both treatments. When comparing treatments, sucrose concentration at the apical position of HC-treated canes remained notably lower from 7 to 21 DAT (Figure 5D). At the middle position, sucrose concentration was significantly higher in HC-treated canes at 7 DAT but subsequently declined sharply and remained lower than that in non-treated canes from 14 to 21 DAT (Figure 5E). A slight difference was observed between treatments at the basal position (Figure 5F).
Fructose concentration increased sharply at 7 DAT and remained relatively stable thereafter (Figure 6A–C), although a drastic decline was observed at 35 DAT (Figure S2). Glucose concentration exhibited a similar trend to that of fructose (Figure 6D–F). However, glucose concentration at the apical position of HC-treated canes showed an earlier decrease at 7 DAT, whereas the decline in non-treated canes was observed at 14 DAT (Figure 6D). Moreover, the decrease in glucose concentration at the apical position occurred prior to the changes observed at the other bud positions under the same treatment. In addition, both fructose and glucose concentrations were significantly lower at the apical position across treatments and were generally lower in the HC-treated canes compared to non-treated ones across all bud positions.

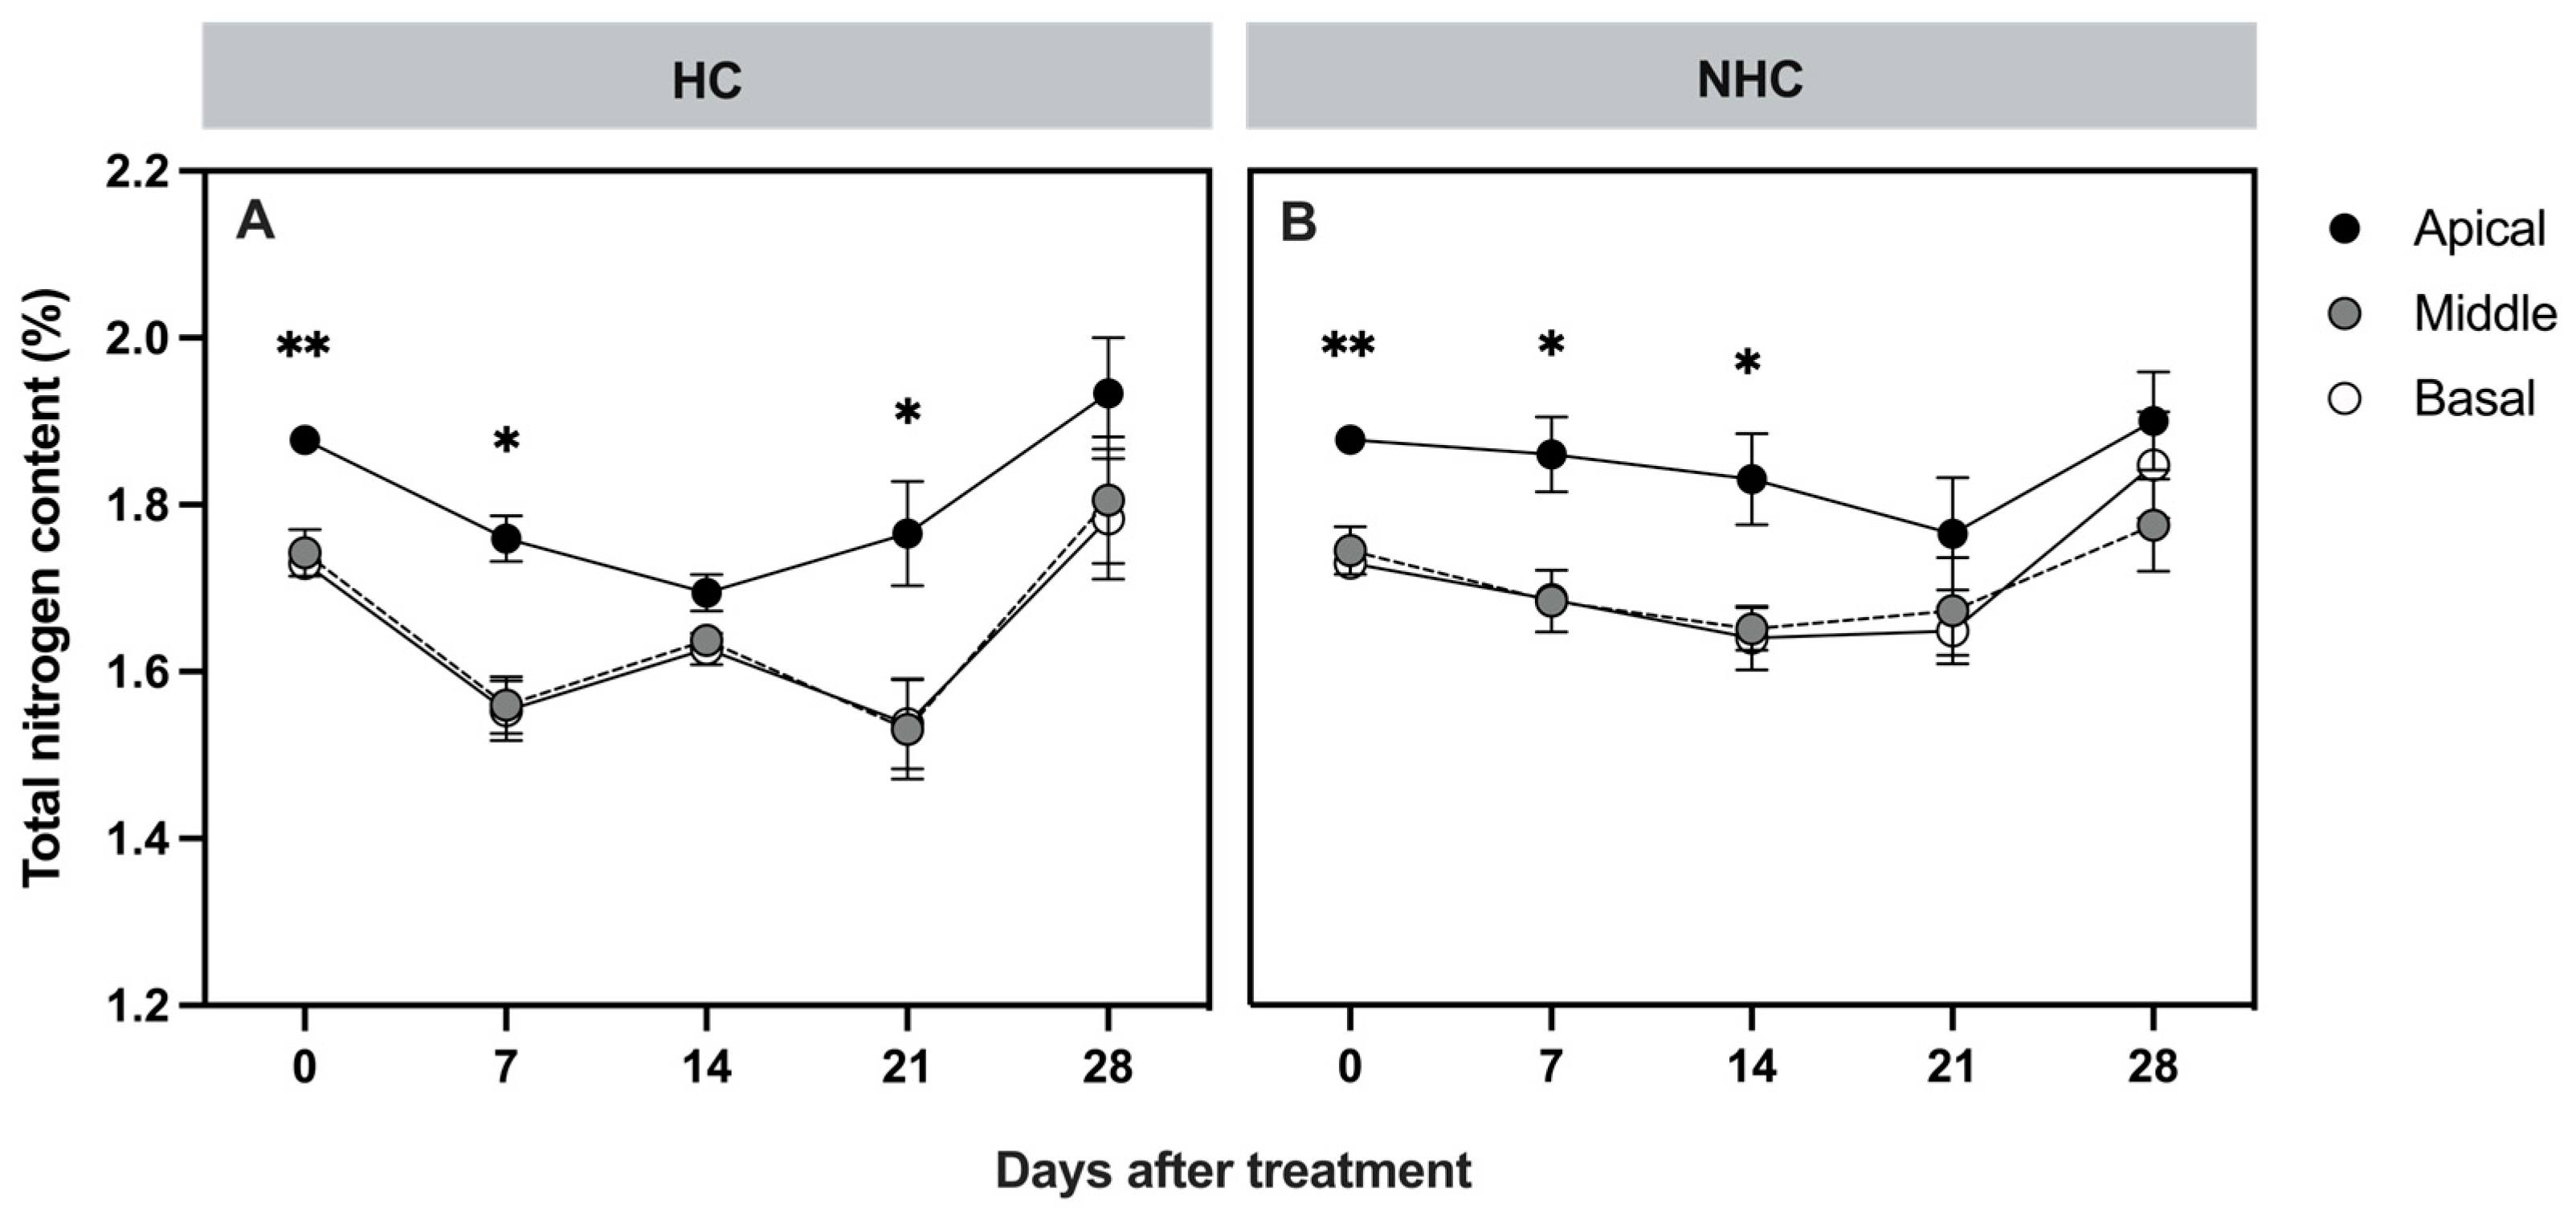
3.2.2. Total Nitrogen Content

The effects of HC application and bud position on total nitrogen contents in bark tissues are presented in Figure 7. Throughout the sampling period, total nitrogen contents at the apical position remained constantly higher than that at the middle and basal positions, which showed relatively similar levels in both treatments. In HC-treated canes, total nitrogen contents at the apical position gradually declined by approximately 10.1% from 0 to 14 DAT, followed by a steady increase until 28 DAT. In contrast, total nitrogen contents at the middle and basal positions fluctuated slightly between 7 and 21 DAT. In non-treated canes, nitrogen levels remained stable until 21 DAT, with a slight increase observed at 28 DAT across all bud positions.
Moreover, the carbon-to-nitrogen ratio (C–N ratio) showed a consistent downward trend throughout the sampling period at all bud positions in both treatments. When comparing treatments, only slight differences in the C–N ratio were observed at the apical and basal positions, whereas more pronounced differences were observed at the middle position at 7 DAT (Figure S3).

4. Discussion

In the highland tropical climate of Thailand, annual chilling accumulation is limited to a maximum of approximately 350 h, resulting in a severe chilling deficit under these conditions. Consequently, HC application has been implemented to alleviate this issue. Nevertheless, certain challenges remain, especially the issue of budbreak heterogeneity.
This study investigated the effects of HC on budbreak in low-chill kiwifruit under insufficient chilling conditions by correlating phenological responses with changes in carbohydrate and nitrogen concentrations in bark tissues across bud positions. Phenological observation revealed a high heterogeneity of budbreak among bud positions. Specifically, the apical position exhibited the highest budbreak percentage, followed by the middle position, whereas no visible growth was observed at the basal position in non-treated canes. These poor budbreak and strong apical dominance characteristics are a common response to insufficient chilling conditions in various deciduous fruit species, resulting in reduced productivity [35]. By contrast, HC-treated canes showed a significant increase in budbreak across all bud positions. The application of HC greatly enhanced budbreak percentage by approximately 58% and 375% at the apical and middle positions, respectively. Moreover, HC significantly increased the total flower buds across all bud positions, with particularly strong effects observed at the apical and middle positions. Total flower buds increased by 148.78% at the apical position and by 1066.67% at the middle position compared to non-treated canes. These findings are consistent with previous studies reporting that HC successfully enhances budbreak percentage and flower bud production in kiwifruit [8,11,31,36,37].
Unidentifiable shoots were distinctly observed in non-treated canes, indicating that developmental progression of non-treated buds remained at the early stage of bud emergence and shoot development. This progression was substantially slower compared to HC-treated buds. These results suggest that HC application also contributes to accelerated budbreak, consistent with findings from a previous study [31]. Notably, HC application also decreased the proportion of unidentifiable shoots at the apical and middle positions, further supporting HC role in promoting uniform bud development. Consequently, the timing of budbreak in non-treated canes was delayed until mid-summer, resulting in newly emerging shoots developing under high-temperature conditions. This increased the possibility of unidentifiable shoots differentiating into vegetative leafy shoots due to flower bud wilting and abortion. These observations align with those of a previous study [38], where warm temperature interference during chilling accumulation was found to reduce the average number of flowers in kiwifruit (A. deliciosa).
To examine the temporal heterogeneity of budbreak among different bud positions in response to HC application, the emerging shoot length was assessed. Under natural conditions, apical buds tended to emerge earlier and elongate more vigorously under high temperatures, exhibiting a distinct characteristic of apical dominance [8]. Similarly, this study found that shoot length varied significantly among bud positions in non-treated canes, with the longest shoots observed at the apical position, followed by the middle. In HC-treated canes, the shoot length remained relatively uniform across bud positions, suggesting that HC application effectively reduced the temporal heterogeneity of shoot development in this low-chill kiwifruit cultivar. A similar result was reported in apple cultivars, where HC application improved flowering uniformity under tropical conditions [39]. However, previous studies on ‘Hayward’, a high-chill-requiring kiwifruit cultivar, reported early shoot elongation and significantly greater shoot length at the apical position, even under HC treatment [8,40]. These findings indicate that HC application was insufficient to mitigate the strong apical dominance characteristic of high-chill cultivars under suboptimal chilling conditions.
Apical dominance has traditionally been attributed to the action of auxin, which promotes the vigorous growth of the terminal bud while suppressing the outgrowth of axillary buds located at lower nodes [41]. However, recent studies have expanded this understanding by emphasizing the role of sugars in modulating auxin-related apical dominance. Specifically, the strong sugar demand of the apical bud restricted sugar translocation to axillary buds, thereby inhibiting their outgrowth due to limited sugar availability [20]. When overall sugar status in the plant was high, increased sugar availability weakened apical dominance and promoted axillary bud outgrowth [22]. Elevated sugar availability, in combination with cytokinin, has been shown to significantly counteract the auxin-mediated inhibition of bud outgrowth by suppressing strigolactone signaling. Bud outgrowth is quantitatively regulated by the interplay among sugar availability, cytokinin activity, and auxin signaling trough strigolactone [22,42]. Further insight into the effects of specific soluble sugars revealed that sucrose, glucose, and fructose all triggered bud outgrowth and antagonized the effects of auxin and strigolactone, with glucose and fructose being more effective than sucrose [22].
Previous studies have reported that hydrogen cyanamide (HC) increases sugar availability by enhancing the activity of enzymes involved in sugar metabolism, thereby promoting the conversion of starch into soluble sugars [16,43,44]. Building upon this understanding, HC application may facilitate axillary budbreak and attenuate apical dominance in low-chill kiwifruit by stimulating sugar metabolic processes and increasing the availability of soluble sugars.
In kiwifruit cane, the reduction in starch concentration typically starts at budbreak and continues until anthesis [15]. In contrast, this study showed that the decline in starch concentration in the bark tissue was initiated prior to the determined time for HC application and continually progressed until the early sampling period The reduction in starch and sucrose concentrations coincided with a strong increase in fructose and glucose concentrations, suggesting the conversion of starch into soluble sugars, associated with the upregulation of amylolytic enzyme activity [16,17,43]. Interestingly, starch concentration in the bark tissue subsequently increased and peaked at budbreak. A similar pattern of starch accumulation was reported in peach buds prior to budbreak [45], and in cherry buds during the interval between ecodormancy release and the transition to blooming [19].
Sugars play an important role as signaling molecules in the regulation of bud development [46]. In kiwifruit, the concentration of sucrose in buds changes dynamically throughout the annual growth cycle, reflecting its involvement in developmental processes. Sucrose concentrations increase during leaf abscission in autumn, remain constantly high over winter, and decline sharply before budbreak [31]. This decrease in sucrose concentration indicates the release of endodormancy [19]. In this study, sucrose concentration also began to decrease before the determined time for HC application (Figure S1), suggesting that the process of bud endodormancy release had already been underway in the tropical highland environment.
There were differential hexose concentrations among bud positions in both HC-treated and non-treated cane. Interestingly, hexose concentrations were significantly lower at the apical position, with the lowest concentrations observed in HC-treated canes. This pattern differs from previous findings in walnut, where comparable hexose concentrations were reported in both apical and basal bark tissues [17], suggesting a more uniform distribution of hexose availability for budbreak across bud positions.
Although measurements of soluble sugars (sucrose and hexoses) concentration provided temporal snapshots of carbohydrates status, the actual rates of transportation or metabolic consumption was not deeply assessed. Consequently, the significantly lower soluble sugar levels observed under conditions of either the apical position or HC application merely indicates that fewer sugars remained in the sampled tissues at the time of analysis. We attributed this to the enhanced mobilization and consumption of soluble sugars for bud growth.
The enhanced mobilization of soluble sugars may involve enzymatic processes associated with sink activity. Cell-wall invertase plays a critical role in carbohydrate partitioning and sink-strength establishment by hydrolyzing sucrose into glucose and fructose. During budbreak, the elevated activity of cell-wall invertase strengthens the sink capacity in developing buds [16,43,45,47], facilitating the uptake of soluble sugars from surrounding tissues and consequently reducing local sugar concentrations. Consistent with this explanation, soluble sugar concentrations in internode tissues were significantly reduced following HC application in grapevine, coinciding with increased cell-wall invertase activity in the buds [43]. Furthermore, previous studies reported that sugar influx into bark tissues declined significantly [45] or remained substantially lower than that into developing buds during budbreak, with apical buds exhibiting markedly higher influx rates compared to basal buds [17]. This highlights the stronger sink activity of apical buds during the budbreak period.
The increased metabolic activation and sugar consumption involves the early and pronounced decrease in sucrose concentration, accompanied by a concurrent rise in hexose levels following HC application, indicating a key sign of metabolic reactivation associated with the resumption of bud growth in kiwifruit [31]. HC treatment enhanced sugar metabolism at the transcriptional level by upregulating key enzymes such as sucrose synthase, hexokinase, and amylases, which promoted early starch degradation and increased soluble sugar availability [44]. As a result, soluble sugar concentrations declined significantly and showed an earlier depletion pattern in HC-treated buds [43,44]. These findings suggest that HC application stimulated metabolic activity and enhanced early soluble sugar consumption for supporting bud growth.
The alternative explanation that carbohydrate reserves were initially low either at the apical position or before HC treatment seems unlikely. Specifically, soluble sugar measurements taken 25 days before HC treatment (DBT) revealed that sucrose concentrations were highest at the apical position (Figure S1), whereas hexose concentrations were relatively similar across all bud positions (Figure S2). These observations suggest that the significant differences in soluble sugar concentrations likely progressed following HC application or bud development rather than reflecting initial lower soluble sugar concentrations.
Taken together, this study demonstrated that significantly lower soluble sugar concentrations in bark tissues, observed under both apical positioning and HC application, were correlated strongly with increased budbreak percentage and total flower buds. These findings suggest that HC treatment may promote the rapid mobilization of soluble sugars toward developing buds, along with their early subsequent metabolic consumption. This sink-driven mobilization of carbohydrates may contribute to the depletion of soluble sugars in adjacent tissues such as bark, supporting energy supply and metabolic reactivation necessary for bud development and the initiation of budbreak.
In HC-treated canes, the decline in total nitrogen content in the bark tissues at the apical position during the early sampling period was likely attributable to the remobilization of stored nitrogen to support the development of emerging shoots [29]. Subsequently, total nitrogen content slightly increased during the budbreak period, aligning with trends previously reported in kiwifruit [15]. Among all bud positions, the apical position consistently exhibited the highest nitrogen levels in both HC-treated and non-treated canes. According to [29], the reduced accumulation of bark storage proteins (BSPs) was associated with limited early growth and delayed budbreak in poplar trees. Furthermore, elevated nitrogen concentrations, particularly in the form of ammonium and protein, have been associated with enhanced floral development in Prunus species [48]. In line with earlier studies, the current findings showed that higher total nitrogen content at the apical position was associated with significantly higher budbreak percentage and flower bud production. Moreover, total nitrogen content showed minimal differences between HC and non-treated canes across all bud positions, indicating that nitrogen content was not notably affected by HC application.
However, the high rate of nitrogen uptake and translocation occurred after budbreak in kiwifruit, suggesting nitrogen was essential and strongly associated in early shoot elongation and development [27,49]. The substantial nitrogen uptake and mobilization throughout the vine occurred simultaneously with the reduction in non-structural carbohydrate concentration in the bark tissue. Accordingly, the C–N ratio exhibited a decreasing trend throughout the sampling period, consistent with previous findings [15].
Under insufficient chilling conditions, HC application was effective in partially alleviating budbreak heterogeneity and mitigating the strong apical dominance characteristic of kiwifruit. However, HC alone may not be sufficient to fully overcome these physiological constraints. Enhanced sugar availability appears to play a crucial role in reducing apical dominance and promoting bud outgrowth, highlighting the importance of internal carbohydrate reserves in supporting dormancy release and subsequent growth. As climate change continues to exacerbate chilling deficits in subtropical and tropical regions, integrating strategic cultural practices that enhance carbohydrate assimilation and allocation will be essential for improving sugar status, sustaining uniform budbreak, and promoting resilient crop productivity.

5. Conclusions

Hydrogen cyanamide (HC) application significantly enhanced budbreak and total flower buds in low-chill kiwifruit under highland tropical conditions, particularly at the apical and middle bud positions. HC also reduced budbreak heterogeneity and contributed to more uniform shoot development. These phenological responses were correlated with the earlier decline in soluble sugar concentrations from apical to basal positions following HC treatment. In contrast, total nitrogen content was not notably affected by HC treatment but consistently remained highest at the apical position. Overall, these findings indicate that HC potentially improves budbreak by enhanced mobilization and consumption of soluble sugars for bud growth, thereby improving budbreak performance, flower bud production, and uniform shoot development in low-chill kiwifruit under warm conditions. This study provides a deeper understanding of the factors influencing budbreak in low-chill kiwifruit under warm conditions, supporting a potential strategy to mitigate the consequences of chilling insufficiency in subtropical climates.

Supplementary Materials

The following supporting information can be downloaded at: https://www.mdpi.com/article/10.3390/horticulturae11070847/s1, Figure S1: Changes in starch and sucrose concentrations at different bud positions from 25 DBT to 35 DAT following HC application; Figure S2: Changes in fructose and glucose concentrations at different bud positions from 25 DBT to 35 DAT following HC application.; Figure S3: Changes in the carbon to nitrogen ratio (C–N ratio) at different bud positions from 0 to 28 DAT following HC application.

Author Contributions

Conceptualization, A.P. and W.C.; investigation, W.C.; methodology, W.C.; formal analysis, W.C. and Y.J.; visualization, W.C.; writing—original draft preparation, W.C.; writing—review and editing, W.S., H.O., Y.J., and A.P.; supervision, A.P. and W.S., funding acquisition, A.P. All authors have read and agreed to the published version of the manuscript.

Funding

This research received no external funding.

Data Availability Statement

The data presented in this study are available on request from the corresponding author.

Acknowledgments

This project was financially supported by Royal project foundation and the thesis partially support scholarship from Mahidol University Graduate Alumni Association. We would like to express our sincere gratitude to Royal Agricultural Station, Angkhang for providing the experimental site, facilities and daily weather data. We gratefully acknowledge Nawarat Duangdee and Toonroey Malikaew for their assistance with field data collection, as well as to Natthawee Mabangkru for providing field weather data. We also extend our recognition to the staff of Royal Agricultural Station for their support in the chemical application and other cultural practices. We further express our appreciation to Sunipa Detpitthayanan, Nattawut Puakinsaeng, Nussara Putaporntip, and Chanakarn Sangsiri for their assistance in sample collection and technical support.

Conflicts of Interest

The authors declare no conflicts of interest.

Abbreviations

The following abbreviations are used in this manuscript:
HCHydrogen cyanamide
NSCsNon-structural carbohydrates
NNitrogen
CHChilling hours
PGOPeroxidase—glucose oxidase
RIRefractive index
DATDays after treatment
DBTDays before treatment

References

  1. Beauvieux, R.; Wenden, B.; Dirlewanger, E. Bud dormancy in perennial fruit tree species: A pivotal role for oxidative cues. Front. Plant Sci. 2018, 9, 657. [Google Scholar] [CrossRef] [PubMed]
  2. McPherson, H.G.; Stanley, C.J.; Warrington, I.J. The response of bud break and flowering to cool winter temperatures in kiwifruit (Actinidia deliciosa). J. Hortic. Sci. 1995, 70, 737–747. [Google Scholar]
  3. Morley-Bunker, M.J.; Salinger, M.J. Kiwifruit development: The effect of temperature on budburst and flowering. Weather Clim. 1987, 7, 26–30. [Google Scholar] [CrossRef]
  4. Salinger, M.J.; Kenny, G.J.; Morley-Bunker, M.J. Climate and kiwifruit cv. Hayward 1. Influences on development and growth. N. Z. J. Crop Hortic. Sci. 1993, 21, 235–245. [Google Scholar] [CrossRef]
  5. Nanninga, C.; Buyarski, C.R.; Pretorius, A.M.; Montgomery, R.A. Increased exposure to chilling advances the time to budburst in North American tree species. Tree Physiol. 2017, 37, 1727–1738. [Google Scholar] [CrossRef] [PubMed]
  6. Zhao, T.; Li, D.; Li, L.; Han, F.; Liu, X.; Zhang, P.; Zhong, C. The Differentiation of Chilling Requirements of Kiwifruit Cultivars Related to Ploidy Variation. HortScience 2017, 52, 1676–1679. [Google Scholar] [CrossRef]
  7. Kamyun, N.; Pichakum, A.; Bunwong, K.; Tiensuwan, M.; Moore, E.J. Development of Chill Unit Calculation for Peach ‘Jade’ Fruit Trees Grown in Northern Thailand. Acta Hortic. 2013, 1059, 147–154. [Google Scholar] [CrossRef]
  8. Pichakum, A.; Chaiwimol, W.; Meetam, M.; Songnuan, W. Responses of green kiwifruit grown in low-chill area to hydrogen cyanamide application. Acta Hortic. 2018, 1206, 97–103. [Google Scholar] [CrossRef]
  9. McPherson, H.G.; Hall, A.J.; Stanley, C.J. Seasonal and Regional Variation in Budbreak and Flowering of Kiwifruit Vines in New Zealand. N. Z. J. Crop Hortic. Sci. 1994, 22, 263–276. [Google Scholar] [CrossRef]
  10. Inglese, P.; Gullo, G.; Pace, L.S. Effect of cyanamide on budbreak and cane fruitfulness for ‘Hayward’ kiwifruit in relation to cane length and time of application. N. Z. J. Crop Hortic. Sci. 1998, 26, 45–53. [Google Scholar] [CrossRef]
  11. McPherson, H.G.; Richardson, A.C.; Snelgar, W.P.; Currie, M.B. Effects of hydrogen cyanamide on budbreak and flowering in kiwifruit (Actinidia deliciosa ’Hayward’). N. Z. J. Crop Hortic. Sci. 2001, 29, 277–285. [Google Scholar] [CrossRef]
  12. Powell, A.A.; David, G.H.; Tunnell, E. Effect of hydrogen cyanamide (Dormext) on replacing lack of chilling in kiwifruit (Actinidia deliciosa). Small Fruits Rev. 2000, 1, 79–92. [Google Scholar] [CrossRef]
  13. Richardson, A.C.; Dawson, T.E.; Hampton, R.E.; Blank, R.H. The effects of hydrogen cyanamide and mineral oil on kiwifruit performance. Proc. N. Z. Plant Prot. Conf. 1994, 47, 314–319. [Google Scholar] [CrossRef]
  14. Schuck, E.; Petri, J.L. The effect of concentrations and application of hydrogen cyanamide on kiwifruit dormancy breaking. Acta Hortic. 1995, 395, 177–184. [Google Scholar] [CrossRef]
  15. Smith, G.S.; Clark, C.J.; Boldingh, H.L. Seasonal accumulation of starch by components of the kiwifruit vine. Ann. Bot. 1992, 70, 19–25. [Google Scholar] [CrossRef]
  16. Ben Mohamed, H.; Vadel, A.M.; Geuns, J.M.C.; Khemira, H. Biochemical changes in dormant grapevine shoot tissues in response to chilling: Possible role in dormancy release. Sci. Hortic. 2010, 124, 440–447. [Google Scholar] [CrossRef]
  17. Bonhomme, M.; Peuch, M.; Ameglio, T.; Rageau, R.; Guilliot, A.; Decourteix, M.; Alves, G.; Sakr, S.; Lacointe, A. Carbohydrate uptake from xylem vessels and its distribution among stem tissues and buds in walnut (Juglans regia L.). Tree Physiol. 2009, 30, 89–102. [Google Scholar] [CrossRef] [PubMed]
  18. Chantuma, P.; Lacointe, A.; Kasemsap, P.; Thanisawanyangkura, S.; Gohet, E.; Clément, A.; Guilliot, A.; Ameglio, T.; Thaler, P. Carbohydrate storage in wood and bark of rubber trees submitted to different level of C demand induced by latex tapping. Tree Physiol. 2009, 29, 1021–1031. [Google Scholar] [CrossRef] [PubMed]
  19. Kaufmann, H.; Blanke, M. Changes in carbohydrate levels and relative water content (RWC) to distinguish dormancy phases in sweet cherry. J. Plant Physiol. 2017, 218, 1–5. [Google Scholar] [CrossRef] [PubMed]
  20. Mason, M.G.; Ross, J.J.; Babst, B.A.; Wienclaw, B.N.; Beveridge, C.A. Sugar demand, not auxin, is the initial regulator of apical dominance. Proc. Natl. Acad. Sci. USA 2014, 111, 6092–6097. [Google Scholar] [CrossRef] [PubMed]
  21. Kebrom, T.H. A growing stem inhibits bud outgrowth—The overlooked theory of apical dominance. Front. Plant Sci. 2017, 8, 1874. [Google Scholar] [CrossRef] [PubMed]
  22. Bertheloot, J.; Barbier, F.; Boudon, F.; Perez-Garcia, M.D.; Péron, T.; Citerne, S.; Dun, E.; Beveridge, C.; Godin, C.; Sakr, S. Sugar availability suppresses the auxin-induced strigolactone pathway to promote bud outgrowth. New Phytol. 2019, 225, 866–879. [Google Scholar] [CrossRef] [PubMed]
  23. Coleman, G.D. Physiology and regulation of seasonal nitrogen cycling in woody plants. J. Crop Improv. 2004, 10, 237–259. [Google Scholar] [CrossRef]
  24. Ledgard, S.F.; Smith, G.S. Fate of 15N-labelled nitrogen fertilizer applied to kiwifruit (Actinidia deliciosa) vines. Plant Soil 1992, 147, 59–68. [Google Scholar] [CrossRef]
  25. Walton, E.F.; Clark, C.J.; Boldingh, H.L. Effect of hydrogen cyanamide on amino acid profiles in kiwifruit buds during budbreak. Plant Physiol. 1991, 97, 1256–1259. [Google Scholar] [CrossRef] [PubMed]
  26. Cheng, L.; Fuchigami, L.H. Growth of young apple trees in relation to reserve nitrogen and carbohydrates. Tree Physiol. 2002, 22, 1297–1303. [Google Scholar] [CrossRef] [PubMed]
  27. Clark, C.J.; Ledgard, S.F. Uptake of 15N by kiwifruit vines from applications of nitrogen fertilizer prior to budbreak. Ann. Bot. 1993, 71, 311–316. [Google Scholar] [CrossRef]
  28. O’Kennedy, B.T.; Hennerty, M.J.; Titus, J.S. Changes in the nitrogen reserves of apple shoots during the dormant season. J. Hortic. Sci. 1975, 50, 321–329. [Google Scholar] [CrossRef]
  29. Li, G.; Lin, R.; Egekwu, C.; Blakeslee, J.; Lin, J.; Pettengill, E.; Coleman, G.D. Seasonal Nitrogen Remobilization and the Role of Auxin Transport in Poplar Trees. J. Exp. Bot. 2020, 71, 4512–4530. [Google Scholar] [CrossRef] [PubMed]
  30. Gomez, L.; Vercambre, G.; Jordan, M.O. Spatial-Temporal Management of Nitrogen and Carbon on the Peach Tree (Prunus persicae L. Batsch.). Sci. Hortic. 2020, 273, 109613. [Google Scholar] [CrossRef]
  31. Richardson, A.C.; Walton, E.F.; Meekings, J.S.; Boldingh, H.L. Carbohydrate changes in kiwifruit buds during the onset and release from dormancy. Sci. Hortic. 2010, 124, 463–468. [Google Scholar] [CrossRef]
  32. Brundell, D.J. Flower development of the Chinese gooseberry (Actinidia chinensis Planch.): I. Development of the flowering shoot. N. Z. J. Bot. 1975, 13, 473–483. [Google Scholar] [CrossRef]
  33. Weinberger, J. Chilling requirements of peach varieties. Proc. Am. Soc. Hortic. Sci. 1950, 56, 122–128. [Google Scholar]
  34. Bellasio, C.; Fini, A.; Ferrini, F. Evaluation of a high throughput starch analysis optimised for wood. PLoS ONE 2014, 9, e86645. [Google Scholar] [CrossRef] [PubMed]
  35. Erez, A. Bud Dormancy; Phenomenon, Problems and Solutions in the Tropics and Subtropics. In Temperate Fruit Crops in Warm Climates; Kluwer Academic Publishers: Dordrecht, The Netherlands, 2000; pp. 17–48. [Google Scholar] [CrossRef]
  36. Linsley-Noakes, G.C. Improving flowering of kiwifruit in climatically marginal areas using hydrogen cyanamide. Sci. Hortic. 1989, 38, 247–259. [Google Scholar] [CrossRef]
  37. Walton, E.F.; Fowke, P.J. Effect of hydrogen cyanamide on kiwifruit shoot flower number and position. J. Hortic. Sci. 1993, 68, 529–534. [Google Scholar] [CrossRef]
  38. Hartmann, T.P.; Spiers, J.D.; Stein, L.A.; Scheiner, J.J. Effect of warm temperature interruption on the accumulation of winter chilling in kiwifruit (Actinidia chinensis Planch. and A. deliciosa A. Chev.). HortScience 2024, 59, 691–698. [Google Scholar] [CrossRef]
  39. Jackson, J.E.; Bepete, M. The effect of hydrogen cyanamide (Dormex) on flowering and cropping of different apple cultivars under tropical conditions of sub-optimal winter chilling. Sci. Hortic. 1995, 60, 293–304. [Google Scholar] [CrossRef]
  40. Manson, P.J.; Snelgar, W.P.; Seelye, R.J. Relationships between timing of cane tipping and yield of kiwifruit (Actinidia deliciosa). J. Hortic. Sci. 1991, 66, 415–422. [Google Scholar] [CrossRef]
  41. Ongaro, V.; Leyser, O. Hormonal Control of Shoot Branching. J. Exp. Bot. 2008, 59, 67–74. [Google Scholar] [CrossRef] [PubMed]
  42. Cao, D.; Chabikwa, T.; Barbier, F.; Dun, E.A.; Fichtner, F.; Dong, L.; Kerr, S.C.; Beveridge, C.A. Auxin-Independent Effects of Apical Dominance Induce Changes in Phytohormones Correlated with Bud Outgrowth. Plant Physiol. 2023, 192, 1420–1434. [Google Scholar] [CrossRef] [PubMed]
  43. Ben Mohamed, H.; Vadel, A.M.; Geuns, J.M.C.; Khemira, H. Carbohydrate changes during dormancy release in Superior Seedless grapevine cuttings following hydrogen cyanamide treatment. Sci. Hortic. 2012, 140, 19–25. [Google Scholar] [CrossRef]
  44. Liang, D.; Huang, X.; Shen, Y.; Shen, T.; Zhang, H.; Lin, L.; Xia, H. Hydrogen Cyanamide Induces Grape Bud Endodormancy Release through Carbohydrate Metabolism and Plant Hormone Signaling. BMC Genom. 2019, 20, 1034. [Google Scholar] [CrossRef] [PubMed]
  45. Maurel, K.; Leite, G.B.; Bonhomme, M.; Guilliot, A.; Rageau, R.; Pétel, G.; Sakr, S. Trophic control of bud break in peach (Prunus persica) trees: A possible role of hexoses. Tree Physiol. 2004, 24, 579–588. [Google Scholar] [CrossRef] [PubMed]
  46. Roitsch, T.; González, M.C. Function and regulation of plant invertases: Sweet sensations. Trends Plant Sci. 2004, 9, 606–613. [Google Scholar] [CrossRef] [PubMed]
  47. Hubmann, A.M.; Roth, A.; Monschein, S. Breaking Buds—Stop and Go? Acid Invertase Activities in Apple Leaf Buds during Dormancy Release until Bud Break. Agronomy 2023, 13, 2659. [Google Scholar] [CrossRef]
  48. González-Rossia, D.; Reig, C.; Dovis, V.; Gariglio, N.; Agustí, M. Changes on carbohydrates and nitrogen content in the bark tissues induced by artificial chilling and its relationship with dormancy bud break in Prunus sp. Sci. Hortic. 2008, 118, 275–281. [Google Scholar] [CrossRef]
  49. Smith, G.S.; Buwalda, J.G.; Clark, C.J. Nutrient dynamics of a kiwifruit ecosystem. Sci. Hortic. 1988, 37, 87–109. [Google Scholar] [CrossRef]
Figure 1. Schematic diagram of experimental setup.
Horticulturae 11 00847 g001
Figure 2. Phenological development of buds and shoots of low-chill kiwifruit ‘Bruno’ under insufficient chilling condition. (A) Clear differences in budbreak pattern of HC-treated (HC) and non-treated canes (NHC). White arrows indicate visible flower buds. Scale bar = 5 cm. (B) Phenological development of buds in different stages; (a)—dormant bud (D), (b)—bud swell (BS), (c)—advanced bud swell (ABS), (d)—bud break (BB), (e)—advanced bud break (ABB), (f)—open cluster (OC), (g)—advanced open cluster (AOC), (h)—visible flower bud initiation observed in AOC stage, (i)—shoot elongation, (j)—distinct flower buds. Black arrows indicate visible flower buds. (C) Typical uneven budbreak pattern with a strong apical dominance under natural condition. Scale bar = 5 cm.
Horticulturae 11 00847 g002
Figure 3. Weather conditions and budbreak characteristics of low-chill kiwifruit ‘Bruno’ grown in a highland tropical climate in Thailand. (A) Daily temperatures recorded during the 2017–2018 season. The orange, green, and blue lines represent daily maximum, daily average, and daily minimum temperatures, respectively. The horizontal dotted line indicates the critical chilling threshold of 7.2 °C, and the shaded gray region below represents the temperature range (0 °C to 7.2 °C) used for chilling hour calculation. (B) Chilling accumulation calculated as the total hours of chilling exposure when temperatures were between 0 °C and 7.2 °C. The solid line marks the date of HC application, and the dashed line indicates the day on when 50% budbreak was observed at the apical position of HC-treated canes. (C) Examples of bud development under HC-treated (HC) and non-treated (NHC) conditions across different bud positions at 28 DAT. Bud developmental stages were defined as open cluster (OC), advanced bud burst (ABB), advanced bud swell (ABS), and bud swell (BS) [32]. Scale bar = 1 cm.
Horticulturae 11 00847 g003
Figure 4. Effect of HC on percentage of budbreak (A), percentage of reproductive budbreak and number (B), proportion of emerging shoot types (C)—reproductive shoots (R) and unidentifiable shoots (U)—total flower buds (D), number of flower buds per dormant bud (E), and length of emerging shoots (F) among bud positions. Closed bars or dots represent HC-treated buds, and open bars or dots represent non-treated buds. Bars and error bars indicate means and SEMs. Comparisons of percentage of budbreak, percentage of reproductive budbreak, and proportion of shoot types between treatments were performed using Fisher’s exact test. Comparisons of the number of flower buds per dormant bud and length of emerging shoots between treatments were performed using the Mann–Whitney U test. Statistically significant differences are indicated by asterisks: * (p < 0.05), ** (p < 0.005), *** (p < 0.001), and **** (p < 0.0001).
Horticulturae 11 00847 g004
Figure 5. Changes in starch (AC) and sucrose concentrations (DF) at different bud positions from day 0 to 28 DAT following HC application. Closed symbols represent HC-treated canes, and open symbols represent non-treated canes. Dots and error bars indicate means and SEMs of four replications. Comparisons of carbohydrate concentrations between treatments on each sampling day were analyzed by an independent-sample t-test. Statistically significant differences are indicated by asterisks: * (p < 0.05), ** (p < 0.005), and *** (p < 0.001).
Horticulturae 11 00847 g005
Figure 6. Changes in fructose (AC) and glucose concentrations (DF) at different bud positions from 0 to 28 DAT following HC application. Closed symbols represent HC-treated canes, and open symbols represent non-treated canes. Dots and error bars indicate means and SEMs of four replications. Comparisons of sugar concentrations between treatments on each sampling day were performed using independent-sample t-tests. Statistically significant differences are indicated by asterisks: * (p < 0.05), and ** (p < 0.005).
Horticulturae 11 00847 g006
Figure 7. Changes in total nitrogen content in HC-treated canes (A) and non-treated canes (B) among bud positions. Black, grey, and clear dots indicate the apical, middle, and basal positions, respectively. Dots and error bars represent means and SEMs of three replications. Comparisons of nitrogen concentration among bud positions on each sampling day were analyzed by a one-way ANOVA followed by Tukey’s multiple-comparison test. Statistically significant differences between the apical position and the lower bud positions are indicated by asterisks: * (p < 0.05), and ** (p < 0.005).
Horticulturae 11 00847 g007
Disclaimer/Publisher’s Note: The statements, opinions and data contained in all publications are solely those of the individual author(s) and contributor(s) and not of MDPI and/or the editor(s). MDPI and/or the editor(s) disclaim responsibility for any injury to people or property resulting from any ideas, methods, instructions or products referred to in the content.

