Article

Transcriptome Analysis Reveals Key Pathways and Candidate Genes for Resistance to Plasmodiophora brassicae in Radish

1
College of Horticulture and Landscape Architecture, Yangzhou University, Yangzhou 225009, China
2
National Key Laboratory of Crop Genetics & Germplasm Enhancement and Utilization, Key Laboratory of Horticultural Crop Biology and Genetic Improvement (East China) of MOAR, College of Horticulture, Nanjing Agricultural University, Nanjing 210095, China
*
Author to whom correspondence should be addressed.
These authors contributed equally to this work.
Horticulturae 2025, 11(7), 777; https://doi.org/10.3390/horticulturae11070777
Submission received: 15 May 2025 / Revised: 20 June 2025 / Accepted: 26 June 2025 / Published: 3 July 2025
(This article belongs to the Special Issue Biotic and Abiotic Stress Responses of Horticultural Plants)

Abstract

Clubroot disease, caused by the soil-borne pathogen Plasmodiophora brassicae, poses a severe threat to the global production of Brassicaceae crops, including radish (Raphanus sativus L.). Although resistance breeding is an important method for sustainable disease management, the molecular mechanism underlying clubroot resistance remains elusive in radish compared to other Brassicaceae species. In this study, 52 radish inbred lines were screened for disease responses following P. brassicae inoculation, with the resistant line T6 and the susceptible line T14 selected for transcriptome analysis. RNA-Seq was performed at 10, 20, and 30 days post inoculation (DPI) to elucidate transcriptional responses. The susceptible line T14 exhibited a higher number of differentially expressed genes (DEGs) and persistent upregulation across all time points, indicating ineffective defense responses and metabolic hijacking by the pathogen. In contrast, the resistant line T6 displayed temporally coordinated defense activation marked by rapid induction of core immune mechanisms: enhanced plant–pathogen interaction recognition, MAPK cascade signaling, and phytohormone transduction pathways, consistent with effector-triggered immunity priming and multilayered defense orchestration. These findings indicate that resistance in T6 could be mediated by the rapid activation of multilayered defense mechanisms, including R gene-mediated recognition, MAPK-Ca2+-ROS signaling, and jasmonic acid (JA) pathway modulation. The outcomes of this study would not only facilitate clarifying the molecular mechanism underlying clubroot resistance, but also provide valuable resources for genetic improvement of clubroot resistance in radish.

1. Introduction

Radish (Raphanus sativus L.), a member of the Brassicaceae family, is an economically significant vegetable crop cultivated globally, particularly in Asian agroecosystems [1]. As a versatile crop, various radish types contribute substantially to global vegetable production and agricultural economies [2]. Nutritionally, radish is recognized as an essential component of human diets due to its high dietary fiber content, abundance of water-soluble vitamins (such as vitamin C), and valuable mineral profiles, including potassium and calcium [3,4]. Beyond basic nutrition, radish roots and leaves contain various bioactive compounds, notably glucosinolates and phenolic compounds, which are associated with antioxidant and health-promoting properties [5,6,7]. Furthermore, Semen Raphani, recorded in the Chinese Pharmacopoeia (2015 edition), consists of the dried seeds of radish, with therapeutic applications for digestive ailments, including indigestion and gastric pains [8]. Otherwise, the radish is also used as a household remedy for gallstones, liver diseases, rectal prolapse, and other diseases in Unani, Greco-Arabic, and Indian medicine [9]. Therefore, radish holds an important position in human livelihoods due to its multifaceted roles in dietary nutrition, therapeutic applications, and agricultural systems.
Despite its agronomic and medicinal importance, radish production faces a critical threat from clubroot disease, caused by the obligate biotrophic plasmodiophorid protist P. brassicae [10,11]. This pathogen exhibits a complex life cycle involving the primary infection of root hairs and secondary infection of the root cortex, leading to the characteristic gall formation, and produces highly persistent resting spores that can remain viable in soil for over a decade, making eradication extremely difficult [12,13]. The historical origins of clubroot can be traced back to its initial identification on the west coast of the Mediterranean Sea in 1737 [14]. Subsequently, this pathogenic agent has disseminated globally, especially exhibiting a particular affinity for temperate regions and locations characterized by weakly acidic soils [15]. Moreover, the intensified and continuous cultivation practices applied to Brassicaceae crops have accelerated the widespread dissemination of clubroot, transforming it into a profoundly impactful soil-borne disease on a global scale [16]. Clubroot induces large root galls that impair plant growth and reduce both the yield and quality of economically important crops such as Chinese cabbage, cabbage, rapeseed, and radish. For instance, in Canada in 2005, canola yield losses reached as high as 50%, while annual yield losses of 20–30% have been reported for Brassicaceae crops in China [17,18]. Beyond yield implications, clubroot exerts a discernible influence on crop quality, with documented reductions in seed oil content by 2–6% in oil crops [19]. The persistent nature of P. brassicae resting spores in soil poses a long-term challenge for sustainable agriculture, demanding effective and durable management strategies.
Currently, managing clubroot disease remains a significant challenge in Brassicaceae crops. Traditional methods such as crop rotation have limited efficacy due to the longevity of resting spores [20]. Soil pH adjustment through liming can reduce disease severity, but it is not always practical or sufficient. Chemical control using fungicides has shown limited success and raises environmental concerns [21]. Consequently, developing and cultivating clubroot-resistant cultivars is considered the most effective strategy for preventing and controlling this devastating disease. In recent years, significant progress has been made in identifying and mapping clubroot resistance (CR) genes/loci in several Brassica species. Numerous quantitative trait loci (QTLs) and resistance genes, such as CRa, CRb, and WeiTsing, have been characterized in Brassica rapa (Chinese cabbage, turnip) and Brassica oleracea (cabbage, broccoli, cauliflower), providing valuable resources for resistance breeding in these crops [22,23,24,25,26]. However, compared to these species, the molecular basis of clubroot resistance in radish remains poorly understood. Although several QTLs (e.g., Crs1, RsCr6) [27,28,29] have been identified, the functional genes conferring resistance have yet to be characterized, which limits the application of marker-assisted selection and gene editing in resistance breeding.
RNA-Seq has emerged as a powerful tool to systematically investigate gene expression dynamics during plant–pathogen interactions. Transcriptomic analysis enables the identification of DEGs and regulatory networks activated upon pathogen infection, thereby providing insights into resistance mechanisms and candidate resistance genes. In the context of plant immunity, key defense responses are often associated with the activation of specific metabolic and signaling pathways. Notably, the plant–pathogen interaction pathway, MAPK cascades, and plant hormone signaling are critical in initiating and coordinating immune responses [30,31]. Additionally, secondary metabolic pathways such as the phenylpropanoid biosynthesis pathway contribute to cell wall reinforcement and the synthesis of antimicrobial compounds [32,33], while calcium signaling and reactive oxygen species production further mediate rapid local defense responses [34,35]. In this study, we performed a comparative transcriptomic analysis of resistant (T6) and susceptible (T14) radish inbred lines at three time points following inoculation with P. brassicae. By characterizing global gene expression profiles and enriched pathways, this study aimed to uncover the molecular basis of clubroot resistance in radish and to identify key genes and regulatory mechanisms involved in defense responses. These findings provide valuable insights into the molecular basis of clubroot resistance in radish and lay the foundation for the genetic improvement in radish breeding programs.

2. Materials and Methods

2.1. Plant Materials and P. brassica Inoculation

Totally, 52 inbred lines collected from our laboratory germplasm repository were selected for clubroot resistance evaluation. Ten plants per line were grown in 50-well plastic trays filled with a sterilized growing medium consisting of vermiculite, peat moss, and soil in a 1:1:1 ratio. The plants were maintained in a controlled growth chamber at 25/20 °C (day/night) with a 16/8 h photoperiod. The investigation of clubroot disease was carried out 4 weeks post-inoculation. The pathogen isolation protocol, inoculation methodology, and disease index (DI) calculation for P. brassicae suspension preparation followed established procedures described in the previous study [28]. Briefly, the concentration of resting spores was determined using a hemocytometer and adjusted to 1 × 10⁷ spores/mL for inoculation. Ten days after sowing, each seedling was inoculated by injecting 1 mL of the spore suspension into the soil near the root. The disease index (DI) was assessed four weeks post-inoculation based on a 0–4 scale as follows: 0, no galling; 1, a few small galls on lateral roots; 2, moderate galling on lateral roots or main root; 3, numerous galls on the main roots; and 4, clubroot rot or plant death.
To elucidate the molecular mechanisms underlying clubroot resistance following P. brassicae inoculation in radish, transcriptome analysis was performed. Based on the initial screening, lines exhibiting contrasting phenotypes (susceptible and resistant) were selected for further analysis. The experimental design included parallel treatments where both resistant and susceptible lines were inoculated with P. brassicae at 10 days post-sowing, with corresponding mock controls treated with distilled water. To systematically capture the molecular responses during disease progression and resistance activation, a total of 36 root samples were collected from susceptible and resistant lines at 10, 20, and 30 DPI following either pathogen inoculation or mock treatment. Each sample consisted of three roots pooled from three plants. Three independent biological replicates were included for each treatment (inoculated and mock-inoculated) and each time point. All samples were immediately immersed in liquid nitrogen and stored at −80 °C until further processing for RNA extraction and sequencing or RT-qPCR analysis.

2.2. RNA Extraction and Sequencing

Total RNAs for transcriptome sequencing were extracted using the Eastep® Super Total RNA Extraction Kit (Promega Co., Ltd., Shanghai, China) following the manufacturer’s protocol. For transcriptome sequencing, mRNA was purified from total RNA using poly-T oligo-attached magnetic beads. The purified mRNA was then fragmented and used as a template for first-strand cDNA synthesis with random hexamer primers, followed by second-strand cDNA synthesis. The resulting cDNA fragments were subjected to end-repair, A-tailing, and adapter ligation. After PCR amplification, the final cDNA libraries were constructed. The library construction and sequencing were performed by Annaroad Gene Technology Co., Ltd. (Beijing, China) on an Illumina NovaSeq 6000 platform, generating 150 bp paired-end reads.

2.3. Analysis of the RNA-Seq Data

Raw sequencing data underwent FastQC (v0.11.9) [36] quality evaluation, examining per-base scores, adapter content, and duplication rates. Filtering via fastp (v0.23.2; defaults) [37] included trimming low-quality bases (Q < 20), removing adapters, and discarding reads <36 bp, producing clean reads validated through post-filtering FastQC. Using HISAT2 (v2.2.1) [38], processed reads were aligned to the radish genome [39], generating BAM-formatted alignments. Gene quantification was performed using featureCounts (v2.0.1; Subread) [40] with GTF annotations. FPKM normalization was used to compensate for variations in transcript length and sequencing depth. DEGs were identified using DESeq2 (v1.34.0) [41] with a negative binomial model (|log2FC| ≥ 1, adjusted q ≤ 0.05). KEGG pathway analysis was performed using clusterProfiler (v4.2.2) [42] with functional enrichment adjusted by the Benjamini–Hochberg correction.

2.4. Real-Time qPCR Analysis

To evaluate the accuracy of transcriptome data, quantitative RT-qPCR analyses were performed. The RT-qPCR primers were designed based on the available radish sequence information (Supplementary Table S1). The RT-qPCR analysis was performed using the CFV96™ Real-Time System (Bio-Rad, Berkeley, CA, USA) and the SYBR Green Supermix (Transgen, Beijing, China). The PCR program was as follows: 95 °C for 3 min, 39 cycles of 95 °C for 15 s, and 58 °C for 20 s. Data were acquired during the annealing/extension step and were analyzed using the CFX Manager software (version 2.1) (Bio-Rad). Three replicates of each sample were analyzed, and mean gene expression levels were normalized against 18S rRNA levels.

3. Results

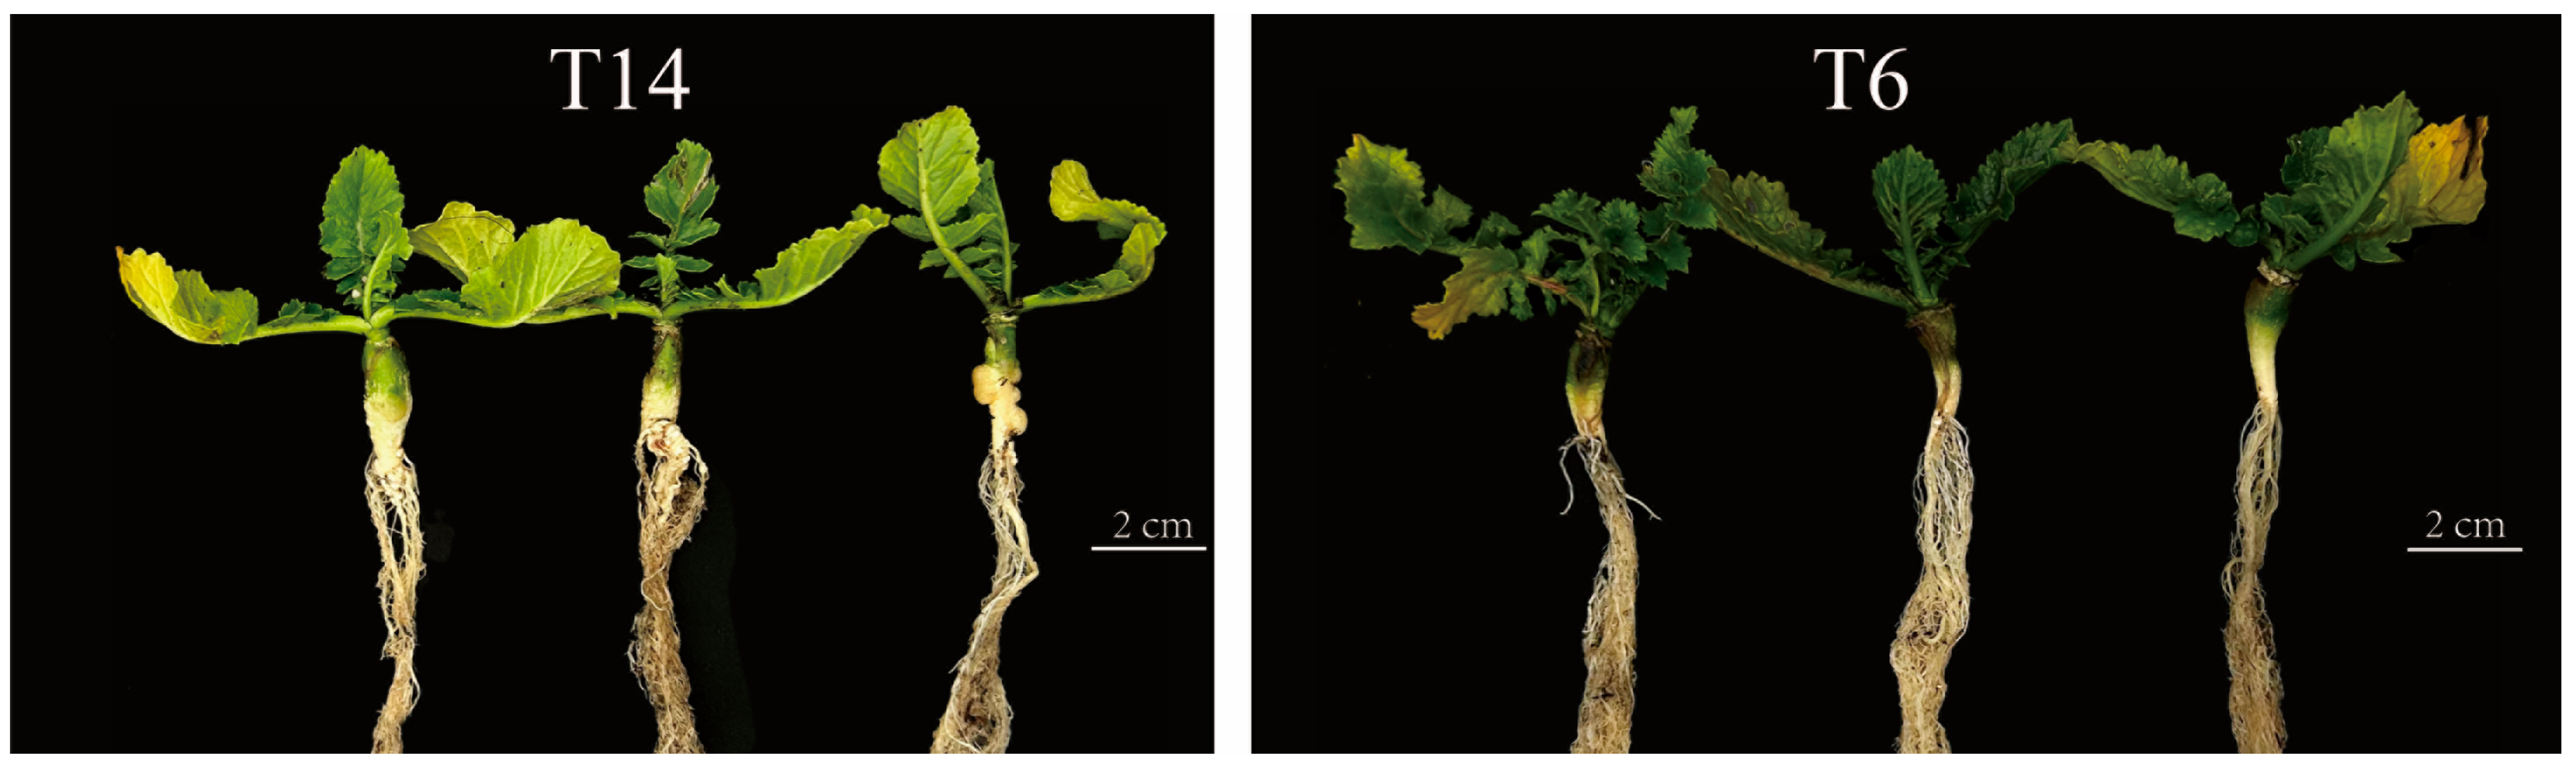
3.1. The Investigation of the Resistance to P. brassicae in 52 Radish Lines

Based on the phenotypic evaluation of clubroot resistance (Table 1), six radish lines (T6, T11, T30, T35, YZ-8, and YZ-11) were identified as completely resistant, as they exhibited normal growth without any clubroot symptoms. In contrast, seven lines (T7, T8, T14, YZ-6, YZ-18, YZ-20, and YZ-21) displayed severe clubroot symptoms, including extensive galling on both taproots and lateral roots, stunted plant growth, and leaf yellowing, and were classified as completely susceptible. The remaining 39 lines showed intermediate levels of susceptibility, with varying degrees of root galling and reduced growth compared to the control. To investigate the molecular mechanisms underlying clubroot resistance, lines T6 and T14 (Figure 1), representing the resistant and susceptible phenotypes, respectively, were selected for further transcriptome analysis.

3.2. Sequencing Data Analysis

To obtain a global view of the transcriptomic changes of the radish plants in response to P. brassica infection, the expression profiles of pathogen-infected radish samples were compared to those of the mock-inoculated control plants by high-throughput sequencing. The RNA-Seq generated between 43,088,690 and 49,731,344 raw reads for the P. brassicae infected group and between 42,013,050 and 49,757,114 raw reads for the control group. Following the removal of low-quality reads and adapter sequences, the number of clean reads ranged from 40,728,900 to 47,626,288 in the infected group and from 43,233,294 to 47,710,712 in the control group (Supplementary Table S2). Alignment of these clean reads to the radish reference genome yielded mapping percentages between 92.63% and 95.81% for the infected group and between 92.61% and 97.61% for the control group. The RNA-Seq data have been deposited in the Genome Sequence Archive (GSA) of the National Genomics Data Center (NGDC) under the project accession number PRJCA030868.

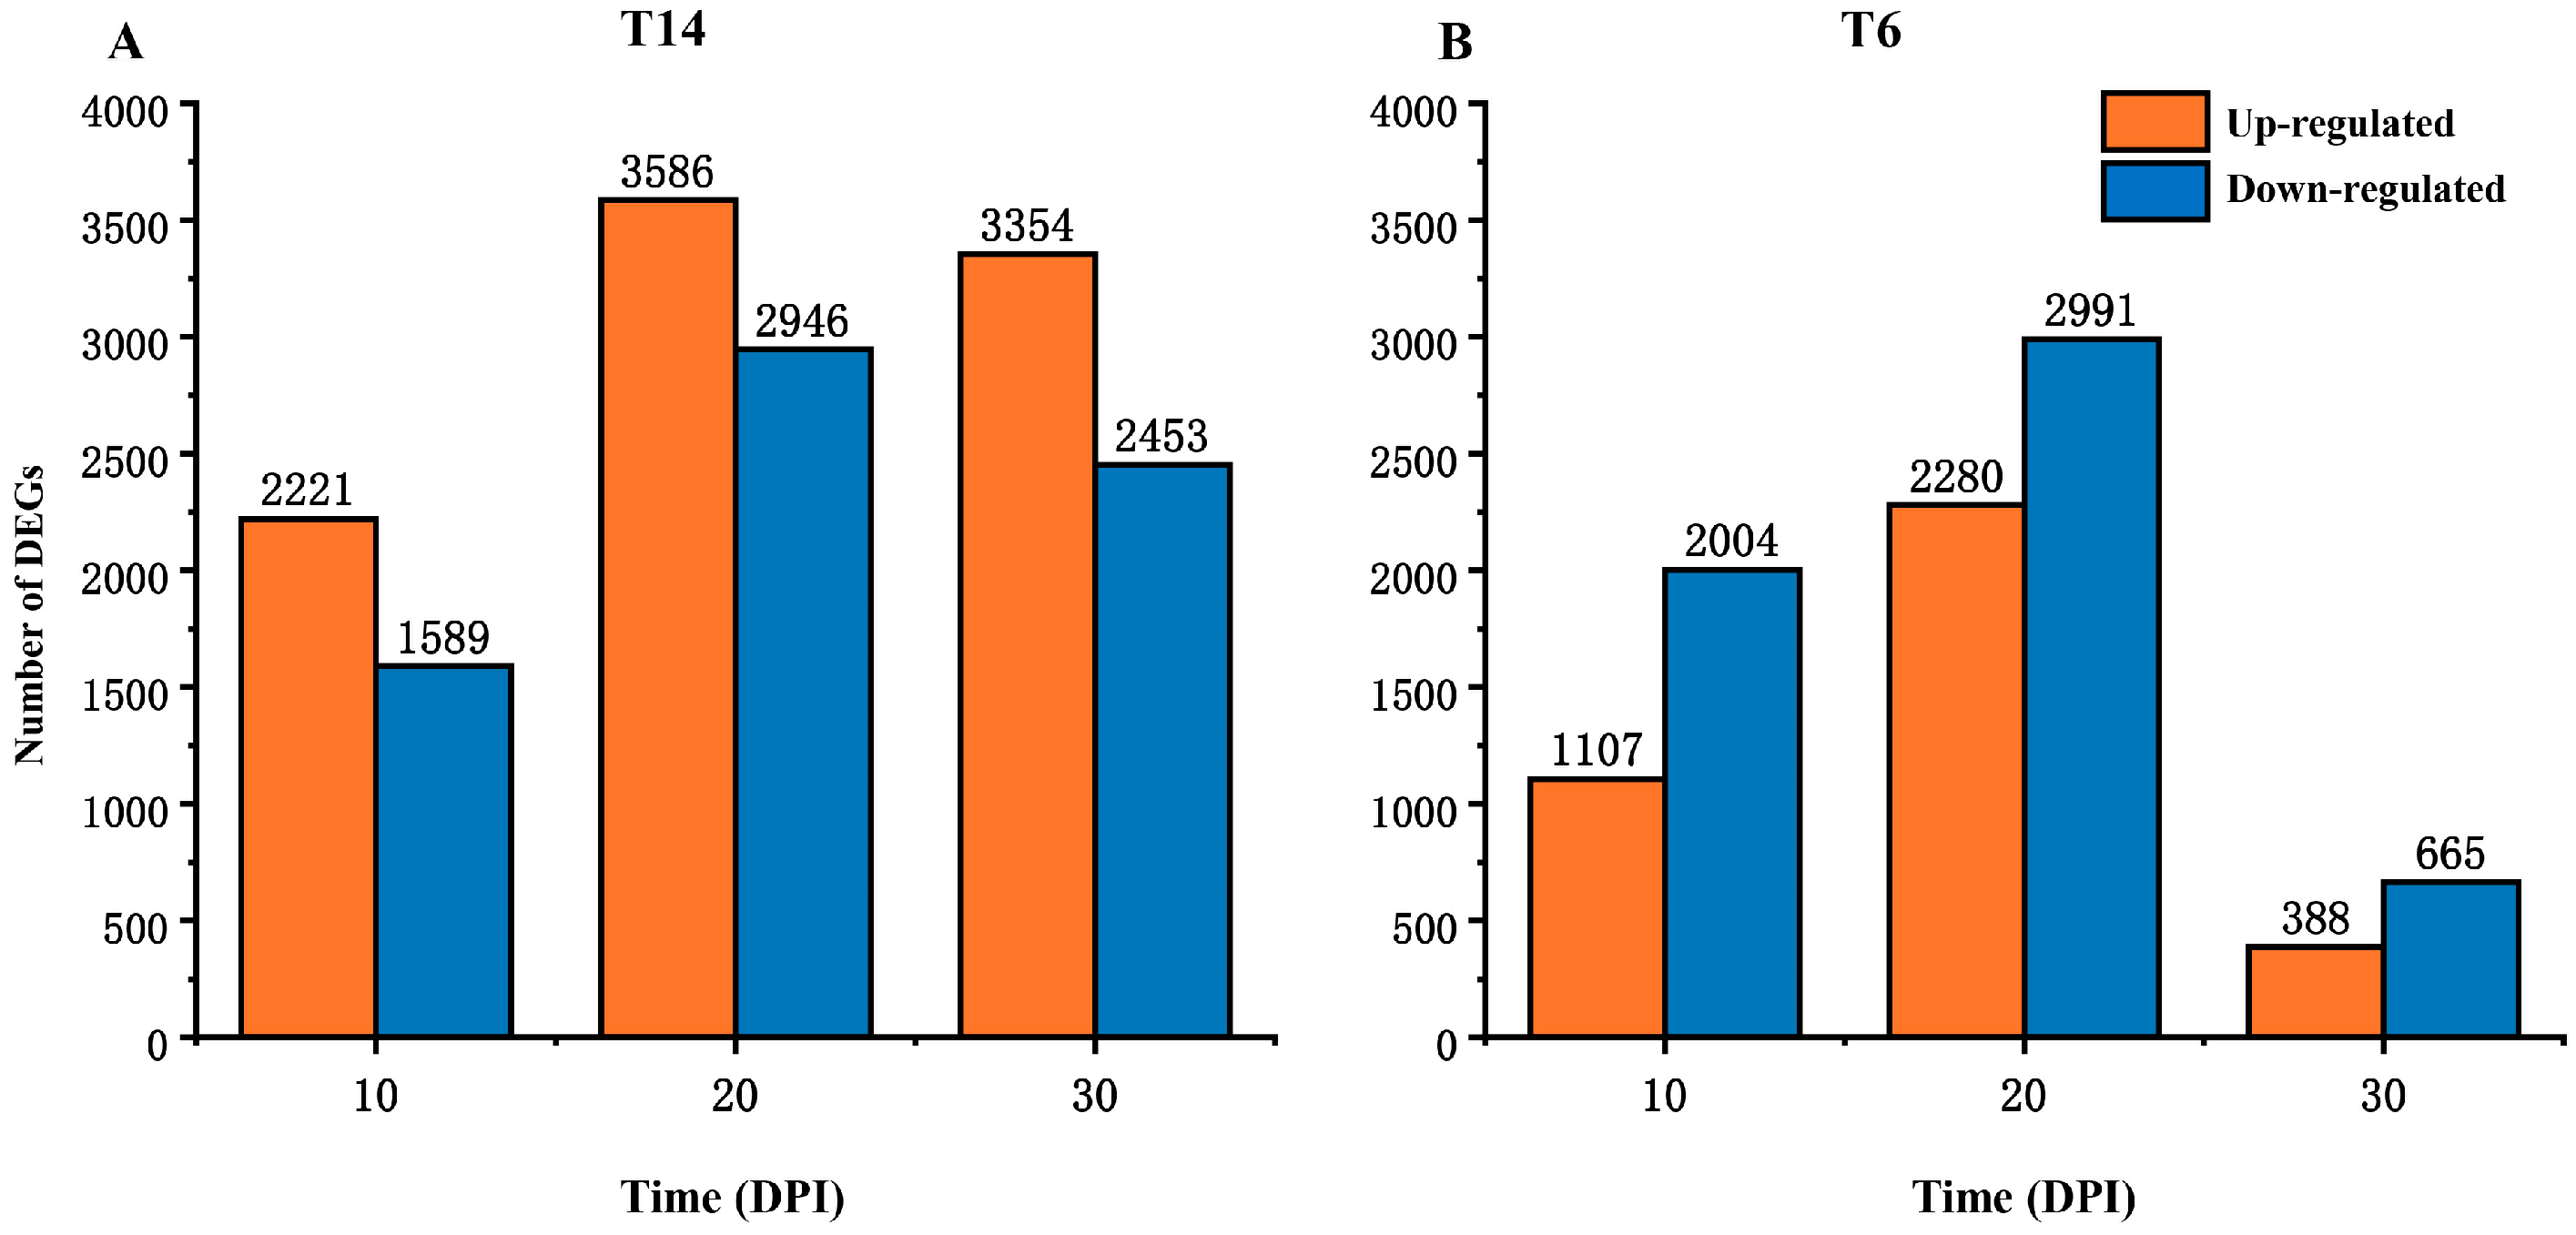
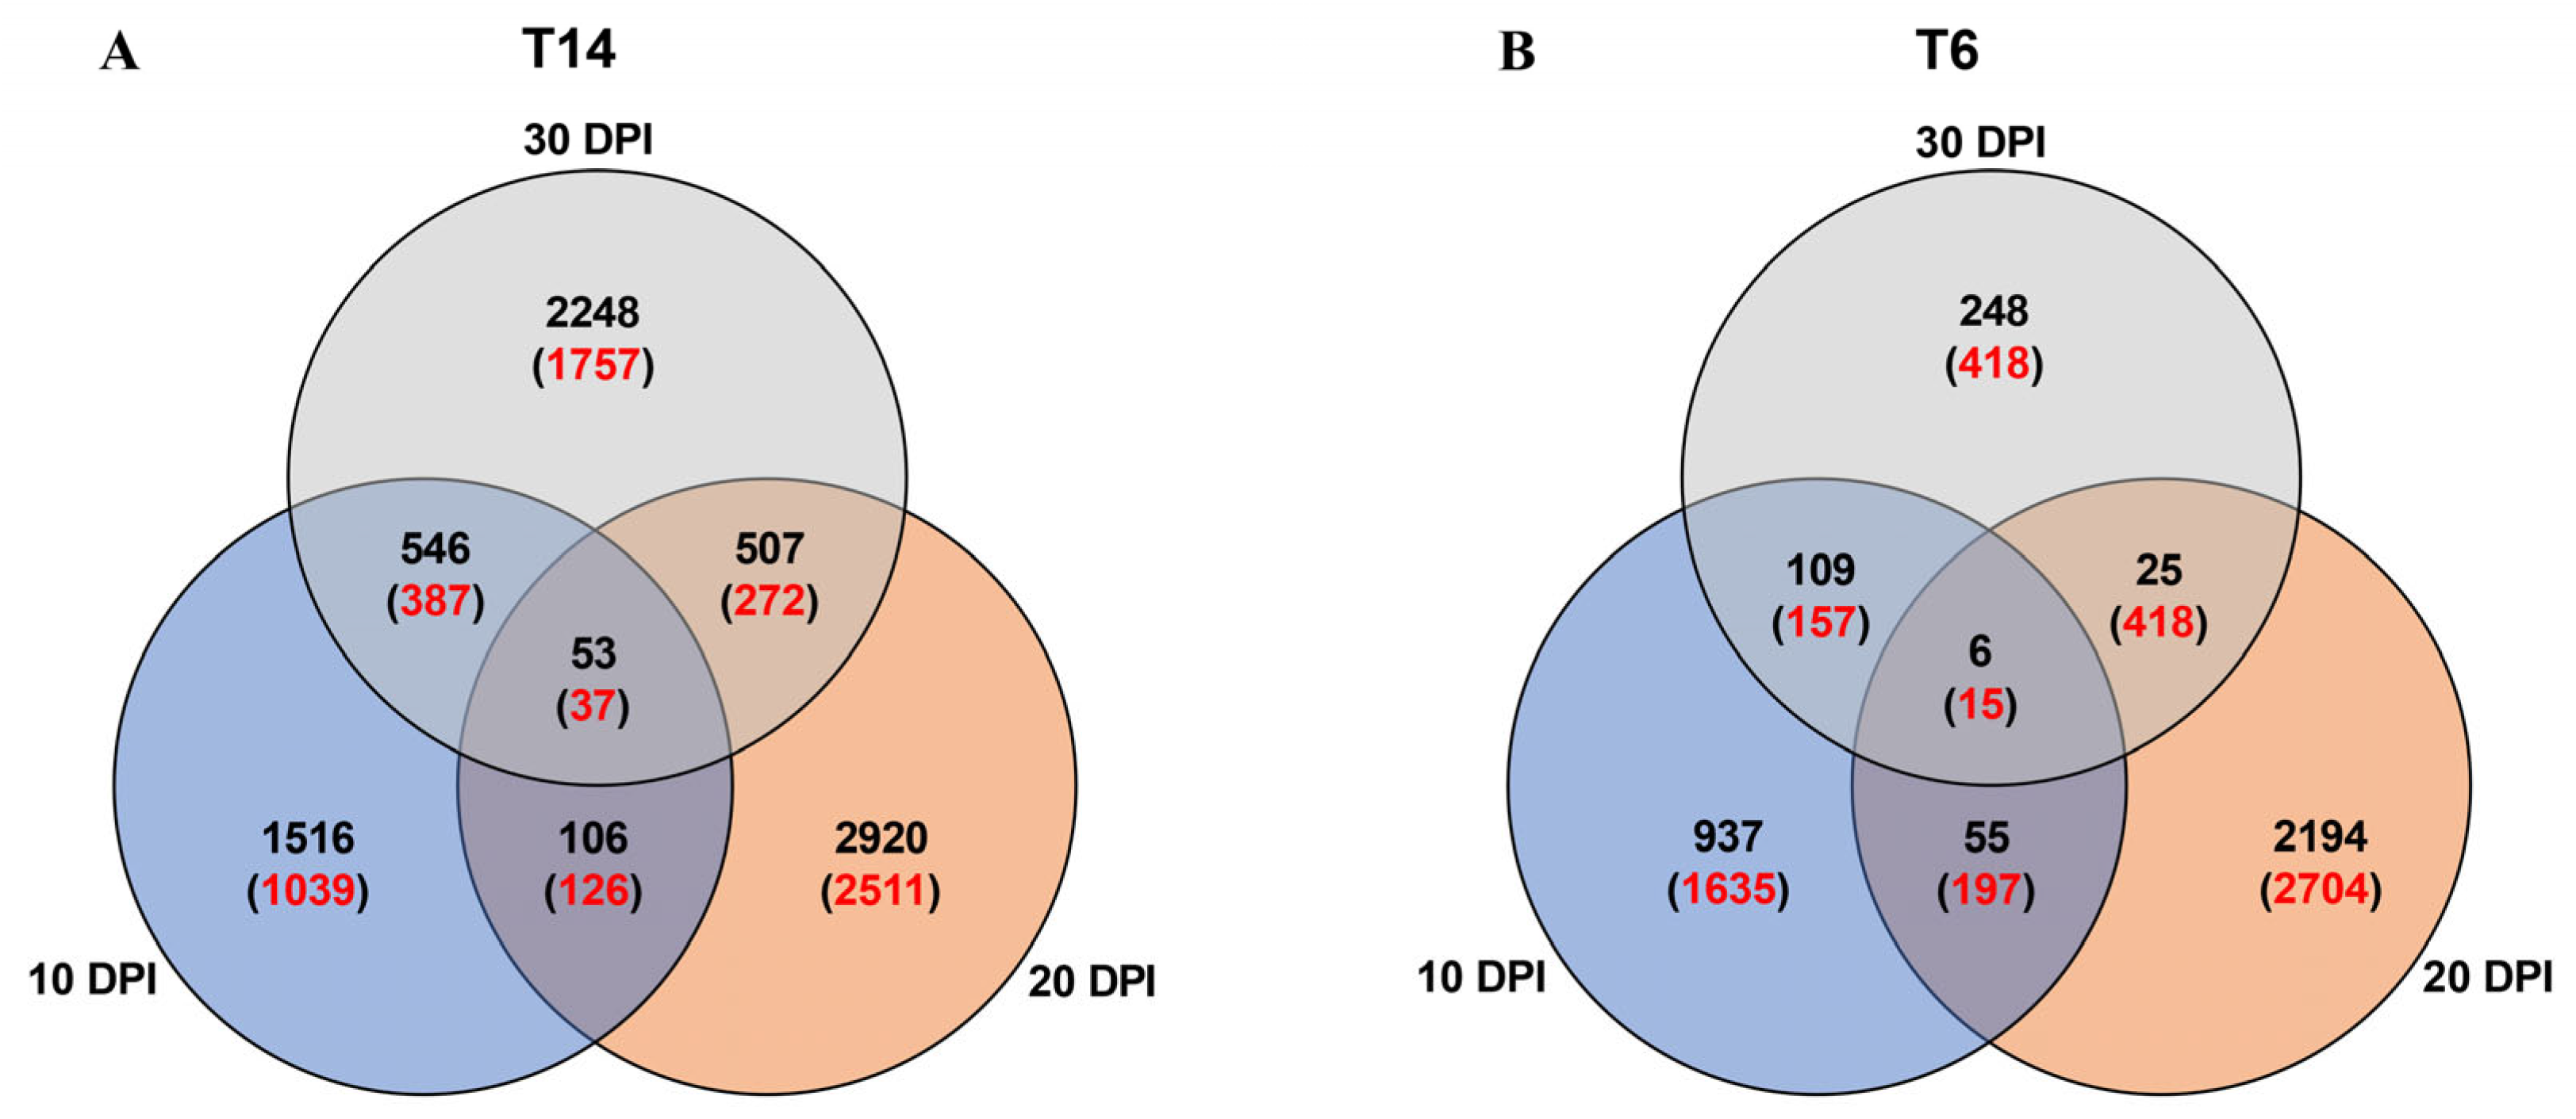
3.3. DEGs Between Resistant and Susceptible Radish Lines in Uninoculated or Inoculated Conditions

To investigate the gene expression patterns in susceptible and resistant plant lines, we analyzed DEGs in resistant (T6) and susceptible (T14) radish lines at 10, 20, and 30 DPI with P. brassica. Significant differences in gene expression patterns were observed between the two lines. The susceptible line T14 exhibited a persistent dominance of up-regulated over down-regulated genes across all time points (Figure 2). Specifically, T14 showed 2221 up-regulated vs. 1589 down-regulated genes at 10 DPI, 3586 vs. 2946 at 20 DPI, and 3354 vs. 2453 at 30 DPI. Conversely, the resistant line T6 demonstrated an inverse regulatory pattern, with down-regulated genes consistently outnumbering up-regulated counterparts: 1107 vs. 2004 at 10 DPI, 2280 vs. 2991 at 20 DPI, and 388 vs. 665 at 30 DPI (Figure 2B). Furthermore, the overall magnitude of the transcriptional response, indicated by the total number of DEGs, was markedly higher in the susceptible line T14 than in the resistant line T6 across all examined time points (Figure 2). To identify the core DEGs involved in pathogen response, a Venn analysis of temporally regulated genes was performed. In the comparative combinations of mock vs. treatment of T14, 53 DEGs were significantly regulated after P. brassica treatment at three time points. In the resistance plant line T6, six DEGs were significantly regulated after P. brassica treatment at three time points (Figure 3).

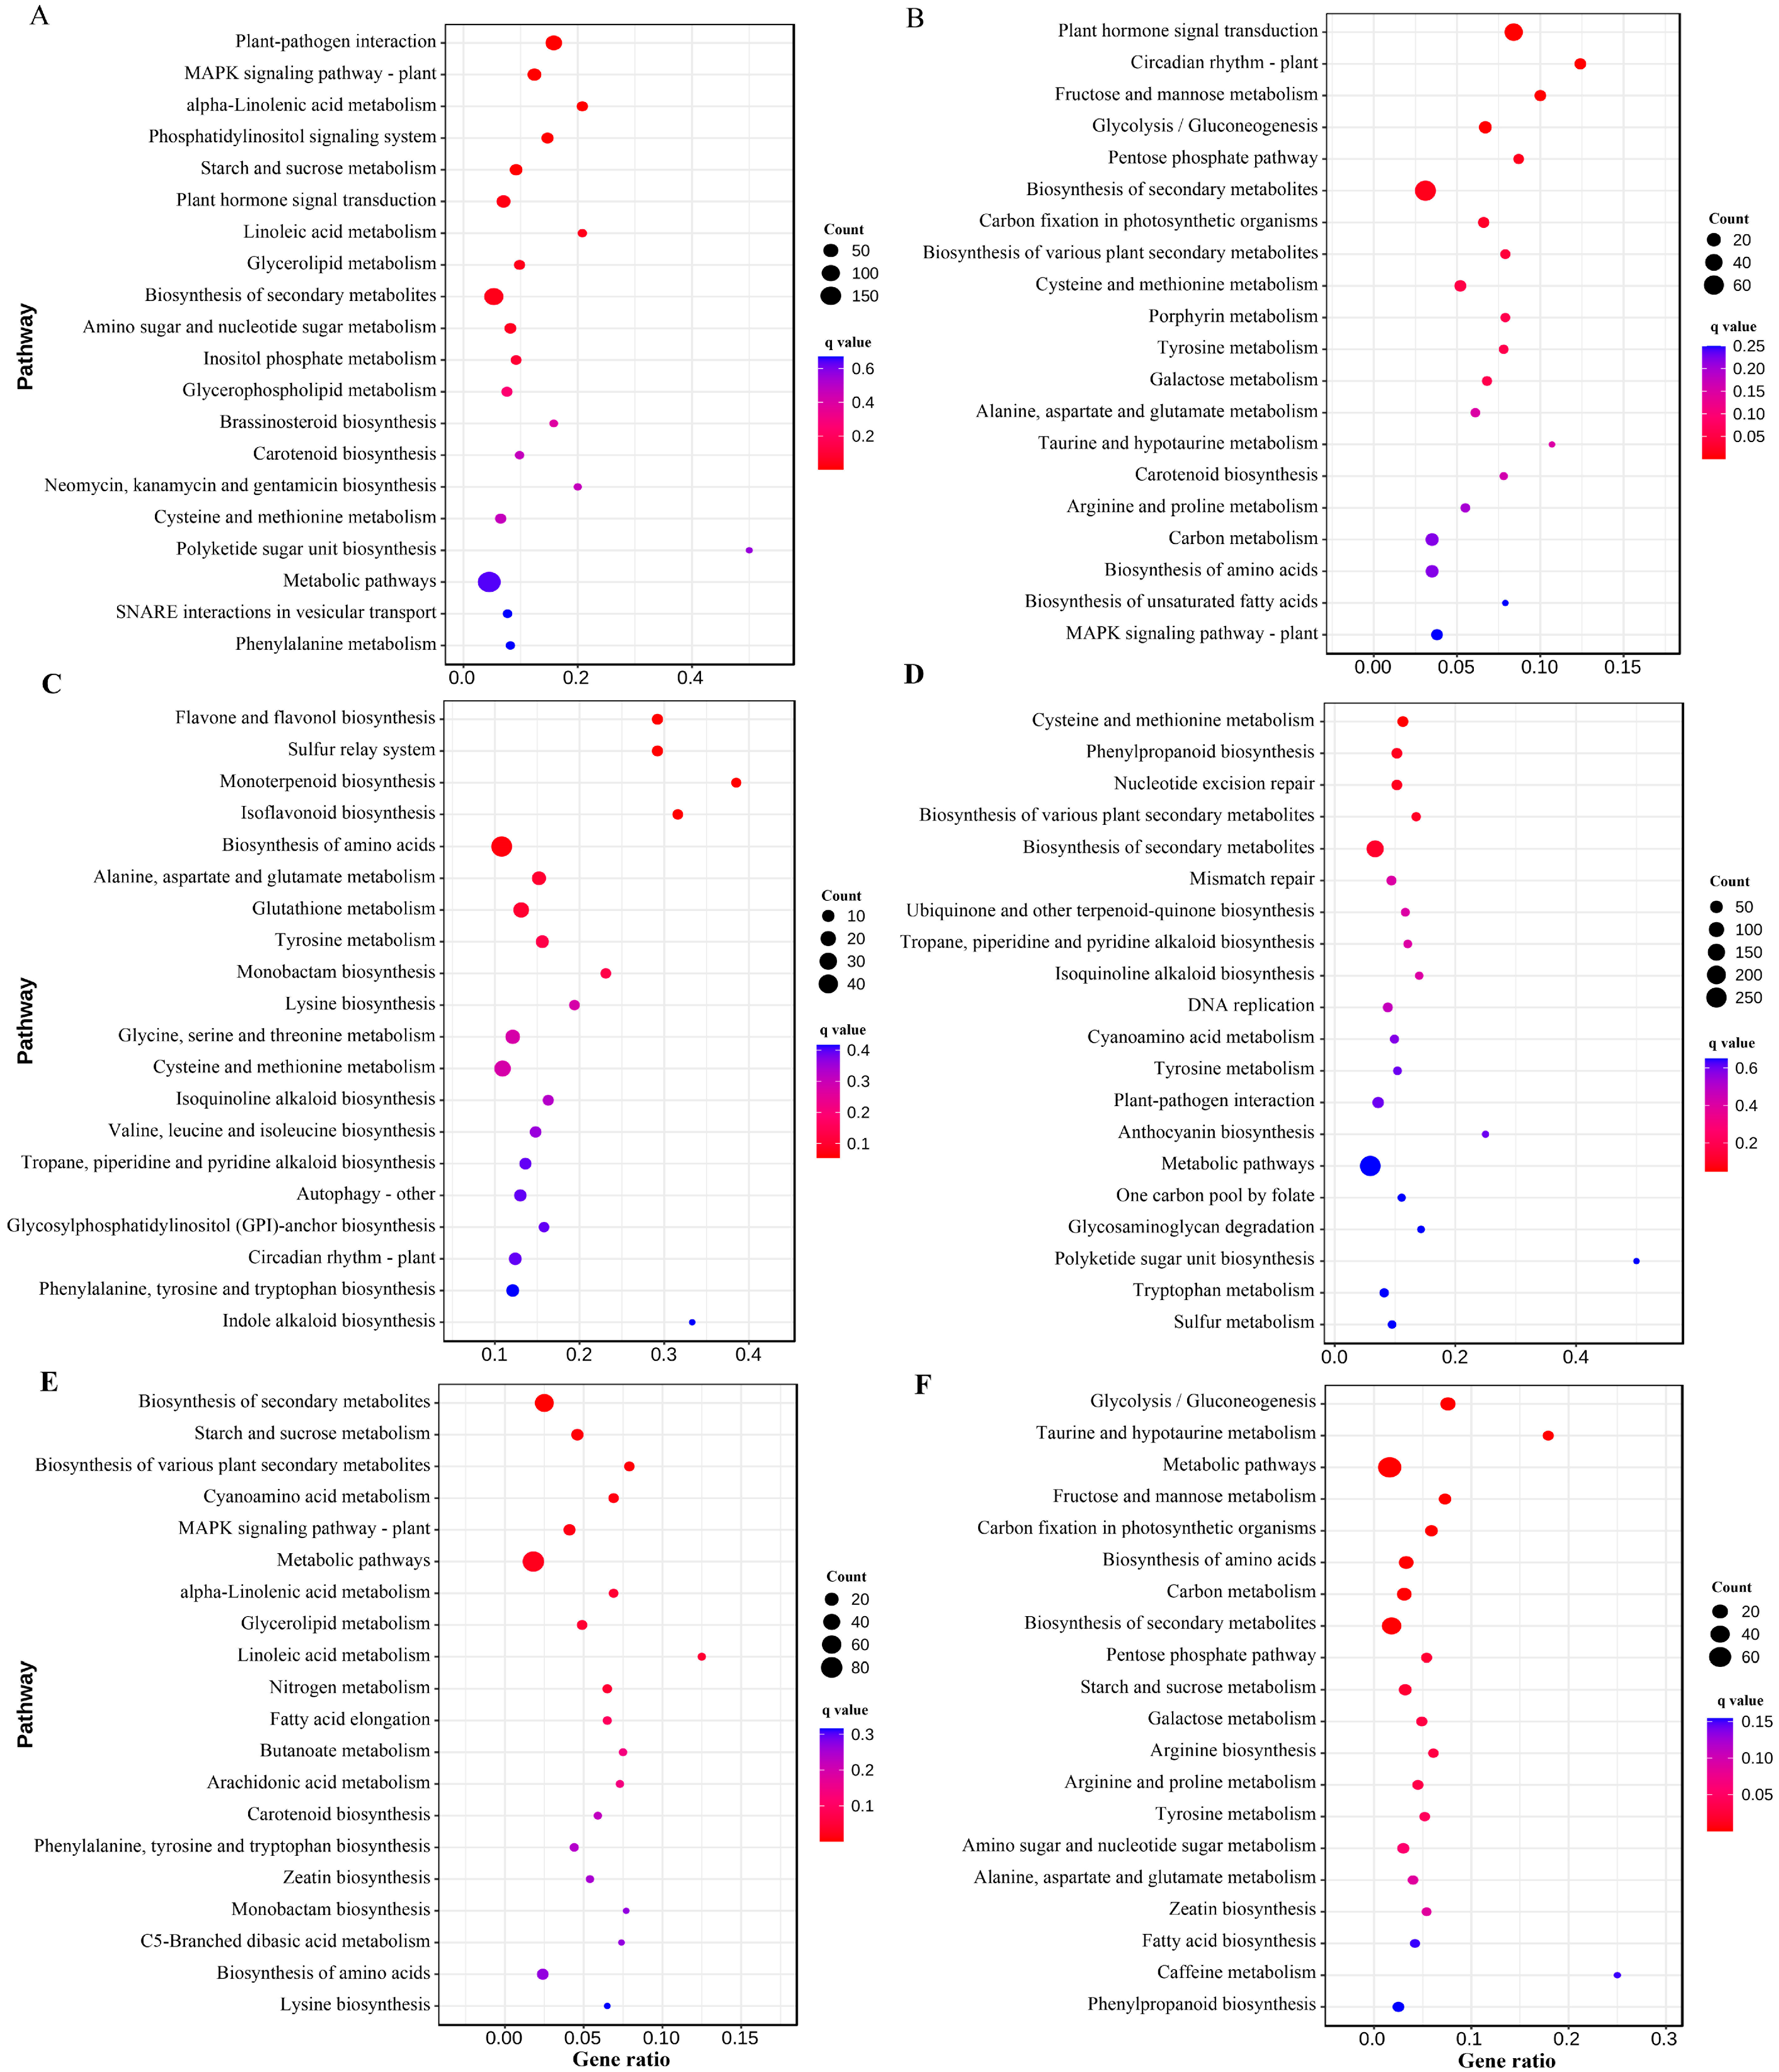
3.4. Differential Enrichment of Metabolic Pathways in Resistant and Susceptible Lines

KEGG pathway analysis was employed to elucidate the biological processes associated with the DEGs identified in the resistant (T6) and susceptible (T14) lines at 10, 20, and 30 DPI, relative to mock-inoculated controls (Figure 3 and Figure 4). This analysis highlighted significant enrichment of DEGs in several key pathways pertinent to plant–microbe interactions in both lines, notably including ‘plant–pathogen interaction’, ‘MAPK signaling pathway’, and ‘Plant hormone signal transduction’.
The ‘plant–pathogen interaction’ pathway plays a pivotal regulatory role in plant immune responses. Transcriptomic analysis revealed distinct dynamics: at 10 days post inoculation, significant enrichment of DEGs occurred in this pathway in both lines (Figure 4 and Figure 5). However, the susceptible line T14 was dominated by down-regulation (72 DEGs down vs. 5 up), whereas the resistant line T6 exhibited a clear activation profile (50 DEGs up vs. 25 down). By 20 DPI, T14 initiated a defense-related gene response (33 DEGs up vs. 28 down), while T6 maintained a relatively balanced regulatory state (37 DEGs up vs. 36 down). At 30 DPI, T6 displayed robust pathway activation, characterized by a surge in up-regulated genes (82 DEGs up vs. 22 down). In contrast, the immune response in T14 was markedly attenuated (three DEGs up vs. eight down), indicating that the resistant line possesses the capacity for sustained and amplified defense signaling.
The MAPK signaling pathway demonstrates critical involvement in plant disease resistance mechanisms. This study analyzed gene expression in the susceptible line T14 and the resistant line T6 at three time points following pathogen infection. The results showed that in the susceptible line T14, the number of down-regulated genes associated with the MAPK signaling pathway exceeded that of up-regulated genes across the three examined time points (Figure 6). Conversely, the resistant line T6 exhibited a prevalence of up-regulated genes over down-regulated ones within this pathway. Furthermore, plant hormone signaling not only regulates plant growth and development but also plays a pivotal role in disease response. A comparison of DEGs between the two lines post-infection revealed significant enrichment of DEGs associated with ethylene (ET) and JA signaling pathways (Figure 7, Supplementary Tables S3 and S4), with 131 and 191 DEGs identified, respectively. Additionally, 16 DEGs related to ABA and 9 DEGs linked to SA were detected (Figure 6A). Further analysis indicated that following infection by P. brassicae, DEGs were also identified in the calcium ion (Ca2+) signaling and reactive oxygen species (ROS) metabolic pathways (Figure 7B). Notably, the starch metabolism pathway was also impacted, particularly in the susceptible line T14, where a total of 52 DEGs associated with this pathway were identified.

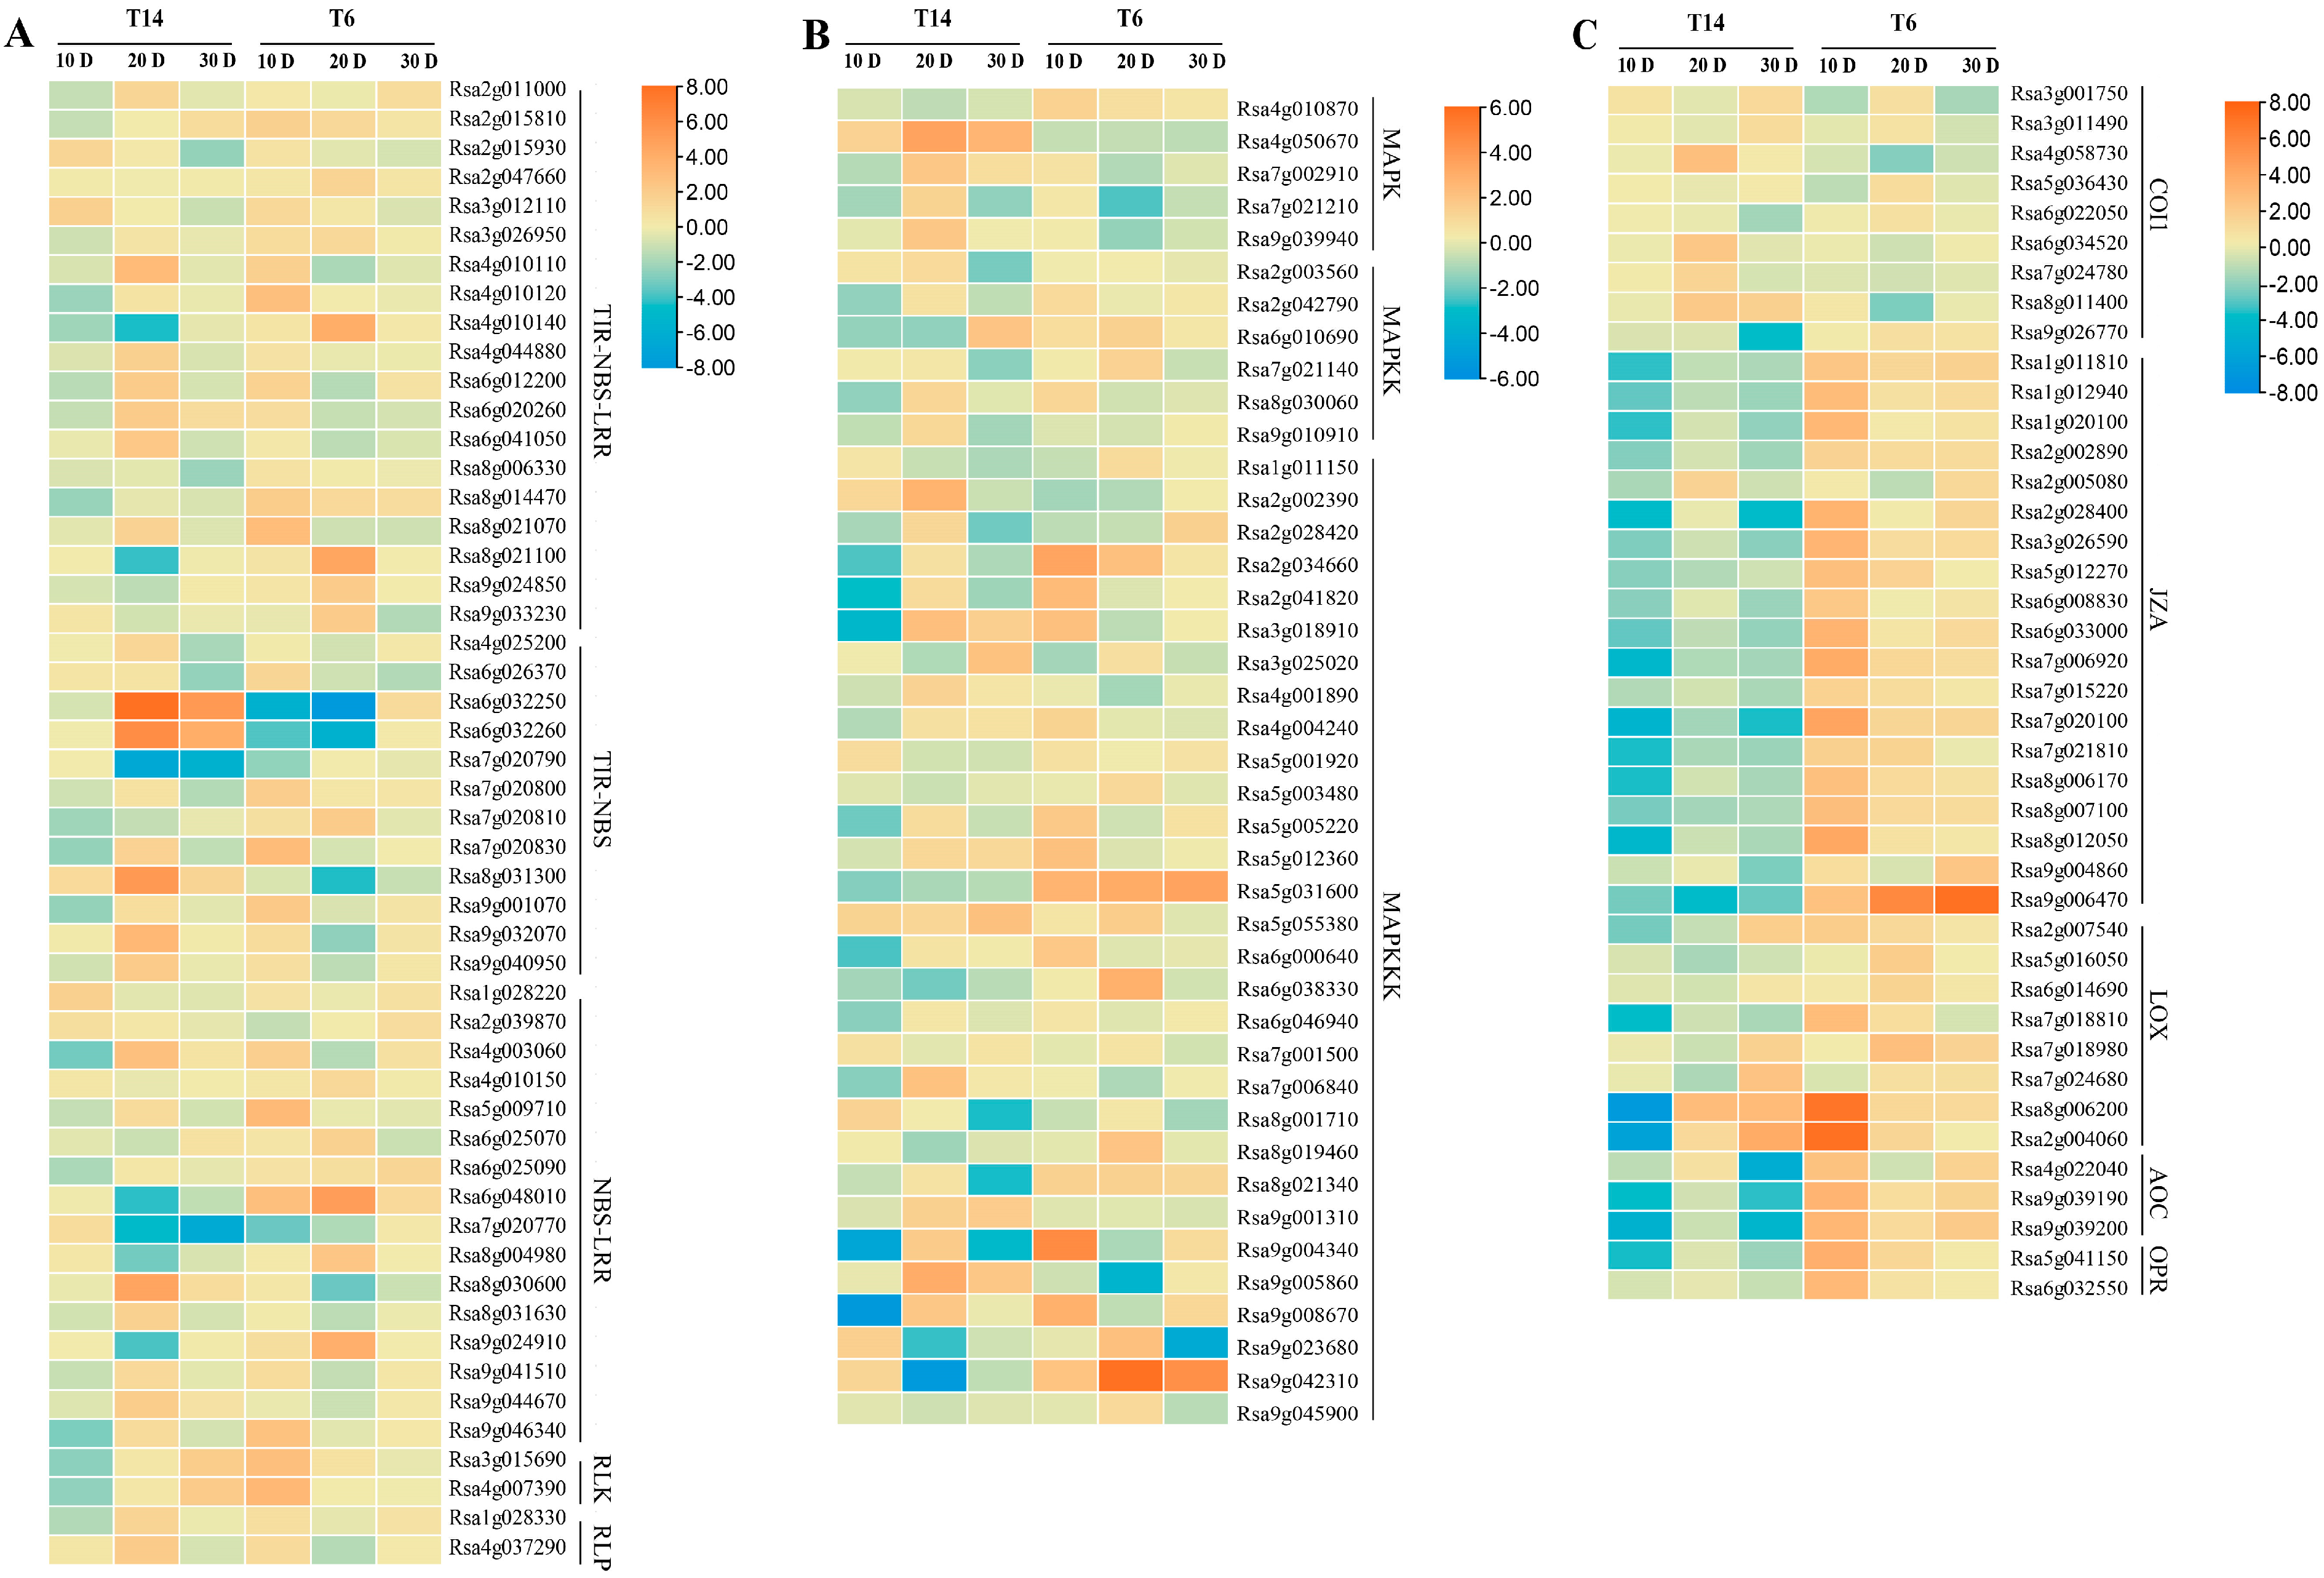
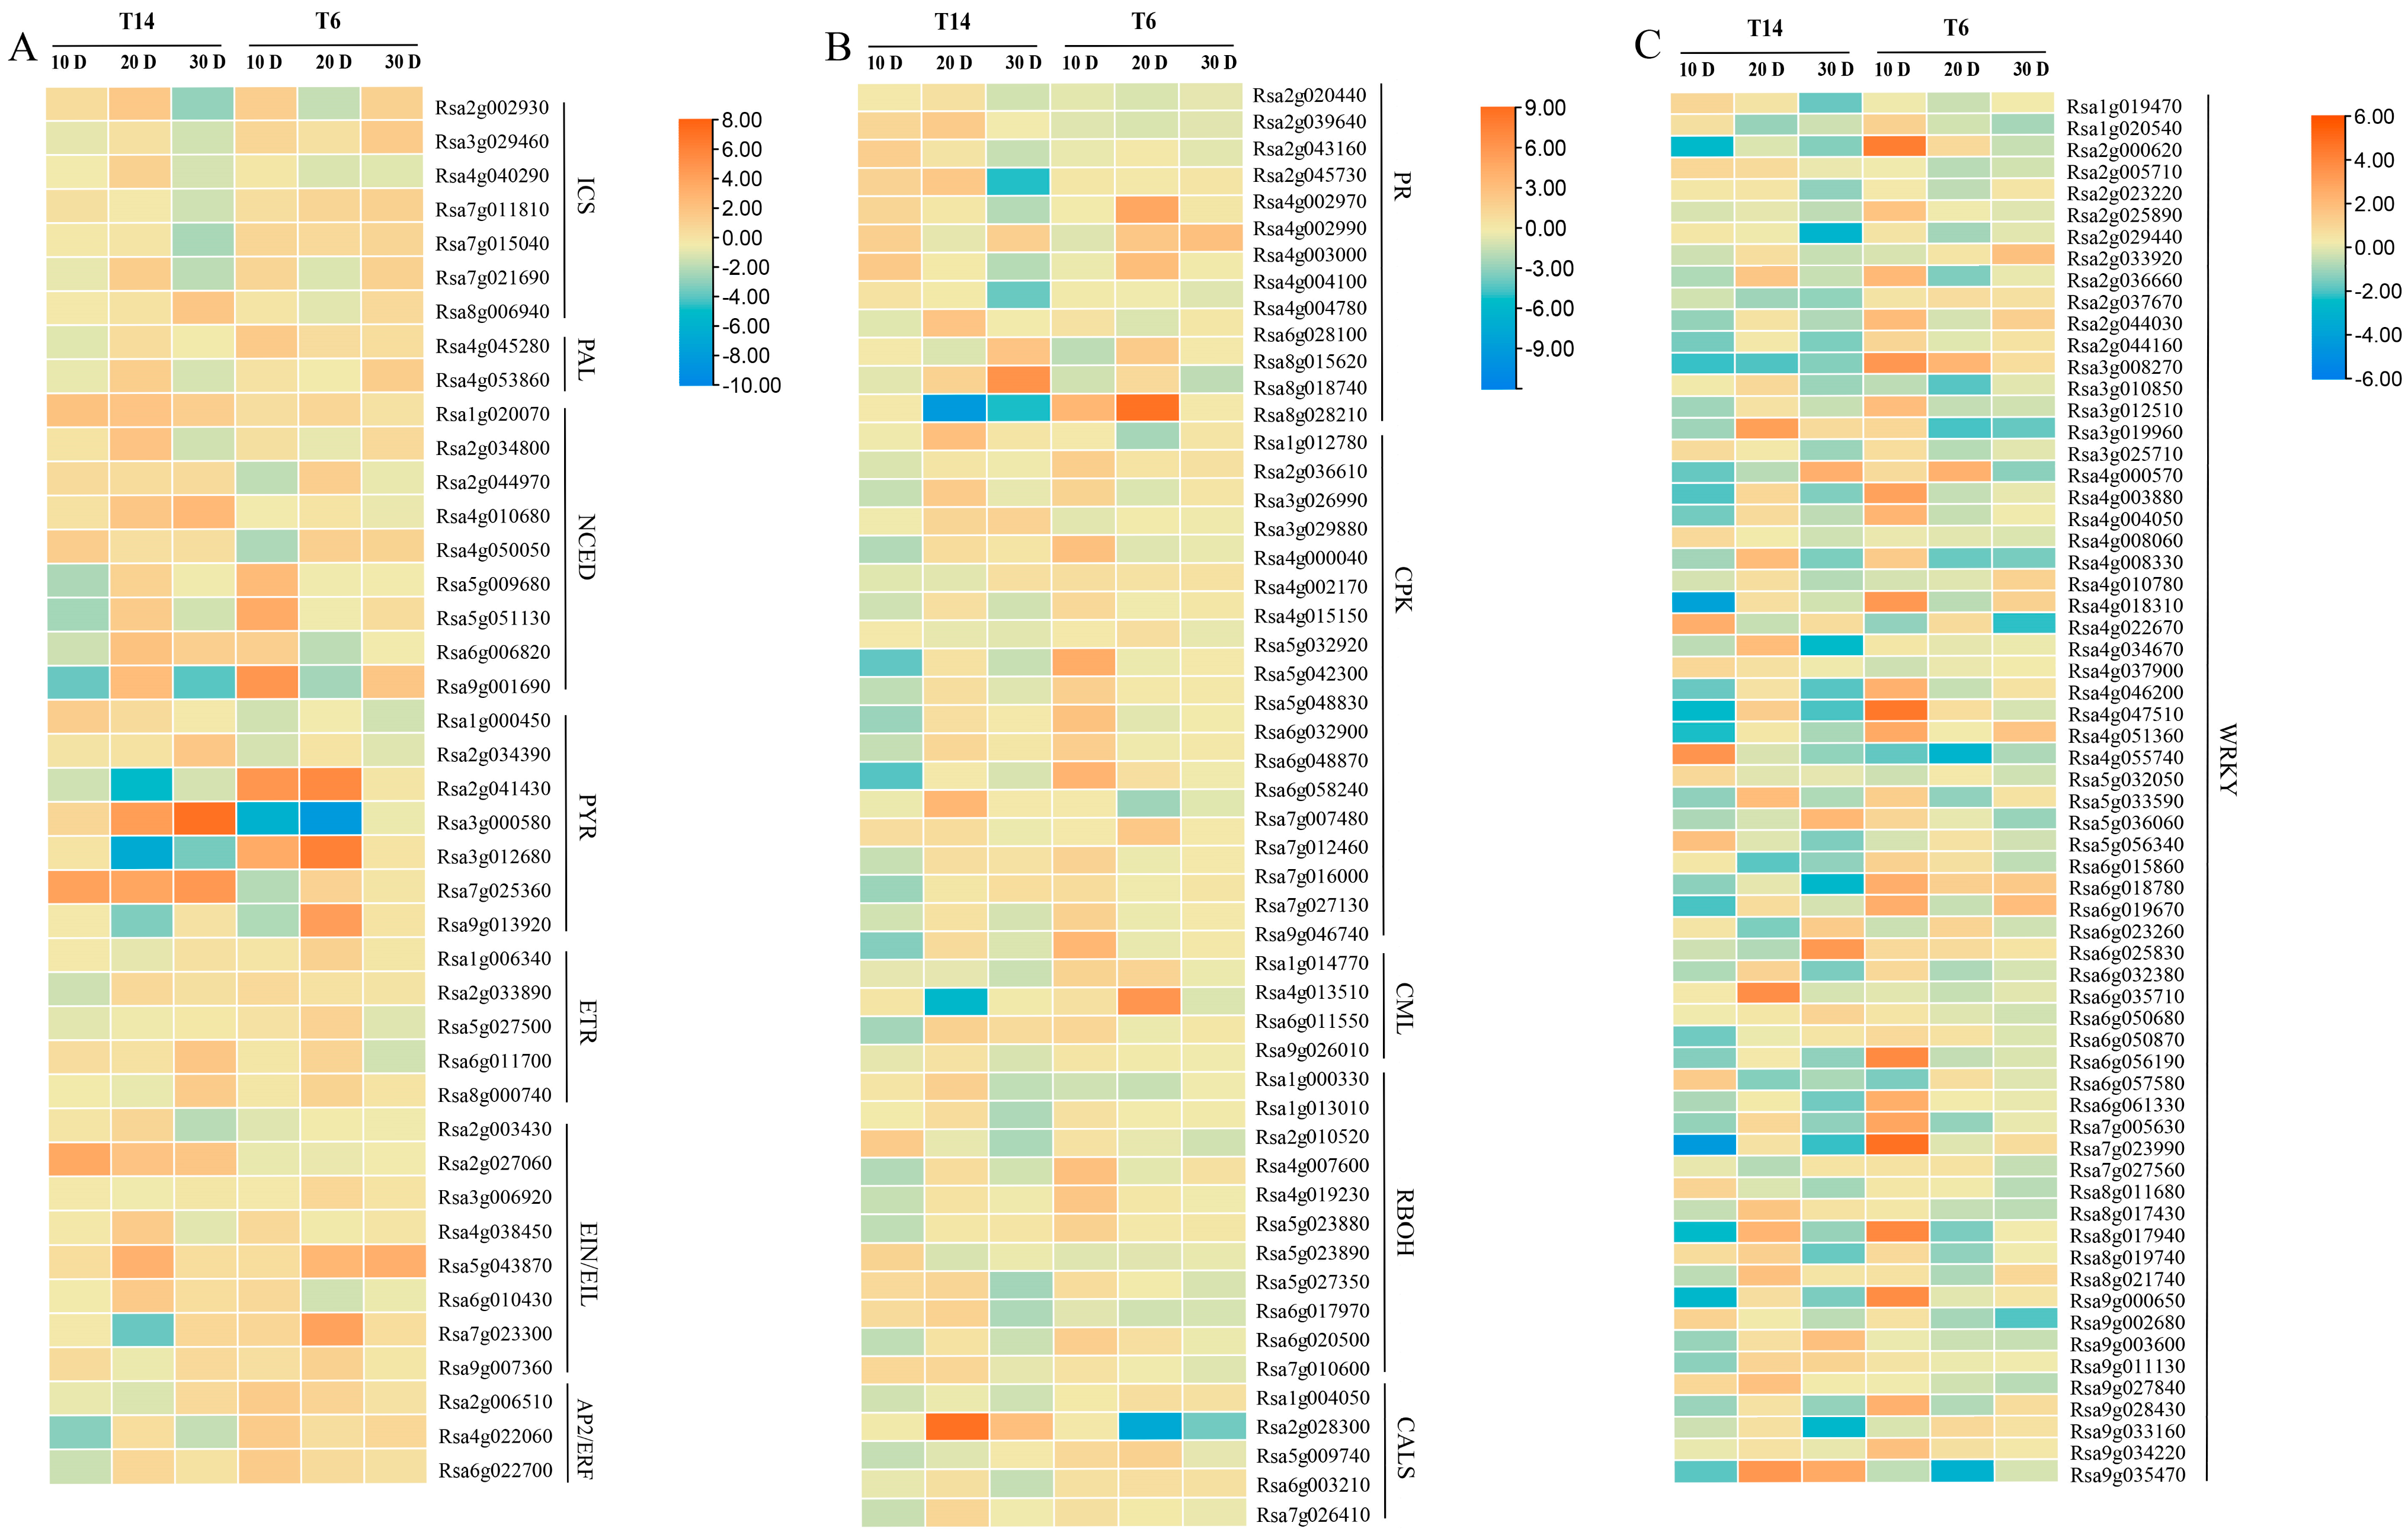
3.5. Differential Gene Ontology Enrichment and Expression Patterns Between Resistant and Susceptible Lines

To characterize the functional implications of transcriptional changes following inoculation, gene ontology (GO) enrichment analysis was performed on the DEGs identified at three time points comparing inoculated versus control samples within both the resistant (T6) and susceptible (T14) lines. DEGs were categorized into the three main GO domains: biological process, cellular component, and molecular function. Across all time points and both lines, prominent terms within the cellular component category included ‘cell part’ and ‘organelle’. Within the molecular function category, ‘catalytic activity’ and ‘binding’ were highly represented. A comparative analysis of DEG profiles between the resistant (T6) and susceptible (T14) lines post-inoculation revealed distinct overall patterns. Notably, the susceptible line T14 exhibited a preponderance of up-regulated DEGs compared to down-regulated DEGs (Supplementary Figure S1). Conversely, the resistant line T6 displayed a predominance of down-regulated DEGs relative to up-regulated DEGs (Supplementary Figure S2).
Based on GO annotations and resistance gene characteristics, 51 putative resistance (R) genes were identified (Figure 6A). Among these, 47 genes contained the nucleotide-binding site and leucine-rich repeat (NB-ARC) domain, 2 were classified as receptor-like kinases (RLKs), and 2 as receptor-like proteins (RLPs). At 10 DPI, the expression levels of R genes in the resistant line T6 were significantly up-regulated and generally higher compared to their counterparts in the susceptible line T14 at the same time point. Notably, however, two specific genes (Rsa6g032250 and Rsa6g032260) exhibited significantly higher expression levels in the susceptible line T14 compared to the resistant line T6 across all three examined time points. The calcium signaling pathway, including calcium-dependent protein kinases (CPKs) and calmodulin-like proteins (CMLs), displayed distinct regulation: 14 CPK and 4 CML genes were up-regulated in T6 at 10 DPI (Figure 7B). A comparative analysis of peroxidase genes revealed 11 significantly differentially expressed members. At 10 DPI, T14 showed five down-regulated and six up-regulated peroxidase genes, whereas T6 exhibited two down-regulated and nine up-regulated genes. By 20 DPI, all peroxidase genes in T14, except Rsa5g023890, were up-regulated. A total of 11 significantly differentially expressed peroxidase genes were detected between the two lines. At 10 DPI, T14 exhibited down-regulation of 5 and upregulation of 6 peroxidase genes, whereas T6 showed down-regulation of two and upregulation of nine such genes. By 20 DPI, nearly all identified peroxidase genes in T14 were up-regulated, except for Rsa5g023890. Callose synthase (CALS) contributes to plant defense via callose deposition at infection sites. The results showed that the CALS gene Rsa2g028300 was up-regulated in the susceptible line T14 but down-regulated in the resistant line T6.
Jasmonic acid (JA) is a critical phytohormone, regulating defense responses, growth, and stress adaptation. Key genes in JA signaling (Figure 6C), Coronatine Insensitive 1 (COI1), and Jasmonate ZIM-domain (JAZ), displayed contrasting regulation. Following infection, most JAZ genes in T14 were negatively regulated across the three time points, while they were generally positively regulated in the resistant line T6. The gene Rsa9g006470 showed a particularly pronounced expression difference between the lines. The genes involved in JA biosynthesis, including Lipoxygenases (LOXs), Allene Oxide Cyclase (AOC), and OPDA Reductase (OPR), also exhibited specific patterns. The expression trends of AOC and OPR genes paralleled those of JAZ genes (down-regulated in T14, up-regulated in T6). However, LOX genes differed in their expression patterns: they were consistently up-regulated in T6 across all time points, whereas in T14, they were down-regulated at 10 and 20 DPI, but five LOX genes were up-regulated at 30 DPI. Notably, Rsa2g004060 and Rsa8g006200 displayed highly significant expression differences between the lines at 10 DPI. A preliminary analysis of genes related to SA, ABA, and ethylene (ET) signaling pathways indicated divergent responses among PYR/PYL/RCAR receptor genes in the ABA pathway (Figure 7A). Specifically, Rsa3g000580 and Rsa7g025360 were highly expressed in the susceptible line T14 and lowly expressed in the resistant line T6, whereas Rsa3g012680 and Rsa2g041430 showed the inverse pattern.
Among the DEGs, 64 members belonging to the WRKY transcription factor (TFs) family were identified (Figure 7C). At 10 DPI, these WRKY genes were predominantly up-regulated in the resistant line T6 and down-regulated in the susceptible line T14. Finally, an analysis of genes associated with the starch regulatory pathway revealed that most of these genes were up-regulated in the susceptible line T14 at later time points (20 and 30 DPI).

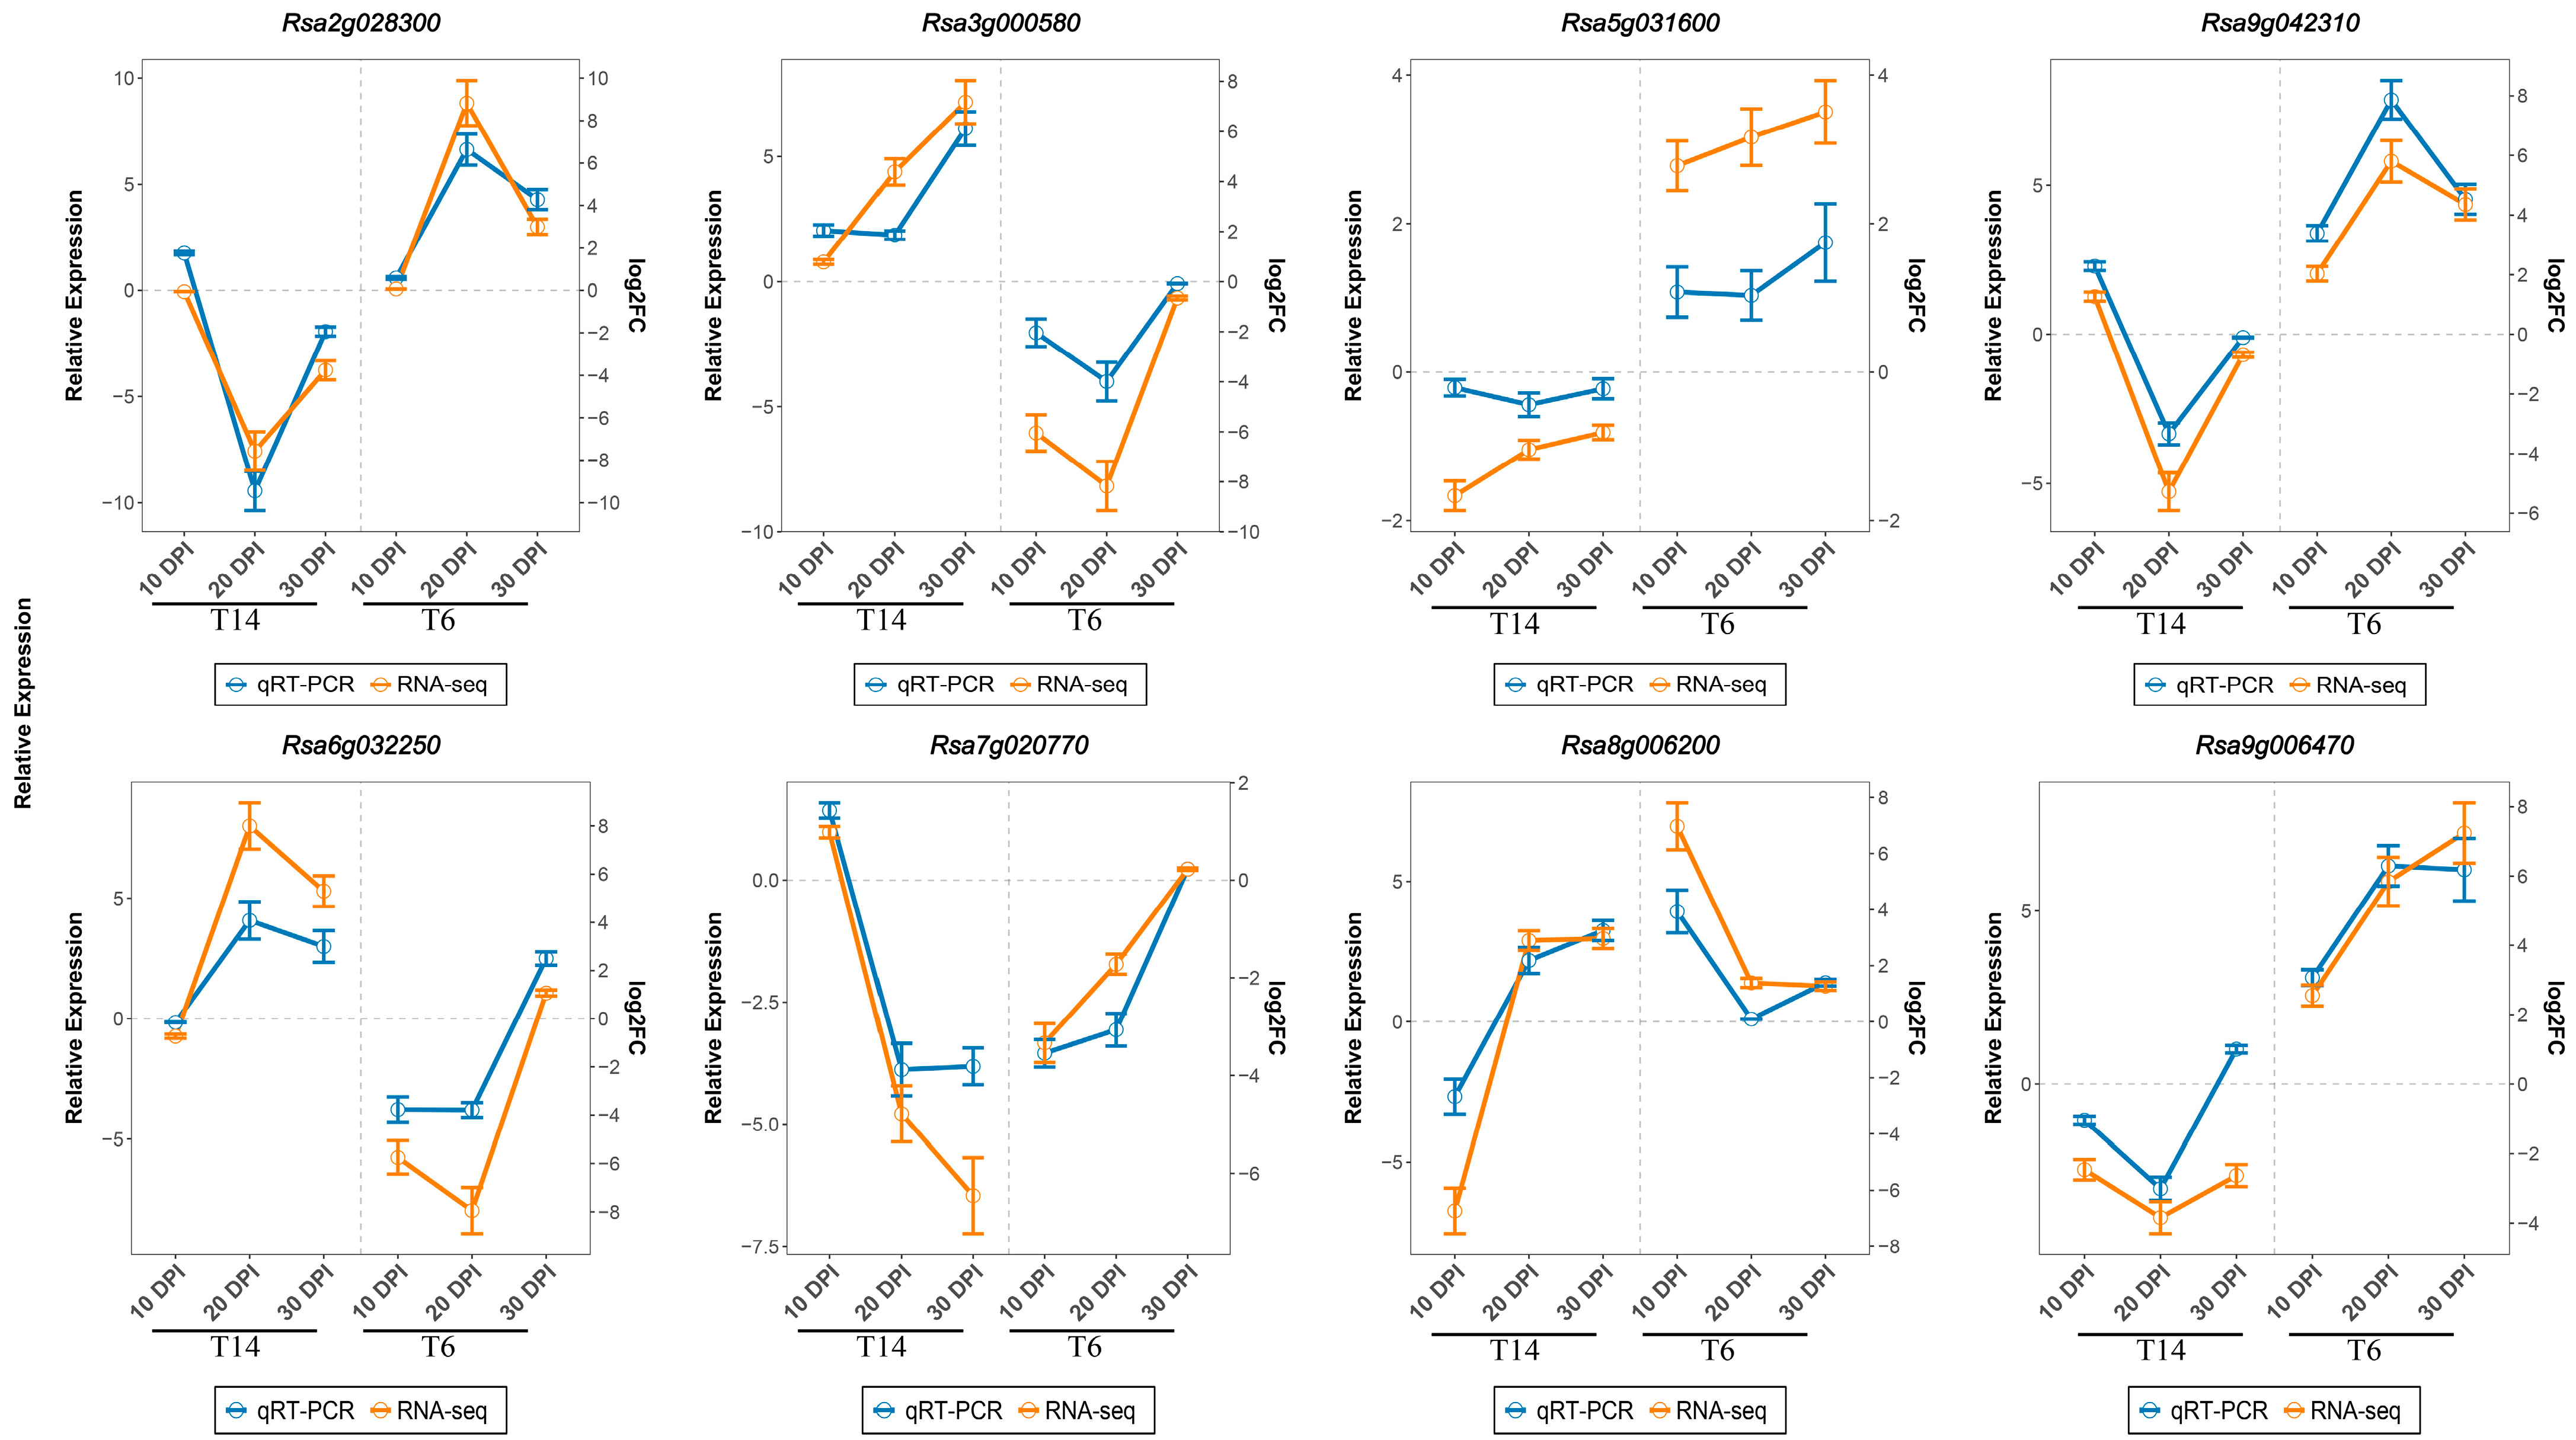
3.6. Validation of RNA-Seq Data by RT-qPCR

To validate the RNA-Seq expression profiles, the RT–qPCR analysis was performed on eight selected DEGs. These included three putative disease-associated genes (Rsa6g032250, Rsa2g028300, Rsa7g020770), two MAPK pathway genes (Rsa5g031600, Rsa9g042310), two JA pathway genes, and one ABA pathway gene (Rsa3g000580). The relative expression levels measured by RT-qPCR in resistant and susceptible lines at three time points (inoculated vs. uninoculated controls) showed trends largely consistent with the RNA-Seq data, thereby corroborating the transcriptomic findings. However, the RNA-Seq analysis exhibited a broader dynamic range, detecting fold changes of greater magnitude compared to RT-qPCR (Figure 8).

4. Discussion

Clubroot disease, caused by the obligate biotrophic plasmodiophorid protist P. brassicae, poses a significant threat to global cruciferous crop production. While resistance breeding remains the most effective control strategy, the molecular mechanisms underlying clubroot resistance in radishes are less understood compared to related Brassica species [25,26]. In this study, a total of 52 radish inbred lines were screened for their disease responses following inoculation with P. brassicae, resulting in the identification of six resistant and seven highly susceptible lines. Subsequently, transcriptomic reprogramming in susceptible (T14) and resistant (T6) radish lines following infection with P. brassicae revealed distinct defense strategies and susceptibility determinants. Notably, the resistant line T6 exhibited rapid activation of defense pathways, contrasting with delayed or dysregulated responses in T14, suggesting pathogen manipulation of host processes.
  • Transcriptomic analysis in susceptible and resistant lines during P. brassicae infection
The susceptible line (T14) displayed a global transcriptional upheaval, marked by a higher number of DEGs and predominant upregulation across all time points (Figure 2A). This pattern could suggest a potential reallocation of resources from growth toward defense, a strategy often associated with the ‘growth-defense trade-off’ hypothesis in plant immunity. The subsequent reduction in the number of DEGs at 30 DPI in the T6 line may indicate a successful containment of the pathogen, allowing the plant to restore metabolic homeostasis.
  • Multilayered defense activation in resistant and susceptible lines
We identified 51 putative R genes, predominantly encoding NB-ARC domain proteins, which were markedly up-regulated in T6 at 10 DPI. This aligns with effector-triggered immunity (ETI), where R proteins recognize pathogen effectors to initiate defense cascades. Intriguingly, two R-like genes (Rsa6g032250 and Rsa6g032260) were constitutively up-regulated in T14, potentially functioning as susceptibility (S) genes or ineffective R alleles specific to race 4.
In the early activation of defense signaling pathways, plant–pathogen interaction was activated in T6 at 10 DPI (50 up vs. 25 down DEGs), while it was suppressed in T14 (5 up vs. 72 down) (Figure 4 and Figure 5). MAPK cascades, critical for relaying pathogen-associated molecular pattern (PAMP) signals [43], likely coordinate downstream responses such as calcium signaling (14 CPKs and 4 CMLs up-regulated) and reactive oxygen species (ROS) production (nine peroxidase genes were up-regulated). This rapid signaling network activation may underpin T6’s ability to limit pathogen spread through oxidative bursts and cellular reinforcement [44]. Among 64 WRKY transcription factors identified, most were up-regulated in T6 but down-regulated in T14. WRKY proteins, acting downstream of MAPK cascades, regulate defense gene expression by binding W-box elements in promoters [45]. Their early induction in T6 suggests a coordinated amplification of defense signals, contrasting with T14’s failure to activate this regulatory network.
Hormonal crosstalk appears to be critical in modulating resistance outcomes. Our analysis revealed a striking divergence in the jasmonic acid (JA) pathway, where key components, including JAZ repressors and biosynthesis genes (AOC, OPR), were up-regulated in the resistant T6 line but suppressed in the susceptible T14 line. While JA typically mediates resistance to necrotrophic pathogens, its role in biotrophic interactions involves fine-tuning responses to balance defense and fitness costs [46,47]. The sustained upregulation of LOX genes in T6, contrasted with the transient suppression in T14, highlights the temporal regulation of JA biosynthesis. The highly differential Rsa9g006470 (JAZ) warrants functional validation to elucidate its role in resistance. Our results also suggest the involvement of abscisic acid (ABA) and cross-pathway interactions. Specifically, ABA receptor genes (PYR/PYL/RCAR) showed genotype-specific expression, with Rsa3g000580 highly expressed in the susceptible T14 line and Rsa2g041430 highly expressed in the resistant T6 line. This finding suggests a potential dual role for ABA as a defense modulator in this pathosystem. ABA may antagonize JA signaling in T14, exacerbating susceptibility, as observed in other pathosystems. Although SA-related DEGs were limited, SA-JA interplay likely influences defense prioritization against P. brassicae’s biotrophic lifestyle [48].
The susceptible phenotype in T14 correlated with delayed defense initiation and metabolic manipulation by P. brassicae. Suppression of JA signaling and late-stage upregulation of starch metabolism genes (20–30 DPI) suggest pathogen-driven resource reallocation to support gall formation [49]. The paradoxical upregulation of callose synthase (Rsa2g028300) in T14 might reflect futile defense attempts or pathogen subversion of callose deposition, a mechanism observed in other susceptible interactions.

5. Conclusions

This transcriptomic study reveals the molecular mechanisms underlying clubroot resistance and susceptibility in radish. The resistant line T6 employs a multilayered defense strategy characterized by rapid activation of 51 putative R genes, MAPK-Ca2+-ROS signaling, and JA-mediated regulation, enabling effective pathogen restriction through effector-triggered immunity and sustained defense signaling. In contrast, T14’s susceptibility stems from delayed and dysregulated defense responses, marked by suppressed JA and MAPK pathways, pathogen-driven starch metabolism upregulation, and potential susceptibility genes, facilitating gall formation and disease progression. Key pathways, including plant–pathogen interaction, MAPK signaling, and hormonal crosstalk, exhibit divergent regulation, with T6 prioritizing early, coordinated immunity, and T14 succumbing to metabolic hijacking. These findings not only elucidate the different strategies radish employs in response to clubroot but also provide important molecular resources and a theoretical basis for improving clubroot resistance in radish.

Supplementary Materials

The following supporting information can be downloaded at https://www.mdpi.com/article/10.3390/horticulturae11070777/s1. Figure S1: Classification of gene ontology (GO) analysis of DEGs for T14; Figure S2: Classification of gene ontology (GO) analysis of DEGs for T6; Table S1: The primer sequence for RT-qPCR; Table S2: Summary of the RNA-seq experimental design and read alignment; Table S3: Expression of DEG involved ethylene biosynthesis pathway between T14 and T6; Table S4: Relative expression of DEGs involved jasmonic acid biosynthesis pathway between T14 and T6.

Author Contributions

Study conception and revising the manuscript: L.L.; writing the draft manuscript: Y.M. and X.L.; reviewing and creating figures and tables: F.C., Q.Y., B.L. and X.G.; reviewing and improving the manuscript: L.L. All authors have read and agreed to the published version of the manuscript.

Funding

This work was supported by grants from the Natural Science Foundation of Jiangsu Province (BK20220573), the Jiangsu Seed Industry Revitalization Project [JBGS(2021)071], the Key Technology R&D Program of Jiangsu Province (BE2023366).

Data Availability Statement

All data generated in this study are available within the paper and its additional files. The raw sequence data reported in this paper have been deposited in the National Genomics Data Center (NGDC) under the project accession number PRJCA030868.

Conflicts of Interest

The authors declare that they have no conflicts of interest.

References

  1. Swaamy, K. Origin, distribution, genetic diversity and breeding of radish (Raphanus sativus L.). Int. J. Dev. Res. 2023, 13, 61657–61673. [Google Scholar]
  2. Nishio, T. Economic and academic importance of radish. In The Radish Genome; Springer: Berlin/Heidelberg, Germany, 2017; pp. 1–10. [Google Scholar]
  3. Gaba, J.; Bhardwaj, G.; Sharma, A.; Nayik, G.; Gull, A. Antioxidants in Vegetables and Nuts-Properties and Health Benefits; Springer: Berlin/Heidelberg, Germany, 2020. [Google Scholar]
  4. Goyeneche, R.; Roura, S.; Ponce, A.; Vega-Gálvez, A.; Quispe-Fuentes, I.; Uribe, E.; Di Scala, K. Chemical characterization and antioxidant capacity of red radish (Raphanus sativus L.) leaves and roots. J. Funct. Foods 2015, 16, 256–264. [Google Scholar] [CrossRef]
  5. Baenas, N.; Piegholdt, S.; Schloesser, A.; Moreno, D.A.; García-Viguera, C.; Rimbach, G.; Wagner, A.E. Metabolic activity of radish sprouts derived isothiocyanates in Drosophila melanogaster. Int. J. Mol. Sci. 2016, 17, 251. [Google Scholar] [CrossRef] [PubMed]
  6. Ishida, M.; Kakizaki, T.; Morimitsu, Y.; Ohara, T.; Hatakeyama, K.; Yoshiaki, H.; Kohori, J.; Nishio, T. Novel glucosinolate composition lacking 4-methylthio-3-butenyl glucosinolate in Japanese white radish (Raphanus sativus L.). Theor. Appl. Genet. 2015, 128, 2037–2046. [Google Scholar] [CrossRef] [PubMed]
  7. Malik, M.S.; Riley, M.B.; Norsworthy, J.K.; Bridges, W., Jr. Variation of glucosinolates in wild radish (Raphanus raphanistrum) accessions. J. Agric. Food Chem. 2010, 58, 11626–11632. [Google Scholar] [CrossRef]
  8. Chinese Pharmacopoeia Commission. Pharmacopoeia of the People’s Republic of China; China Medical Science Press: Beijing, China, 2015; Volume 1, pp. 188–189. [Google Scholar]
  9. Shukla, S.; Chatterji, S.; Mehta, S.; Rai, P.K.; Singh, R.K.; Yadav, D.K.; Watal, G. Antidiabetic effect of Raphanus sativus root juice. Pharm. Biol. 2011, 49, 32–37. [Google Scholar] [CrossRef] [PubMed]
  10. Xu, X.; Wu, C.; Zhang, F.; Yao, J.; Fan, L.; Liu, Z.; Yao, Y. Comprehensive review of Plasmodiophora brassicae: Pathogenesis, pathotype diversity, and integrated control methods. Front. Microbiol. 2025, 16, 1531393. [Google Scholar] [CrossRef]
  11. Saharan, G.S.; Mehta, N.K.; Meena, P.D. The pathogen: Plasmodiophora brassicae. In Clubroot Disease of Crucifers: Biology, Ecology and Disease Management; Springer: Berlin/Heidelberg, Germany, 2021; pp. 87–120. [Google Scholar]
  12. Ma, Y.; Meng, Y.; Wang, Y.; Xu, L.; Chen, Y.; Yuan, Y.; Zhang, X.; Wang, L.; Wei, X.; Li, B.; et al. Research progress on clubroot disease in Brassicaceae crops–advances and perspectives. Veg. Res. 2024, 4, e022. [Google Scholar] [CrossRef]
  13. Javed, M.A.; Schwelm, A.; Zamani-Noor, N.; Salih, R.; Vañó, M.S.; Wu, J.; García, M.G.; Heick, T.M.; Luo, C.; Prakash, P. The clubroot pathogen Plasmodiophora brassicae: A profile update. Mol. Plant Pathol. 2022, 24, 89. [Google Scholar] [CrossRef]
  14. Ainsworth, G.C. Introduction to the History of Plant Pathology; Cambridge University Press: Cambridge, UK, 1981. [Google Scholar]
  15. Karling, J.S. The Plasmodiophorales, 2nd ed.; Hafner Publishing Company: New York, NY, USA, 1968. [Google Scholar]
  16. Dixon, G.R. The occurrence and economic impact of Plasmodiophora brassicae and clubroot disease. J. Plant Growth Regul. 2009, 28, 194–202. [Google Scholar] [CrossRef]
  17. Tewari, J.; Strelkov, S.; Orchard, D.; Hartman, M.; Lange, R.; Turkington, T. Identification of clubroot of crucifers on canola (Brassica napus) in Alberta. Can. J. Plant Pathol. 2005, 27, 143–144. [Google Scholar] [CrossRef]
  18. Chai, A.; Xie, X.; Shi, Y.; Li, B. Research status of clubroot (Plasmodiophora brassicae) on cruciferous crops in China. Can. J. Plant Pathol. 2014, 36 (Suppl. S1), 142–153. [Google Scholar] [CrossRef]
  19. Engqvist, L. Distribution of clubroot (Plasmodiophora brassicae Wor) in Sweden and the effect of infection on oil content of oilseed rape (Brassica napus L.). Sver. Utsädesförenings Tidskr. 1994, 104, 82–86. [Google Scholar]
  20. Hwang, S.; Ahmed, H.; Zhou, Q.; Turnbull, G.; Strelkov, S.; Gossen, B.; Peng, G. Effect of host and non-host crops on Plasmodiophora brassicae resting spore concentrations and clubroot of canola. Plant Pathol. 2015, 64, 1198–1206. [Google Scholar] [CrossRef]
  21. Botero-Ramirez, A.; Kirk, B.; Strelkov, S.E. Optimizing clubroot management and the role of canola cultivar mixtures. Pathogens 2024, 13, 640. [Google Scholar] [CrossRef] [PubMed]
  22. Shah, N.; Li, Q.; Xu, Q.; Liu, J.; Huang, F.; Zhan, Z.; Qin, P.; Zhou, X.; Yu, W.; Zhu, L. CRb and PbBa8. 1 synergically increases resistant genes expression upon infection of Plasmodiophora brassicae in Brassica napus. Genes 2020, 11, 202. [Google Scholar] [CrossRef]
  23. Hatakeyama, K.; Suwabe, K.; Tomita, R.N.; Kato, T.; Nunome, T.; Fukuoka, H.; Matsumoto, S. Identification and characterization of Crr1a, a gene for resistance to clubroot disease (Plasmodiophora brassicae Woronin) in Brassica rapa L. PLoS ONE 2013, 8, e54745. [Google Scholar] [CrossRef] [PubMed]
  24. Hatakeyama, K.; Yuzawa, S.; Tonosaki, K.; Takahata, Y.; Matsumoto, S. Allelic variation of a clubroot resistance gene (Crr1a) in Japanese cultivars of Chinese cabbage (Brassica rapa L.). Breed. Sci. 2022, 72, 115–123. [Google Scholar] [CrossRef]
  25. Yang, Z.; Jiang, Y.; Gong, J.; Li, Q.; Dun, B.; Liu, D.; Yin, F.; Yuan, L.; Zhou, X.; Wang, H. R gene triplication confers European fodder turnip with improved clubroot resistance. Plant Biotechnol. J. 2022, 20, 1502–1517. [Google Scholar] [CrossRef]
  26. Wang, W.; Qin, L.; Zhang, W.; Tang, L.; Zhang, C.; Dong, X.; Miao, P.; Shen, M.; Du, H.; Cheng, H. WeiTsing, a pericycle-expressed ion channel, safeguards the stele to confer clubroot resistance. Cell 2023, 186, 2656–2671.e18. [Google Scholar] [CrossRef]
  27. Kamei, A.; Tsuro, M.; Kubo, N.; Hayashi, T.; Wang, N.; Fujimura, T.; Hirai, M. QTL mapping of clubroot resistance in radish (Raphanus sativus L.). Theor. Appl. Genet. 2010, 120, 1021–1027. [Google Scholar] [CrossRef] [PubMed]
  28. Gan, C.; Deng, X.; Cui, L.; Yu, X.; Yuan, W.; Dai, Z.; Yao, M.; Pang, W.; Ma, Y.; Yu, X. Construction of a high-density genetic linkage map and identification of quantitative trait loci associated with clubroot resistance in radish (Raphanus sativus L.). Mol. Breed. 2019, 39, 116. [Google Scholar] [CrossRef]
  29. Gan, C.; Yan, C.; Pang, W.; Cui, L.; Fu, P.; Yu, X.; Qiu, Z.; Zhu, M.; Piao, Z.; Deng, X. Identification of novel locus RsCr6 related to clubroot resistance in radish (Raphanus sativus L.). Front. Plant Sci. 2022, 13, 866211. [Google Scholar] [CrossRef]
  30. Sun, T.; Zhang, Y. MAP kinase cascades in plant development and immune signaling. EMBO Rep. 2022, 23, e53817. [Google Scholar] [CrossRef] [PubMed]
  31. Zhang, M.; Zhang, S. Mitogen-activated protein kinase cascades in plant signaling. J. Integr. Plant Biol. 2022, 64, 301–341. [Google Scholar] [CrossRef]
  32. Yadav, V.; Wang, Z.; Wei, C.; Amo, A.; Ahmed, B.; Yang, X.; Zhang, X. Phenylpropanoid pathway engineering: An emerging approach towards plant defense. Pathogens 2020, 9, 312. [Google Scholar] [CrossRef]
  33. Li, Q.; Liu, Z.; Jiang, Z.; Jia, M.; Hou, Z.; Dou, D.; Yu, J. Phenylalanine metabolism-dependent lignification confers rhizobacterium-induced plant resistance. Plant Physiol. 2025, 197, kiaf016. [Google Scholar] [CrossRef]
  34. Gogoi, K.; Gogoi, H.; Borgohain, M.; Saikia, R.; Chikkaputtaiah, C.; Hiremath, S.; Basu, U. The molecular dynamics between reactive oxygen species (ROS), reactive nitrogen species (RNS) and phytohormones in plant’s response to biotic stress. Plant Cell Rep. 2024, 43, 263. [Google Scholar] [CrossRef]
  35. Gao, M.; He, Y.; Yin, X.; Zhong, X.; Yan, B.; Wu, Y.; Chen, J.; Li, X.; Zhai, K.; Huang, Y. Ca2+ sensor-mediated ROS scavenging suppresses rice immunity and is exploited by a fungal effector. Cell 2021, 184, 5391–5404.e17. [Google Scholar] [CrossRef]
  36. Anders, S.; Huber, W. Differential expression analysis for sequence count data. Nat. Preced. 2010. [Google Scholar] [CrossRef]
  37. Chen, S. Ultrafast one-pass FASTQ data preprocessing, quality control, and deduplication using fastp. Imeta 2023, 2, e107. [Google Scholar] [CrossRef] [PubMed]
  38. Kim, D.; Paggi, J.M.; Park, C.; Bennett, C.; Salzberg, S.L. Graph-based genome alignment and genotyping with HISAT2 and HISAT-genotype. Nat. Biotechnol. 2019, 37, 907–915. [Google Scholar] [CrossRef] [PubMed]
  39. Xu, L.; Wang, Y.; Dong, J.; Zhang, W.; Tang, M.; Zhang, W.; Wang, K.; Chen, Y.; Zhang, X.; He, Q. A chromosome-level genome assembly of radish (Raphanus sativus L.) reveals insights into genome adaptation and differential bolting regulation. Plant Biotechnol. J. 2023, 21, 990–1004. [Google Scholar] [CrossRef] [PubMed]
  40. Liao, Y.; Smyth, G.K.; Shi, W. The Subread aligner: Fast, accurate and scalable read mapping by seed-and-vote. Nucleic Acids Res. 2013, 41, e108. [Google Scholar] [CrossRef]
  41. Love, M.; Anders, S.; Huber, W. Differential analysis of count data–the DESeq2 package. Genome Biol. 2014, 15, 10–1186. [Google Scholar]
  42. Yu, G. Thirteen years of clusterProfiler. Innovation 2024, 5, 100722. [Google Scholar] [CrossRef]
  43. Taj, G.; Giri, P.; Tasleem, M.; Kumar, A. MAPK signaling cascades and transcriptional reprogramming in plant–pathogen interactions. In Approaches to Plant Stress and Their Management; Springer: Berlin/Heidelberg, Germany, 2014; pp. 297–316. [Google Scholar]
  44. Torres, M.A.; Jones, J.D.; Dangl, J.L. Reactive oxygen species signaling in response to pathogens. Plant Physiol. 2006, 141, 373–378. [Google Scholar] [CrossRef]
  45. Chi, Y.; Yang, Y.; Zhou, Y.; Zhou, J.; Fan, B.; Yu, J.-Q.; Chen, Z. Protein–protein interactions in the regulation of WRKY transcription factors. Mol. Plant 2013, 6, 287–300. [Google Scholar] [CrossRef]
  46. Lorang, J. Necrotrophic exploitation and subversion of plant defense: A lifestyle or just a phase, and implications in breeding resistance. Phytopathology 2019, 109, 332–346. [Google Scholar] [CrossRef]
  47. Huot, B.; Yao, J.; Montgomery, B.L.; He, S.Y. Growth–defense tradeoffs in plants: A balancing act to optimize fitness. Mol. Plant 2014, 7, 1267–1287. [Google Scholar] [CrossRef]
  48. Van der Does, D.; Leon-Reyes, A.; Koornneef, A.; Van Verk, M.C.; Rodenburg, N.; Pauwels, L.; Goossens, A.; Körbes, A.P.; Memelink, J.; Ritsema, T. Salicylic acid suppresses jasmonic acid signaling downstream of SCFCOI1-JAZ by targeting GCC promoter motifs via transcription factor ORA59. Plant Cell 2013, 25, 744–761. [Google Scholar] [CrossRef] [PubMed]
  49. Ma, Y.; Choi, S.R.; Wang, Y.; Chhapekar, S.S.; Zhang, X.; Wang, Y.; Zhang, X.; Zhu, M.; Liu, D.; Zuo, Z. Starch content changes and metabolism-related gene regulation of Chinese cabbage synergistically induced by Plasmodiophora brassicae infection. Hortic. Res. 2022, 9, uhab071. [Google Scholar] [CrossRef] [PubMed]
Figure 1. The root phenotypes of T14 and T6 at 30 days after P. brassica inoculation.
Horticulturae 11 00777 g001
Figure 2. The number of DEGs of T14 (A) and T6 (B) at 10, 20, and 30 days post inoculation (DPI).
Horticulturae 11 00777 g002
Figure 3. Venn diagrams represented common and specific up and down DEGs identified at 10, 20, and 30 DPI in T14 (A) and T6 (B). The black numbers represent the number of up-regulated genes, and the red numbers represent the number of down-regulated genes.
Horticulturae 11 00777 g003
Figure 4. Top 20 KEGG pathways enriched in DEGs for T14. The size of each circle represents the number of DEGs, and the rich factor was calculated using the number of enriched genes divided by the total number of background genes in the corresponding pathway. (A,C,E), down-regulated DEGs of T14 at 10, 20, and 30 DPI. (B,D,F) up-regulated DEGs of T14 at 10, 20, and 30 DPI. The q value was calculated using the Benjamini–Hochberg correction.
Horticulturae 11 00777 g004
Figure 5. Top 20 KEGG pathways enriched in DEGs for T6. The size of each circle represents the number of DEGs, and the rich factor was calculated using the number of enriched genes divided by the total number of background genes in the corresponding pathway. (A,C,E), down-regulated DEGs of T6 at 10, 20, and 30 DPI. (B,D,F) up-regulated DEGs of T6 at 10, 20, and 30 DPI. The q value was calculated using the Benjamini–Hochberg correction.
Horticulturae 11 00777 g005
Figure 6. Heatmap of DEGs related to resistance genes (A), MAPK signaling (B), and jasmonic acid (C) of two varieties (T14 and T6) at 10, 20, and 30 DPI. The intensity of the color represents the level of expression.
Horticulturae 11 00777 g006
Figure 7. Heatmap of DEGs related to plant hormone signal transduction (A), Ca2+ (B), and transcription factors WRKYs (C) of two varieties (T14 and T6) at 10, 20, and 30 DPI. The intensity of the color represents the level of expression.
Horticulturae 11 00777 g007
Figure 8. Validation of RNA–seq data by RT–qPCR. Blue lines represent the relative gene expression levels as measured by RT–qPCR (left y-axis), while orange lines indicate the log2 fold change (log2FC) derived from RNA-Seq read counts (right y-axis). Error bars denote the standard error of the mean (n = 3).
Horticulturae 11 00777 g008
Table 1. Disease index of 52 radish lines after inoculation with P. brassicae.
NamePlant NO. aDI bPhenotype cNamePlant NO.DIPhenotype
T1103.40 ± 1.34S19_1291.33 ± 0.82S
T2100.67 ± 1.63S19_16103.83 ± 0.41S
T3102.00 ± 2.83SMYB0191.80 ± 1.48S
T5103.17 ± 1.60SMYB02103.60 ± 0.89S
T690.00 ± 0.00RYZ-1103.22 ± 1.39S
T7104.00 ± 0.00SYZ-2102.27 ± 1.74S
T894.00 ± 0.00SYZ-383.40 ± 1.26S
T9102.67 ± 2.07SYZ-4103.10 ± 1.66S
T1083.25 ± 1.50SYZ-5102.88 ± 1.81S
T11100.00 ± 0.00RYZ-6104.00 ± 0.00S
T13102.25 ± 1.71SYZ-7103.83 ± 0.41S
T14104.00 ± 0.00SYZ-8100.00 ± 0.00R
T15102.00 ± 1.90SYZ-9101.23 ± 1.92S
T16102.83 ± 1.47SYZ-1092.88 ± 1.81S
T17103.60 ± 0.55SYZ-11100.00 ± 0.00R
T2083.50 ± 1.00SYZ-12102.62 ± 1.76S
T21103.20 ± 1.79SYZ-1392.14 ± 1.68S
T2293.40 ± 1.34SYZ-14103.82 ± 0.60S
T23102.67 ± 2.07SYZ-15103.86 ± 0.38S
T24100.20 ± 0.45SYZ-1692.56 ± 1.51S
T2590.80 ± 1.79SYZ-17103.40 ± 0.97S
T26100.20 ± 0.45SYZ-1894.00 ± 0.00S
T3090.00 ± 0.00RYZ-19103.43 ± 1.13S
T31100.83 ± 1.60SYZ-2094.00 ± 0.00S
T3390.67 ± 1.63SYZ-21104.00 ± 0.00S
T35100.00 ± 0.00RYZ-22103.17 ± 1.33S
Note: a The number of plants used in the experiments was consistent across each radish line; b DI: disease index; c R: resistance; S: susceptible.
Disclaimer/Publisher’s Note: The statements, opinions and data contained in all publications are solely those of the individual author(s) and contributor(s) and not of MDPI and/or the editor(s). MDPI and/or the editor(s) disclaim responsibility for any injury to people or property resulting from any ideas, methods, instructions or products referred to in the content.

