Article

Non-Destructive Detection of Current Internal Disorders and Prediction of Future Appearance in Mango Fruit Using Portable Vis-NIR Spectroscopy

by
Jasciane da Silva Alves
1,
Bruna Parente de Carvalho Pires
2,
Luana Ferreira dos Santos
2,
Tiffany da Silva Ribeiro
2,
Kerry Brian Walsh
3,
Ederson Akio Kido
1 and
Sergio Tonetto de Freitas
2,*
1
Biosciences Center, Federal University of Pernambuco, RENORBIO, Recife 50670-901, PE, Brazil
2
Brazilian Agricultural Research Corporation, Embrapa, Petrolina 56302-970, PE, Brazil
3
Institute for Future Farming Systems, Central Queensland University, Rockhampton, QLD 4702, Australia
*
Author to whom correspondence should be addressed.
Horticulturae 2025, 11(7), 759; https://doi.org/10.3390/horticulturae11070759
Submission received: 5 May 2025 / Revised: 11 June 2025 / Accepted: 18 June 2025 / Published: 1 July 2025
(This article belongs to the Section Postharvest Biology, Quality, Safety, and Technology)

Abstract

A method based on Vis-NIR spectroscopy and machine learning-based modeling for non-destructive detection of the internal disorders of black flesh, spongy tissue, jelly seed, and soft nose in mango fruit was developed using the vis-NIR spectra of intact mango fruit of three cultivars sourced from three orchards in each of the two seasons, with spectra collected both at harvest and after storage. After spectra were acquired of the stored fruit, the fruit cheeks were cut longitudinally to allow visual assessment of the incidence of the internal disorders. Five models were evaluated: two tree-based algorithms (J48 and random forest), one neural network (multilayer perceptron, MLP), and two SVM training algorithms (sequential minimal optimization, SMO, and LibSVM). The models were evaluated using a tenfold cross-validation approach. Non-destructive discrimination of health from all disordered and healthy fruit from fruit with specific disorders was achieved with an accuracy ranging from 72.3 to 97.0% when using spectra collected at harvest and 63.7 to 96.2% when using spectra collected after ripening. No one machine learning algorithm out-performed other methods—for spectra collected at harvest, the highest discrimination accuracy was achieved with RF and MLP for black flesh, J48 for spongy tissue, and LibSVM for soft nose and jelly seed. For spectra collected of stored fruit, the highest discrimination accuracy was achieved with SMO for jelly seed and RF for soft nose. A recommendation is made for the consideration of ensemble models in future. The ability to predict the development of the disorder using spectra of at-harvest fruit offers the potential to guide postharvest practices and reduce incidence of internal disorders in mangoes.

1. Introduction

Mango (Mangifera indica L.) is a highly popular tropical fruit produced worldwide, with about 55 million tons produced per year across 25 countries [1]. The six largest producers are India, Indonesia, China, Pakistan, Mexico, and Brazil [2]. Several internal physiological disorders occur in mango fruit, including spongy tissue, black flesh, jelly seed, and soft nose [3,4], as recently reviewed by [5]. Spongy tissue is characterized by spongy flesh with white to black spots, slightly desiccated, which may or may not present air pockets. The ‘black flesh’ disorder is characterized by the dark-brown to black color of the inner flesh around the seed. Jelly seed is characterized by water-soaked and jelly-like tissue around the seed that eventually becomes brownish. Soft nose is characterized by internal rupture of the mesocarp on the ventral side and towards the apex of the fruit.
These disorders are generally first manifest in the inner mesocarp, with external (skin) symptoms developing only in extremis, following development of the disorder through the mesocarp. The symptoms may be mild or absent in fruit at harvest, developing in severity during ripening. Thus, fruit may be packed and shipped before the disorder is evident. USDA specifications require that there are no more than 2% of fruit with a disorder in a consignment, with the inspection involving the destructive sampling of, typically, 25 fruit [6]. Thus, the presence of one defect fruit in the sample lot (4%) could result in rejection of a consignment. Furthermore, consumers can only identify the presence of a disorder after purchase upon cutting the fruit for consumption, resulting in loss of repeat purchase.
Visible and near-infrared spectroscopy (Vis-NIR) is now routinely used in quantitative non-invasive assessment of mango dry matter content (DMC) and is also commercially used with discriminant techniques for the detection of some internal disorders of fruit based on Vis-NIR spectra, e.g., apple internal browning (as reviewed in [7]). Vis-NIR has also been recommended for the identification of fruit susceptible to the future development of an internal disorder. For example, [8] reported prediction of kiwifruit developing internal rots in storage using spectra collected of fruit at harvest. The rots were associated with chill injury incurred in storage, and susceptibility to chill injury was related to the maturity of fruit, and thus to the DMC of the fruit.
Similar associations between fruit maturity, internal quality, and susceptibility to postharvest disorders have also been reported for other fruit species such as melon and citrus. In melon, Vis/NIR/SWIR spectroscopy combined with chemometric modeling has proven effective for assessing fruit nutritional composition, providing a non-destructive means to monitor internal attributes related to ripening and quality [9]. For citrus, NIR spectroscopy integrated with ensemble learning strategies enabled the simultaneous, non-destructive prediction of multiple internal quality traits, reinforcing the technique’s potential in postharvest sorting and grading operations [10].
Instrumentation considerations include wavelength range and optical geometry [7]. In summary, the Herschel region (750–1100 nm) is preferred for its higher effective penetration through fruit tissue (due to lower water absorption coefficients in this wavelength range). A reflection geometry, in which the illuminated area of the sample is viewed by the detector, has proportionally more light received by the detector originating from shallow layers of the sample than partial transmission (also referred to as ‘interaction’) or full transmission geometries. Full transmission systems, however, are not practical for large, seeded fruit, due to the low amount of light passing the whole fruit. An interaction geometry using the Herschel spectral region is therefore recommended for use in the assessment of the internal attributes of mango fruit.
The chemometric techniques used with near infrared spectra also evolved in recent years, as reviewed by [11]. Discriminant analysis techniques evolved from partial least square discriminant analysis (PLS-DA) [12] and canonical discriminant analysis [8] to techniques such as artificial neural networks [13]. A common failing in the application of these techniques has been the use of a single harvest population subset to calibrate and test sets [7]. As a biological product, fruit will vary with growing conditions, e.g., in cell size and in chemical composition. It is therefore imperative that such studies include an attempt to demonstrate model robustness across populations from different harvest events, be that varying in time or location.
Several studies reported on the use of Vis-NIR to monitor susceptibility and incidence of internal physiological disorders in mango fruit. Hyperspectral imaging (650–1080 nm) using reflection optical geometry was used to detect surface bruising of mango fruit caused by mechanical impact [14]. This approach, involving reflection geometry, is not expected to be relevant to the assessment of disorders located further into the fruit flesh. However, SIMCA based discrimination of healthy mango fruit from fruit with a spongy tissue disorder was achieved using spectra (350–2500 nm) collected using a reflection geometry, with best results achieved using a 670–750 nm or a 900–970 nm range [15]. These wavelength ranges are consistent with discrimination based on either chlorophyll content or water content, with assessment of these attributes in the skin and near mesocarp, given the use of reflection geometry. The study was based on one cultivar of mango, with at least four harvest populations. Fruit from the combined populations were randomly assigned to training and test sets.
One study [16] reported on the use of 720–975 nm spectra collected of intact mango fruit using an interaction geometry for assessment of dry matter content (DMC), with use for indirect discrimination on the presence of the internal disorder of ‘flesh cavity with white patches’. The incidence and severity of disorder was higher in earlier harvested fruit, and fruit with <15% DM (i.e., less mature fruit and thus fruit with higher chlorophyll levels) (assessed with a F750, interaction geometry, 300–1100 nm). However, the NIR assessment was made of only one harvest population, limiting the generalizability of this conclusion. For example, DMC at harvest maturity can vary according to growing conditions [7].
Two studies report on the use of NIR spectra of intact mango fruit collected using an interaction geometry for direct detection of internal disorders. Both studies were based on two harvest populations of fruit, with random assignment of fruit to training and test sets. An artificial neural network (ANN) model based on 4000 to 12,500 cm−1 (800–2500 nm) spectra (collected using a bench-top FT-NIR spectrometer) was reported to achieve over 90% prediction accuracy in discrimination of ‘internal breakdown disorder’ and ‘black-streaked vascular tissue’ [17]. Linear discriminative analysis (LDA) or logistic analysis using 400–1100 nm spectra collected after ripening and immediately before destructive assessment of the presence of the disorder achieved an accuracy of up to 76% in the discrimination of either jelly seed or black flesh from healthy fruit [18]. Moreover, an accuracy of up to 65% was achieved using spectra collected at the time of harvest, before fruit ripening. An ability to predict the future appearance of disorders has interesting potential uses in the management of these disorders.
The current study aims to contribute to the development of a non-destructive method to detect internal disorders in mango fruit using Vis-NIR spectroscopy, extending previous work with a focus to (a) predict multiple internal disorders as opposed to a single class of disorder, (b) predict the future occurrence of disorders manifesting in ripened fruit using spectra collected on the fruit at commercial harvest, and (c) use fruit from multiple harvest populations, varying in cultivar, orchard, and season.

2. Materials and Methods

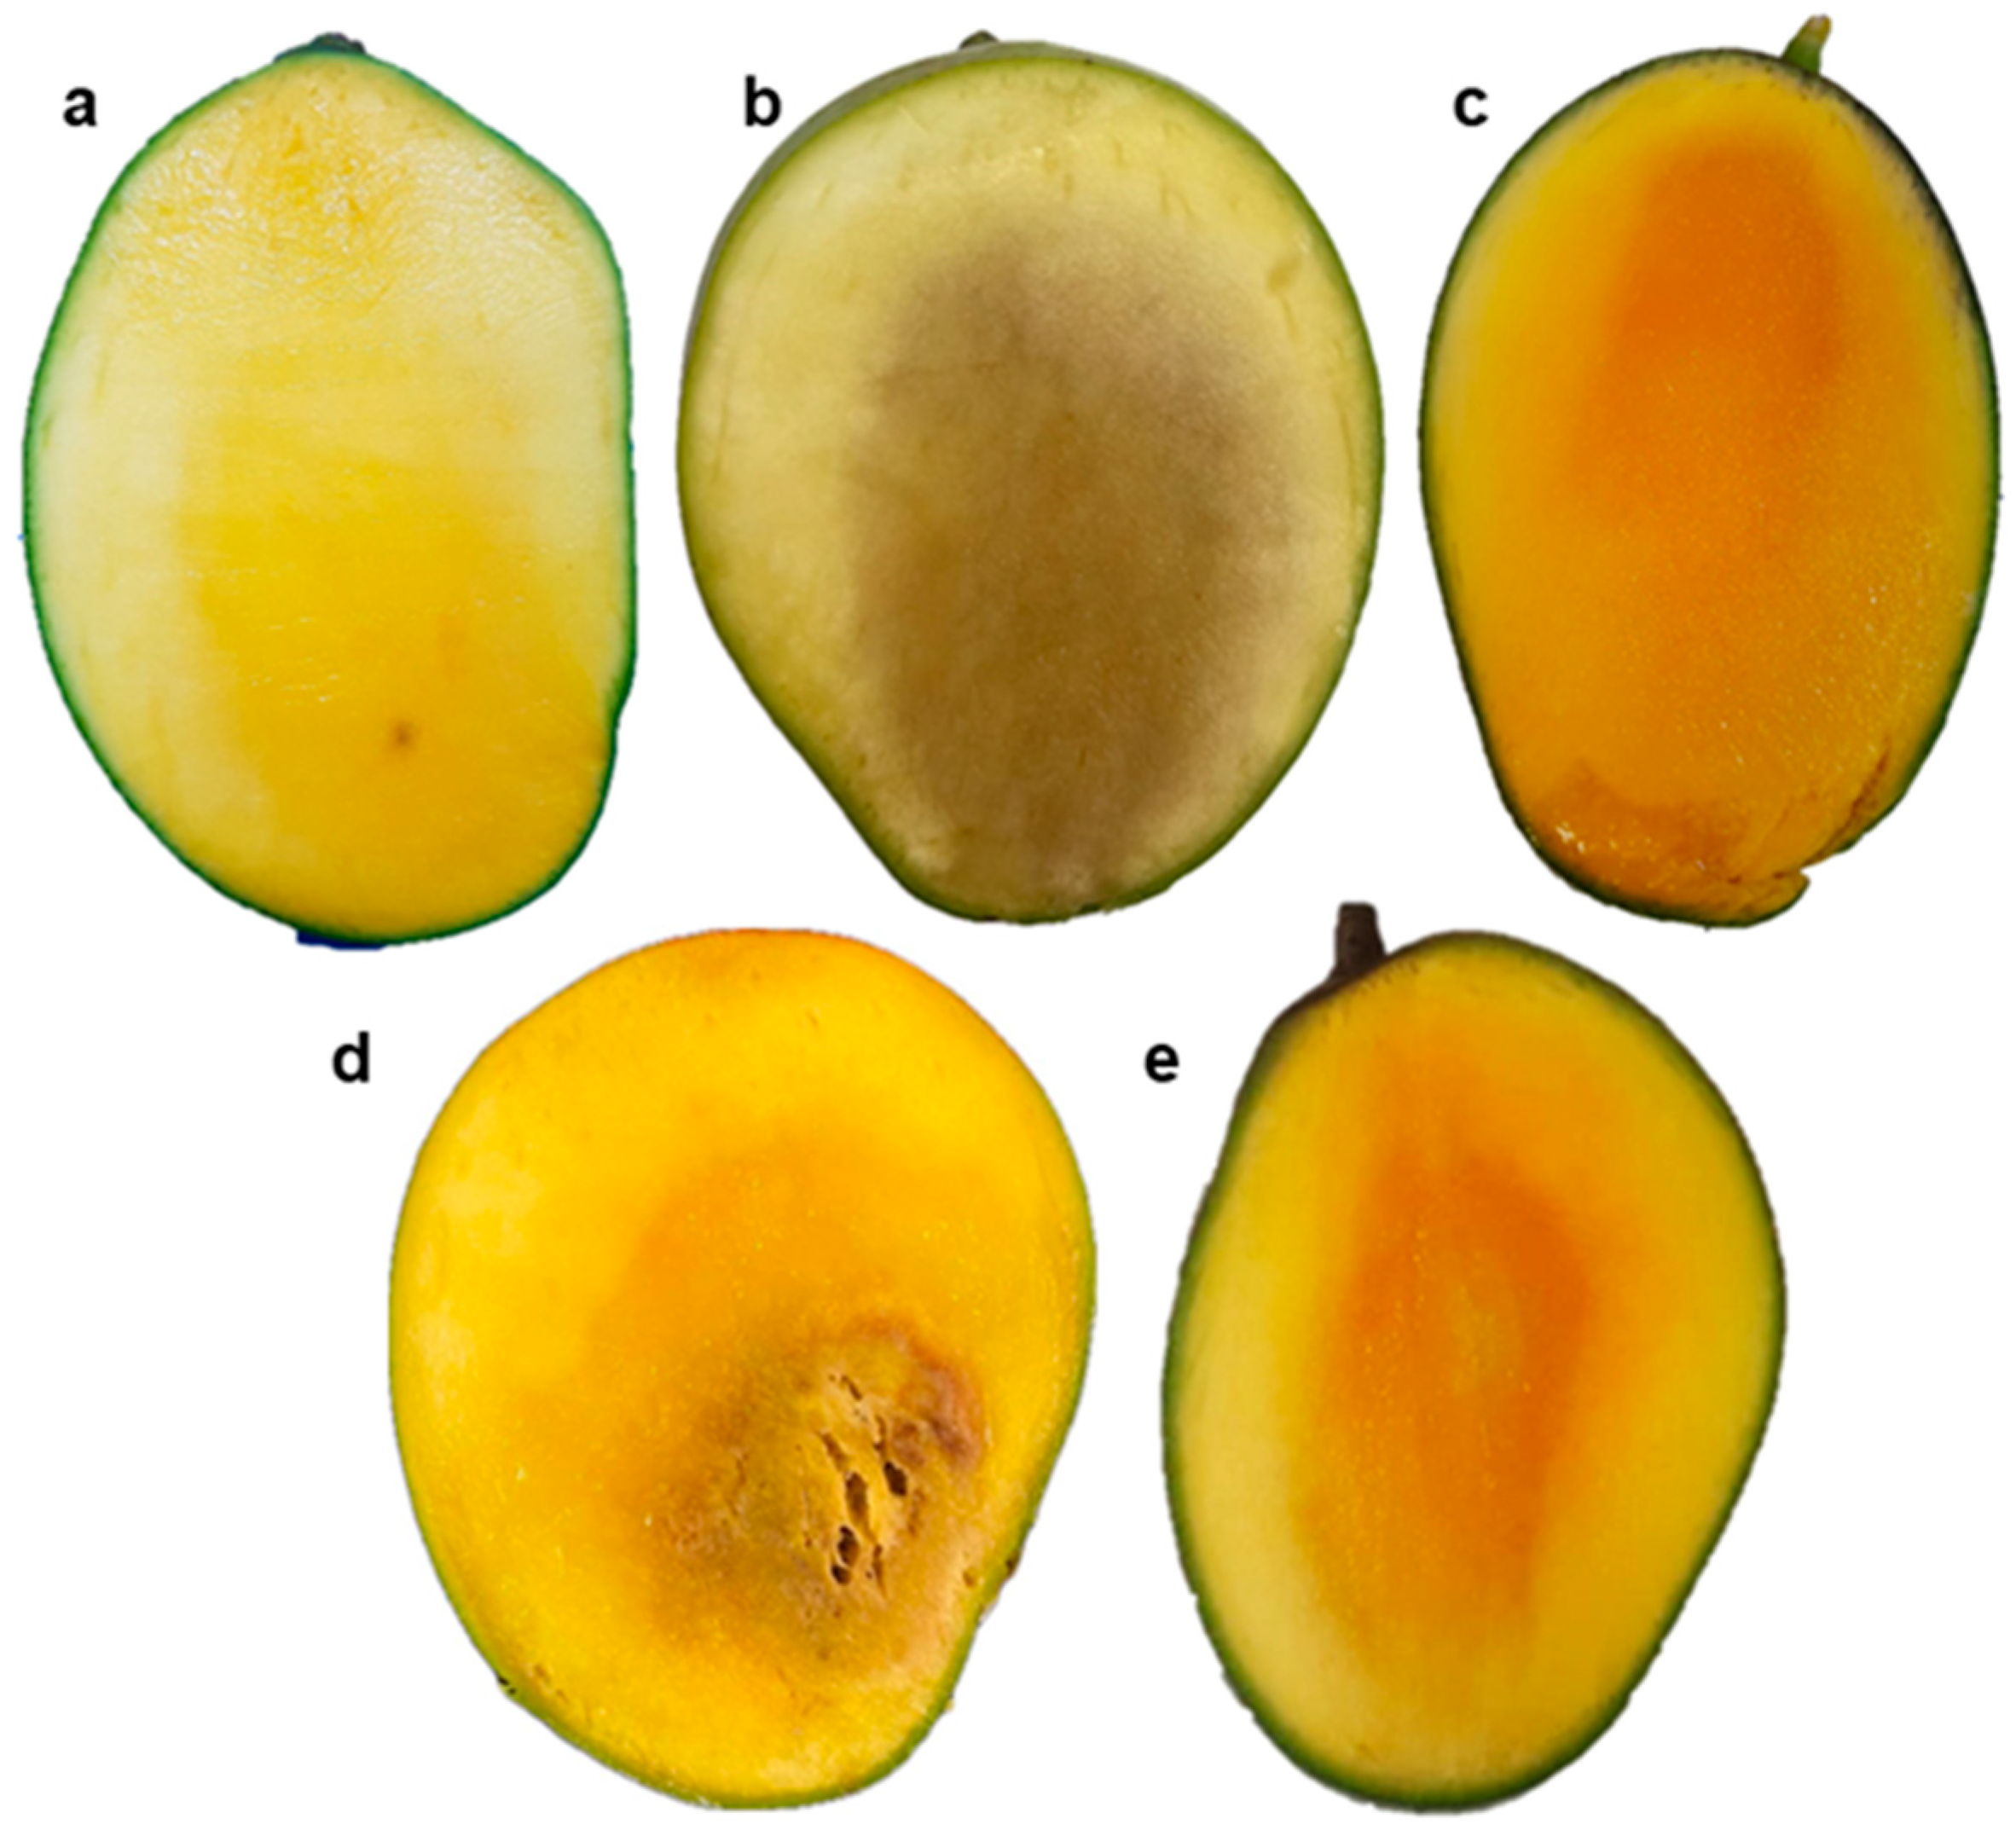
2.1. Fruit and Disorder Assessment

Mango (Mangifera indica L.) cultivars Palmer, Keitt, and Tommy Atkins were produced in two growing seasons on the Agropecuária Roriz Dantas, Argofruta, and IBACEM commercial orchards in São Francisco Valley, Brazil. Fruits were harvested at physiological maturity, as characterized by full shoulders and a yellowing of the flesh (following specifications of National Mango Board, 2024) [19]. At the time of each harvest event, i.e., per cultivar, location, and season, five fruit were cut longitudinally and visually assessed for flesh color to confirm maturity status. No symptoms of internal physiological disorders were present in these destructive assessments. After harvest, the fruit were transported to the Postharvest Laboratory at the tropical semi-arid Embrapa, Petrolina, PE, Brazil, where the fruit were sanitized and stored at 12 °C (±1 °C). After 20 days, 10 fruit of each consignment were destructively assessed for firmness using a digital penetrometer analyzer equipped with a 6 mm diameter probe (TA.XT Plus—Stable Micro Systems, Godalming, UK). If average flesh firmness was ≤15 N, fruit were warmed to 24 °C (±1 °C) before collection of spectra. Each fruit side was treated as an independent sample.

2.2. Vis-NIR Spectra Acquisition

Spectra were acquired in the equatorial region of each intact fruit at the time of harvest and again after ripening during storage. A handheld spectrometer (F-750 Produce Quality Meter, Felix Instruments, Camas, WA, USA) was utilized. This device employs the MMS1 spectrometer (Zeiss, Oberkochen, Germany), which has an optical resolution (full width half maximum, FWHM) of approximately 10 nm and a pixel resolution of approximately 3.3 nm across the wavelength range 330 to 1100 nm. The spectrophotometer utilizes an interaction geometry, with illumination of an area of approximately 5 cm2.
Ripened fruit with externally visible decay symptoms were excluded from the study. Spectra data were collected from 1454 fruit sides (727 fruit) at harvest and 1397 fruit sides after ripening, following removal of fruit sides with external visible disorder symptoms (Table 1).

2.3. Incidence of Disorders

Following the collection of spectra, each side of the ripened fruit was cut longitudinally and close to the seed (Figure 1). The exposed cheek was visually assessed for the incidence of the internal physiological disorders of spongy tissue, black flesh, jelly seed, and soft nose (Figure 1). Fruit exhibiting more than one physiological disorder were excluded from the study.

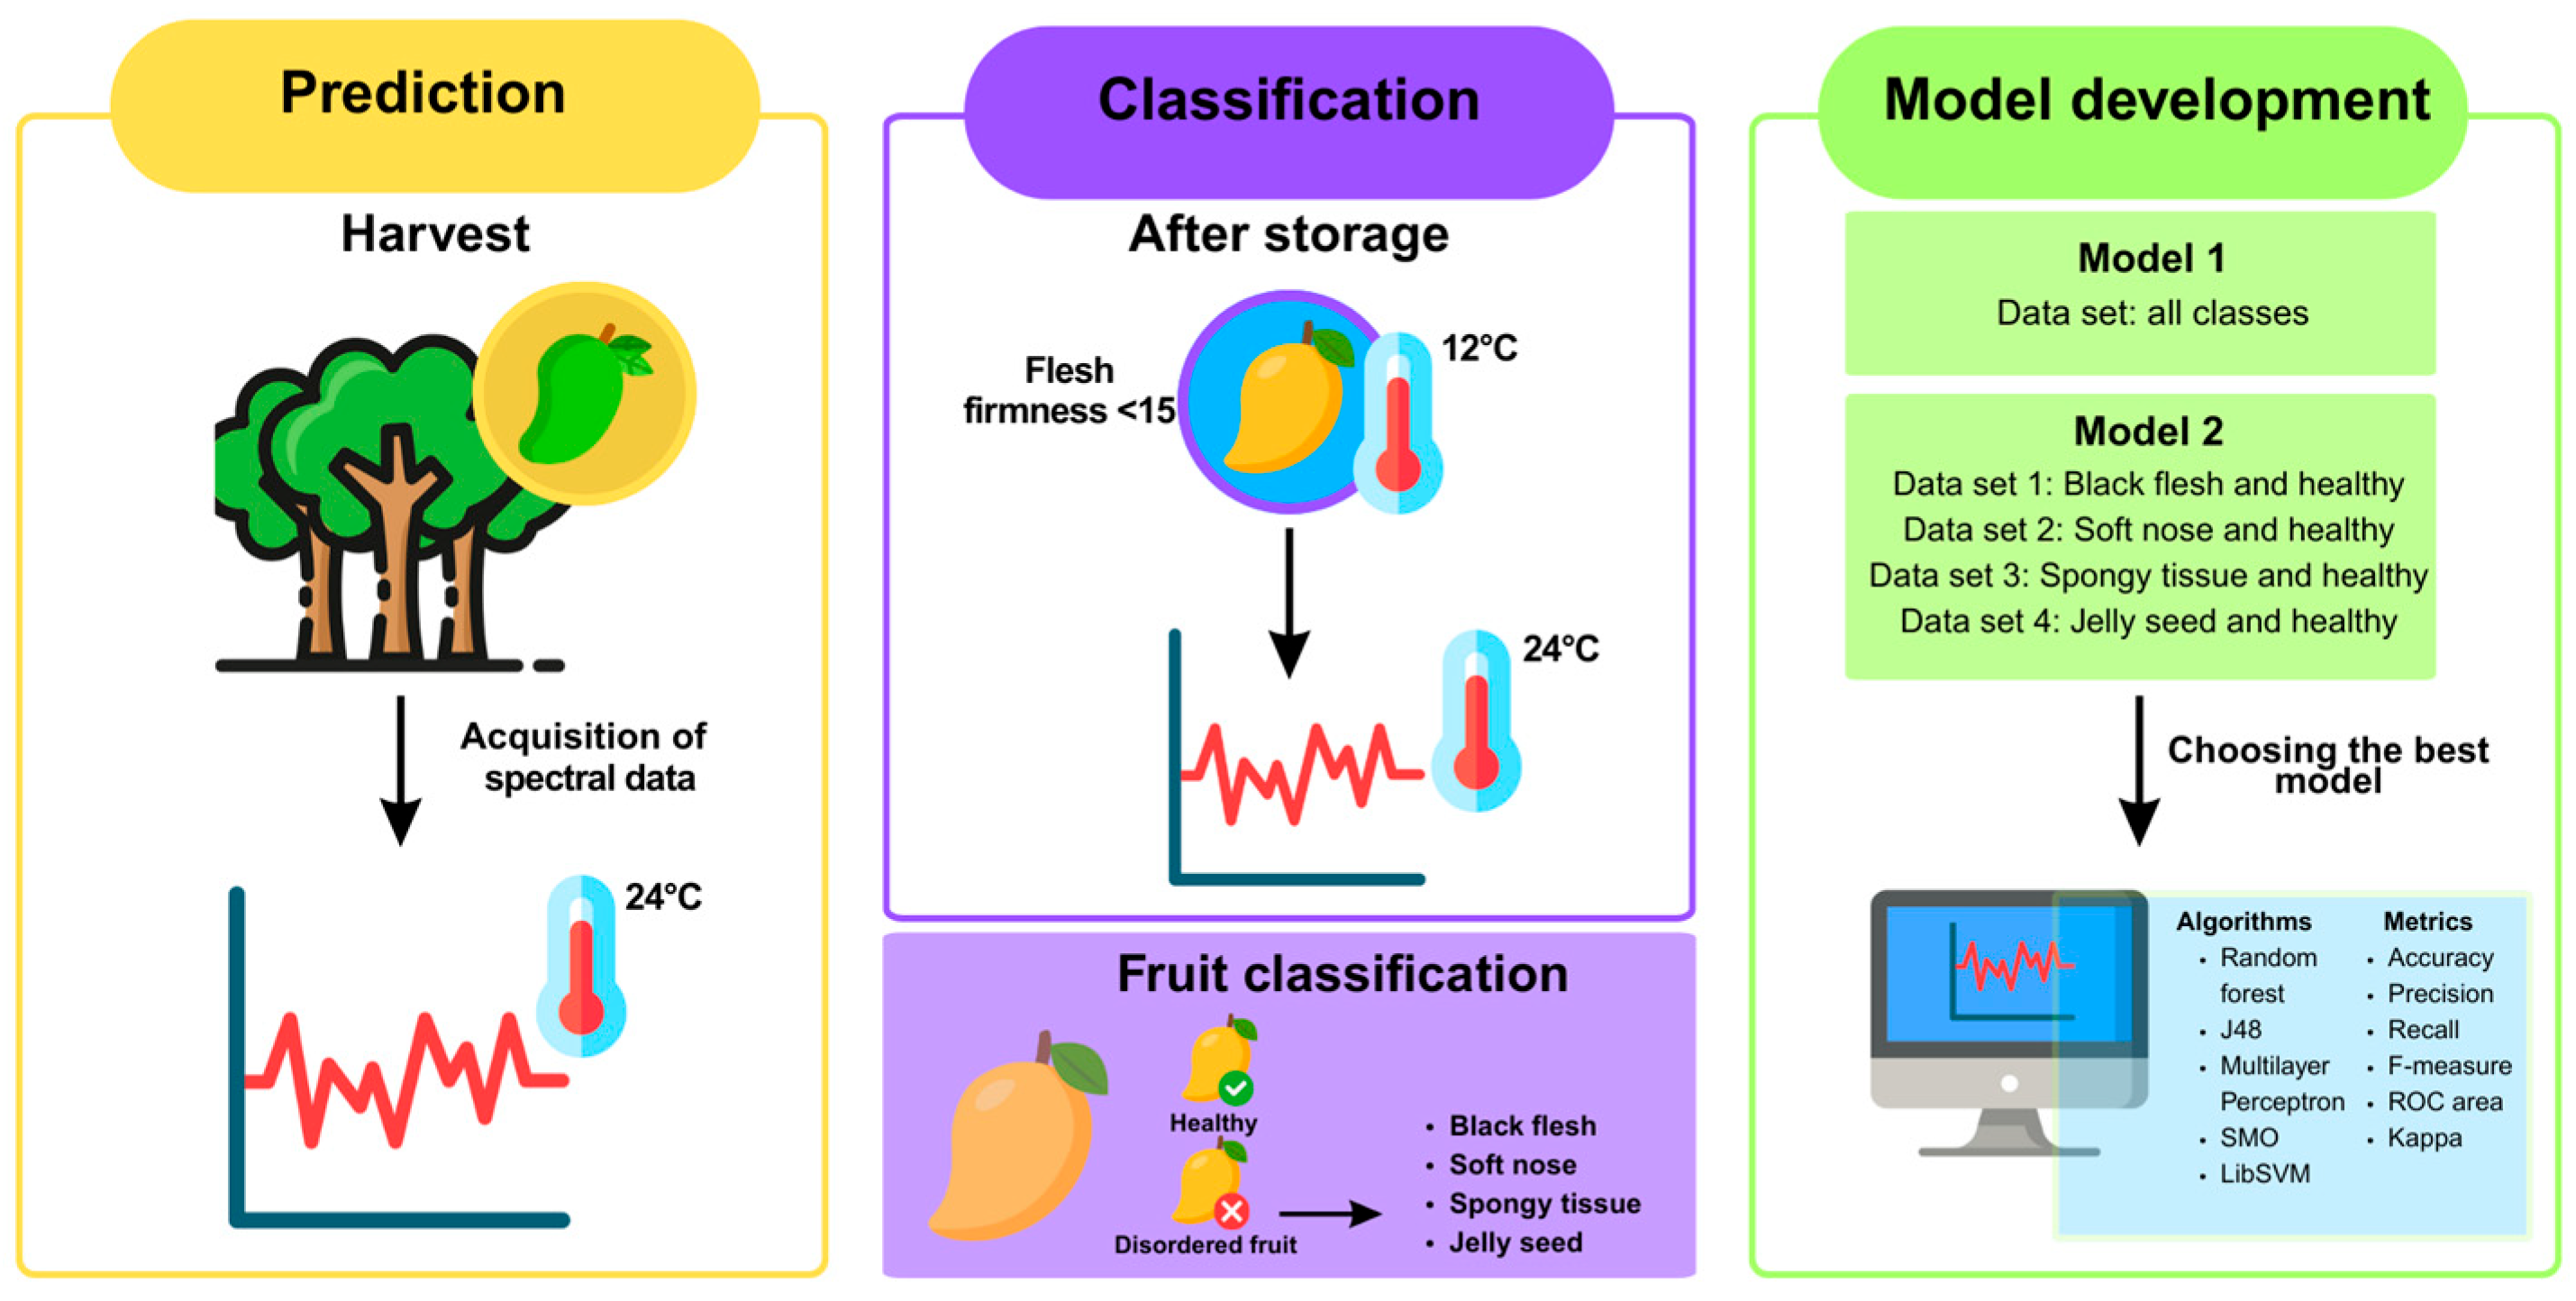
2.4. Model Development

Absorbance data were subject to second derivative pre-processing using Model Builder software (version v1 3.0.117) (Felix Instruments, Camas, WA, USA). Principal component analysis (PCA) was then applied to assess the potential for grouping samples based on their classification as healthy, jelly seed, soft nose, black flesh, and spongy tissue, using The Unscrambler X version 10.4 (CAMO Software, Oslo, Norway). The data were exported in comma-separated values (CSV) and attribute relation file format (ARFF) for further analysis using WEKA 3.9 (Machine Learning Group, University of Waikato) [20].
Discriminant models were developed for (i) two classes: healthy (n = 349) and all internal disorders (n = 1048), and (ii) healthy versus each specific internal disorder (Figure 2). Models were developed both using spectra collected at harvest and using spectra collected after ripening, with the reference assessment of disorder made after ripening in both cases. Models were evaluated using a cross-validation process that involved 10 folds, i.e., 10 combinations of training and test groups using a 90:10 split and random assignments using sampling without replacement, such that the entire data set was represented in testing [21,22,23].
Two discriminative algorithm trees (J48 and random forest) and three function group algorithms (SMO, LibSVM, and multilayer perceptron) were trialed. Tree algorithms are machine learning models used for both classification and regression, with the model based on dividing the data into different nodes, forming a hierarchical structure similar to a tree. J48 creates a single tree, while random forest uses a more robust ensemble learning technique involving multiple tree predictors to improve accuracy and reduce overfitting [24,25]. Function group algorithms are also widely used in classification and regression. SMO and LibSVM train support vector machines (SVMs) that aim to find a hyperplane that maximizes the margin between classes in a high-dimensional space [26,27]. Multilayer perceptron (MLP) is a type of artificial neural network composed of multiple layers of interconnected neurons which is capable of learning complex representations of data [28].
Model performance was documented in terms of average accuracy, precision, recall, F-measure, receiver operating characteristics curve (ROC), and Kappa statistics (Equations (1)–(6)). The three best-performing algorithms were compared with Venn diagrams generated in Venny 2.1 [29].
A c c u r a c y = ( T P + T N ) T P + T N + F N + F P
P r e c i s i o n = T P T P + F P
R e c a l l = T P T P + F N
F m e a s u r e = 2 × p r e c i s i o n × r e c a l l ( p r e c i s i o n + r e c a l l )
R O C   a r e a = a r e a u n d e r T P R v s . F P R c u r v e
K a p p a = ( T P + F P ) ( T P + F N ) T P + F P T P + F N T N + F P T N + F N + T N + F P ( T N + F N ) ( T P + F P ) T P + F N T N + F P T N + F N ( T P + F P ) ( T P + F N ) ( T N + F P ) ( T N + F N )
where TP = true positive; TN = true negative; FP = false positive; and FN = false negative. The accuracy indicates the proportion of correctly predicted samples to the total number of samples. Precision indicates the number of correct positive predictions divided by the total number of positive predictions. Recall indicates the measure of positive predictions that are correctly classified. F-measure indicates the harmonic mean between recall and precision values [30,31,32]. ROC indicates a curve that considers the true positive rate on the y-axis and the false positive rate on the x-axis [30]. Kappa statistics was used in addition to classification accuracy because it takes into account the assignment of classes by random chance. A Kappa value of 0 means no agreement between the model and the actual classification, 0.01 to 0.20 is none to slight, 0.21 to 0.40 is fair, 0.41 to 0.60 is reasonable, 0.61 to 0.80 is substantial, 0.81 to 0.99 is almost perfect, and 1.00 is perfect agreement [31,33].

3. Results and Discussion

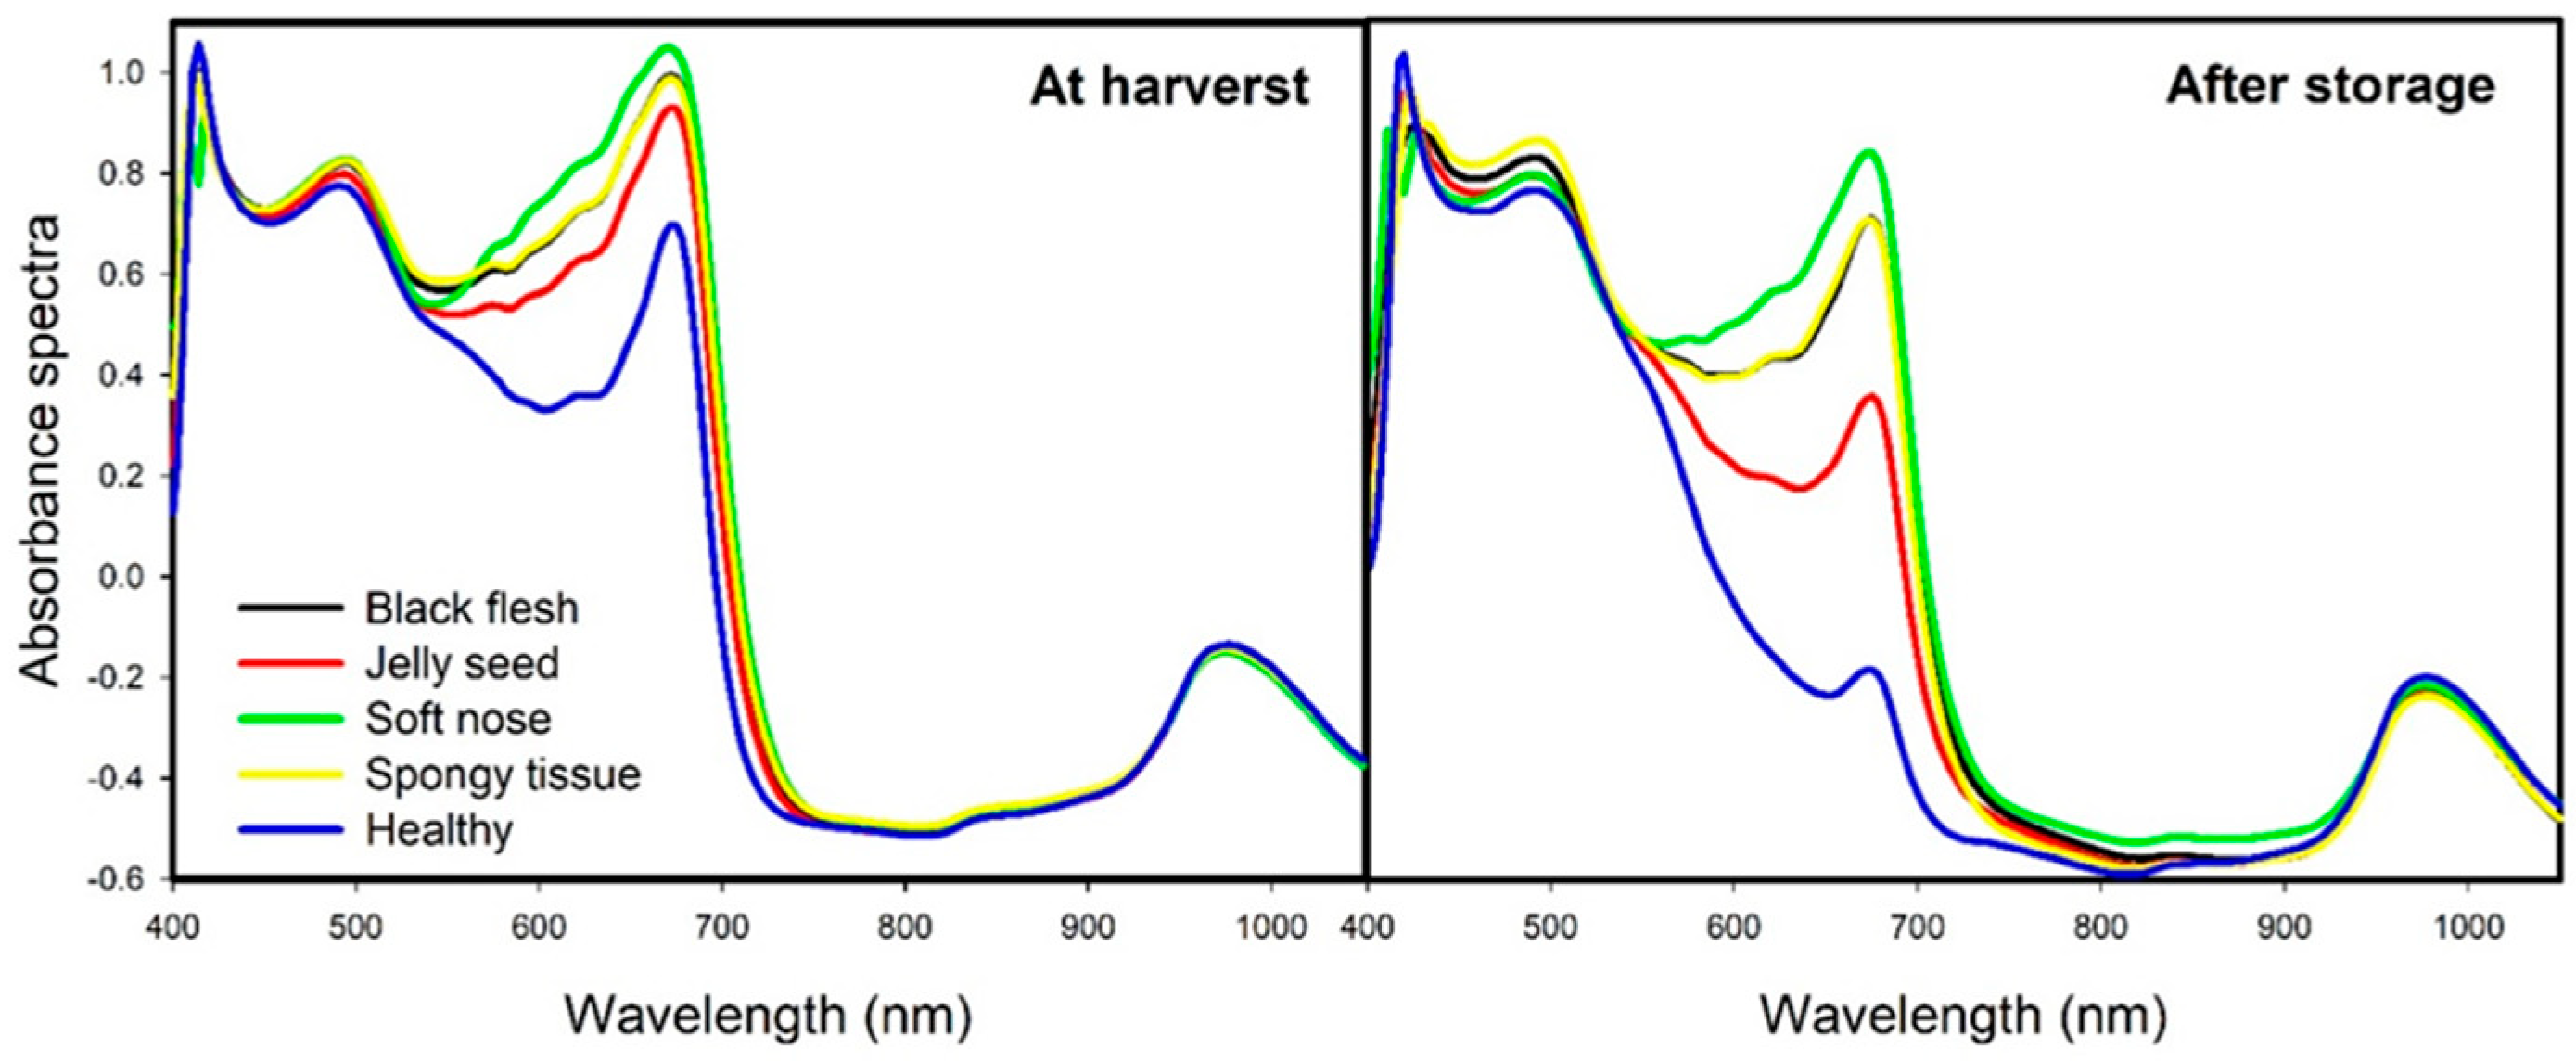
3.1. Interpretation of Spectra

The 680 nm (chlorophyll) peak in spectra of fruit at harvest was higher in fruit that later developed internal disorders than in fruit that remained healthy, although disorder-affected fruit were not visibly greener than fruit that remained healthy (Figure 3). This result is consistent with predisposition for less mature fruit (with higher chlorophyll content) to develop disorders, as noted by [16]. A marked decrease in the 680 nm (chlorophyll) peak following storage was evident in healthy fruit (Figure 3), as expected for ripening fruit. The smaller decrease in this peak in fruit manifesting disorders is again consistent with these fruit being less mature than healthy fruit.
Additionally, the spectral region around 970 nm, associated with water absorption, showed only slight variations among the different tissue types. This region is sensitive to O–H bond vibrations, particularly those of free and bound water within the tissues [34]. These results suggest that the water content was about the same between healthy fruit and those affected by physiological disorders, either at harvest or after storage. A similar result was observed in a study that compared spectra of healthy ‘Keitt’ mangoes and those with jelly seed and black flesh disorders [18].
In addition to the spectral region around 970 nm associated with water absorption, other spectral regions also revealed relevant features. For instance, the region near 500 nm is related to carotenoids and chlorophyll b, which are important pigments related with fruit ripening process [35,36]. Variations in this region may indicate changes in pigment composition and color, particularly between healthy tissues and those affected by physiological disorders. This separation becomes more evident after storage, when physiological disorder symptoms are developed in the fruit flesh.
These spectral features complement the information on water and chlorophyll content, providing a more comprehensive understanding of tissue differences between healthy and physiologically affected fruit. Since physiological disorders may lead to tissue oxidation due to cell death, pigment degradation and/or accumulation in the damaged tissues are expected [37].
Principal component analysis (PCA) was initially applied to explore spectral variability and identify potential groupings associated with physiological disorders. At harvest, the first three PCs accounted for only 46% of the total variance, with PC1 and PC2 explaining 37% and 9%, respectively. After storage, the explanatory power of the first three PCs was lower than at harvest, accounting for only 27% of the total variance, with PC1 and PC2 explaining 15% and 12%, respectively. Therefore, it was not possible to observe clearly separated groups between healthy samples and those that would develop black flesh, spongy tissue, jelly seed, and soft nose. This result indicates that the variation associated with physiological disorders in different mango cultivars cannot be explained by traditional linear methods, possibly due to the high complexity of the data set, which has been also observed in other studies [12,17]. This lack of class separation using traditional linear methods justifies the use of machine learning algorithms, which have shown better performance in modeling more complex and nonlinear relationships present in spectral data [12].

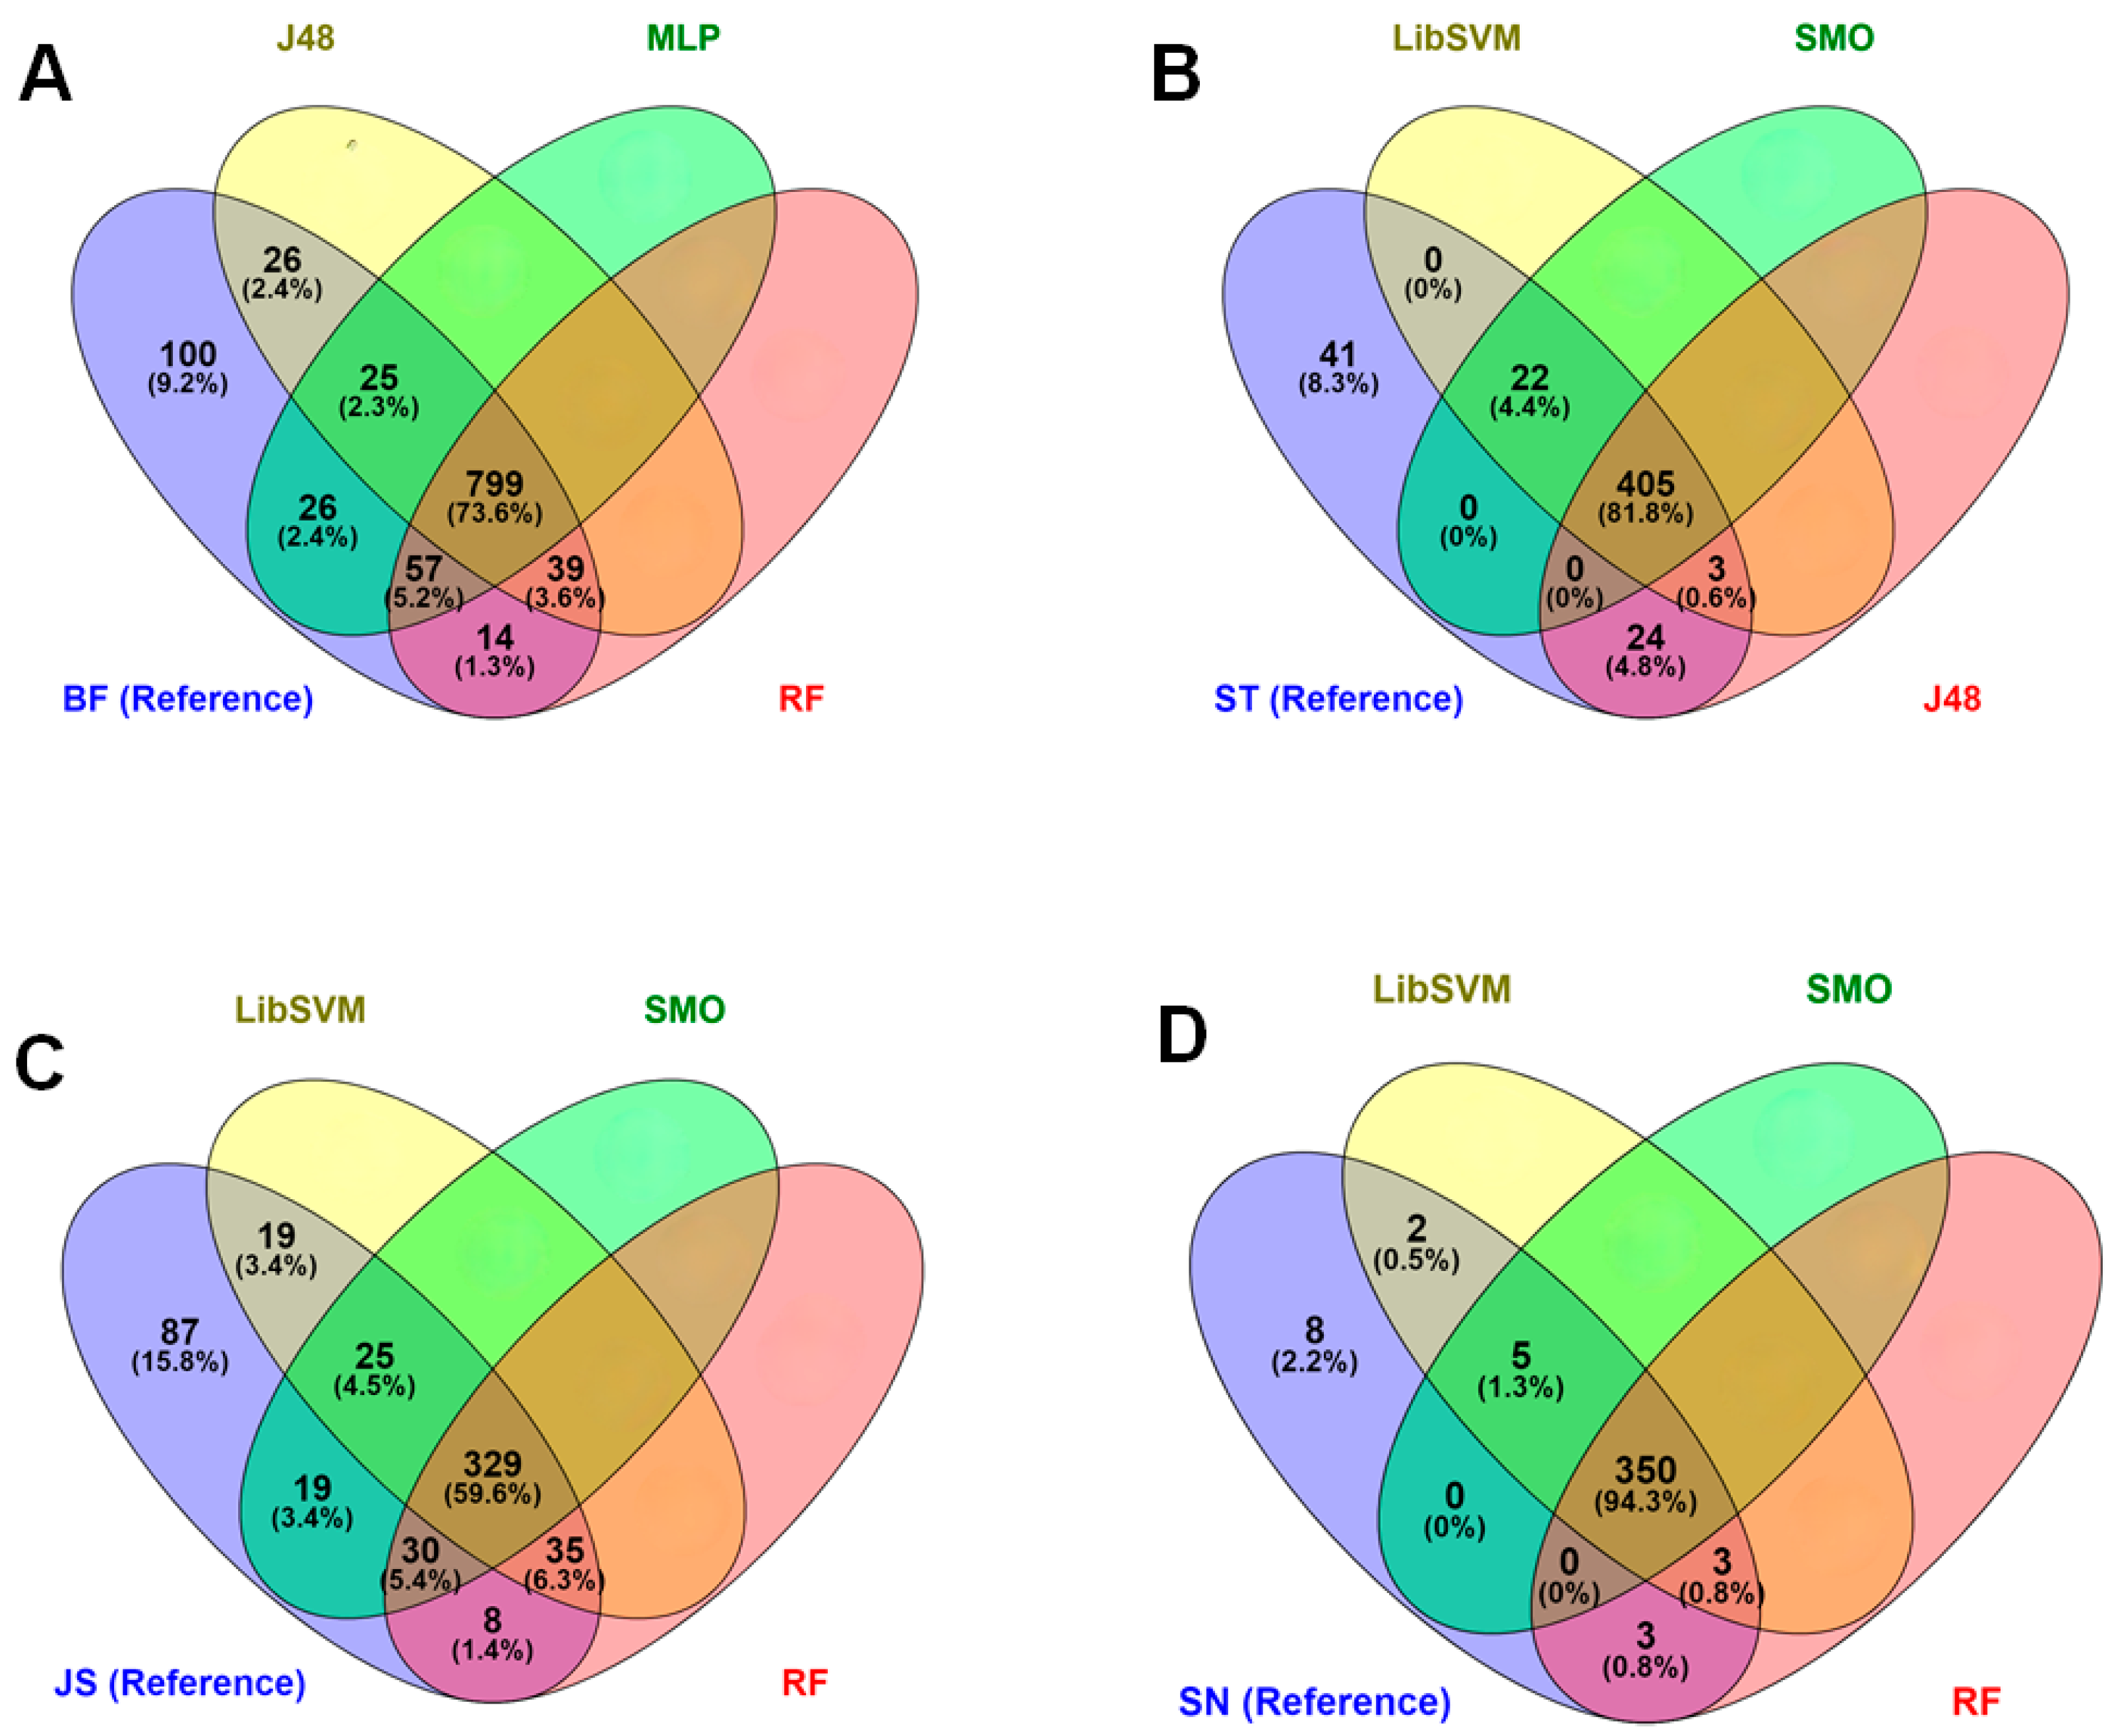
3.2. Discrimination Using At-Harvest Spectra

Accuracy values between 50.3 and 62.5% were achieved across the five algorithms when using a single ‘all-disorders’ model to distinguish healthy fruit from fruit with any of the disorders, with the best result achieved using the LibSVM algorithm when considering all statistics (Table 2). These results are consistent with previous studies that employed a single model to distinguish, at an early stage, healthy fruit from those affected by physiological disorders such as black flesh and jelly seed, achieving 65% accuracy during the validation phase [18].
Much higher performance statistics were achieved with disorder-specific models, e.g., with accuracy values between 72.5 and 97.0% achieved across the five algorithms and four types of disorders (Table 2). In the ‘all-disorders’ model prediction, the highest rates of misclassification were associated with black flesh and healthy fruit (confusion matrix, Table 3). The best classification result was achieved for soft nose and the worst for jelly seed, with accuracy over 90% and under 75% for all algorithms, respectively (Table 2, Table 3 and Table 4).
While a generic model able to predict all disorders would have practical advantages in simplicity of use in field application, the superior performance of disorder-specific models is not surprising given the varied symptoms of the disorders. The predictive performances of the single all-disorders model obtained in the present study are consistent with that of [18], who also proposed a single model to determine the presence or absence of physiological disorders in ‘Keitt’ mango.
To illustrate the performance of the three highest accuracy algorithms in prediction of each disorder, Venn diagrams are presented to illustrate the overlap of correct predictions by each of the algorithms. For example, in prediction of the black flesh disorder using spectra collected at harvest, 74% of correct predictions were shared by all three algorithms (J48, MLP, and RF), while 9% of disorder affected fruit were not correctly classified by any of the three algorithms (Figure 4). The best convergence between algorithms is seen in prediction of soft nose, with 94% of correct predictions shared by the three algorithms. The greatest potential for use of an ensemble of models exists for prediction of jelly seed, with 60% of samples with disorder correctly predicted by each of the three algorithms and an additional 23% of samples with disorder correctly predicted by only one or two algorithms.
The two physiological disorders that showed the best (soft nose) and worst (jelly seed) classification performances exhibited false negative rates exceeding 30%, meaning that approximately one-third of the samples that would later develop these disorders were incorrectly classified as healthy. This level of performance poses a considerable risk in export operations, especially given that USDA regulations permit a maximum of only 2% defective fruit per shipment, with inspections typically conducted through destructive sampling [6]. Considering that the current export value of fresh mango from Brazil ranges between USD 6.61 and USD 8.38 per kilogram [38], even a small number of undetected defective fruit can lead to the rejection of entire shipments, resulting in substantial financial losses for growers and exporters. A standard export container typically holds around 4000–5000 kg of fruit; thus, a rejected shipment due to undetected defects could represent a direct loss of at least USD 26,440 per container. Therefore, future research should prioritize strategies to reduce false negative rates in to improve model performance.
The most accurate models to predict physiological disorders in mangoes at harvest and detect them in stored fruit were as follows: random forest for black flesh; J48 for spongy tissue; and LibSVM for soft nose and jelly seed at harvest. Most studies using Vis-NIR spectroscopy to distinguish between healthy and physiologically disordered mango focus on a single cultivar and are conducted after the fruit ripened, when symptoms are already visible [15,17,39,40]. This study is pioneering in providing specific models capable of predicting spongy tissue, black flesh, jelly seed, and soft nose in different mango cultivars at harvest and after ripening during storage.

3.3. Discrimination Using After-Storage Spectra

Trends for the performance of models developed using spectra of stored fruit were similar to that for models based on at-harvest spectra, i.e., higher performance statistics were achieved with disorder-specific models, e.g., with accuracy values between 73.2 and 96.2% achieved across the five algorithms and four types of disorder, compared to accuracies between 44.6 and 57.8% for the all-disorders model (Table 5), with many samples misclassified as black flesh or healthy fruit using the all-disorders model (Table 6). Additionally, as for at-harvest spectra, the best classification result was achieved for soft nose and the worst for jelly seed. The performance of the five algorithms did not vary greatly, but SMO produced slightly higher performance statistics in more categories than the other four algorithms.
The superior performance of the disorder-specific models over the generic ‘all-disorders’ model is again seen in the confusion matrix results for both at-harvest and after-storage spectra (Table 3, Table 4, Table 5 and Table 6). The classification result was superior for the at-harvest spectra, with a greater misclassification of fruit as false positives for after storage spectra (Table 5). The soft nose and jelly seed models developed using after-storage spectra delivered the highest and the lowest classification accuracies, respectively (Table 5 and Table 7). The soft nose model developed using at-harvest spectra correctly predicted 99.4% of the healthy and 33.0% of the soft nose-affected fruit during storage (Table 5). The soft nose model developed using after-storage spectra correctly identified 99.7% of the healthy and 35.0% of the soft nose-affected fruit (Table 5). The jelly seed model developed using at-harvest spectra correctly predicted 98.6% of the healthy and 31.0% of the jelly seed-affected fruit (Table 5). The jelly seed model developed using after-storage spectra correctly identified 90.5% of the healthy and 36.1% of the jelly seed-affected fruit (Table 5).
A Venn diagram presentation was also undertaken for predictions from models developed using spectra collected of fruit after storage. For example, in prediction of the black flesh disorder, 58% of correct predictions were shared by all three algorithms (J48, MLP, and RF), while 8% of disorder-affected fruit were not correctly classified by any of the three algorithms (Figure 5). The best convergence between algorithms was again seen in prediction of soft nose, with 94% of correct predictions shared by the three algorithms. The greatest potential for use of an ensemble of models was again seen for prediction of jelly seed, with 56% of samples with disorder correctly predicted by each of the three algorithms and an additional 25% of samples with disorder correctly predicted by only one or two algorithms.
The most accurate models to detect physiological disorders in after-storage were as follows: random forest for black flesh; SMO for spongy tissue; and SMO and random forest for jelly seed and soft nose. A previous study used SIMCA models to classify ‘Afonso’ mangoes as either healthy or affected by spongy tissue, achieving an accuracy of 96.7% [15]. This performance surpasses the accuracy observed in the present study for the same disorder (85%). However, it is important to highlight that the study was limited to a single cultivar, which tends to favor model performance due to lower variability among fruit.
In a similar approach, a previous study aimed to optimize wavelength selection for the classification of healthy and internally defective ‘Afonso’ mangoes, reaching an accuracy of 84.5% [39]. Other studies with the same cultivar also reported promising results, reaching 93.78% accuracy in distinguishing healthy fruit from those with internal disorders. Furthermore, a study conducted with ‘Namdokmai Sithong’ mangoes developed classification models for healthy fruit versus those with internal disorders, achieving an accuracy of 91.37% [17].
These findings reinforce the notion that models developed for more specific contexts, such as models focused on a single cultivar and a single physiological disorder, tend to show superior performance in terms of both accuracy and discriminative capacity. The reduced variability inherent to such data sets makes the learning process more efficient and allows models to capture clearer patterns between classes.
On the other hand, when the goal is to develop more generalizable models that consider different cultivars and ripening stages, as in the present study, the classification task becomes significantly more complex. Although this modeling approach may lead to lower accuracy, it increases the potential for practical application in the fruit industry, where different cultivars and types of disorders may be present simultaneously. Therefore, building robust and versatile models capable of handling multiple cultivars and fruit at different ripening stages represents a significant step forward for the practical use of tools such as Vis-NIR spectroscopy in the mango industry.

4. Conclusions

The use of both disorder-specific models and time of spectra collection (at harvest and after storage)-specific models is recommended. The strength of the models developed using spectra at harvest, relative to after storage spectra, is a remarkable result, allowing for prediction of disorder development. Further research is required to better understand the biochemical and physiological mechanisms affecting spectral profile and classification models. The higher A680 (chlorophyll peak) values of fruit that later developed disorders suggests that less mature fruit are prone to development of different physiological disorders, a hypothesis that could be tested.
The random forest algorithm yielded the most accurate models for predicting physiological disorders, such as black flesh at harvest (83%), and detecting them in the fruit after storage (77%). The LibSVM algorithm showed the greatest performance in predicting soft nose (97%) and jelly seed (73.7%) at harvest, while random forest (96.2%) and SMO (70.6%) showed the highest performance in detecting these disorders in fruit after storage. Finally, for spongy tissue, J48 (87.3%) resulted in the most accurate model for predicting at harvest, and SMO (85%) for detection in the fruit after storage.
The Vis-NIR spectroscopy and machine learning-based modeling together have a great potential application in the mango industry to predict at harvest and detect after shipping/storing the incidence of different physiological disorders in different cultivars, which can be used to ensure that only high-quality fruit reach the final market and consumption. In addition, it can also be used to predict fruit susceptibility to each disorder at harvest, allowing the application of postharvest strategies to reduce or inhibit disorder incidence in the fruit before it reaches the consumers.

Author Contributions

J.d.S.A.: conceptualization, investigation, methodology, software, data curation, formal analysis, visualization, writing—original draft, writing—review and editing, validation. B.P.d.C.P.: investigation, methodology, data curation, formal analysis. L.F.d.S.: investigation, methodology, data curation, formal analysis. T.d.S.R.: investigation, methodology, data curation, formal analysis. K.B.W.: conceptualization, investigation, methodology, software, review and editing. E.A.K.: conceptualization, investigation, methodology, software, review and editing. S.T.d.F.: supervision, conceptualization, investigation, methodology, visualization, writing—original draft, writing—review and editing, resources. All authors have read and agreed to the published version of the manuscript.

Funding

The study was funded by FACEPE (APQ-1046-5.01/22), CNPq (Proc.: 305222/2023-6), as well as by CNPq-INCTs (Processes: 465768/2014-8 and 408855/2024-0).

Data Availability Statement

The information will be made available upon request. Please, reach out to the corresponding author, Sergio Tonetto de Freitas, email: sergio.freitas@embrapa.br.

Acknowledgments

The authors would like to thank the Fundação de Amparo à Ciência e Tecnologia do Estado de Pernambuco (FACEPE, APQ-1046-5.01/22) for the financial support, as well as the Brazilian National Council for Scientific and Technological Development (CNPq) for the Research Productivity Scholarship granted to the corresponding author (Proc.: 305222/2023-6). The authors would also like to thank the financial support received from CNPq through the National Institutes of Science and Technology Program (Processes: 465768/2014-8 and 408855/2024-0), as well as the mango companies Agropecuária Roriz Dantas, Argofruta and IBACEM for supplying the fruit used in the study.

Conflicts of Interest

K.B.W. acknowledges involvement in the development of the F750 spectrometer. Other authors declare no potential conflicts of interest with respect to the research, authorship, and/or publication of this article.

References

  1. Kiloes, A.M.; Azizan, F.A.; Checco, J.; Joyce, D.; Abdul Aziz, A. What do consumers want in fresh mangoes? A systematic literature review. Int. J. Food Sci. Technol. 2022, 57, 1473–1492. [Google Scholar] [CrossRef]
  2. Kist, B.B.; Beling, R.R. Brazilian Horti & Fruit Yearbook. Editora Gazeta Santa Cruz, 2023. Available online: https://editoragazeta.com.br/wp-content/uploads/2024/04/HF_2024_DUPLAS.pdf (accessed on 2 January 2025).
  3. Shivashankar, S. Physiological disorders of mango fruit. In Horticultural Reviews; Janick, J., Ed.; Wiley Online Library: Hoboken, NJ, USA, 2014; pp. 313–348. [Google Scholar] [CrossRef]
  4. Brecht, J.K. Mango. In Posharvest Physiological Disorders in Fruit and Vegetables; Freitas, S.T., Pareek, S., Eds.; CRC Press: Boca Raton, FL, USA, 2019; pp. 443–466. [Google Scholar] [CrossRef]
  5. Ullah, M.A.; Khanal, A.; Joyce, P.; White, N.; Macnish, A.; Joyce, D. Internal Disorders of Mango Fruit and Their Management—Physiology, Biochemistry, and Role of Mineral Nutrients. Plants 2024, 13, 2596. [Google Scholar] [CrossRef]
  6. USDA. Shipping Point and Market Inspection Instructions; United States Department of Agriculture: Washington, DC, USA, 2006. Available online: https://www.ams.usda.gov/sites/default/files/media/Mango_Inspection_Instructions%5B1%5D.pdf (accessed on 19 June 2025).
  7. Walsh, K.B.; McGlone, V.A.; Han, D.H. The uses of near infra-red spectroscopy in postharvest decision support: A review. Postharvest Biol. Technol. 2020, 163, 111139. [Google Scholar] [CrossRef]
  8. Clark, C.J.; McGlone, V.A.; Silva, H.N.; Manning, M.A.; Burdon, J.; Mowat, A.D. Prediction of storage disorders of kiwifruit (Actinidia chinensis) based on visible-NIR spectral characteristics at harvest. Postharvest Biol. Technol. 2004, 32, 147–158. [Google Scholar] [CrossRef]
  9. Kasampalis, D.S.; Tsouvaltzis, P.; Siomos, A.S. Assessment of Melon Fruit Nutritional Composition Using VIS/NIR/SWIR Spectroscopy Coupled with Chemometrics. Preprints 2025, 11, 658. [Google Scholar] [CrossRef]
  10. Tan, H.; Dong, Y.; Jiang, L.; Fan, W.; Du, G.; Li, P. Simultaneous and non-destructive prediction of multiple internal quality characteristics in mandarin citrus with near-infrared spectroscopy and ensemble learning strategy. J. Food Compos. Anal. 2025, 137, 106961. [Google Scholar] [CrossRef]
  11. Walsh, J.; Neupane, A.; Koirala, A.; Li, M.; Anderson, N. The evolution of chemometrics coupled with near infrared spectroscopy for fruit quality evaluation. II. The rise of convolutional neural networks. J. Near Infrared Spectrosc. 2023, 31, 109–125. [Google Scholar] [CrossRef]
  12. Pokhrel, D.R.; Sirisomboon, P.; Khurnpoon, L.; Posom, J.; Saechua, W. Comparing Machine Learning and PLSDA Algorithms for Durian Pulp Classification Using Inline NIR Spectra. Sensors 2023, 23, 5327. [Google Scholar] [CrossRef]
  13. Tuerxun, A.; Shariff, A.R.M.; Janius, R.; Abbas, Z.; Mahdiraji, G.A. Oil palm fresh fruit bunches maturity prediction by using an optical spectrometer. IOP Conf. Ser. Earth Environ. Sci. 2020, 540, 012085. [Google Scholar] [CrossRef]
  14. Rivera, N.V.; Gómez-Sanchis, J.; Chanona-Pérez, J.; Carrasco, J.J.; Millán-Giraldo, M.; Lorente, D.; Cubero, S.; Blasco, J. Early detection of mechanical damage in mango using NIR hyperspectral images and machine learning. Biosyst. Eng. 2014, 122, 91–98. [Google Scholar] [CrossRef]
  15. Kiran, P.R.; Jadhav, P.; Avinash, G.; Aradwad, P.; TV, A.; Bhardwaj, R.; Parray, R.A. Detection and classification of spongy tissue disorder in mango fruit during ripening by using visible-near infrared spectroscopy and multivariate analysis. J. Near Infrared Spectrosc. 2024, 32, 140–151. [Google Scholar] [CrossRef]
  16. Khanal, A.; Ullah, M.A.; Joyce, P.; White, N.; Macnish, A.; Hoffman, E.; Irving, D.; Webb, R.; Joyce, D. Fruit Sorting Based on Maturity Reduces Internal Disorders in Vapor Heat-Treated ‘B74’Mango. Horticulturae 2024, 10, 1257. [Google Scholar] [CrossRef]
  17. Seehanam, P.; Chaiya, P.; Theanjumpol, P.; Tiyayon, C.; Ruangwong, O.; Pankasemsuk, T.; Maniwara, P. Internal disorder evaluation of ‘Namdokmai Sithong’ mango by near infrared spectroscopy. Hortic. Environ. Biotechnol. 2022, 63, 665–675. [Google Scholar] [CrossRef]
  18. Mogollón, R.; Contreras, C.; Silva-Neta, M.L.; Marques, E.J.N.; Zoffoli, J.P.; Freitas, S.T. Non-destructive prediction and detection of internal physiological disorders in ‘Keitt’ mango using a hand-held Vis-NIR spectrometer. Postharvest Biol. Technol. 2020, 167, 111251. [Google Scholar] [CrossRef]
  19. National Mango Board. Mango Maturity and Ripeness Guide, 2024. Available online: http://mango.org/ (accessed on 5 March 2024).
  20. Bouckaert, R.R.; Frank, E.; Hall, M.; Kirkby, R.; Reutemann, P.; Seewald, A.; Scuse, D. WEKA Manual (Version 3-9-1); University of Waikato: Hamilton, New Zealand, 2016. [Google Scholar]
  21. Lanjewar, M.G.; Asolkar, S.; Parab, J.S.; Morajkar, P.P. Detecting starch-adulterated turmeric using Vis-NIR spectroscopy and multispectral imaging with machine learning. J. Food Compos. Anal. 2024, 136, 106700. [Google Scholar] [CrossRef]
  22. Shiddiq, M.; Candra, F.; Anand, B.; Rabin, M.F. Neural network with k-fold cross validation for oil palm fruit ripeness prediction. TELKOMNIKA (Telecommun. Comput. Electron. Control) 2024, 22, 164–174. [Google Scholar] [CrossRef]
  23. Sohn, S.I.; Oh, Y.J.; Pandian, S.; Lee, Y.H.; Zaukuu, J.L.Z.; Kang, H.J.; Shin, E.K. Identification of Amaranthus species using visible-near-infrared (vis-NIR) spectroscopy and machine learning methods. Remote Sens. 2021, 13, 4149. [Google Scholar] [CrossRef]
  24. Breiman, L. Random forests. Mach. Learn. 2001, 45, 5–32. [Google Scholar] [CrossRef]
  25. Quinlan, J.R. C4. 5: Programs for Machine Learning; Elsevier: Amsterdam, The Netherlands, 2014. [Google Scholar]
  26. Chang, C.; Lin, C. LIBSVM: A library for support vector machines. ACM Trans. Intell. Syst. Technol. (TIST) 2011, 2, 1–27. [Google Scholar] [CrossRef]
  27. Platt, J.C. Sequential Minimal Optimization: A Fast Algorithm for Training Support Vector Machines; Microsoft Research Technical Report; Microsoft: Redmond, WA, USA, 1998. [Google Scholar]
  28. Rumelhart, D.E.; Hinton, G.E.; Williams, R.J. Learning representations by back-propagating errors. Nature 1986, 323, 533–536. [Google Scholar] [CrossRef]
  29. Oliveros, J.C.; Venny. An Interactive Tool for Comparing Lists with Venn’s Diagrams. 2007–2005. Available online: https://bioinfogp.cnb.csic.es/tools/venny/index.html (accessed on 19 June 2025).
  30. Hossin, M.; Sulaiman, M.N. A review on evaluation metrics for data classification evaluations. Int. J. Data Min. Knowl. Manag. Process 2015, 5, 1. [Google Scholar] [CrossRef]
  31. Vujović, Ž.D. Classification model evaluation metrics. Int. J. Adv. Comput. Sci. Appl. 2021, 12, 599–606. [Google Scholar] [CrossRef]
  32. Han, J.; Li, T.; He, Y.; Yang, Z. Predicting the effect of chemicals on fruit using graph neural networks. Sci. Rep. 2024, 14, 8203. [Google Scholar] [CrossRef]
  33. Li, M.; Li, Z.; Yu, T. Statistical issues. Comment on “proximal sensor data fusion for tropical soil property prediction: Soil fertility properties”. J. South Am. Earth Sci. 2023, 124, 104282. [Google Scholar] [CrossRef]
  34. Zhang, Q.; Li, Q.; Zhang, G. Rapid determination of leaf water content using VIS/NIR spectroscopy analysis with wavelength selection. J. Spectrosc. 2012, 27, 93–105. [Google Scholar] [CrossRef]
  35. Zur, Y.; Gitelson, A.A.; Chivkunova, O.B.; Merzlyak, M.N. The spectral contribution of carotenoids to light absorption and reflectance in green leaves. In Proceedings of the 2nd International Conference Geospatial Information in Agriculture and Forestry, Lake Buena Vista, FL, USA, 10–12 January 2000; Volume 2, pp. 10–12. [Google Scholar]
  36. Vanoli, M.; Rizzolo, A.; Lovati, F.; Spinelli, L.; Levoni, P.; Torricelli, A.; Cortellino, G. Non-Destructive Prediction of Carotenoids, Ascorbic Acid, and Total Phenols Contents in ‘Tommy Atkins’ Mangoes Using Absorption and Scattering Properties Measured by Time-Resolved Reflectance Spectroscopy. Agriculture 2024, 14, 1902. [Google Scholar] [CrossRef]
  37. Lum, G.B.; Shelp, B.J.; Deell, J.R.; Bozzo, G.G. Oxidative metabolism is associated with physiological disorders in fruits stored under multiple environmental stresses. Plant Sci. 2016, 245, 143–152. [Google Scholar] [CrossRef]
  38. Tridge. Brazil Mango Export Prices. Available online: https://www.tridge.com/intelligences/mango/BR/price (accessed on 10 June 2025).
  39. Raghavendra, A.; Guru, D.S.; Rao, M.K. Mango internal defect detection based on optimal wavelength selection method using NIR spectroscopy. Artif. Intell. Agric. 2021, 5, 43–51. [Google Scholar] [CrossRef]
  40. Guru, D.S.; Nandini, D. Mango Internal Defect Detection using NIR Spectroscopy Data. Procedia Comput. Sci. 2025, 258, 947–960. [Google Scholar] [CrossRef]
Figure 1. Visual appearance of mangoes with (a) healthy flesh; (b) black flesh, (c) soft nose, (d) spongy tissue, and (e) jelly seed.
Horticulturae 11 00759 g001
Figure 2. Workflow used in developing discriminative models to predict presence of internal physiological disorders based on spectra collected of fruit at harvest and of ripened fruit of three cultivars.
Horticulturae 11 00759 g002
Figure 3. Mean Vis-NIR absorbance spectra of ‘Palmer’, ‘Keitt’, and ‘Tommy Atkins’ mango fruit at harvest (left panel) and after storage at 12 °C (right panel). The spectra were obtained at 24 °C. After storage, the fruit were destroyed for assessment as healthy or with symptoms of black flesh, soft nose, spongy tissue, or jelly seed.
Horticulturae 11 00759 g003
Figure 4. Venn diagrams of predictions using at-harvest spectra of the three highest accuracy algorithms for each physiological disorder, i.e., for (A) black flesh, BF, (B) spongy tissue, ST; (C) jelly seed, JS, and (D) soft nose, SN; using J48, MLP, RF, LibSVM, and SMO models. Number and percentage of correctly predicted samples for each model type are shown in overlaps to the reference data.
Horticulturae 11 00759 g004
Figure 5. Venn diagrams of predictions using after-storage spectra of the three highest accuracy algorithms for each physiological disorder, i.e., for (A) black flesh, BF, (B) spongy tissue, ST; (C) jelly seed, JS, and (D) soft nose, SN; using J48, MLP, RF, LibSVM, and SMO models. Number and percentage of correctly predicted samples for each model type are shown in overlaps to the reference data.
Horticulturae 11 00759 g005
Table 1. Number of spectra collected at harvest and after ripening of fruit with no symptoms (healthy) or symptoms of black flesh, spongy tissue, jelly seed, or soft nose after ripening.
ClassNumber of Spectra
At HarvestAfter Storage
PalmerKeittTommy AtkinsTotalPalmerKeittTommy AtkinsTotal
Healthy10652393501065239349
Black flesh2548322873625450227702
Spongy tissue438517145436417124
Jelly seed25621152022562115202
Soft nose415221414220
Total20365060114542035956001397
Table 2. Spectra obtained at harvest: means of statistics from ten-fold cross validation for classification models developed using in prediction of internal disorders (n = 1454). Classification models: multilayer perceptron (M.P.), random forest (R. Forest), LibSVM, SMO, and J48. The best results for the six performance measures used with each fruit disorder are shown in bold, and the overall best-performing algorithm for a given class is also shown in bold. Results are shown for generic ‘all-disorders’ models developed using the entire data set, and specific disorder models developed using healthy and fruit with the given disorder. * indicates that means could not be calculated due to a missing class (the general model failed to classify any fruit as ‘soft nose’).
Data SetAlgorithmsAccuracy (%)PrecisionRecallF-MeasureROC
Area (%)
Kappa Statistic
All class
(n = 1454)
M. P.51.20.490.510.500.680.24
R. Forest62.5*0.62*0.760.55
LibSVM62.20.510.620.550.660.36
SMO62.00.500.620.540.710.35
J4850.30.500.500.500.640.24
Black flesh and healthy
(n = 1086)
M. P.83.60.840.840.840.880.63
R. Forest83.60.830.840.840.910.62
LibSVM82.00.820.820.820.800.59
SMO82.00.820.820.820.800.59
J4882.00.820.820.820.870.59
Spongy tissue and healthy
(n = 495)
M. P.81.60.810.820.810.780.53
R. Forest85.30.850.850.850.880.62
LibSVM86.90.880.870.860.790.64
SMO86.30.870.860.850.780.63
J4887.30.870.870.870.850.69
Jelly seed and healthy
(n = 552)
M. P.72.50.720.730.720.740.40
R. Forest73.20.730.730.720.750.38
LibSVM73.70.790.740.690.650.34
SMO72.30.720.720.720.690.39
J4872.50.720.730.720.720.40
Soft nose and healthy
(n = 371)
M. P.94.60.950.950.950.850.54
R. Forest96.00.950.960.950.890.45
LibSVM97.00.970.970.970.850.72
SMO96.00.960.960.960.800.61
J4896.00.950.960.950.660.53
Table 3. Confusion matrix for ‘all-disorders’ models developed using spectra collected at harvest (Lib-SVM model). The models discriminated fruit as healthy or with a disorder (i.e., any one of four disorders). Actual classes are shown in rows, with disorder predictions categorized by their actual disorders in columns. The subscript p refers to prediction.
Classified asAt harvest (LibSVM)Class
abcde
a636101584a = black flesh
b9100153b = spongy tissue
c160005c = soft nose
d13211959d = jelly seed
e81018260e = healthy
Table 4. Confusion matrix for disorder-specific models developed using spectra collected at harvest for discrimination of fruit as healthy or with a specific disorder. The random forest model was used for black flesh, J48 for spongy tissue, and LibSVM for jelly seed and for soft nose. The subscript p refers to prediction.
Data SetClassified asAt HarvestClass
ab
Black flesha65680a = black flesh
b98252b = healthy
Spongy tissuea10936a = spongy tissue
b27323b = healthy
Jelly seeda62140a = jelly seed
b5345b = healthy
Soft nosea714a = soft nose
b2348b = healthy
Table 5. Spectra obtained for stored fruit: means of statistics from ten-fold cross-validation for classification models developed using in prediction of internal disorders (n = 1397). Classification models: multilayer perceptron (M. P.), random forest (R. Forest), LibSVM, SMO, and J48. The best results for the six performance measures used with each fruit disorder are shown in bold, and the overall best-performing algorithm for a given class is also shown in bold. * Indicates means could not be calculated due to a missing class (the general model failed to classify any fruit as ‘soft nose’).
Data setAlgorithmsAccuracy (%)PrecisionRecallF-measureROC
Area (%)
Kappa statistic
All class
(n = 1397)
M. P.44.60.490.450.460.660.19
R. Forest57.8*0.58*0.760.28
LibSVM54.10.420.540.470.620.23
SMO54.20.420.540.470.660.23
J4855.90.440.440.440.600.14
Black flesh and healthy
(n = 1051)
M. P.74.60.810.750.750.820.49
R. Forest77.00.770.770.770.860.47
LibSVM75.00.760.750.700.630.32
SMO73.20.740.730.730.710.41
J4876.00.760.760.760.770.46
Spongy tissue and healthy
(n = 473)
M. P.82.90.820.830.820.780.52
R. Forest84.80.850.850.830.830.55
LibSVM77.20.750.770.750.630.31
SMO85.00.860.850.840.740.55
J4881.00.800.810.800.790.48
Jelly seed and healthy
(n = 551)
M. P.65.90.650.660.650.650.23
R. Forest70.10.700.700.660.650.27
LibSVM66.60.660.650.660.610.24
SMO70.60.700.710.700.680.30
J4863.70.620.640.630.610.18
Soft nose and healthy
(n = 369)
M. P.95.40.960.950.950.870.56
R. Forest96.20.960.960.950.850.45
LibSVM94.00.920.940.930.570.18
SMO94.60.940.950.940.690.42
J4895.20.940.950.960.700.41
Table 6. Confusion matrix for ‘all-disorders’ models developed using spectra collected after storage (SMO model). The models discriminated fruit as healthy or with a disorder (i.e., any one of four disorders). Actual classes are shown in rows, with disorder predictions categorized by their actual disorders in columns. The subscript p refers to prediction.
Classified asAfter storage (SMO)Class
abcde
a545161149a = black flesh
b6700156b = spongy tissue
c11200090c = soft nose
d160004d = jelly seed
e136010212e = healthy
Table 7. Confusion matrix for disorder-specific models developed using spectra collected after-storage for discrimination of fruit as healthy or with a specific disorder. The random forest model was used for black flesh, SMO for spongy tissue, SMO for jelly seed, and random forest for soft nose. The subscript p refers to prediction.
Data SetClassified asAfter StorageClass
ab
Black flesha588114a = black flesh
b135214b = healthy
Spongy tissuea6262a = spongy tissue
b9340b = healthy
Jelly seeda73129a = jelly seed
b33316b = healthy
Soft nosea713a = soft nose
b1348b = healthy
Disclaimer/Publisher’s Note: The statements, opinions and data contained in all publications are solely those of the individual author(s) and contributor(s) and not of MDPI and/or the editor(s). MDPI and/or the editor(s) disclaim responsibility for any injury to people or property resulting from any ideas, methods, instructions or products referred to in the content.

