1. Introduction
The production of lettuce (Lactuca sativa L.) under organic systems has been gaining increasing interest, mainly due to the growing demand for healthy and environmentally sustainable food. However, despite the expansion of this sector, the organic horticulture production chain in Brazil still faces significant challenges, such as the shortage of seeds produced in the organic system that are adapted to the country’s different climates and regions. Seeds play a fundamental role in the consolidation of organic agriculture, as they constitute the starting point for all production and directly influence the adaptation of crops to management conditions without the use of synthetic inputs.
The lack of varieties developed or multiplied under organic management compromises not only productivity, but also the authenticity and credibility of the organic production system. Due to this limitation, the use of conventional seeds with or without pesticide treatment is still permitted in the organic production system. In this context, it becomes essential to intensify studies focused on organic seeds production, to identify more appropriate management, achieving productivity, aiming to strengthen the autonomy of farmers, guarantee traceability and ensure the sustainability of the production system.
One of the key factors for the success of this cultivation system is the proper management of nutrients, since the use of synthetic fertilizers is not allowed, and efficient use of natural resources is essential.
Thus, in this context, understanding the dynamics of the nutrient uptake and accumulation at different growth stages of the plant allows the identification of periods of greater demand for essential elements and the correction of possible deficiencies throughout the crop cycle [
1]. Thus, the plant growth curve stands out as an essential tool in developing an efficient fertilization program, directly impacting the production and the sustainability of agroecosystems.
In some vegetable species, the crop cycle is extended when the goal is seed production, and nutrient demand tends to increase as a result of flowering and fruiting, especially in species where the vegetable product is harvested before flowering, such as herbaceous vegetables [
2].
Although scarce, there are some studies on fertilization and nutrient uptake in lettuce seed production, but most have been conducted using inorganic fertilizers under conventional systems. Due to the increasing consumer demand for organically produced goods worldwide, there is a greater need for research and techniques that enable vegetable and seed production with minimal or no use of mineral fertilizers and pesticides [
3].
Despite the significant market presence of organically grown vegetables, the production of lettuce seeds under ecological-based systems is still underexplored. As a result, producers are often forced to use the seeds from conventional systems [
4], highlighting the need for more information on nutrient accumulation aimed at seed production under organic management. The organic seed production of lettuce represents a significant step toward more sustainable and responsible agriculture, as well as full certification of the production process.
Phosphate fertilization plays a crucial role in lettuce seed production, since phosphorus (P) is an essential nutrient for several metabolic functions that directly impact growth and production. Although there is information on the nutritional requirements of lettuce, little research has focused on the productivity and seed quality in relation to phosphorus doses and sources. The main sources of phosphorus in fertilization are simple and triple superphosphates. However, these cannot be used in the organic system. Among the phosphate fertilizer options allowed in the organic system is thermophosphate, which has the characteristic of slower P dissolution in relation to soluble phosphate sources [
5], and may be a good option for the production of lettuce seeds, with release throughout the cycle.
Despite the numerous studies in the area of vegetable nutrition, studies on seed production, especially in organic systems, are still scarce, limiting the production potential of crops in this system. Therefore, understanding the dynamics of nutrient absorption and accumulation is important for the development of fertilization programs, seeking sustainability and productive efficiency of crops, as well as saving natural resources.
Therefore, the objective of this study was to determine the dry matter and macronutrient accumulation curve in lettuce for seed production under organic cultivation with two doses of phosphorus.
3. Results
3.1. Agronomic Characteristics
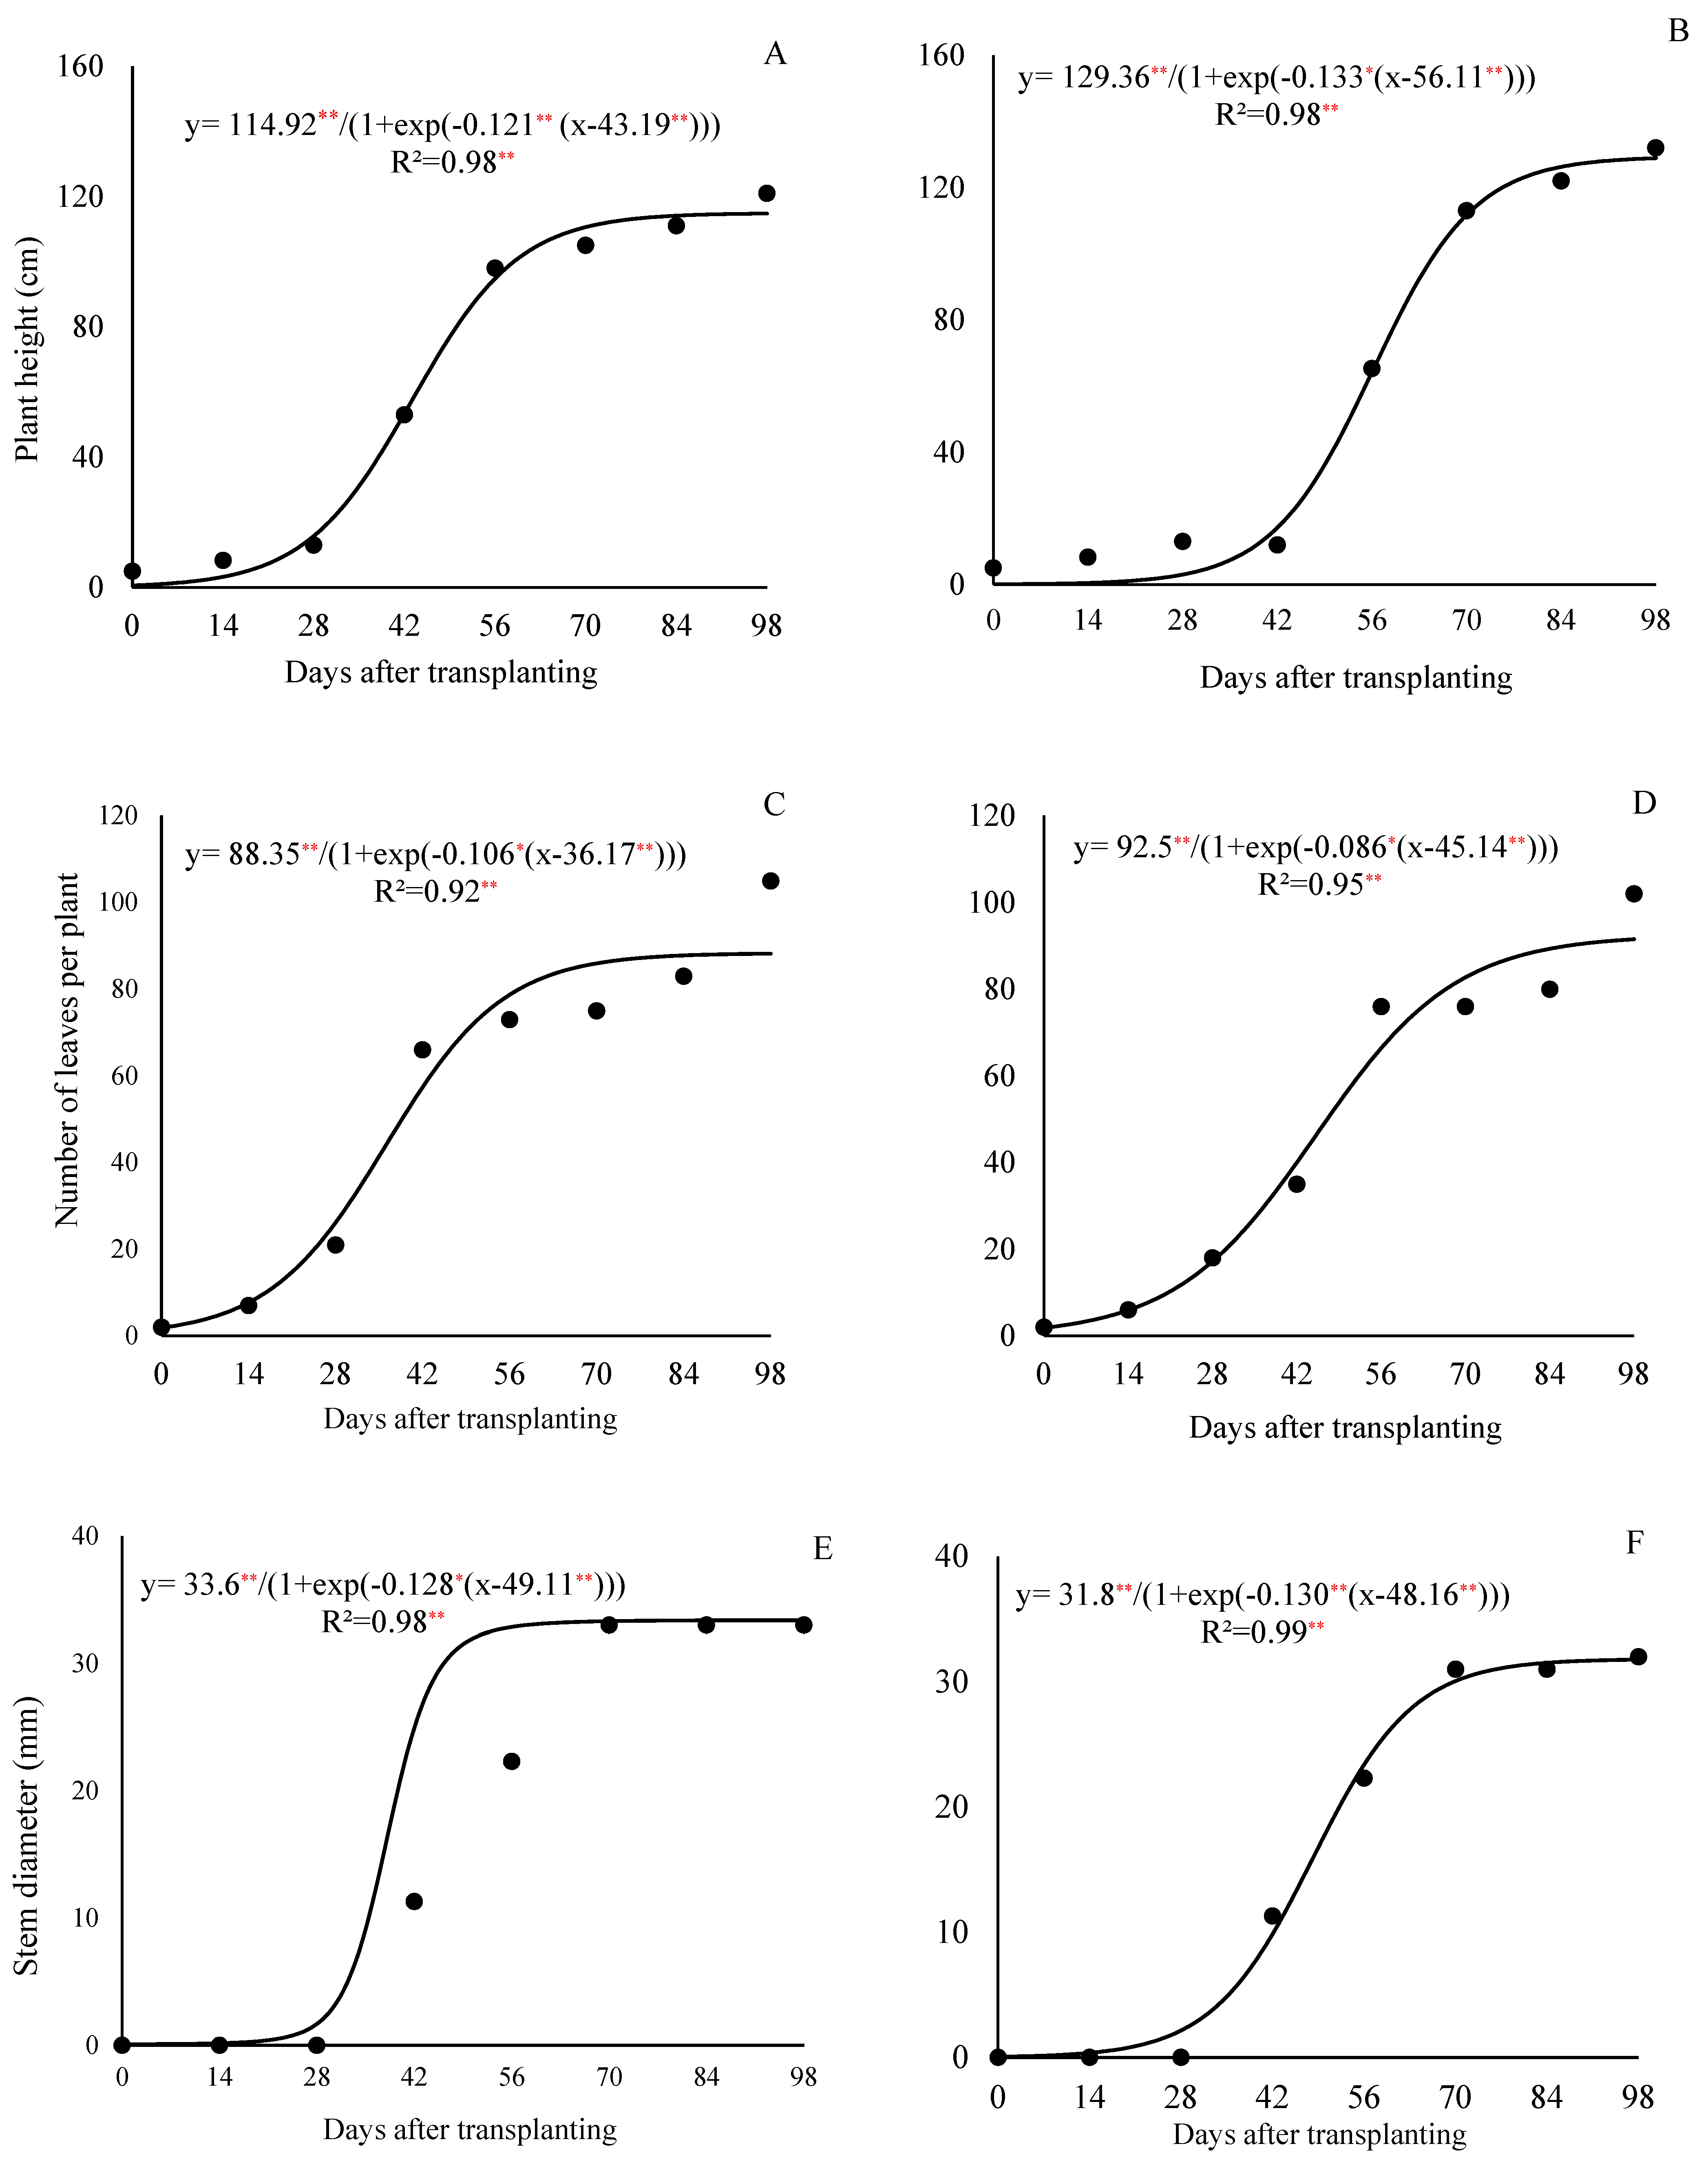
The growth cycle of curly lettuce cv. Solaris lasted 98 days from the transplanting to the seed harvest (or 126 days after sowing—DAS), and the growth curve followed a sigmoidal model. The duration of the lettuce cycle for seed production was approximately 2.5 times longer than that of the crop cultivated for fresh consumption, in which the harvest point occurs around 35 DAT. The emergence of the first flower buds began at 56 DAT (or 84 DAS), the flowering started at 70 DAT (98 DAS), and the opening of flowers in most plants occurred around 84 DAT (112 DAS).
The lettuce plants exhibited three distinct growth stages. The most significant increases in the plant height and stem diameter were observed after 42 DAT, coinciding with the onset of the stem elongation. Regarding the leaf number, there was a sharp increase between 28 and 56 DAT under the 800 kg ha
−1 P
2O
5 treatment, and between 28 and 70 DAT under the 320 kg ha
−1 P
2O
5 treatment, with the leaf emission rate decreasing thereafter (
Figure 1C and
Figure 1D, respectively). At the fresh market harvest point (35 DAT), the plants had an average of 41 and 27 leaves under the respective treatments.
At the end of the cycle, the lettuce plants reached 114.7 cm in height (
Figure 1A) and had an average of 88 leaves per plant (
Figure 1C), and a stem diameter of 33.4 mm (
Figure 1E) with the 800 kg ha
−1 P
2O
5 dose; and reached 128.8 cm (
Figure 1B) and had 91.5 leaves (
Figure 1D) and 31.7 mm (
Figure 1F) with the 320 kg ha
−1 P
2O
5 dose.
3.2. Dry Matter Accumulation
The total dry matter accumulation in the lettuce plants grown for the seed production was continuous throughout the crop cycle and could be divided into two distinct stages: the first from the transplanting to 28 days after the transplanting (DAT), and the second from 29 DAT to the seed harvest (98 DAT), for both the phosphorus doses 800 kg ha
−1 of P
2O
5 (
Figure 2A) and 320 kg ha
−1 of P
2O
5 (
Figure 2B).
The first stage (0 to 28 DAT) was characterized by a low dry matter accumulation, with an average of 5.27 g plant−1 under the 320 kg ha−1 P2O5 treatment, representing 4.8% of the total accumulated by the end of the cycle (109.8 g plant−1); and 13.05 g plant−1 under the 800 kg ha−1 P2O5 treatment, corresponding to 10.8% of the final accumulated total of 120.8 g plant−1 at 98 DAT.
In the leaves and the stem, under the dose of 800 kg ha−1 of P2O5, the dry matter accumulation followed three stages; the first stage occurred from 0 to 28 DAT, the second from 29 to 56 DAT, and the third from 57 to 98 DAT. In the first stage, the plants accumulated 9.37 and 3.02 g plant−1 of dry matter in the leaves and the stem, which represented 22.7% and 8.8% of the total dry matter accumulated by 98 DAT, respectively. During the second stage, the dry matter accumulation was more pronounced, with the plants accumulating 38.4 and 23.3 g plant−1 in the leaves and the stem, accounting for approximately 70% and 60% of the total accumulation, respectively. In the third stage, the plants accumulated 2.9 and 10.9 g plant−1 of the dry matter (7% and 31.7% of the total accumulated by 98 DAT), respectively.
Under the dose of 320 kg ha−1 of P2O5, the dry matter accumulation in the leaves and the stem also followed three stages, with the first stage occurring from 0 to 28 DAT (the leaves) and 0 to 42 DAT (the stem), the second from 28 to 56 DAT (the leaves) and 43 to 70 DAT (the stem), and the third from 57 to 98 DAT (the leaves) and 71 to 98 DAT (the stem). In the first stage, the plants accumulated 5.0 and 0.8 g plant−1 in the leaves and the stem (15.65% and 2.42% of the total accumulated by 98 DAT), respectively. In the second stage, the plants accumulated approximately 23.8 and 28.7 g plant−1 in the leaves and the stem, representing 74% and 91% of the total accumulated, respectively.
At the harvest point for fresh consumption, i.e., at 35 DAT, the plants had accumulated 11.1 and 24.9 g plant−1 of dry matter, corresponding to 10.1% and 20.6% of the total dry matter accumulated at the doses of 320 and 800 kg ha−1 of P2O5, respectively.
3.3. Macronutrients Accumulation
At the dose of 800 kg ha
−1 of P
2O
5, the nitrogen accumulation in the leaves occurred sharply during the first 42 days after the transplanting (DAT) and then stabilized. The stem showed a more gradual nitrogen accumulation compared to the leaves during the first 42 DAT, followed by a more pronounced increase after 42 DAT, coinciding with a stem elongation due to the formation of the reproductive stalk. In the reproductive part, the nitrogen accumulation was more intense and almost linear from 56 DAT onward, at the time of the floral bud emergence (
Figure 3A).
At the dose of 320 kg ha
−1 of P
2O
5, the nitrogen accumulation in the leaves and the stem increased throughout the cycle, although it was less intense after 70 DAT and did not reach stabilization as observed with the higher dose and in the dry matter data (
Figure 2). In the reproductive part, the accumulation became more pronounced after 70 DAT (
Figure 3B).
The nitrogen accumulation in the plant (total) followed a continuous growth pattern up to 98 days after transplanting (DAT), fitting a sigmoidal curve. This accumulation could be divided into two distinct stages for both the phosphorus doses, in a similar way to the dry matter accumulation pattern. The first stage occurred from 0 to 28 DAT, during which the nitrogen accumulation reached 198.5 and 171.7 mg per plant—representing approximately 13% and 9.8% of the total at the end of the cycle—for the 800 and 320 kg ha−1 doses, respectively. The daily accumulation rate during this phase averaged 7.0 and 6.1 mg per plant per day.
From 29 to 98 DAT, the nitrogen uptake intensified considerably. During this second stage, the plants accumulated 1329.2 and 1571.5 mg per plant—equivalent to 87.0% and 90.2% of the total nitrogen content—for the 800 and 320 kg ha
−1 doses, respectively. The average daily accumulation rates in this phase were 19.0 and 22.45 mg per plant per day (
Figure 3A,B).
At the end of the cycle, the total nitrogen accumulation for the 800 kg ha
−1 dose reached 1527.7 mg per plant, with 40% allocated to the leaves, 13% to the stem, and 48% to the reproductive structures. A similar distribution was observed under the 320 kg ha
−1 dose, with a total nitrogen accumulation of 1743.17 mg per plant, 42% in the leaves, 17% in the stem, and 41% in the reproductive part (
Figure 3A,B).
The overall nitrogen accumulation pattern was similar to that of the total dry matter accumulation, with a limited uptake before 28 DAT and most of the nitrogen being absorbed between 29 and 98 DAT under both the phosphorus treatments (
Figure 2A,B).
Interestingly, even though the reproductive structures represented only 37% (
Figure 2A) and 34% (
Figure 2B) of the total dry mass at 98 DAT for the 800 and 320 kg ha
−1 doses, respectively, they accounted for a significant proportion of the total nitrogen accumulation, 48% and 41%, respectively.
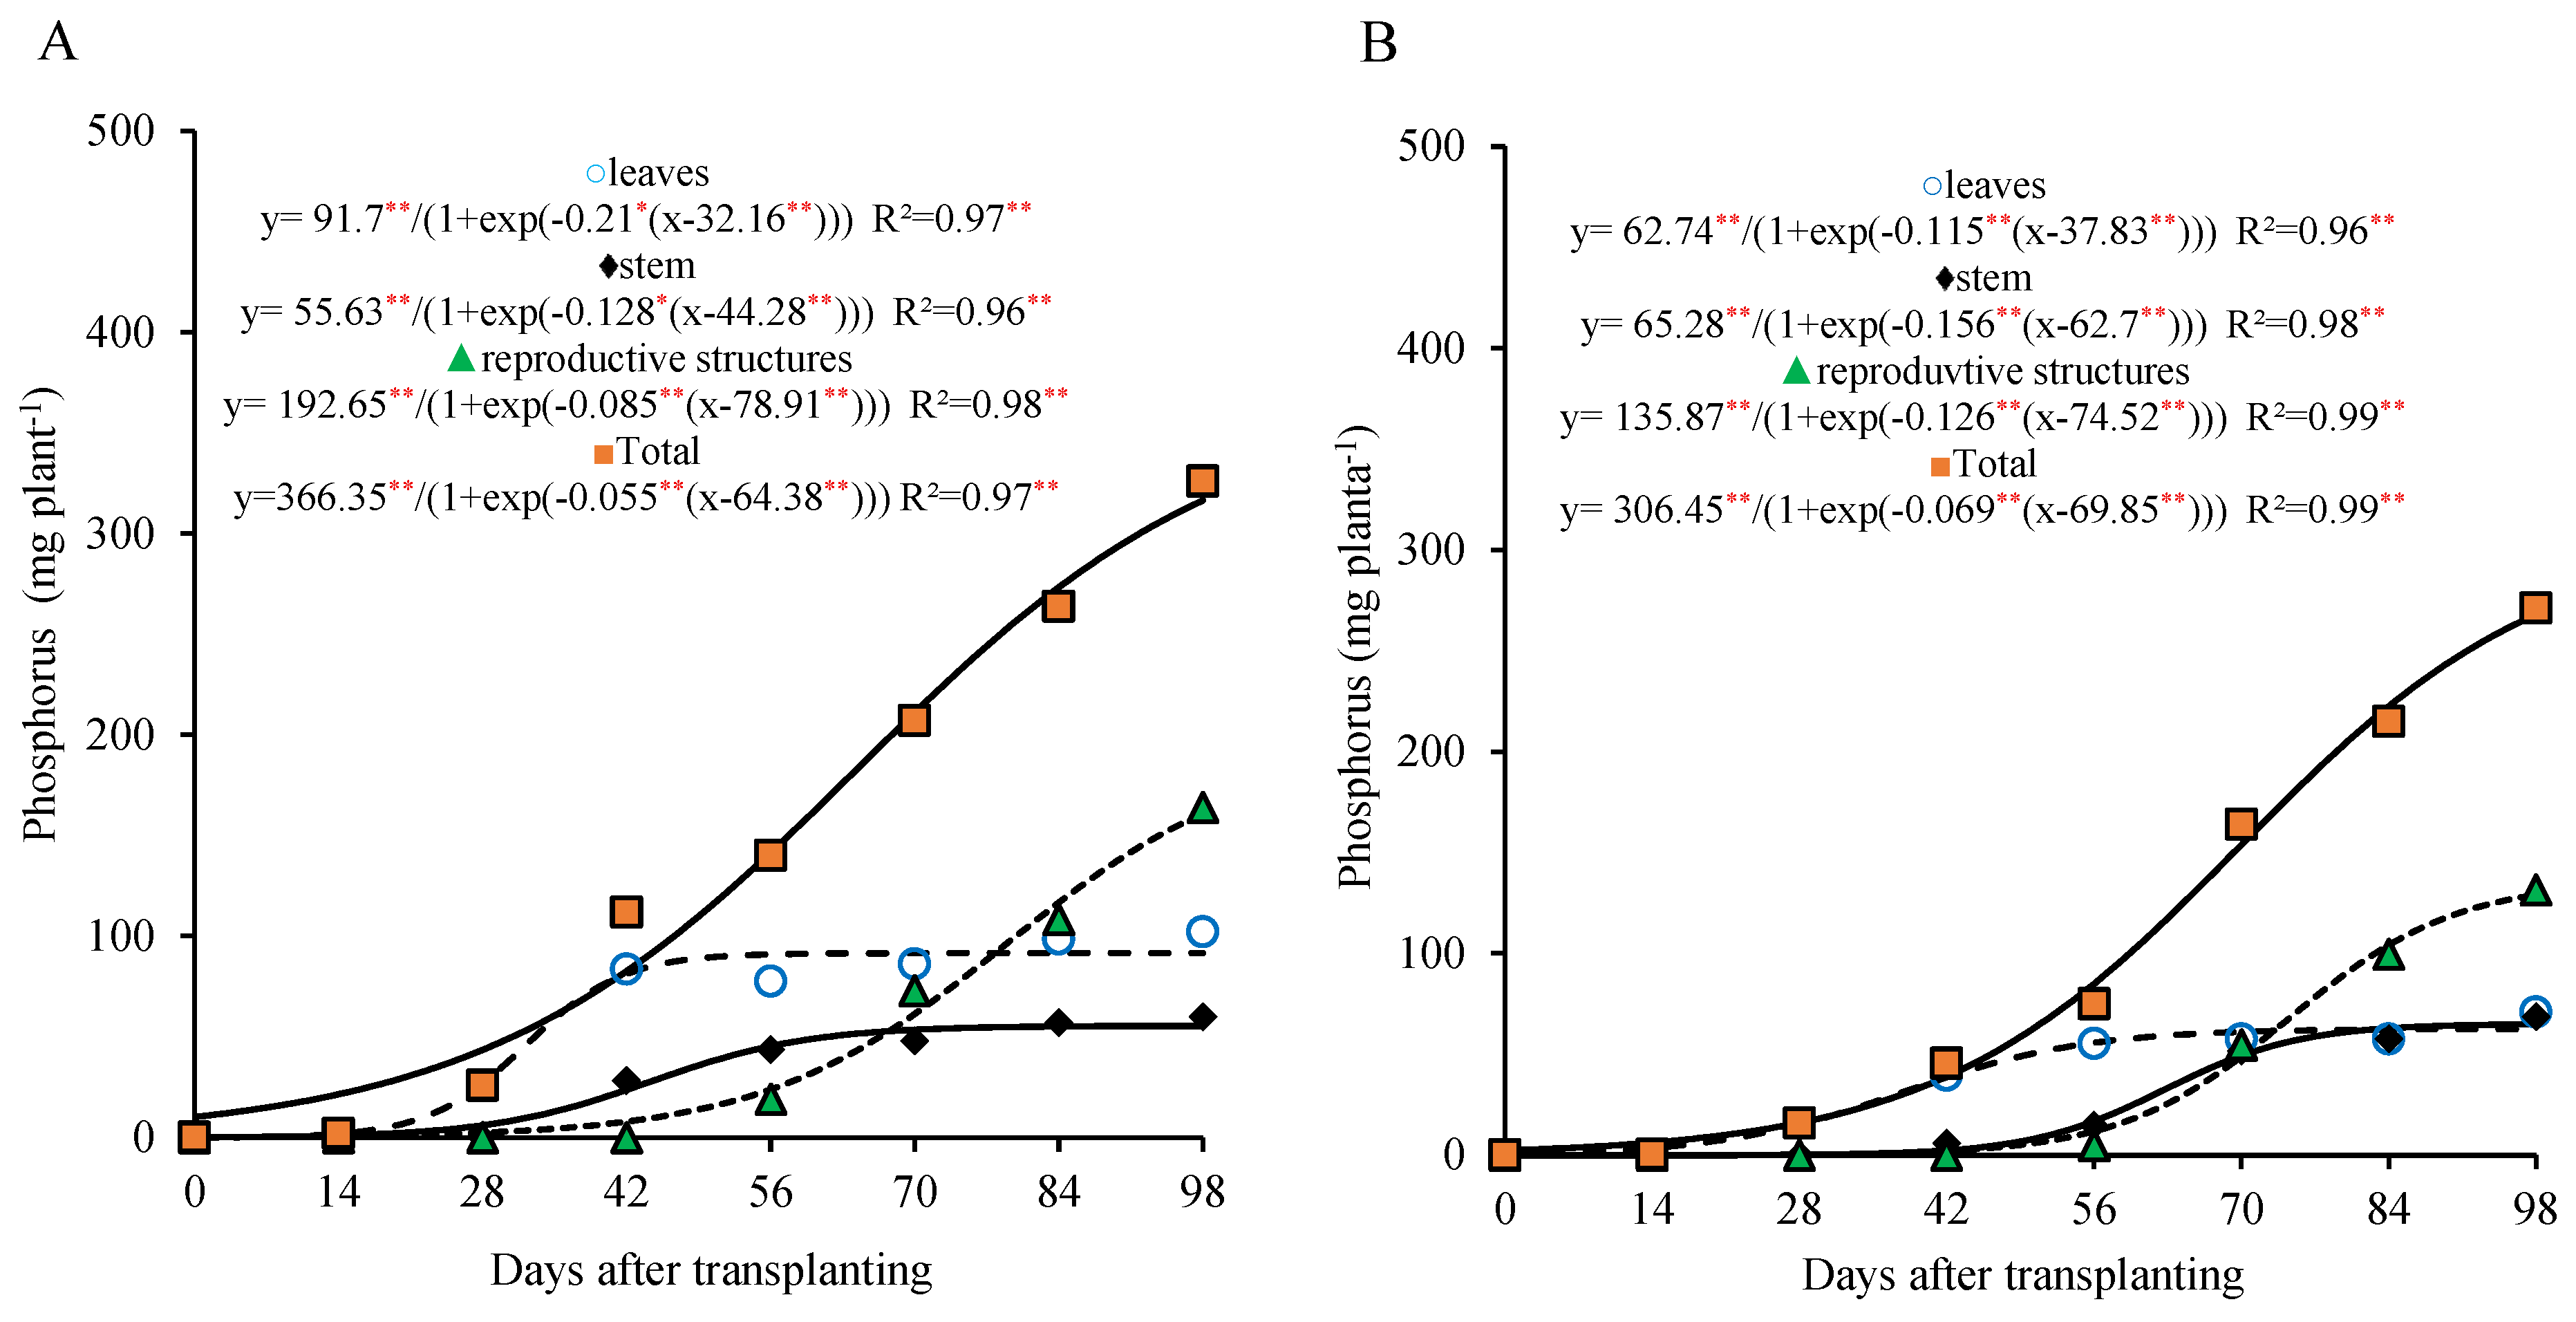
The phosphorus accumulation exhibited a pattern similar to that of the nitrogen in the different parts of the plant, with a faster accumulation in the leaves and a more gradual increase in the stem during the first weeks after transplanting. This accumulation stabilized between 42 and 56 days after transplantation (DAT), respectively, and was accentuated in the reproductive structures from 70 DAT (
Figure 4A,B).
For the total phosphorus in the plant, two growth stages were also observed for the 800 kg ha
−1 P
2O
5 dose: the first between 0 and 28 DAT, and the second from 29 to 98 DAT. In the first stage, the plant accumulated approximately 12.0% of the total phosphorus (35.7 mg plant
−1), with an average of 1.3 mg plant
−1 day
−1. In the second stage, the phosphorus accumulation was more pronounced, reaching 272.2 mg plant
−1 by the end of the period (about 88.4% of the total accumulated), with an average of 3.8 mg plant
−1 day
−1. At the end of the cycle, the total accumulation reached 308.2 mg plant
−1, distributed among the leaves, the stem, and the reproductive parts in proportions of 30%, 18%, and 52%, respectively (
Figure 4A).
For the 320 kg ha
−1 P
2O
5 dose, two growth stages were also observed, with the first occurring between 0 and 42 DAT and the second from 43 to 98 DAT. In the first stage, the plant accumulated about 16.9% of the total phosphorus (43.4 mg plant
−1), with an average of 1.03 mg plant
−1 day
−1. In the second stage, the phosphorus accumulation became more pronounced, reaching 213.3 mg plant
−1 by the end of the period (approximately 83.1% of the total accumulated), with an average of 3.8 mg plant
−1 day
−1. At the end of the cycle, the total phosphorus accumulation was 256.9 mg plant
−1, distributed among the leaves, the stem, and the reproductive parts in proportions of 25%, 25%, and 50%, respectively (
Figure 4B).
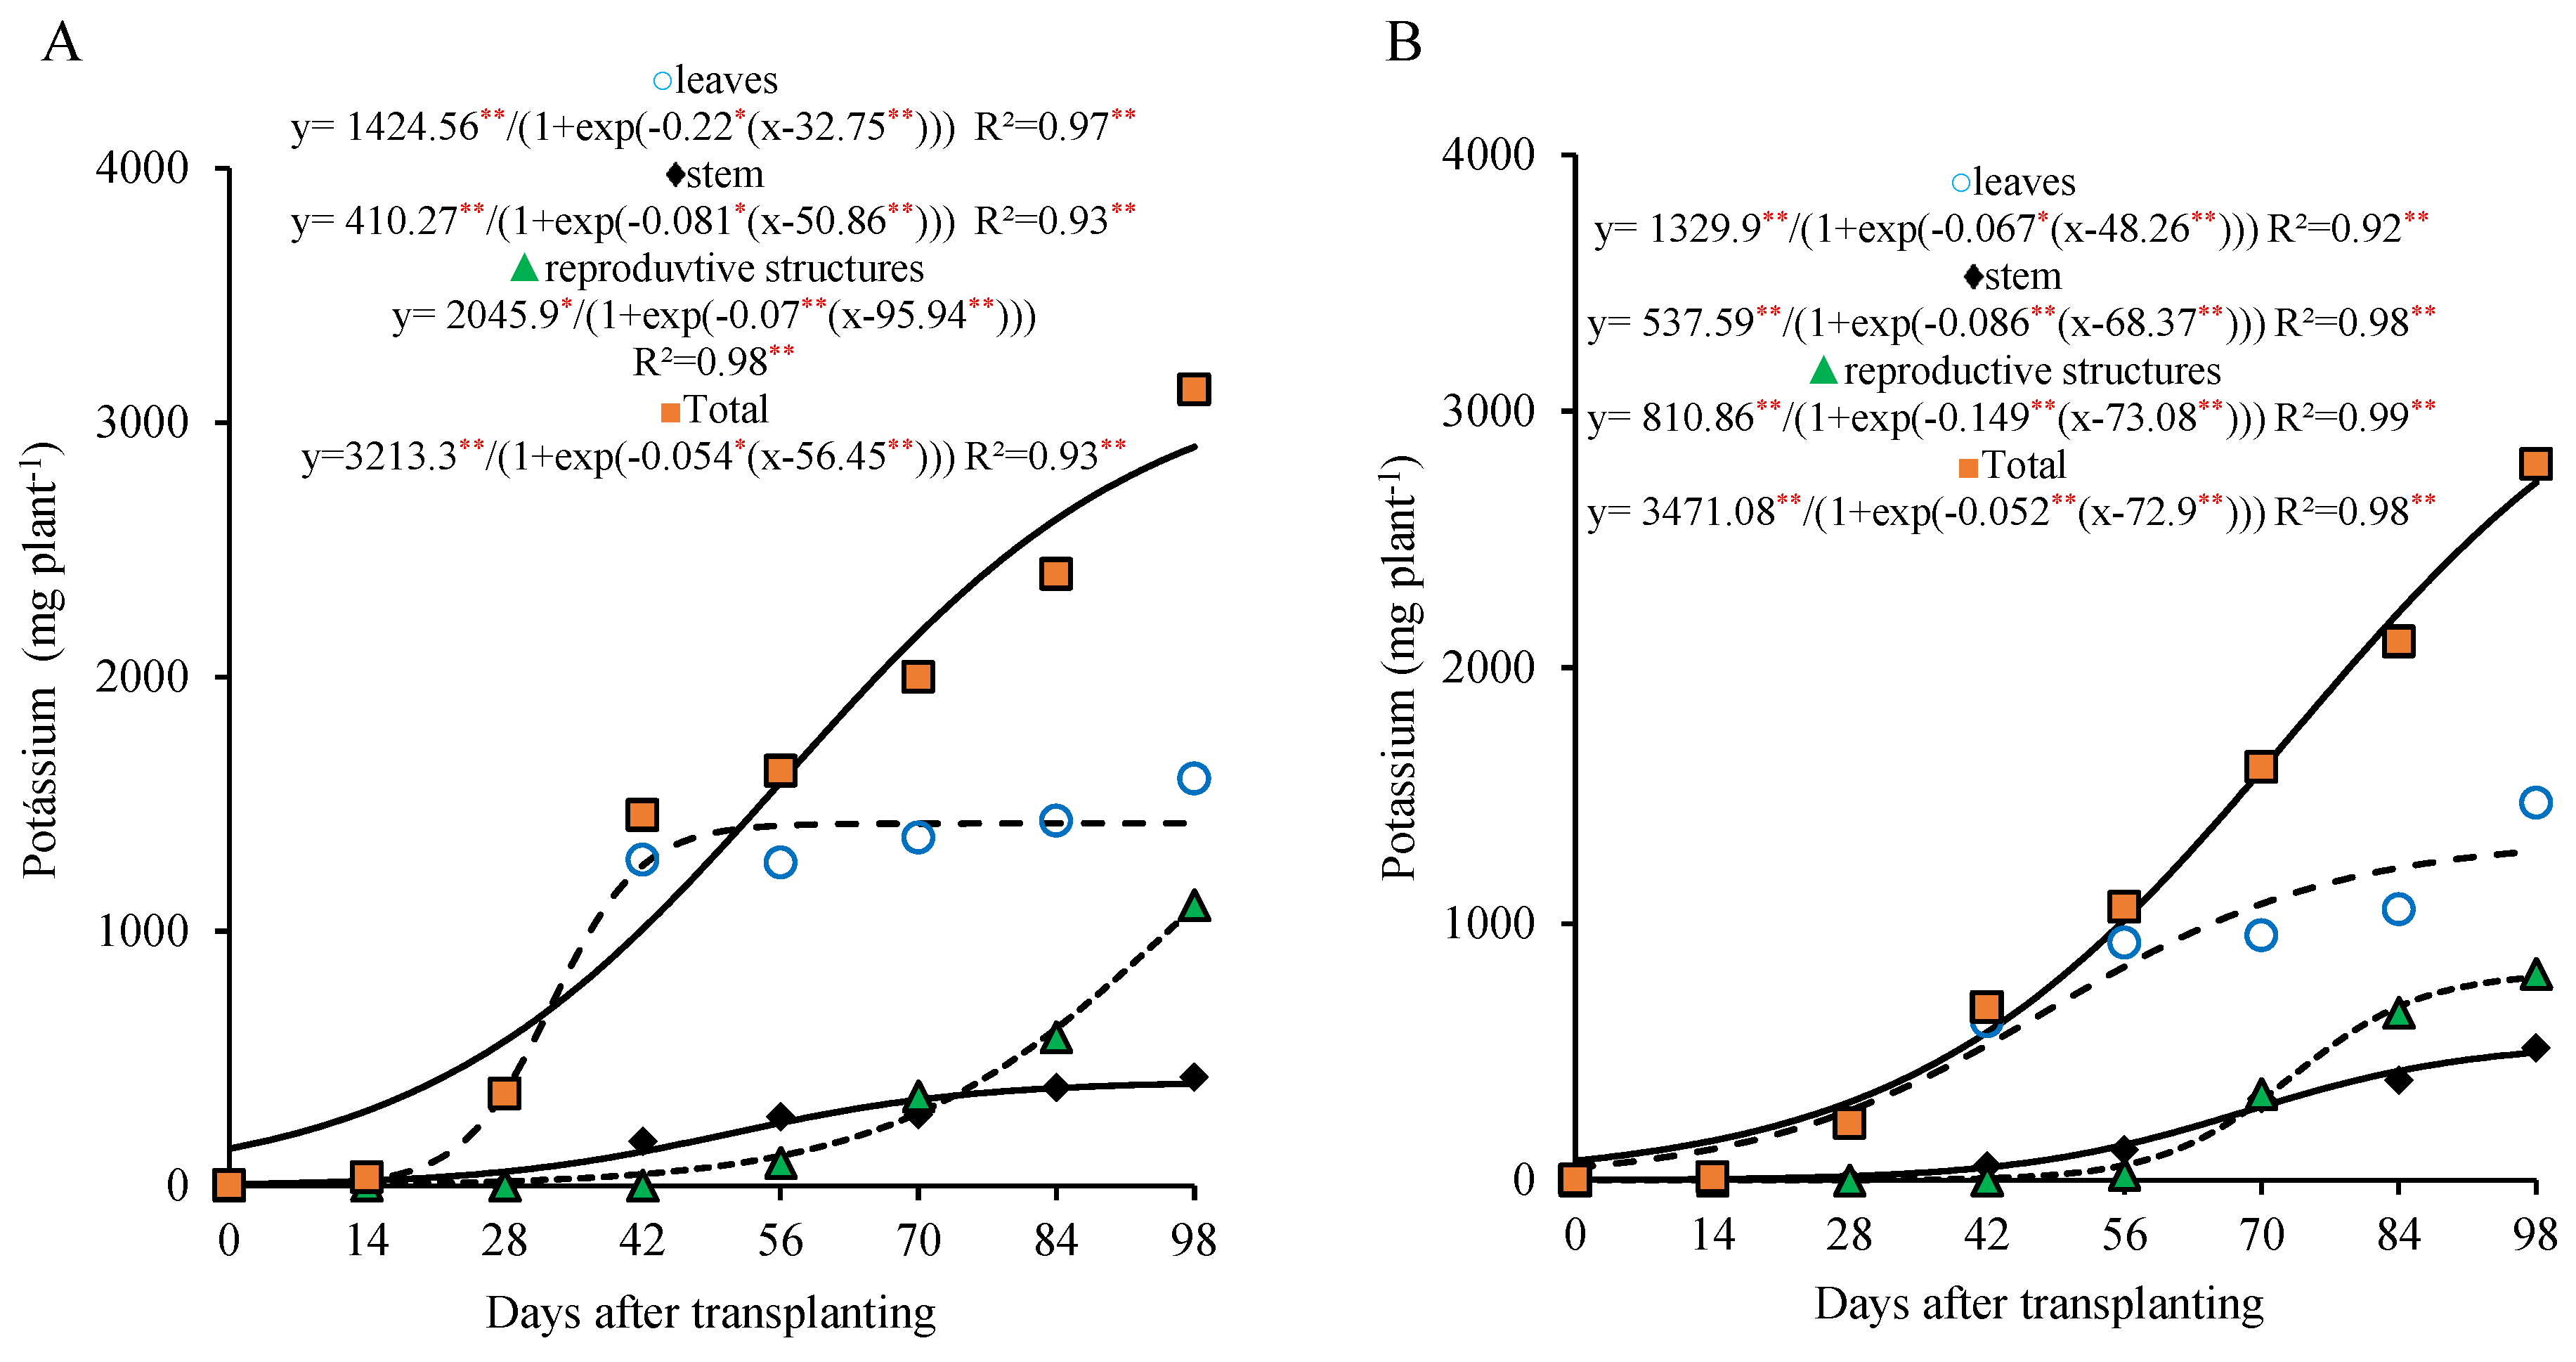
For the 800 kg ha
−1 P
2O
5 dose, the potassium accumulation in the leaves was pronounced, with the highest increase occurring around 56 DAT, followed by stabilization thereafter. The stem showed a more gradual potassium accumulation, with the growth leveling off after 70 DAT. On the other hand, the potassium accumulation in the reproductive part began to intensify from 70 DAT onward, increasing almost steadily until the end of the cycle (
Figure 5A).
For the 320 kg ha
−1 P
2O
5 dose, the sigmoid curve shows a continuous and gradual accumulation of potassium in the leaves and the stem until the end of the cycle (98 DAT), although this was less intense during the last two sampling dates. The potassium accumulation in the reproductive part began later, from 70 DAT, reaching a maximum of 791.54 mg plant
−1 by the end of the cycle (
Figure 5B).
The curve of the total potassium accumulation in the plant shows a continuous and significant increase around 98 DAT and can be divided into two stages; the first from 0 to 28 DAT and the second from 29 to 98 DAT for both the doses studied. In the first stage, the plant accumulated 443.8 and 289.3 mg plant−1 (about 15.2% and 11.2% of the total accumulated by the end of the cycle), with averages of 15.8 and 10.3 mg plant−1 day−1 at 800 and 320 kg ha−1 of P2O5, respectively. In the second stage, an accumulation of 2478.8 and 2284.9 mg plant−1 was recorded (84.8% and 88.8% of the total accumulated by the end of the cycle), with averages of 38.2 and 32.6 mg plant−1 day−1, respectively.
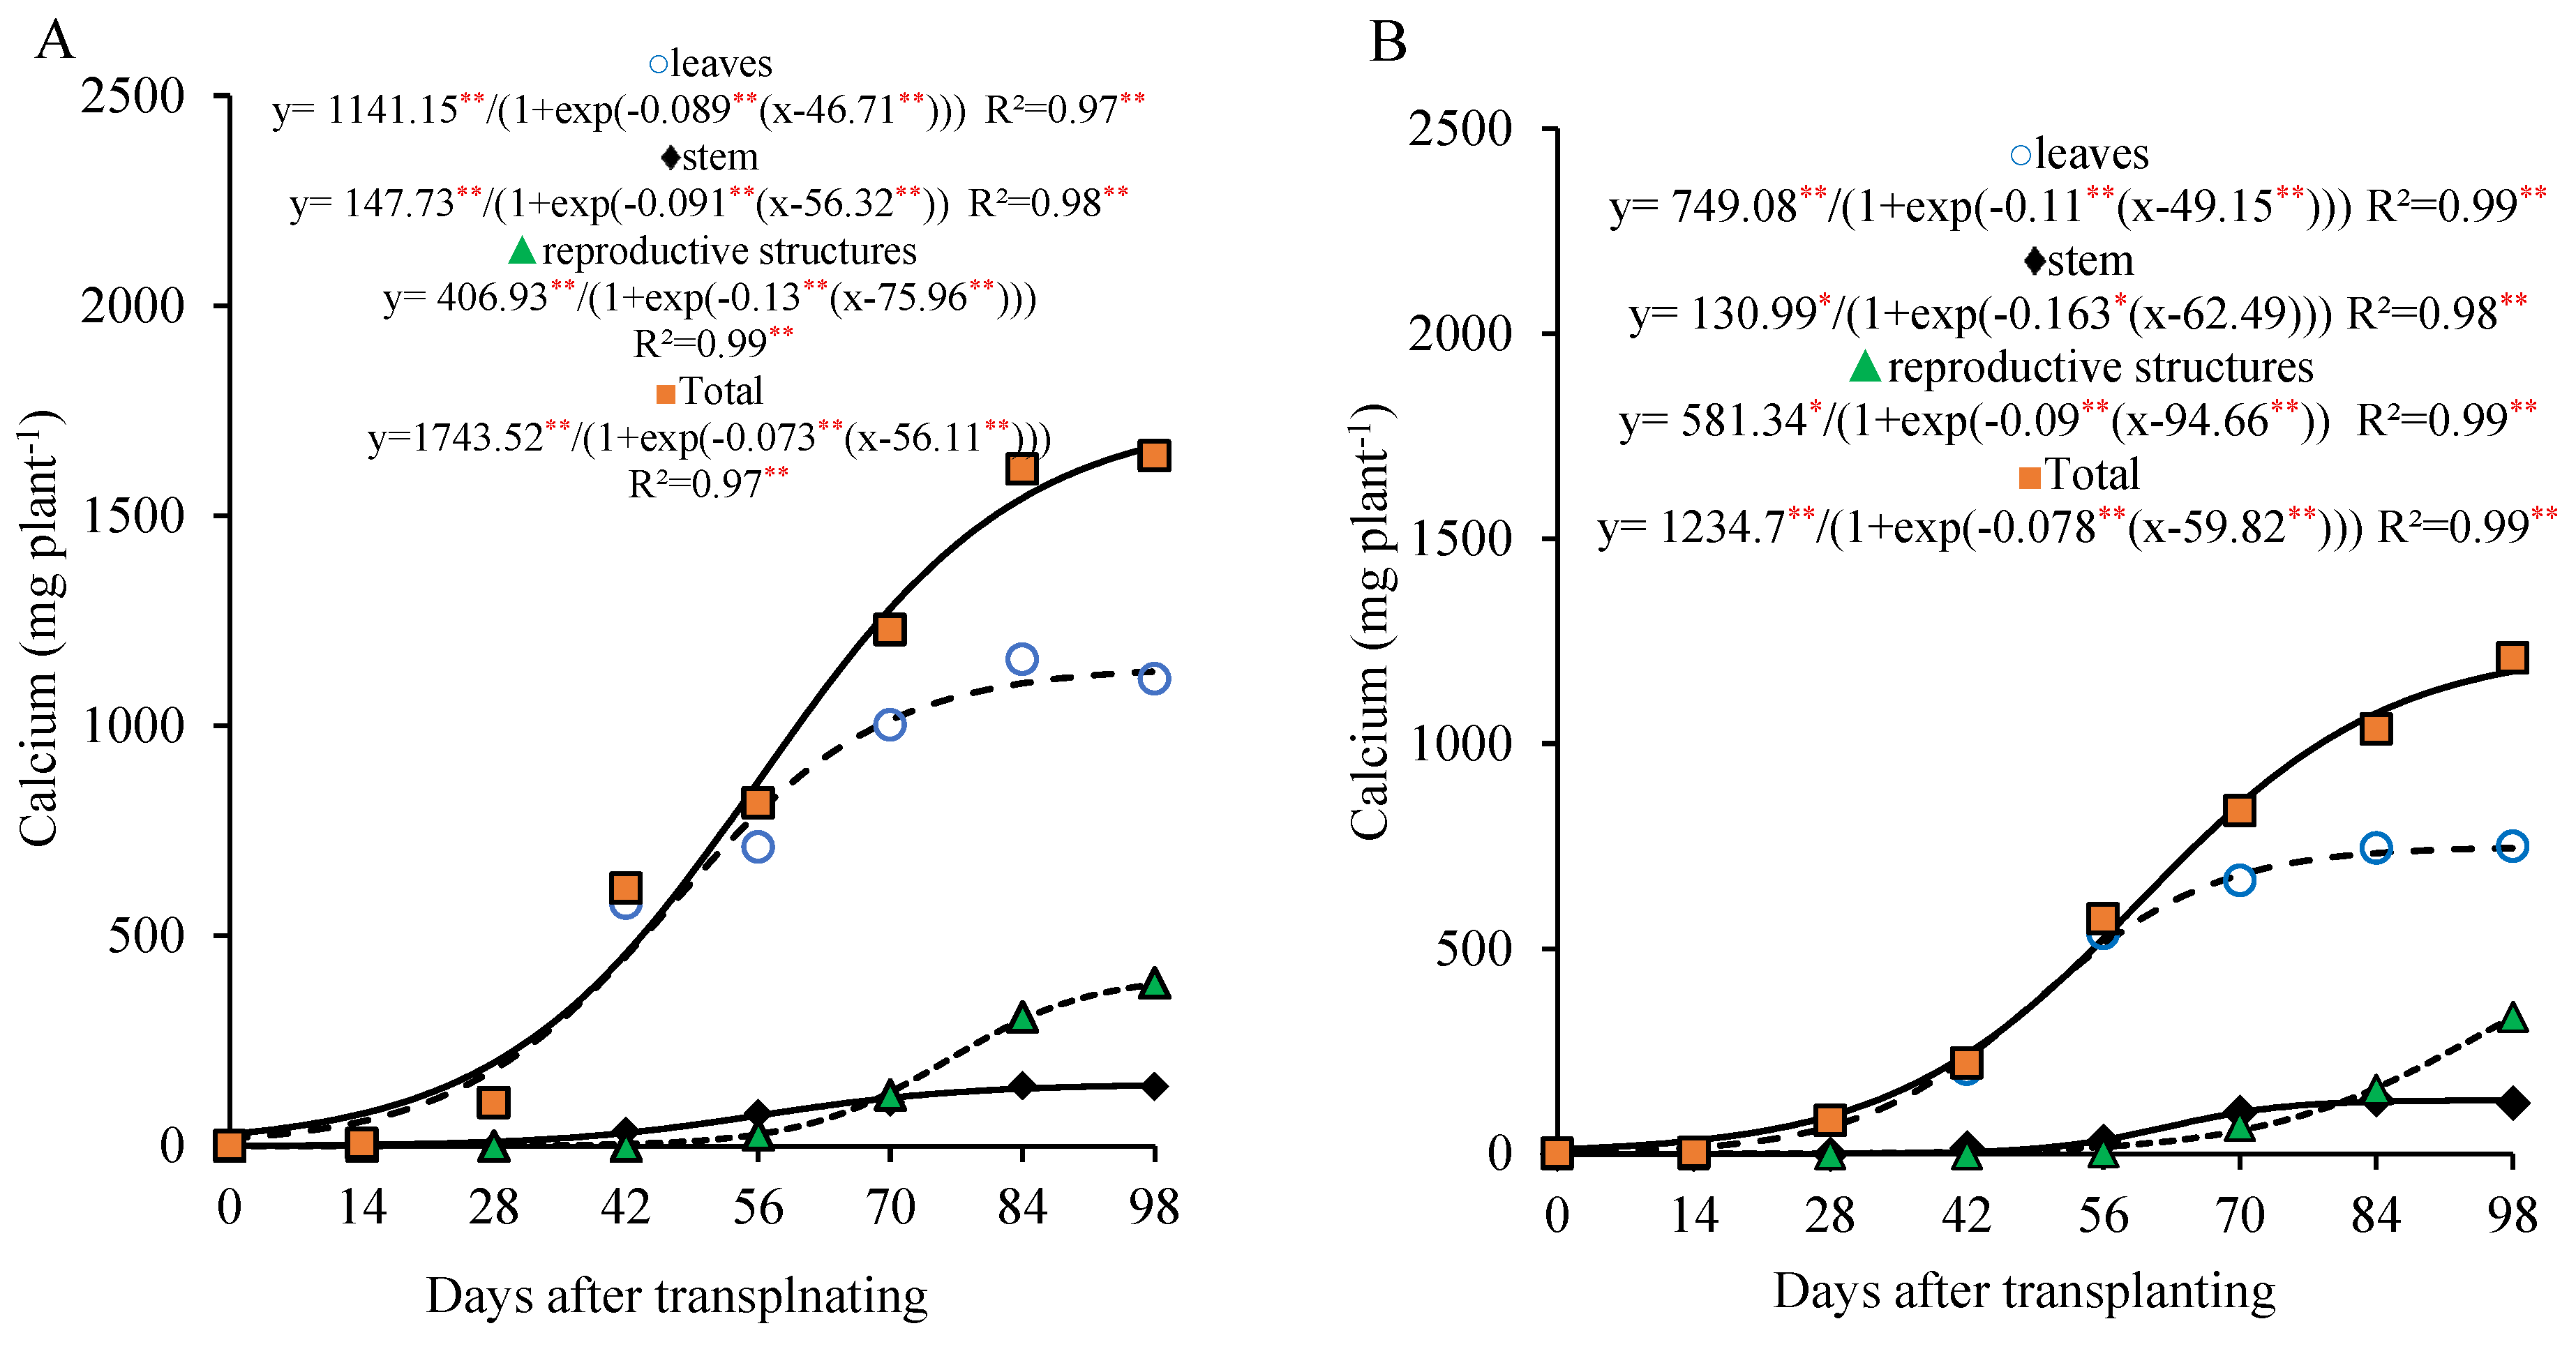
Calcium showed a marked accumulation in the leaves up to 56 DAT and a gradual increase in the stem throughout the lettuce growth cycle. In the reproductive part, the calcium accumulation became more pronounced from 70 DAT onward, with 66.6% (800 kg ha
−1 of P
2O
5) and 83.05% (320 kg ha
−1 of P
2O
5) of the total calcium in these parts accumulating after this period (
Figure 6A,B).
The total calcium accumulation curve shows a continuous increase of up to 98 DAT, with a more marked rate between 28 and 70 DAT, during which the plant accumulated about 64.1% of the total calcium (1063.9 and 776.7 mg plant−1), with an average of 25.3 and 18.5 mg plant−1 day−1 at the doses of 800 and 320 kg ha−1 of P2O5, respectively. After 70 DAT, the plant accumulated approximately 24.2% and 30.7% of the total calcium, and the average daily accumulation dropped to 14.4 and 13.3 mg plant−1 day−1 until the end of the cycle, for the doses of 800 and 320 kg ha−1 of P2O5, respectively.
At 98 DAT, under the 800 kg ha−1 P2O5 dose, the total calcium accumulation was 1658.4 mg plant−1, with approximately 77.0% found in the vegetative part and 23.0% in the reproductive part. Under the 320 kg ha−1 P2O5 dose, the total calcium accumulation was 1210.2 mg plant−1, with 72.4% in the vegetative part and 27.6% in the reproductive part.
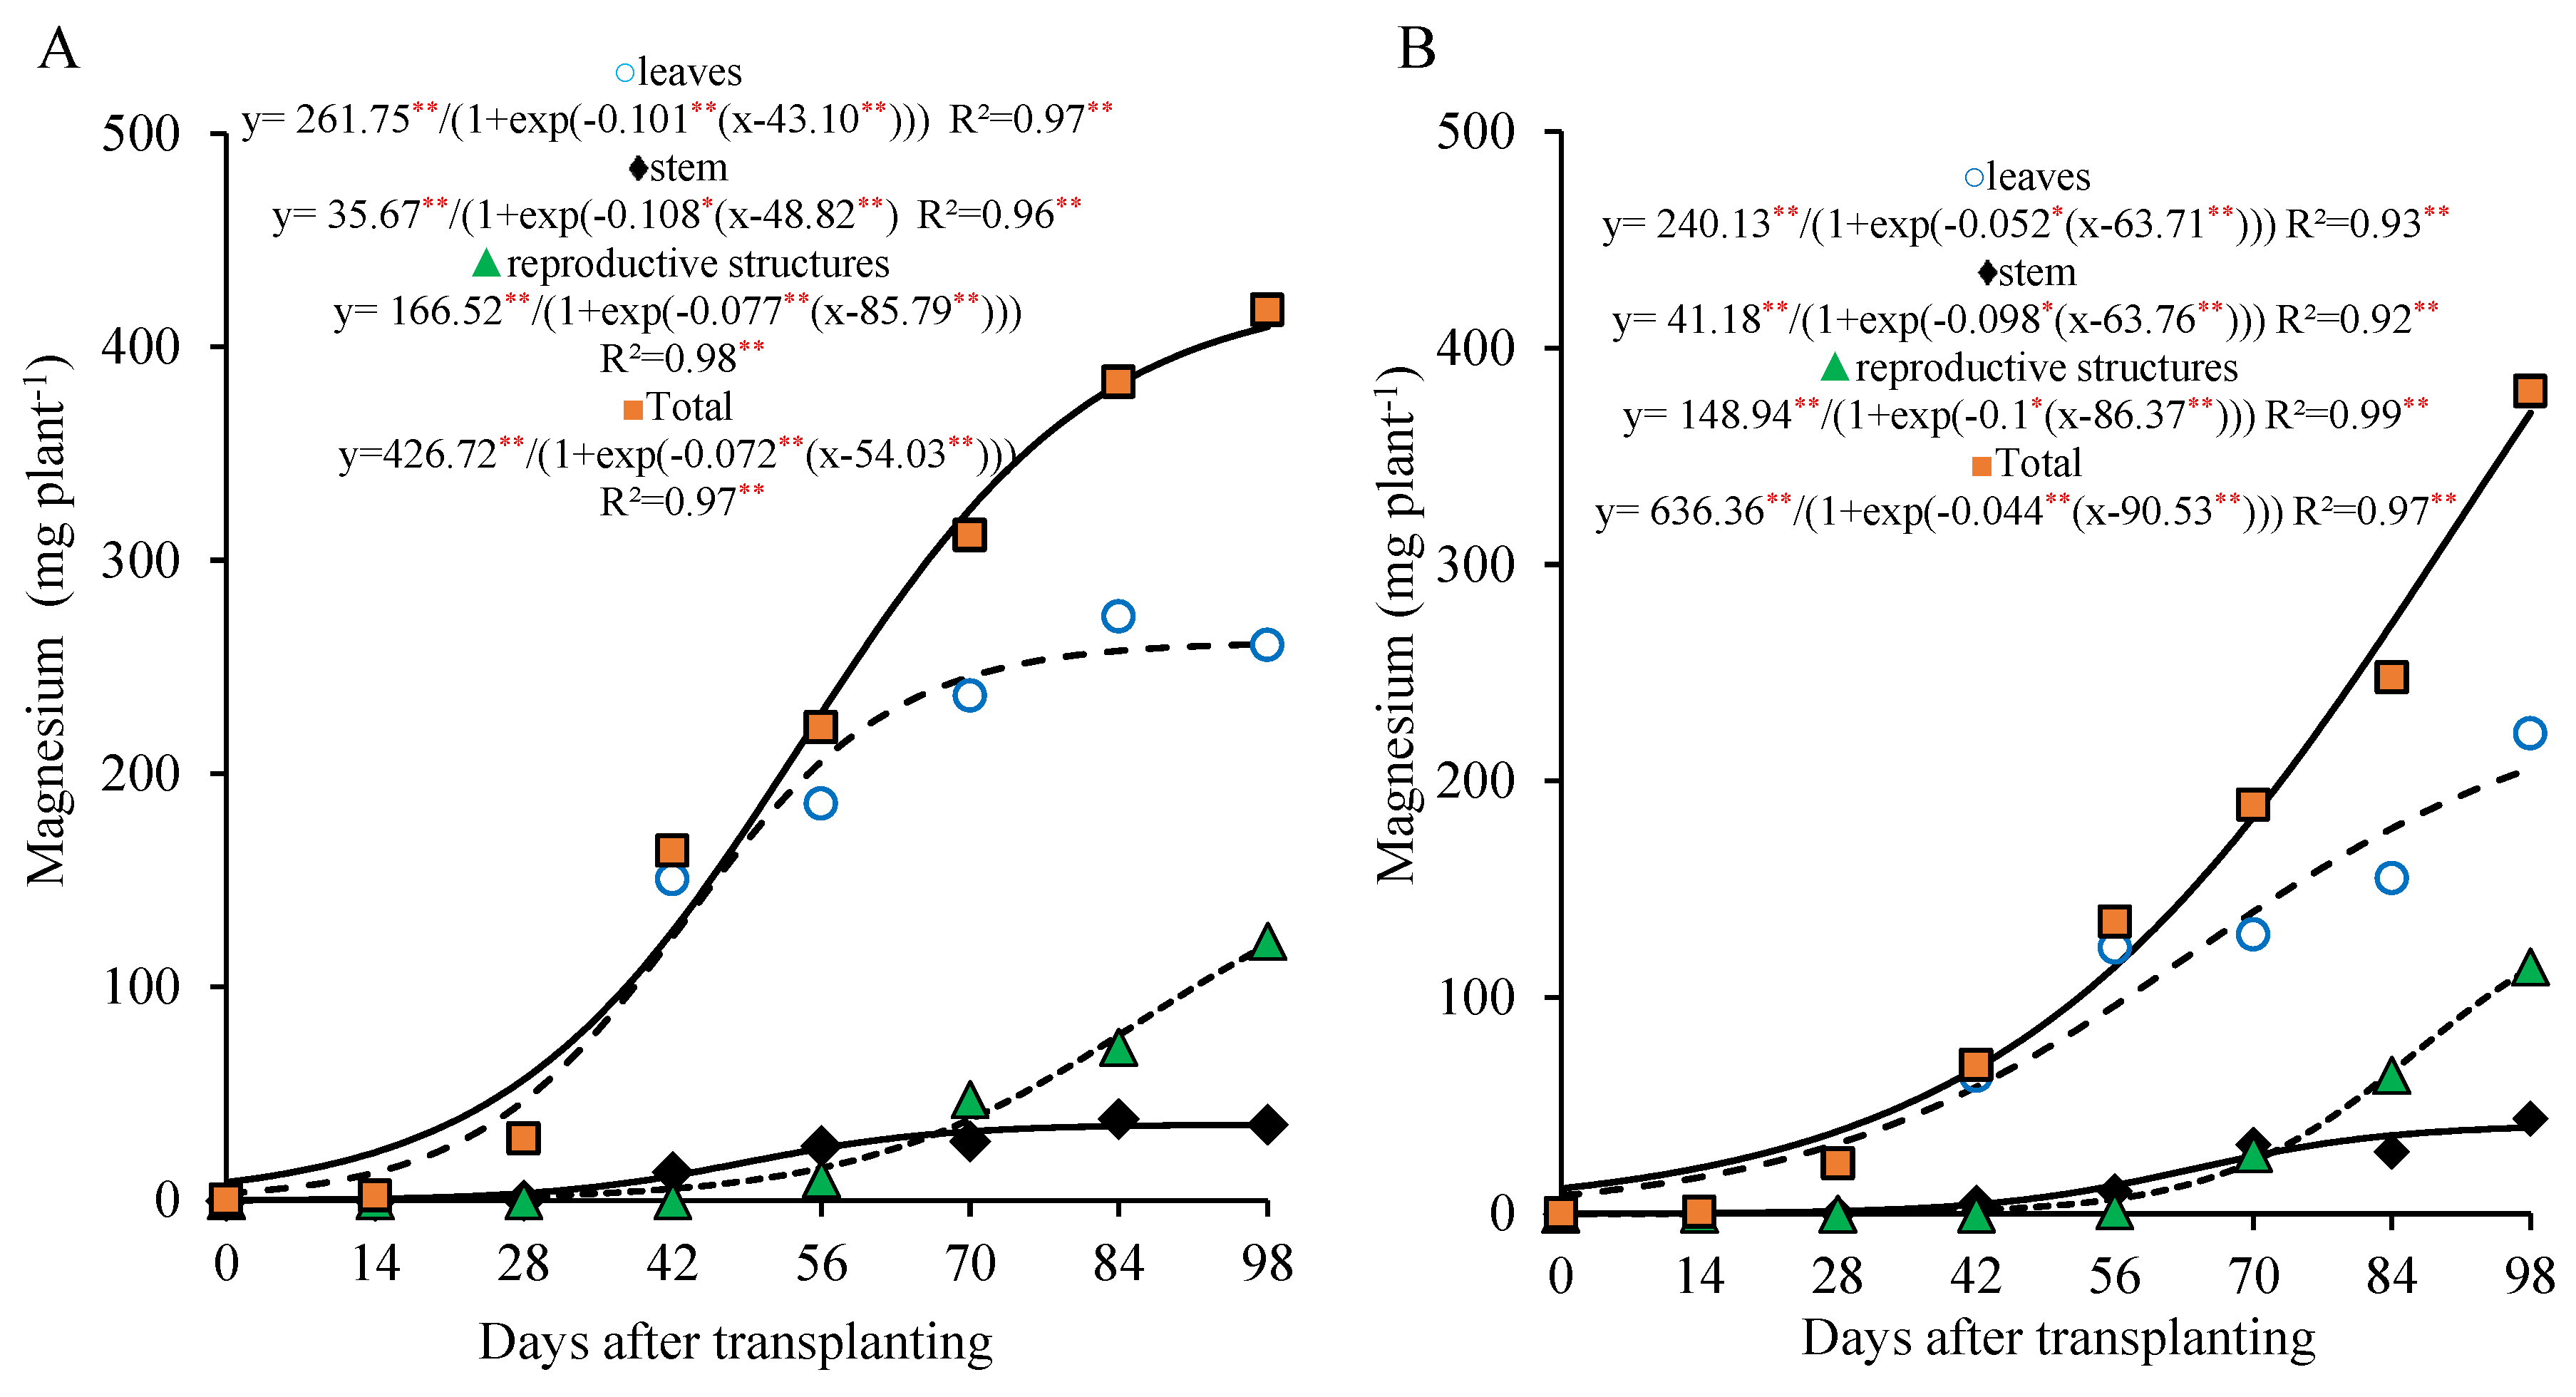
The magnesium accumulation curve for the 800 kg ha
−1 P
2O
5 dose in the leaves and the stem followed a pattern similar to that of the calcium, with more pronounced values in the leaves until 56 DAT and a gradual accumulation in the stem, which reached its maximum at the end of the cycle. In the reproductive part, the magnesium accumulation became more intense after 70 DAT, with approximately 68.2% of the total magnesium in these organs being accumulated after this period. The total magnesium accumulation was slow from the transplanting to 28 DAT, with an average of 1.86 mg plant
−1 day
−1. From 29 to 98 DAT, the average accumulation rose to 5.14 mg plant
−1 day
−1, during which about 87.5% of the total magnesium was accumulated. At 98 DAT, the total magnesium accumulation reached 416 mg plant
−1, with 63% in the leaves, 9% in the stem, and 29% in the reproductive part (
Figure 7A).
At the 320 kg ha
−1 P
2O
5 dose, the trend of the total magnesium accumulation was continuous and nearly linear, showing a low initial accumulation, with an average of 1.2 mg plant
−1 day
−1 until 28 DAT, increasing to 4.6 mg plant
−1 day
−1 between 29 and 98 DAT. During this second period, 90.5% of the total accumulated magnesium was recorded. At 98 DAT, the total magnesium accumulation was 358.8 mg plant
−1, with 57% in the leaves, 11% in the stem, and 32% in the reproductive part (
Figure 7B).
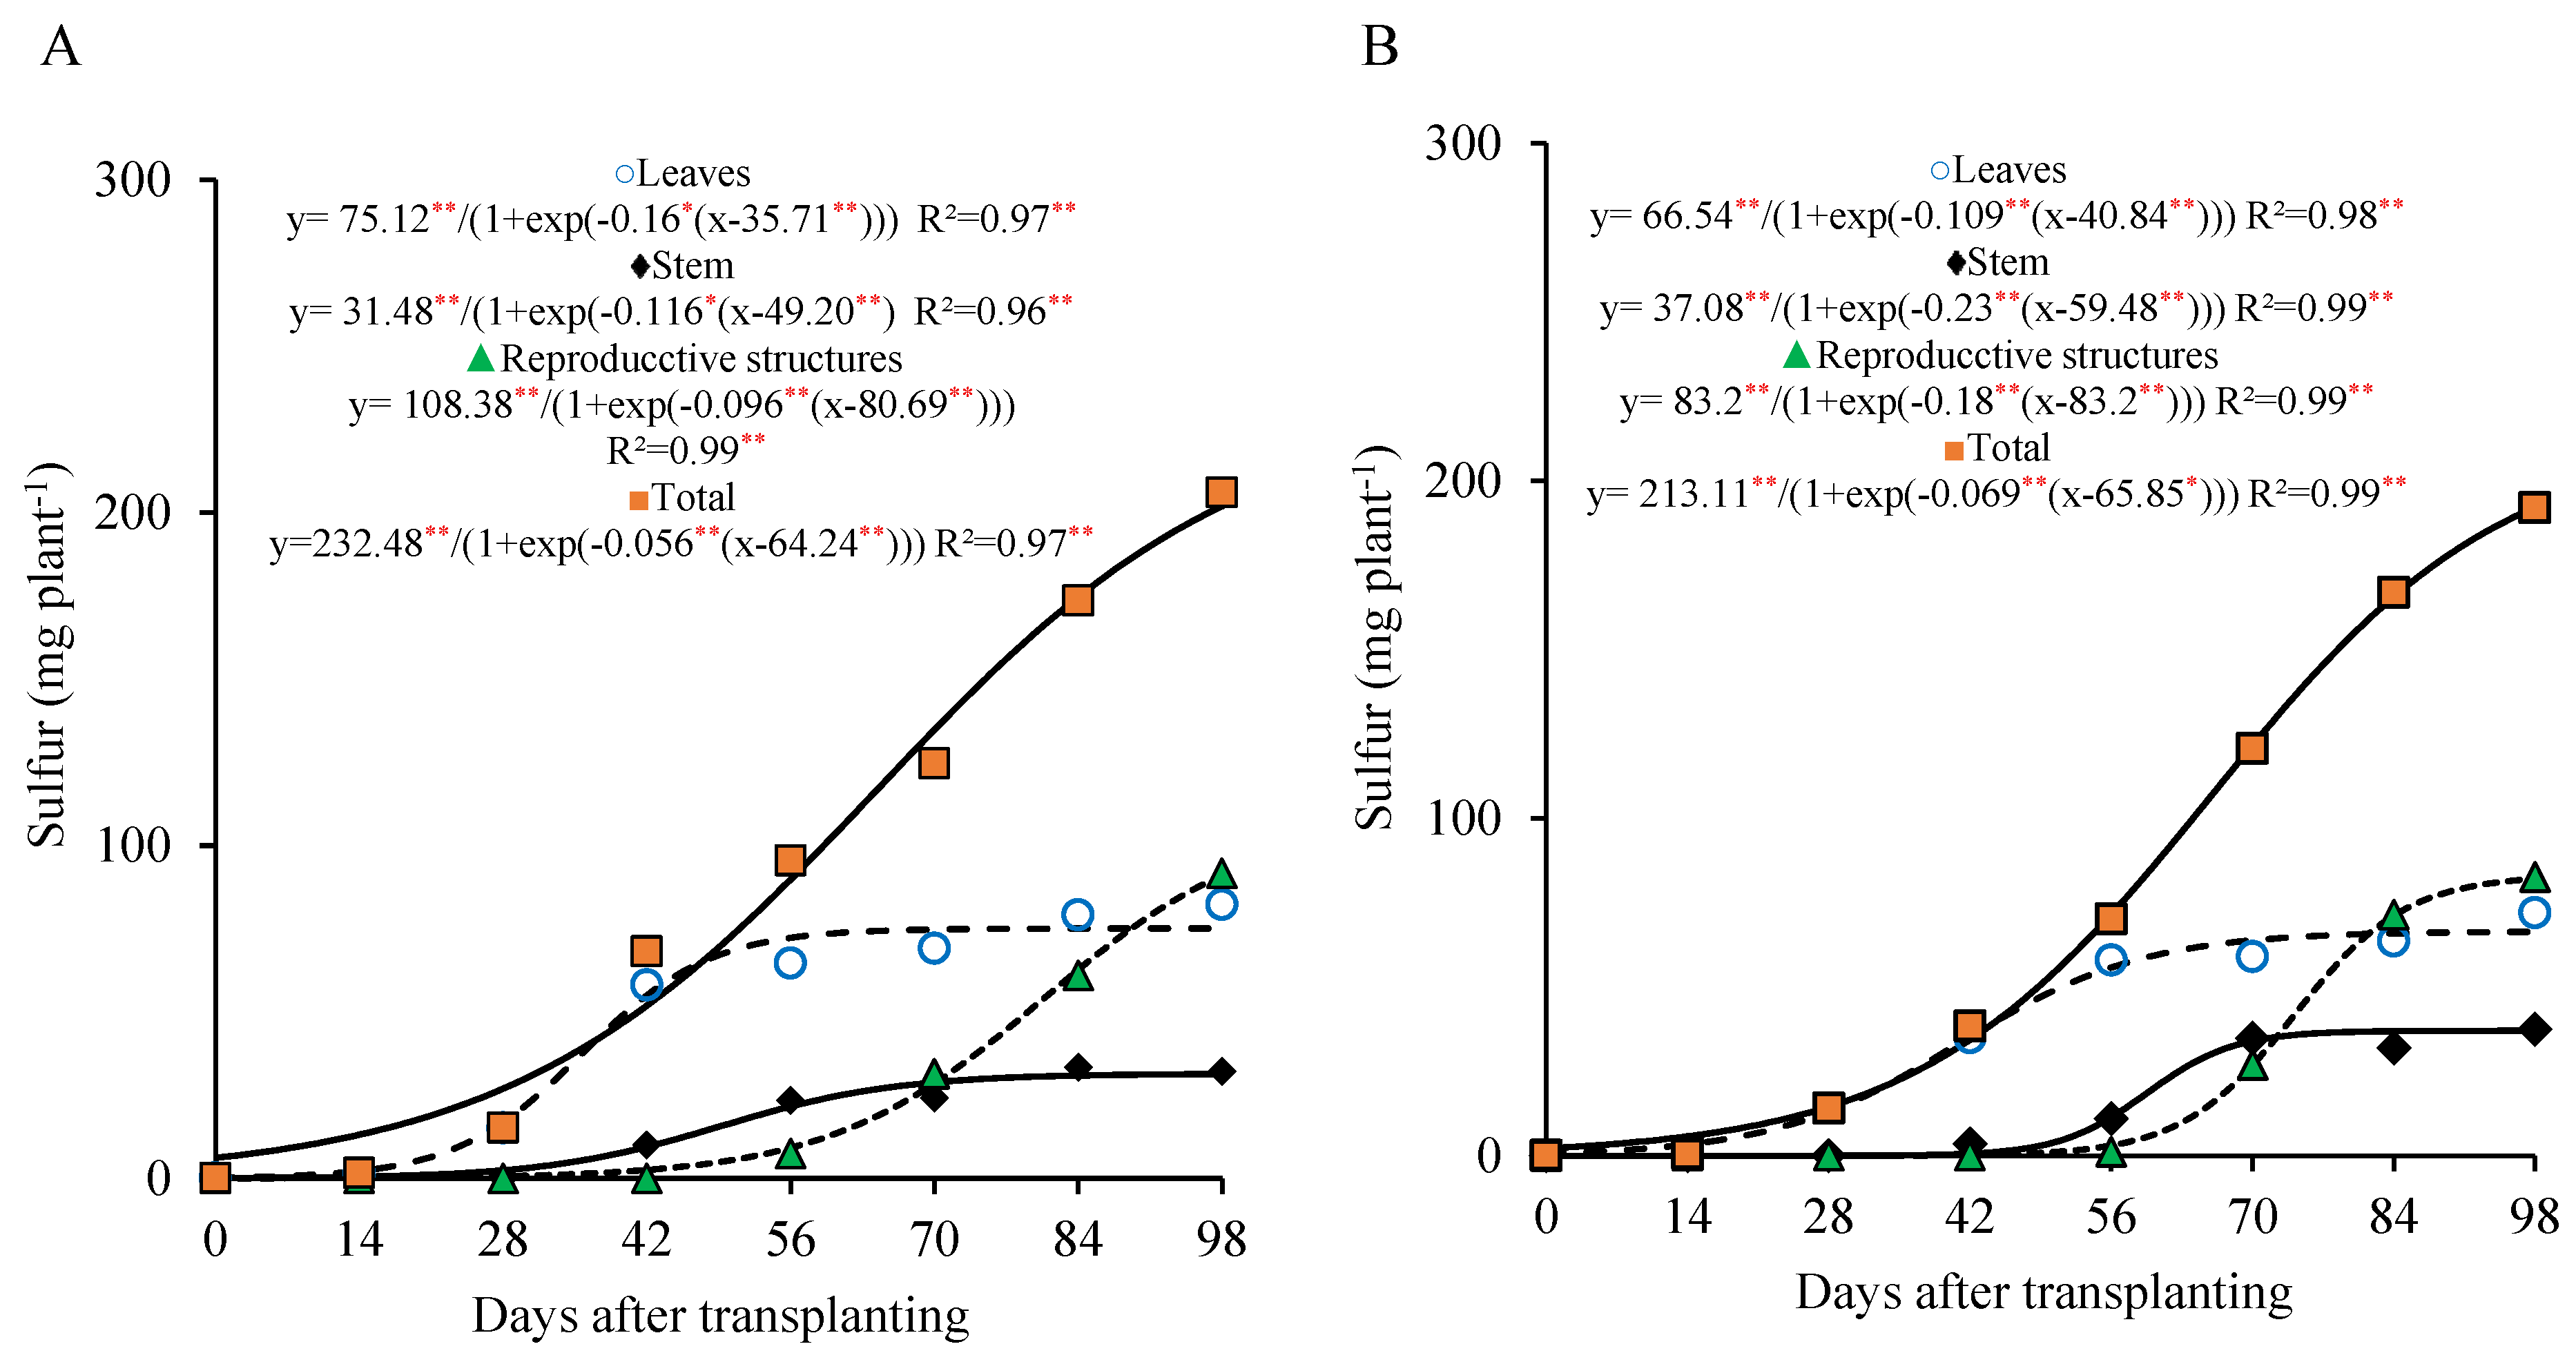
At the 800 kg ha
−1 P
2O
5 dose, the sulfur accumulation in the leaves was more prominent from 0 to 56 DAT, with approximately 73.7% of the maximum accumulated in this organ occurring during this period (55.4 mg plant
−1). In the stem, the sulfur accumulation tended to stabilize after 70 DAT, with a slower rate from 70 to 98 DAT, reaching a maximum of 31.4 mg plant
−1. In the reproductive part, the accumulation became more marked after 70 DAT, with about 69.3% of the total sulfur in this organ being accumulated during that period, ending the cycle with 91.0 mg plant
−1 (
Figure 8A).
On the other hand, under the 320 kg ha
−1 P
2O
5 dose, the sulfur accumulation in the leaves was more evident between 28 and 70 DAT, with 76.7% of the maximum accumulated during this interval (50.7 mg plant
−1). In the stem, the sulfur accumulation also tended to stabilize after 70 DAT, with a slower accumulation until 98 DAT, when a maximum of 37.0 mg plant
−1 was observed. In the reproductive part, the accumulation became more expressive after 70 DAT, with approximately 67.4% of the sulfur being accumulated in this period, ending the cycle with 82.0 mg plant
−1 (
Figure 8B).
Similar to nitrogen, the total sulfur accumulation curve followed the dry matter accumulation pattern, with the highest accumulation occurring from 28 to 98 DAT. During this period, 177.5 and 172.4 mg plant
−1 of sulfur were accumulated (representing 89.8% and 93.2% of the total sulfur accumulated by the end of the cycle), with an average of 2.53 and 2.46 mg plant
−1 day
−1 under the 800 and 320 kg ha
−1 P
2O
5 doses, respectively. As observed for the other macronutrients, the sulfur accumulation curve showed a continuous upward trend until 98 DAT, with total accumulations of 197.6 and 185.5 mg plant
−1 recorded at the end of the cycle. These values were distributed among the plant organs as follows: 38% and 36% in the leaves, 16% and 20% in the stem, and 46% and 44% in the reproductive parts, for the 800 and 320 kg ha
−1 P
2O
5 doses, respectively (
Figure 8A,B).
3.4. Daily Accumulation Rate
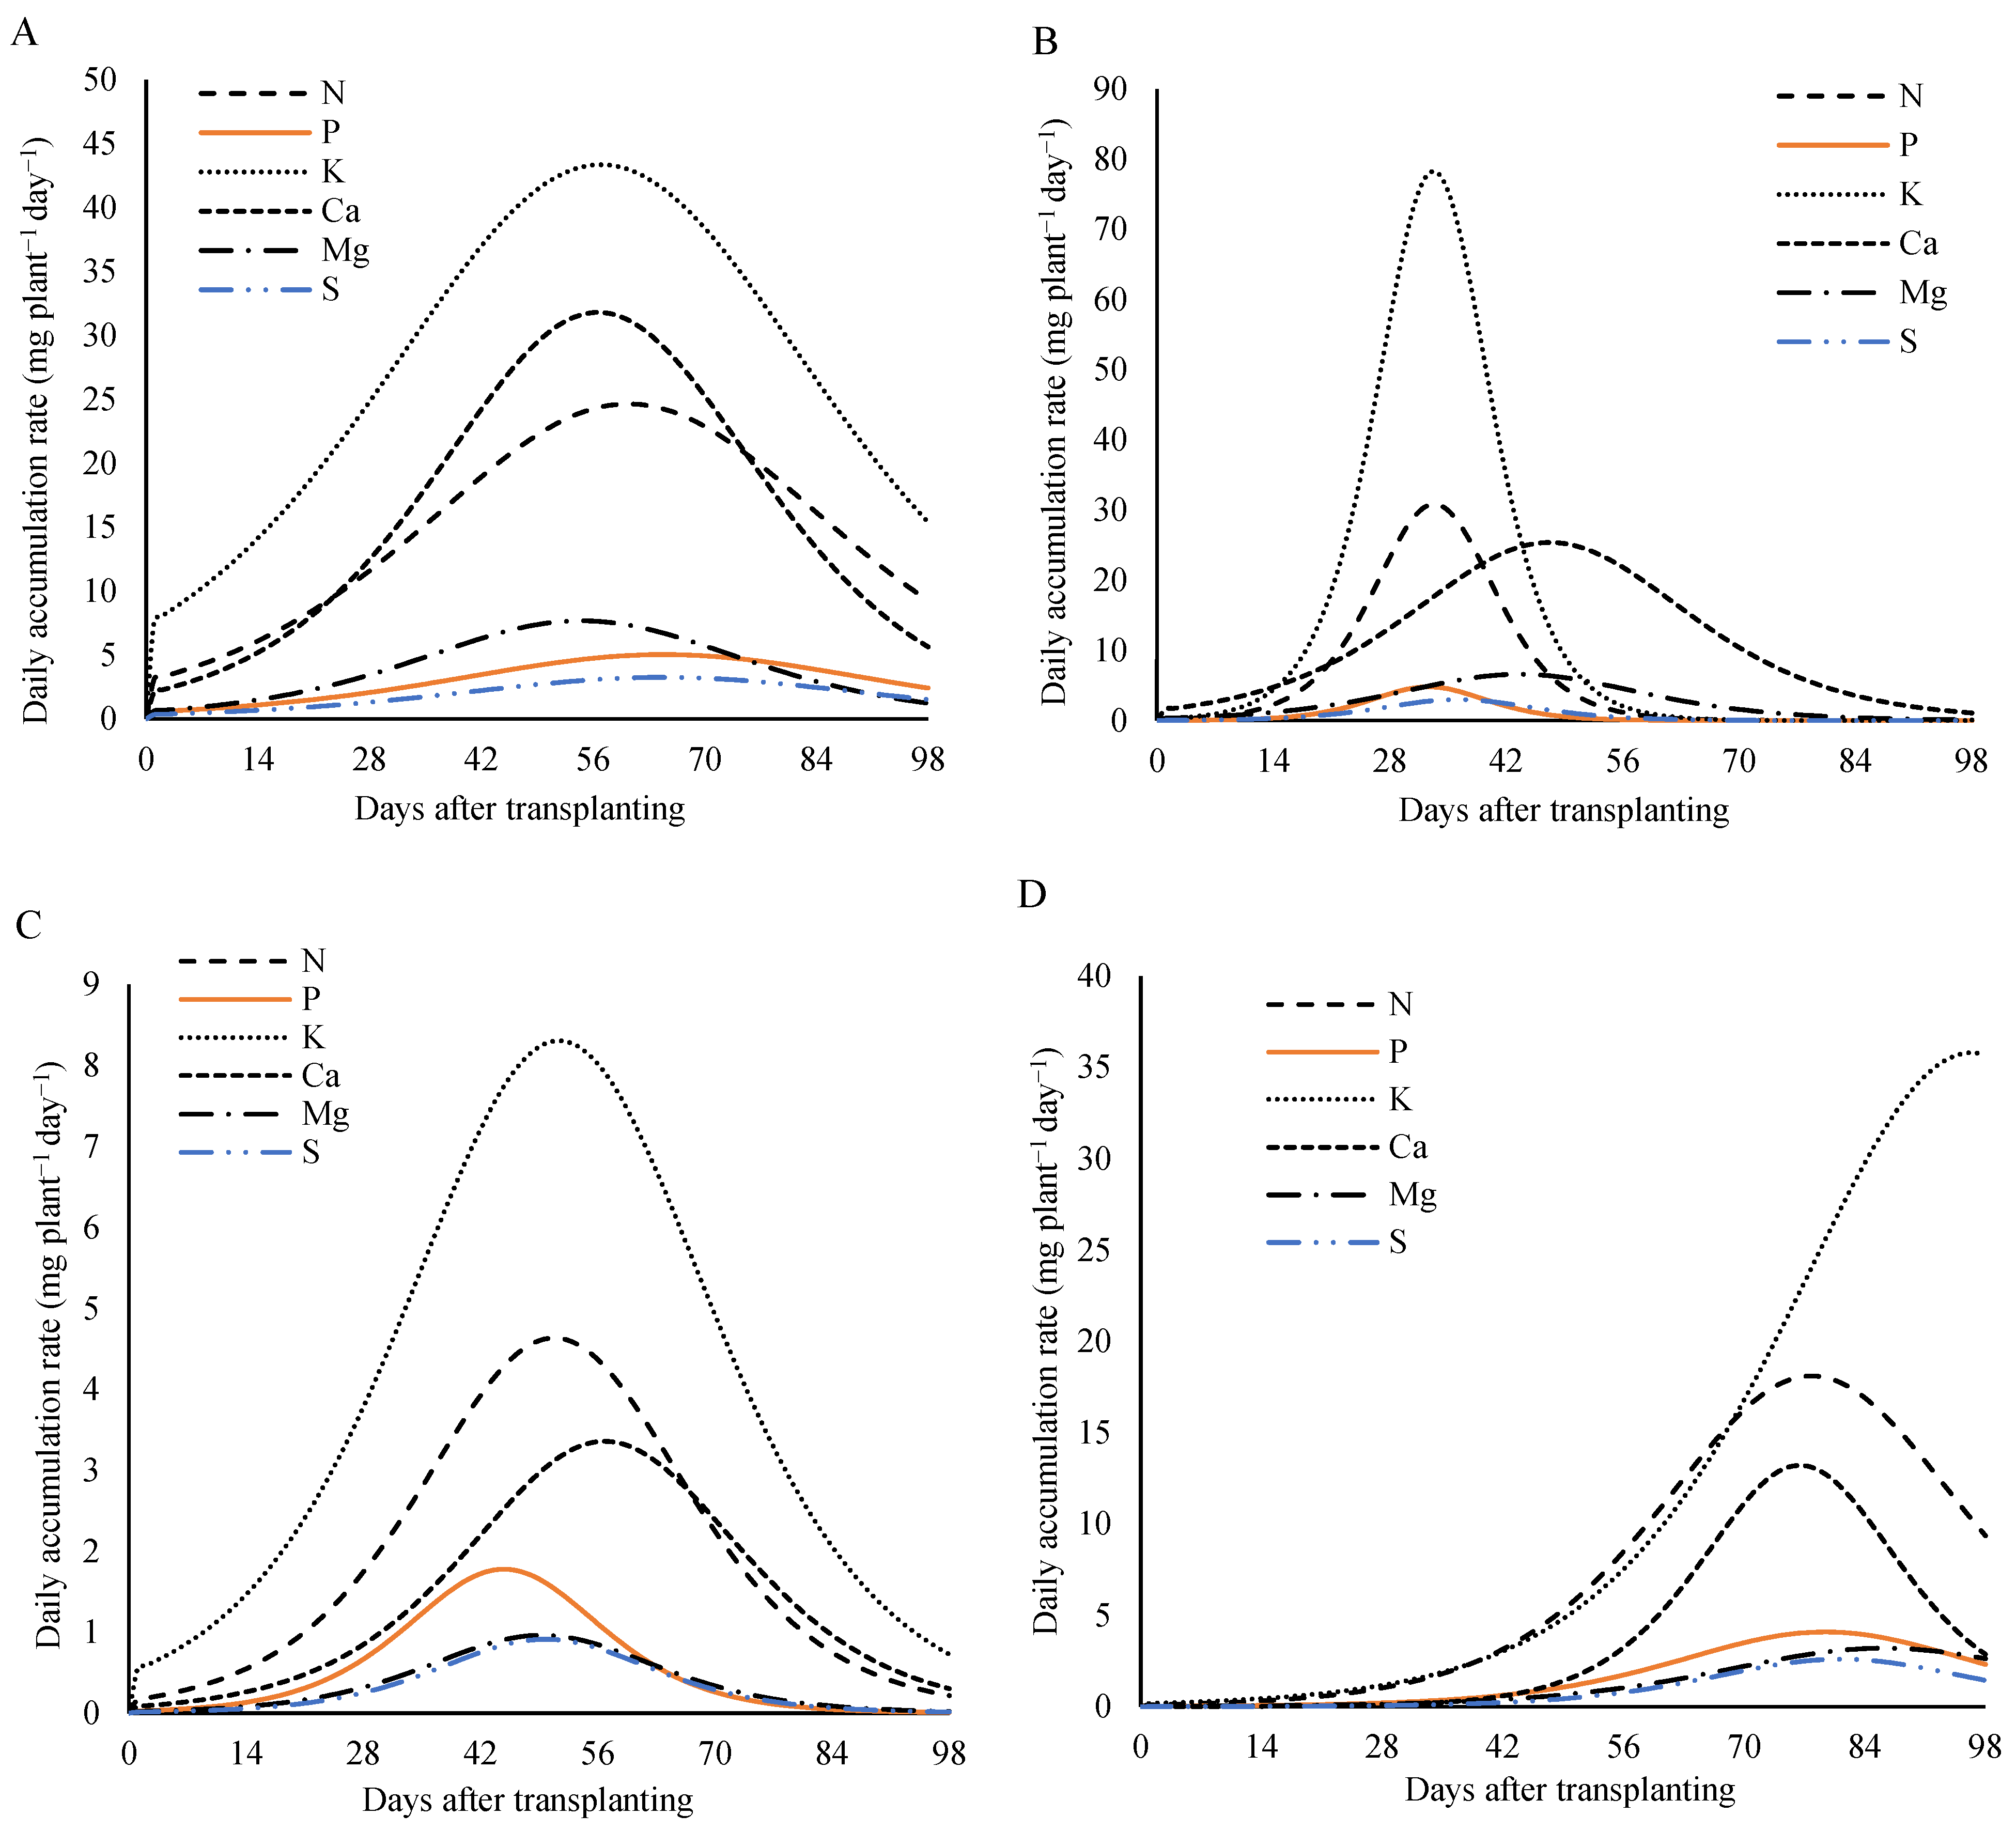
Analyzing the nutritional demand of the lettuce plants over the days after the transplanting (
Figure 9), under fertilization with 800 kg ha
−1 of P
2O
5, a rise in the daily accumulation rate was observed throughout the cultivation cycle, reaching a peak—known as the maximum daily accumulation rate (MDAR)—followed by a decline until the end of the cycle. This pattern was evident for all the plant parts (the leaves, the stem, the reproductive structures, and the total plant) and for nearly all the nutrients. However, in the reproductive parts, the daily accumulation rate of the potassium continued to increase, with its maximum observed close to the harvest.
For the plant as a whole, the MDAR occurred between 55 and 65 days after the transplanting (DAT). The maximum daily accumulation rates were 24.6 mg plant
−1 day
−1 for nitrogen at 60 DAT; 5.0 and 3.2 mg plant
−1 day
−1 for phosphorus and sulfur, respectively at 65 DAT; 43.4 and 31.8 mg plant
−1 day
−1 for potassium and calcium at 57 DAT; and 7.7 mg plant
−1 day
−1 for magnesium at 55 DAT. These results highlight the periods of the greatest nutritional demand throughout the plant’s development cycle (
Figure 9A).
In the stem, the maximum daily accumulation rates occurred between 43 and 56 DAT. The nitrogen, the magnesium, and the sulfur peaked at 4.6, 1.0, and 0.9 mg plant
−1 day
−1 at 48 DAT, respectively. The phosphorus reached 1.8 mg plant
−1 day
−1 at 43 DAT, the potassium reached 8.3 mg plant
−1 day
−1 at 50 DAT, and the calcium reached 3.4 mg plant
−1 day
−1 at 56 DAT (
Figure 9B).
In the leaves, the highest daily accumulation rates for the nitrogen, the phosphorus, and the potassium were 30.8, 4.8, and 78.2 mg plant
−1 day
−1, respectively, reached at 33 DAT. The calcium reached its peak later, at 25 mg plant
−1 day
−1 on 50 DAT. The magnesium peaked at 6.6 mg plant
−1 day
−1 at 44 DAT, and the sulfur had the lowest peak at 3.0 mg plant
−1 day
−1 at 36 DAT (
Figure 9C).
In the reproductive structures (
Figure 9D), the maximum daily accumulation rate occurred between 69 and 87 DAT for most of the nutrients. The peak values were 18.1, 4.1, and 13.2 plant
−1 day
−1 for the nitrogen, the phosphorus, and the calcium, respectively, at 77 DAT; 3.2 mg plant
−1 day
−1 for the magnesium at 83 DAT; and 2.6 mg plant
−1 day
−1 for the sulfur at 79 DAT. For the potassium, the demand remained continuous throughout the cycle, with the maximum value of 35.8 mg plant
−1 day
−1 reached at 97 DAT.
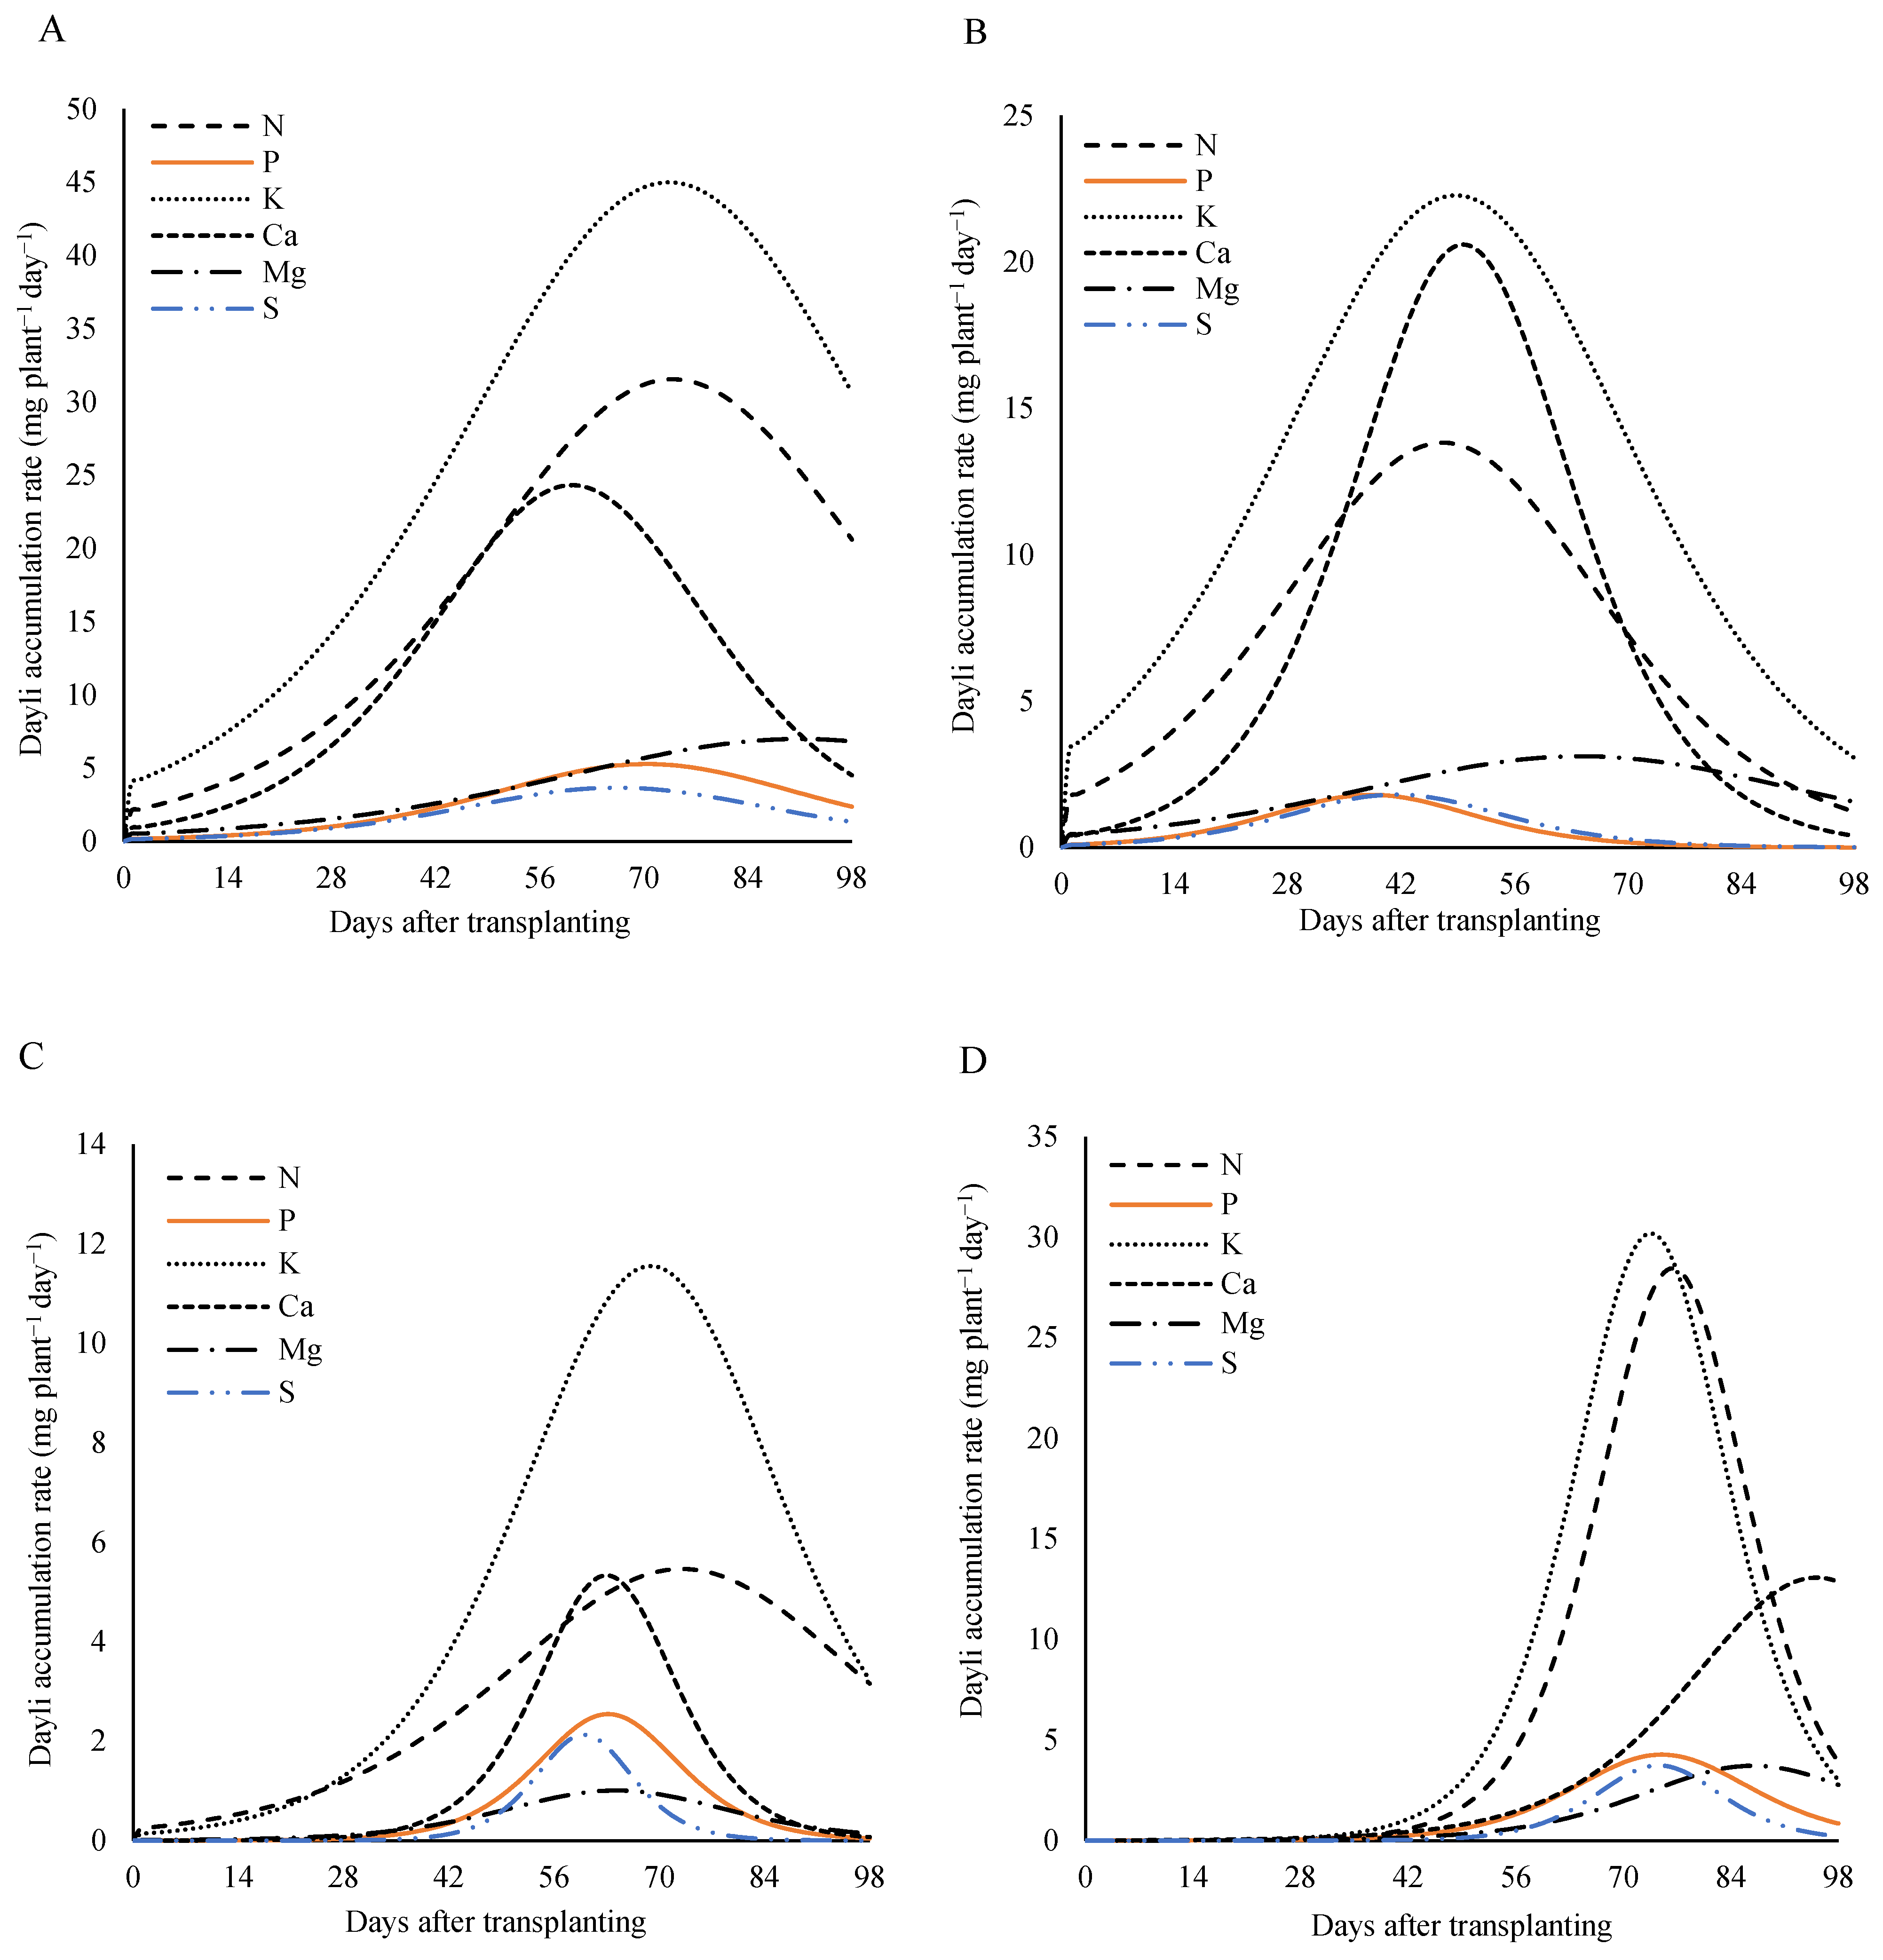
Analyzing the nutritional demand of the plants according to the days after the transplanting at the dose of 320 kg ha
−1 of P
2O
5 (
Figure 10), a similar pattern was observed for all the plant parts (the leaves, the stem, the reproductive part, and the total) for almost all the nutrients. On the other hand, for the reproductive part, the daily accumulation rate of the calcium showed a continuous increase, with the peak occurring close to the harvest (
Figure 10A).
In the stem, the maximum rate occurred between 61 and 75 DAT, with peaks of 5.5 mg plant
−1 day
−1 at 72 DAT for the nitrogen, 2.5, 5.2, 1.0, and 2.1 mg plant
−1 day
−1 at 61 DAT for the phosphorus, the calcium, the magnesium, and the sulfur, respectively. For the potassium, the maximum rate was 11.5 mg plant
−1 day
−1 at 67 DAT (
Figure 10B).
The maximum daily accumulation rate in the leaves occurred between 38 and 59 DAT. For the nitrogen, the potassium, and the calcium, the maximum values of 13.8, 22.7, and 20.6 mg plant
−1 day
−1 were recorded at 49 DAT. The phosphorus and the sulfur reached a rate of 1.8 mg plant
−1 day
−1 at 38 DAT, while the magnesium, the slowest nutrient, reached a rate of 3.1 mg plant
−1 day
−1 at 59 DAT (
Figure 10C).
In the reproductive part, the demand for nutrients was the highest between 74 and 95 DAT. For the nitrogen and the phosphorus, the maximum rate was 28.4 and 4.3 mg plant
−1 day
−1 at 76 DAT, the potassium and the sulfur reached 30.2 and 3.7 mg plant
−1 day
−1 at 74 DAT, respectively, and the calcium reached 13.1 mg plant
−1 day
−1 at 95 DAT (
Figure 10D).
4. Discussion
Nascimento [
4], studying seed production in different lettuce genotypes, observed that the developmental stages after sowing occurred, on average, at 85 days for the bolting, 93 days for the flowering, 103 days for the anthesis, 120 days for the seed formation, and 127 days for the harvest, values quite similar to those observed in this study that were 84 DAS, 98 DAS, 112 DAS, 120 DAS, and 126 DAS, respectively. Therefore, each stage of the observed cycle was similar to those reported by these authors and confirms that for the seed production the cycle is much longer than for the lettuce production for fresh consumption.
There are cultivars with different temperature and photoperiod requirements for flowering and, therefore, they can have different cycles. This is the reason it is so important to describe when the plants have reached certain stages of the cycle, so that we can compare with the other authors and help with the fertilization and management recommendations based on the phenological stages of the plant, not just the chronological ones.
Phosphorus plays a fundamental role in the early stages of crop development, being essential for the establishment and the vigorous growth of the plants. This macronutrient participates in several vital physiological processes, such as the energy transfer through ATP, the cell division and the synthesis of nucleic acids, components essential for the formation of the plant’s tissues. Its adequate availability in the early stages of the cycle directly influences the vigor of the seedlings, the development of the root system and, consequently, the productive potential of the crop throughout its development [
12].
As organic sources were used, the release of the nutrients is slower compared to inorganic sources [
5]. Therefore, with the lowest dose (320 kg ha
−1 of P
2O
5), the availability of the phosphorus at the start of the cycle may have been compromised and, consequently, there was a greater difference in the plant development between the doses at this early stage. With the highest dose, even with the slower release, the need for the phosphorus at the start of the cycle must have been satisfied.
Regarding the number of leaves per plant, the values observed in this study were higher than those reported by Gasti Filho [
13] for the curly lettuce cultivar Simpson, which had an average of 23 leaves per plant. Similarly, the stem diameter showed a more pronounced growth between 42 and 70 days after the transplanting (DAT), tending to stabilize toward the end of the cycle (
Figure 1E,F). These results also exceeded those reported by Kano [
14] who, when working with the Verônica cultivar under a planting dose of 800 kg ha
−1 of P
2O
5, found an average of 62 leaves and a height of 99.1 cm.
For these vegetative traits, the lettuce plants clearly exhibited the three growth phases described by Di Crescenzo [
15]; an initial slow-growth phase, followed by an exponential growth phase, and concluding with a stabilization phase.
Regarding the dry matter accumulation, at the highest dose, the initial accumulation was more intense, reaching 10.8% of the total accumulated by the end of the cycle. This result indicates that applying higher amounts of phosphorus for seed production also significantly benefits the vegetative growth of the lettuce plants, as reported by Kano [
14]. This effect can be explained by the improved phosphorus availability in the soil: initially classified as low (13 mg dm
−3), the content increased to a medium level (48 mg dm
−3) with the lower dose and to a very high level (157 mg dm
−3) with the highest dose by the end of the cycle. Phosphorus is an essential nutrient in the formation of nucleic acids and phospholipids, and it also plays a key role in regulating fundamental physiological processes such as photosynthesis, respiration, and root system development [
16], especially during the early stages of the plant cycle.
However, despite the importance of the phosphorus in the early phase, it was observed that the dry matter accumulation between 0 and 28 DAT represented only 4.8 to 10.8% of the total dry matter at the end of the cycle. This indicates that, for lettuce intended for seed production, it is not feasible to extrapolate biomass accumulation data based solely on studies that consider only the vegetative phase. After this initial period, the accumulation of dry matter becomes more intense, thereby increasing the nutrient demand as well [
2].
Plant biomass growth is influenced by a number of specific factors, processes, and relationships [
17] and generally follows three distinct phases: an initial slow-growth phase, followed by an exponential growth phase, and ending with a stabilization phase, in which the growth rate slows down [
15]. In the present study, although the total biomass accumulation of the plant did not show a clearly defined stabilization phase (
Figure 2), these three phases were clearly observed for the leaves and the stems. For the reproductive part, which began developing at 56 DAT, the growth was continuous until the end of the cycle, which explains the near absence of stabilization in the overall accumulation.
Supporting these findings, Tamelini [
5], when evaluating different organic phosphorus sources and doses in lettuce production, observed an increase in the dry mass as the phosphorus dose increased, with an average value of 13.3 g per plant at a dose of 800 kg ha
−1 of P
2O
5 using the cultivar Scarlet. Similarly, Kano [
14] also observed increased biomass accumulation in the Verônica cultivar, obtaining 11.0 g per plant with the same dose. Therefore, the values obtained in this study with the cultivar Solaris, especially at the highest dose, were considerably higher than those reported in the literature, reinforcing both the potential of this cultivar and the benefits of phosphate fertilization for seed production.
Kano [
2], while studying the nutrient accumulation in the lettuce grown for seed production, also observed a sigmoidal curve, with a low nutritional demand at the beginning of the cycle, a sharp increase after the onset of bolting, and a decrease during the final stage of development.
In this present study, by the end of the cycle, the reproductive part of the plant had accumulated 47.6% of the total nitrogen at the highest P
2O
5 dose and 41% at the lowest dose. These findings are consistent with those reported by Kano [
2], who attributed this pattern to leaf senescence and the subsequent redistribution of nitrogen to the reproductive organs. Nitrogen is highly mobile within the plant, being transported through the phloem from older tissues to younger ones, or toward fruits and seeds [
18].
The high phosphorus accumulation in the reproductive structures, to the detriment of vegetative tissues, was also observed in this study and can be explained by the high demand for this nutrient by seeds, as reported by Kano [
2]. Phosphorus tends to accumulate in seeds to a greater extent than in any other plant part, which is favored by its high mobility and the ability to be redistributed from vegetative to reproductive tissues [
10,
14].
Additionally, phosphorus is an essential component of nucleic acids and phospholipids and is directly involved in regulating key physiological processes such as photosynthesis and respiration. Its role in energy metabolism is emphasized by its presence in molecules such as ATP, ADP, AMP, GTP, UTP, CTP, and pyrophosphate [
18]. Therefore, an adequate phosphorus supply from the early stages of vegetative development is crucial for the formation and the full development of the reproductive structures [
16,
18].
Among the macronutrients evaluated, the potassium showed the highest accumulation throughout the cycle, reaching 2922.6 mg plant
−1 at the 800 kg ha
−1 P
2O
5 dose, with 49% in the leaves, 14% in the stem, and 37% in the reproductive part. At the 320 kg ha
−1 dose, the accumulation reached 2575.2 mg plant
−1, with 50% in the leaves, 19% in the stem, and 31% in the reproductive structures. Despite being a highly mobile element in the plants [
16], the potassium did not predominantly accumulate in the reproductive part, indicating its greater functional importance in the leaves and the other vegetative tissues.
Potassium is essential for plant development, even though it does not form part of the plant structures. Its importance lies in osmotic regulation, stomatal opening control, enzyme activation, protein synthesis, carbohydrate transport, and various other vital functions [
18].
As for calcium, its low accumulation in the reproductive organs can be explained by its poor mobility within the plant [
16,
19]. Therefore, it is essential that calcium be available in the soil throughout the entire growth cycle, especially during the reproductive stage, along with adequate irrigation and a favorable cation balance to facilitate uptake [
20]. The calcium absorption occurs predominantly through the xylem, driven by water flow and transpiration, which reinforces its limitation in being redistributed to other plant parts. Nevertheless, calcium is vital for the integrity of the cell membranes and the cell walls, acting in the formation of calcium pectates in the middle lamella and in the regulation of ion transport and exchange [
21].
Regarding magnesium, its higher accumulation in leaves compared to reproductive organs can be attributed to its close association with the chlorophyll molecule, making it essential for the photosynthetic process [
22].
Finally, sulfur—essential for the formation of amino acids and proteins—also displayed a pattern similar to nitrogen, with a greater accumulation starting in the reproductive stage, particularly in seed-producing organs. This nutrient is also important for photosynthesis and is associated with cold resistance [
18], reinforcing its relevance throughout all the stages of the plant development.
The accumulation of the nutrients does not show a single pattern in the plant, just as the vegetative and reproductive parts show differences in the accumulation of the nutrients. As discussed, some nutrients accumulate preferentially in the leaves, such as calcium, which is not very mobile in the plant and does not translocate to the reproductive parts [
20]. Magnesium is also not very mobile in the plant and is essential in the formation of chlorophyll, concentrated mainly in the leaves [
22]. On the other hand, phosphorus is one of the most important nutrients in seed formation [
2,
16], where it is stored in the form of phytin as a source of energy during the germination process. Nitrogen, as well as being a mobile element in the plant, is fundamental in the formation of amino acids and is accumulated in seeds, which are rich in proteins. As seed development takes place in the second half of the plant’s cycle, this is the stage of the greatest nutrient demand, and the seeds accumulate dry matter (nutrients) increasingly until the end of the cycle. This differential distribution of nutrients is influenced by environmental factors, such as temperature and the availability of nutrients in the soil, which modulate the absorption and allocation of essential elements in plants [
23].
According to Bezerra [
19], shortly before the emergence of flower buds—around the formation of the reproductive organs—there is a peak demand for macronutrients to support the development of vegetative parts. Proper vegetative development is essential to meet the plant’s needs during the reproductive phase, which includes the seed formation and maturation. Following this peak in daily nutrient accumulation, there is a significant decrease in the uptake rate, along with the stabilization of dry mass in the vegetative parts. On the other hand, after flowering, a noticeable accumulation of dry matter begins in the reproductive parts and continues until the seed maturation is complete.
This pattern was also confirmed in this present study, with the highest nutrient demand observed in the vegetative parts before 56 DAT, while the peak nutrient demand in the reproductive parts occurred after this period. These findings highlight the importance of nutrient availability throughout the entire production cycle, which, in the case of lettuce seed production, extended up to 98 DAT. In this context, it is advantageous to grow crops in soils rich in organic matter, complemented by slow-release organic fertilizers, to ensure adequate plant nutrition throughout the cycle [
4,
5].
It is important to note that the results obtained refer to a single cultivar, in a single location, and therefore cannot be freely extrapolated to any other condition. However, it is worth noting that this is the first study reported with the aim of obtaining a nutrient accumulation curve in an organic lettuce seed production field. Therefore, for the extrapolation and validation of these results, complementary studies in different environments, cultivation systems, and with different genotypes are recommended, to ensure greater robustness and applicability of the results.


 ,
, 


