Article

Characteristics and Phylogenetic Analysis of the Complete Plastomes of Anthogonium gracile and Eleorchis japonica (Epidendroideae, Orchidaceae)

1
Key Laboratory of National Forestry and Grassland Administration for Orchid Conservation and Utilization at College of Landscape Architecture, Fujian Agriculture and Forestry University, Fuzhou 350002, China
2
Zhejiang Institute of Subtropical Crops, Zhejiang Academy of Agricultural Sciences, Wenzhou 325005, China
3
Wenzhou Forestry Technology Promotion and Wildlife Protection and Management Station, Wenzhou 325000, China
4
College of Chinese Medicine, Zhejiang Pharmaceutical University, Ningbo 315500, China
5
National Key Laboratory for Development and Utilization of Forest Food Resources, Zhejiang A&F University, Hangzhou 311300, China
6
Tonglu Bishui Ecological Agriculture Development Co., Ltd., Hangzhou 311519, China
*
Authors to whom correspondence should be addressed.
These authors contributed equally to this work.
Horticulturae 2025, 11(6), 698; https://doi.org/10.3390/horticulturae11060698
Submission received: 26 March 2025 / Revised: 29 May 2025 / Accepted: 30 May 2025 / Published: 17 June 2025
(This article belongs to the Special Issue Orchids: Advances in Propagation, Cultivation and Breeding)

Abstract

Phylogenetic relationships within the subtribe Arethusinae (Arethuseae: Epidendroideae: Orchidaceae) remain unresolved, with particular uncertainty surrounding the phylogenetic positions of Anthogonium gracile and Eleorchis japonica. The monophyly of this subtribe remains contentious, making it one of the challenging taxa in Orchidaceae phylogenetics. In this study, we sequenced and analyzed the complete plastome sequences of A. gracile and E. japonica for the first time, aiming to elucidate their plastome characteristics and phylogenetic relationships. Both plastomes exhibited a conserved quadripartite structure, with 158,358 bp in A. gracile and 152,432 bp in E. japonica, and GC contents of 37.1% and 37.3%, respectively. Comparative analyses revealed strong structural conservation, but notable gene losses: E. japonica lacked seven ndh genes (ndhC/D/F/G/H/I/K), whereas A. gracile retained a complete ndh gene set. Repetitive sequence analysis identified an abundance of simple sequence repeats (68 and 77), tandem repeats (43 and 30), and long repeats (35 and 40). Codon usage displayed a bias toward the A/U termination, with leucine and isoleucine being the most frequent. Selection pressure analysis indicated that 68 protein-coding genes underwent purifying selection (Ka/Ks < 1), suggesting evolutionary conservation of plastome protein-coding genes. Nucleotide diversity analysis highlighted six hypervariable regions (rps8-rpl14, rps16-trnQUUG, psbB-psbT, trnTUGU-trnLUAA, trnFGAA-ndhJ, and ycf1), suggesting their potential as molecular markers. Phylogenomic reconstruction, using complete plastome sequences, (ML, MP, and BI) indicated that Arethusinae was non-monophyletic. A. gracile formed a sister relationship with Mengzia foliosa and E. japonica, whereas Arundina graminifolia exhibited a sister relationship with Coelogyninae members. These results shed new light on the plastome characteristics and phylogenetic relationships of Arethusinae.

1. Introduction

The tribe Arethuseae, a member of the family Orchidaceae within the subfamily Epidendroideae, is positioned at the first diverging lineage of the higher Epidendroideae [1]. This tribe comprises two subtribes, Arethusinae and Coelogyninae, and includes approximately 14 genera and 763 species [1,2,3,4]. Within the subtribe Arethusinae, five genera were recognized: Anthogonium, Arethusa, Arundina, Calopogon, and Eleorchis [1]. Anthogonium is a monotypic genus represented by Anthogonium gracile Wall. ex Lindl., a terrestrial or occasionally lithophytic herb that is primarily distributed across regions ranging from central Nepal to Bhutan, India, Myanmar, China, Laos, northern Thailand, and northern Vietnam [5]. Similarly, Eleorchis is a monotypic genus comprising only Eleorchis japonica (A. Gray) F. Maek., a terrestrial herb with globose to elliptical or conical corms, native to Japan and the Kurile Islands [5].
Since its initial definition by Bentham in 1881, the systematic position and circumscription of Arethusinae have undergone considerable changes [6,7,8,9]. Originally, Bentham described Arethusinae as encompassing eight genera: Arethusa, Calopogon, Chlorosa, Epipogium, Gastrodia, Leucorchis, Pogonia, and Yoania [6]. However, with the exception of Arethusa and Calopogon, the remaining six genera are now classified under different tribes or different even subfamilies [1]. Dressler restricted Arethusinae to include only Arethusa in 1981, whereas in his 1993 revision, Eleorchis was added to the subtribe [7,8]. Szlachetko further broadened the circumscription of Arethusinae by including Arethusa, Eleorchis, and Calopogon within the subtribe [9].
In the late 1990s, the systematics of the Orchidaceae family entered the molecular biology era, but the phylogenetic relationships of Arethusinae remained controversial. Goldman et al. employed two molecular markers (matK and rbcL) to construct a phylogenetic tree, which suggested that Arethusinae is non-monophyletic, with collapsed topological structures [10]. Similarly, the phylogenetic tree reconstructed by Górniak et al. using a low-copy nuclear gene, Xdh, indicated that Arethusinae is non-monophyletic, with Anthogonium positioned at the first diverging lineage of the higher Epidendroideae, and Arundina showed a sister relationship with members of Coelogyninae [11]. Furthermore, Freudenstein and Chase employed a combined dataset of eight molecular markers (ITS, Xdh, matK, rbcL, trnL-F, ycf1a, ycf1b, and nad1b-c) to construct a phylogenetic tree, revealing that Anthogonium, Arethusa, Calopogon, and Eleorchis form a sister clade, while Arundina exhibits a sister relationship with Coelogyninae members [12]. More recently, Li et al., based on 38 mitochondrial protein-coding genes, also found Arethusinae to be non-monophyletic, with Anthogonium and Arundina each forming a sister relationship with members of Coelogyninae [13]. In contrast, van den Berg et al., Li et al., and Huang et al. all provided phylogenetic trees that support the monophyly of Arethusinae, using different combinations of sequences (including ITS, trnL, matK, rbcL, ycf1, etc.) [3,4,14]. Notably, phylogenetic analyses of Arethusinae utilizing fewer traditional molecular markers have generally produced lower support values or collapsed topological structures [3,4,10,11,12,13,14].
The plastid genome (plastome) is maternally inherited in most angiosperms, whereas in gymnosperms, it is typically paternally inherited [15]. A typical plastome exhibits a conserved structure composed of four main parts, featuring large (LSC) and small (SSC) single-copy regions, flanked by inverted repeats (IRs), generally ranging between 120 and 220 kb in total size, and containing approximately 130 genes [16]. Due to its clear genetic background, structural conservation, ease of sequencing and assembly, and moderate evolutionary rate, the plastome has become a widely utilized tool in species identification and phylogenetic analysis [16,17,18,19,20]. Serna-Sánchez et al. employed 78 plastid coding genes to reconstruct the phylogeny of Orchidaceae, resolving previously ambiguous relationships and providing an expanded and robust phylogenetic framework for the family [18]. Similarly, Li et al. used whole plastome and protein-coding gene datasets to reconstruct a robust phylogenetic framework for Coelogyninae [16]. Recently, as a result of rapid developments in sequencing technologies and bioinformatics analysis tools, the plastomes of many species within the tribe Arethuseae have been sequenced and annotated, including Arundina graminifolia [21], Pleione formosana [22], Thunia alba [23], Thuniopsis cleistogama [24], Coelogyne sulphurea [16], and C. prolifera [20]. However, there have been no reports on the plastomes of A. gracile and E. japonica, to date.
In this study, we employed high-throughput sequencing technology to sequence, assemble, and annotate the plastomes of A. gracile and E. japonica for the first time. The study pursues three main objectives: (1) to elucidate the structural features of the plastomes from both species; (2) to investigate genomic variations and develop effective molecular markers; and (3) to reconstruct a robust phylogenetic relationship for the tribe Arethusinae and clarify the evolutionary positions of A. gracile and E. japonica. These results provide deeper insights into the plastome architecture, genetic variation, and evolutionary history of Arethuseae species, offering valuable guidance for enhancing their horticultural utilization and medicinal potential.

2. Materials and Methods

2.1. Taxon Sampling, DNA Extraction and Sequencing

Mature materials of A. gracile and E. japonica were collected from the greenhouse of the Key Laboratory of Orchid Conservation and Utilization at Fujian Agriculture and Forestry University (FAFU), Fuzhou, Fujian Province, China. Immediately after collection, the samples were desiccated, using silica gel, to facilitate subsequent DNA extraction. The taxonomic identification of these two species was confirmed by Dr. Minghe Li of the FAFU, and voucher specimens have been stored in the Herbarium at the College of Forestry at the FAFU (FJFC), under deposition numbers MHLi or151 (A. gracile) and MHLi or173 (E. japonica). The complete plastome sequences of these two species were deposited in GenBank, receiving accession numbers PV252187 and PV252188. Additionally, we downloaded the plastome data for 28 samples across 12 genera from the NCBI database, thereby extending our analysis to a total of 30 plastomes, representing 14 genera. Based on previous phylogenetic studies [1,4], six species from five genera were selected as the outgroup: Cephalanthera longifolia (KU551263), Ce. rubra (MH590347), Elleanthus sodiroi (KR260986), Epipactis mairei (MG925367), Neottia ovata (KU551271), and Sobralia callosa (KM032623) (Supplementary Table S1).
Total DNA was isolated from leaf tissues, preserved in silica gel, employing a modified CTAB protocol [25]. DNA quality was evaluated by 1% agarose gel electrophoresis, while the purity and concentration were measured spectrophotometrically (Nanodrop 2000, Thermo Fisher Scientific, Waltham, MA, USA). Paired-end sequencing (PE150) was conducted, using the Illumina HiSeq 3000 platform at Berry Genomics (Beijing, China). Since the raw sequencing data contained low-quality reads and adapter sequences, quality control was performed using fastp v. 0.23.1 [26], with default parameters, to filter the raw reads and obtain clean data, ensuring the reliability of the downstream analyses.

2.2. Plastome Assembly and Annotation

The de novo assembly of A. gracile and E. japonica plastomes was conducted using GetOrganelle v. 1.7.1 [27], using default parameters, resulting in the creation of FASTA files. The resulting FASTA files were imported into Geneious 11.1.5 [28], wherein the “Find Repeats” function was employed to identify the IRa and IRb. To ensure consistency, the LSC region was designated as the starting position. Following protocols outlined by Ni et al. [29], the sequencing depth and coverage plots were generated for both plastomes to ensure high assembly quality. Subsequent annotation of the plastomes was performed using PGA [30], employing the well-annotated sequence of Thunia alba (MN606292) as a reference. Finally, manual verification and refinements were conducted in Geneious 11.1.5 [28] to enhance the annotation accuracy and overall genome quality.

2.3. Repeat Sequence and Comparative Analyses

Simple sequence repeats (SSRs) in the plastomes of A. gracile and E. japonica were analyzed using the MISA tool (https://webblast.ipk-gatersleben.de/misa/, accessed on 20 February 2025) [31]. The minimum repeat unit thresholds were set as follows: mononucleotide (mono) = 10, dinucleotide (di) = 5, trinucleotide (tri) = 4, tetranucleotide (tetra) = 3, pentanucleotide (penta) = 3, and hexanucleotide (hexa) = 3. Long repeat sequences, including forward, reverse, complementary, and palindromic repeats, were assessed by employing the online tool, REPuter (https://bibiserv.cebitec.uni-bielefeld.de/reputer, accessed on 22 February 2025) [32], with the parameters set to detect sequences at least 30 bp long and with a Hamming distance of 3. The Tandem Repeats Finder (http://tandem.bu.edu/trf/trf.html, accessed on 24 February 2025) [33] was utilized, with default settings, to identify tandem repeats within both plastomes. To assess plastome rearrangements, the plastomes of A. gracile and E. japonica were aligned with four other plastomes (Ar. graminifolia, Bletilla striata, M. foliosa, and P. formosana), using the ProgressiveMauve [34] plugin in Geneious 11.1.5. Additionally, the boundary shifts between plastome regions (LSC/IRb/SSC/IRa) were visualized using the CPJSdraw.pl script (https://github.com/xul962464/CPJSdraw, accessed on 24 February 2025).

2.4. Codon Usage and Sequence Divergence Analyses

The sequence variation of A. gracile and E. japonica was analyzed in comparison with four other species from the tribe Arethuseae, using the Shuffle-LAGAN module within the mVISTA platform (https://genome.lbl.gov/vista/mvista/submit.shtml, accessed on 26 February 2025) [35], with P. formosana serving as the reference sequence. Protein-coding sequences and intergenic spacers were extracted through the use of PhyloSuite v. 1.2.2 [36], and nucleotide diversity (Pi) was computed using MEGA 11 [37]. Additionally, synonymous codon usage bias and amino acid frequencies in regard to both species were evaluated through the use of DAMBE 7 [38].

2.5. Selection Pressure Analyses

To assess the selective pressure acting on A. gracile and E. japonica, we analyzed both the non-synonymous (Ka) and synonymous (Ks) substitutions, along with Ka/Ks ratios. First, all the protein-coding genes were aligned using MAFFT v. 7.487 [39], followed by format conversion of the alignment file from FASTA to ALN via the online tool, ALTER (http://www.sing-group.org/ALTER/, accessed on 26 February 2025) [40]. Subsequently, KaKs_Calculator 2.0 [41] was employed to estimate the Ka and Ks, as well as their ratios, for each gene. The Nei–Gojobori (NG) method was selected for the analysis, with the genetic code set to 11: Bacterial and Plant Plastid Code.

2.6. Phylogenetic Analyses

To infer the evolutionary relationships of A. gracile, E. japonica, and their closely related taxa, we conducted a series of phylogenetic analyses based on complete plastomes, using three phylogenetic approaches: Maximum Likelihood (ML), Maximum Parsimony (MP), and Bayesian Inference (BI). Initially, complete plastomes from the Arethuseae tribe and outgroup were aligned using MAFFT v. 7.487 [39]. The aligned matrix was subsequently trimmed using TrimAL v. 1.4 [42], with default parameters, to remove low-quality regions. The processed matrix was then converted into phylogenetic tree format files (PHY and NEX), using the Convert Sequence Format module in PhyloSuite v. 1.2.2 [36]. Finally, phylogenetic trees were reconstructed using the CIPRES Science Gateway [43], employing RAxML-HPC2 on XSEDE 8.2.12, PAUP on XSEDE 4.a165, and MrBayes on XSEDE 3.2.7a. The ML, MP, and BI tree constructions followed the detailed methodological framework outlined in previous studies [20].

3. Results

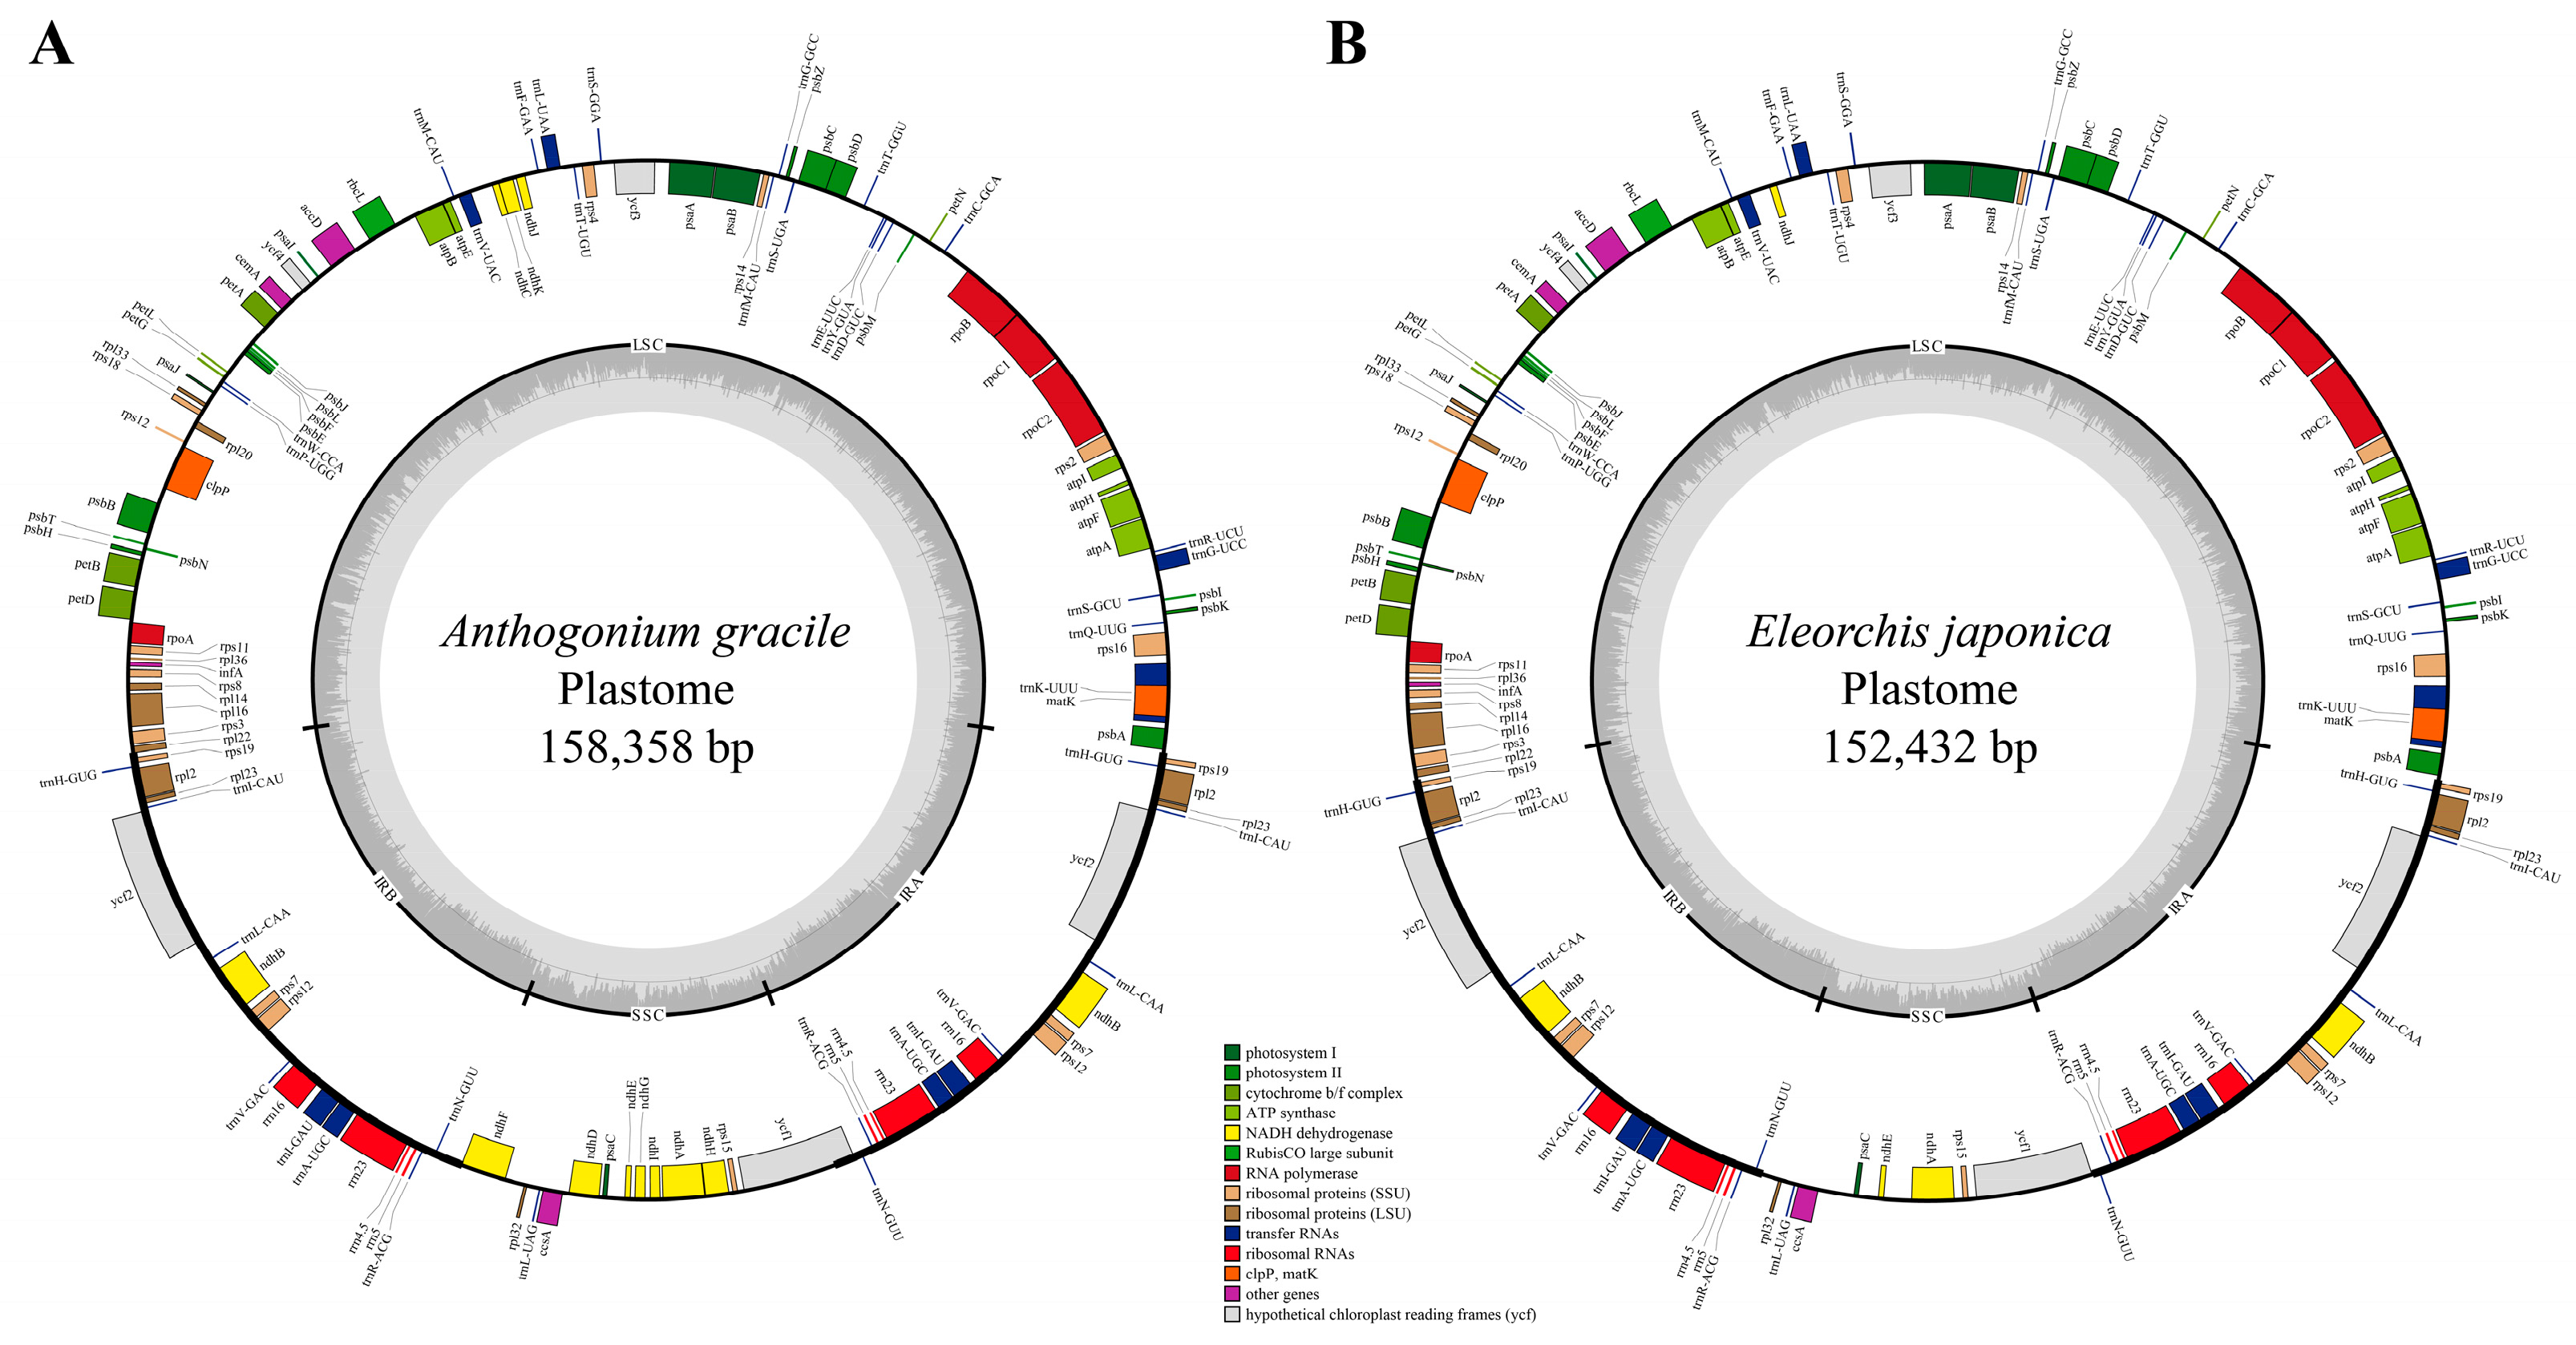
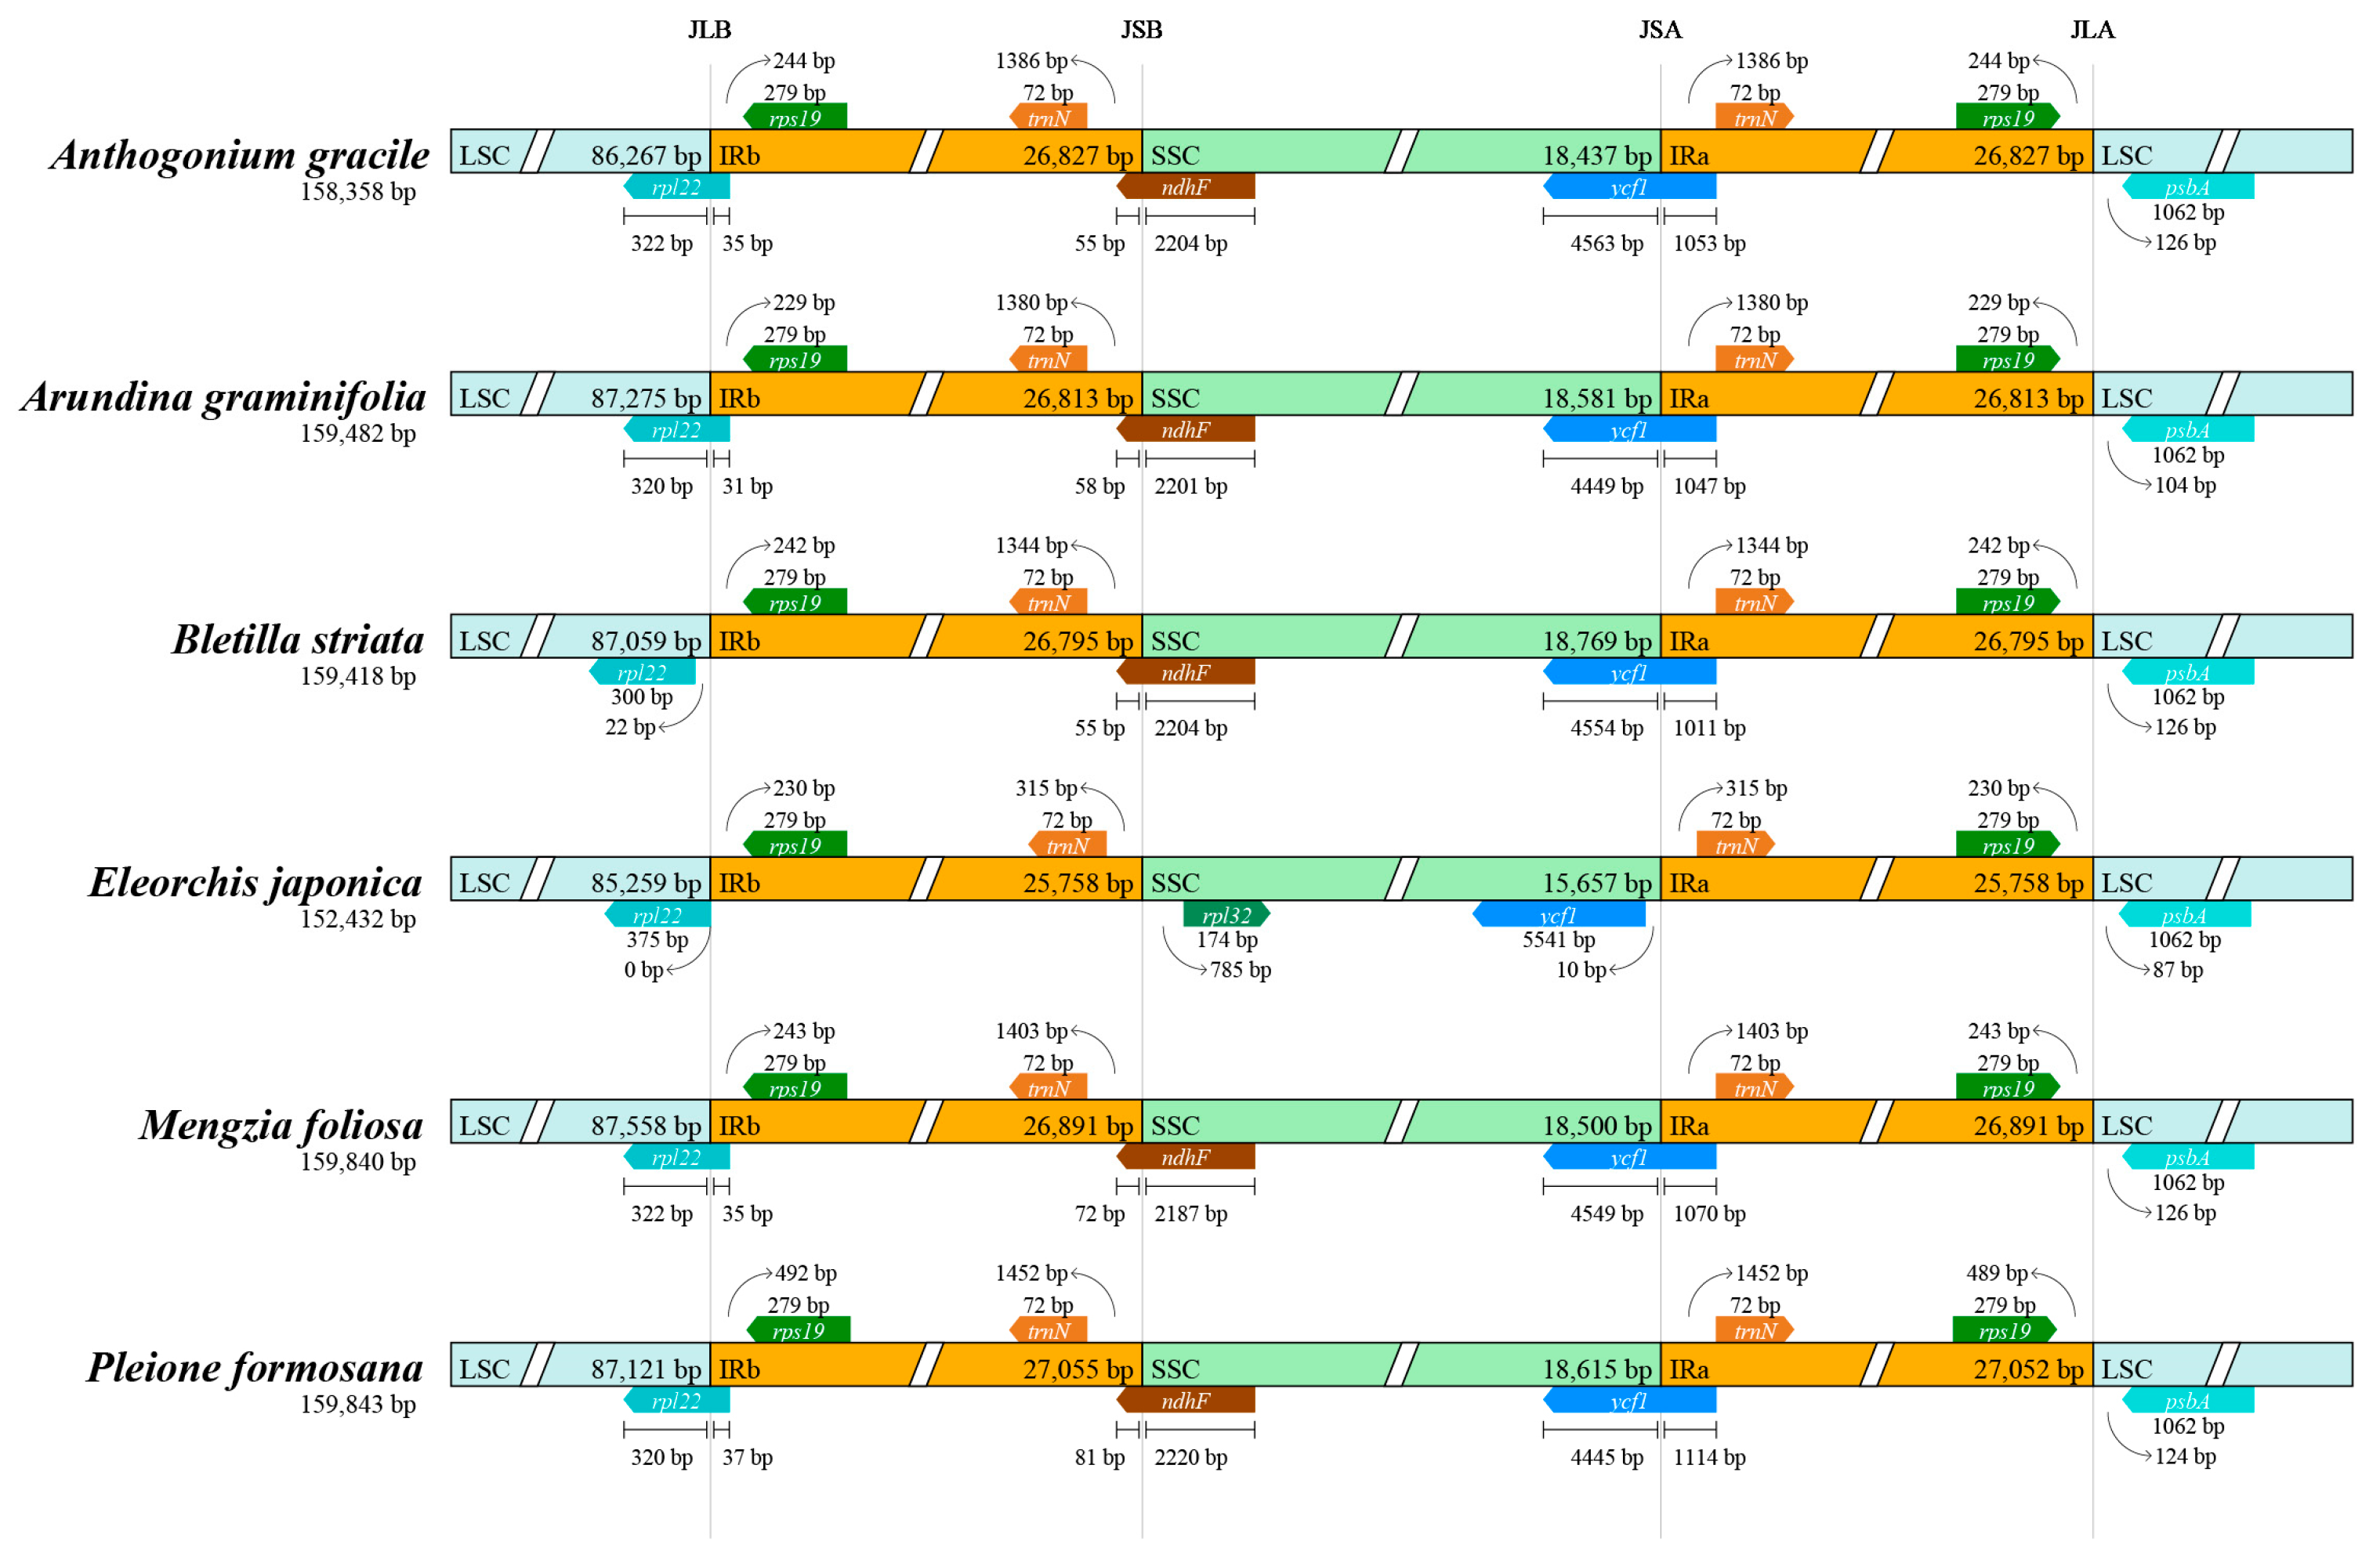
3.1. Plastome Features and Comparison Analysis

Both plastomes of A. gracile and E. japonica have been successfully assembled, with average depths of 661.41× and 695.30×, respectively (Supplementary Figure S1). The plastome sizes of A. gracile and E. japonica were 158,358 bp and 152,432 bp, displaying GC contents of 37.1% and 37.3%, respectively. Each plastome displayed the typical quadripartite structure, comprising the LSC region, SSC region, and two IR regions (Figure 1). In A. gracile, the LSC, SSC, and IR sizes were 86,267 bp, 18,437 bp, and 26,827 bp, with GC contents of 34.9%, 30.0%, and 43.2%, respectively. For E. japonica, the corresponding lengths were 85,469 bp (LSC), 15,657 bp (SSC), and 25,653 bp (IR), with GC contents of 35.0%, 29.7%, and 43.5%, respectively. In the plastome of A. gracile, 132 genes were annotated, comprising 86 protein-coding genes (PCGs), 38 transfer RNA (tRNA) genes, and 8 ribosomal RNA (rRNA) genes (Table 1). Among these, 19 genes were duplicated (7 PCGs, 8 tRNAs, and 4 rRNAs). Additionally, 18 genes contained introns: 15 had one intron, while 3 (rps12, clpP, and ycf3) possessed two. In contrast, E. japonica contained 125 genes, with seven genes (ndhC/D/F/G/H/I/K) missing compared to A. gracile.
The results indicated that these boundaries were relatively conserved within A. gracile and E. japonica, as well as their closely related species (Ar. graminifolia, B. striata, M. foliosa, and P. formosana), although some variations were observed (Figure 2). The JLB boundary predominantly localized within the rpl22 gene, except in B. striata and E. japonica, where it was situated between rpl22 and rps19. At the JLA boundary, the rps19 gene was positioned on the left, spanning from 229 bp to 489 bp, while psbA was located on the right, ranging from 87 to 126 bp. The ndhF gene crossed the JSB boundary, predominantly within the SSC region (2187–2201 bp). However, an inconsistency arose in E. japonica due to the absence of this gene. With the exception of E. japonica, where ycf1 remained entirely within the SSC region, while in the other five species, the JSA boundary was crossed by the ycf1 gene, with lengths varying between the SSC and IRa regions. In the SSC region, the lengths ranged from 4445 bp (P. formosana) to 4563 (A. gracile), while in the IRa region, they spanned from 1011 bp in B. striata to 1114 bp in P. formosana. The mauve analysis revealed no significant rearrangement in the plastomes of the six species of the Arethuseae tribe (Supplementary Figure S2).

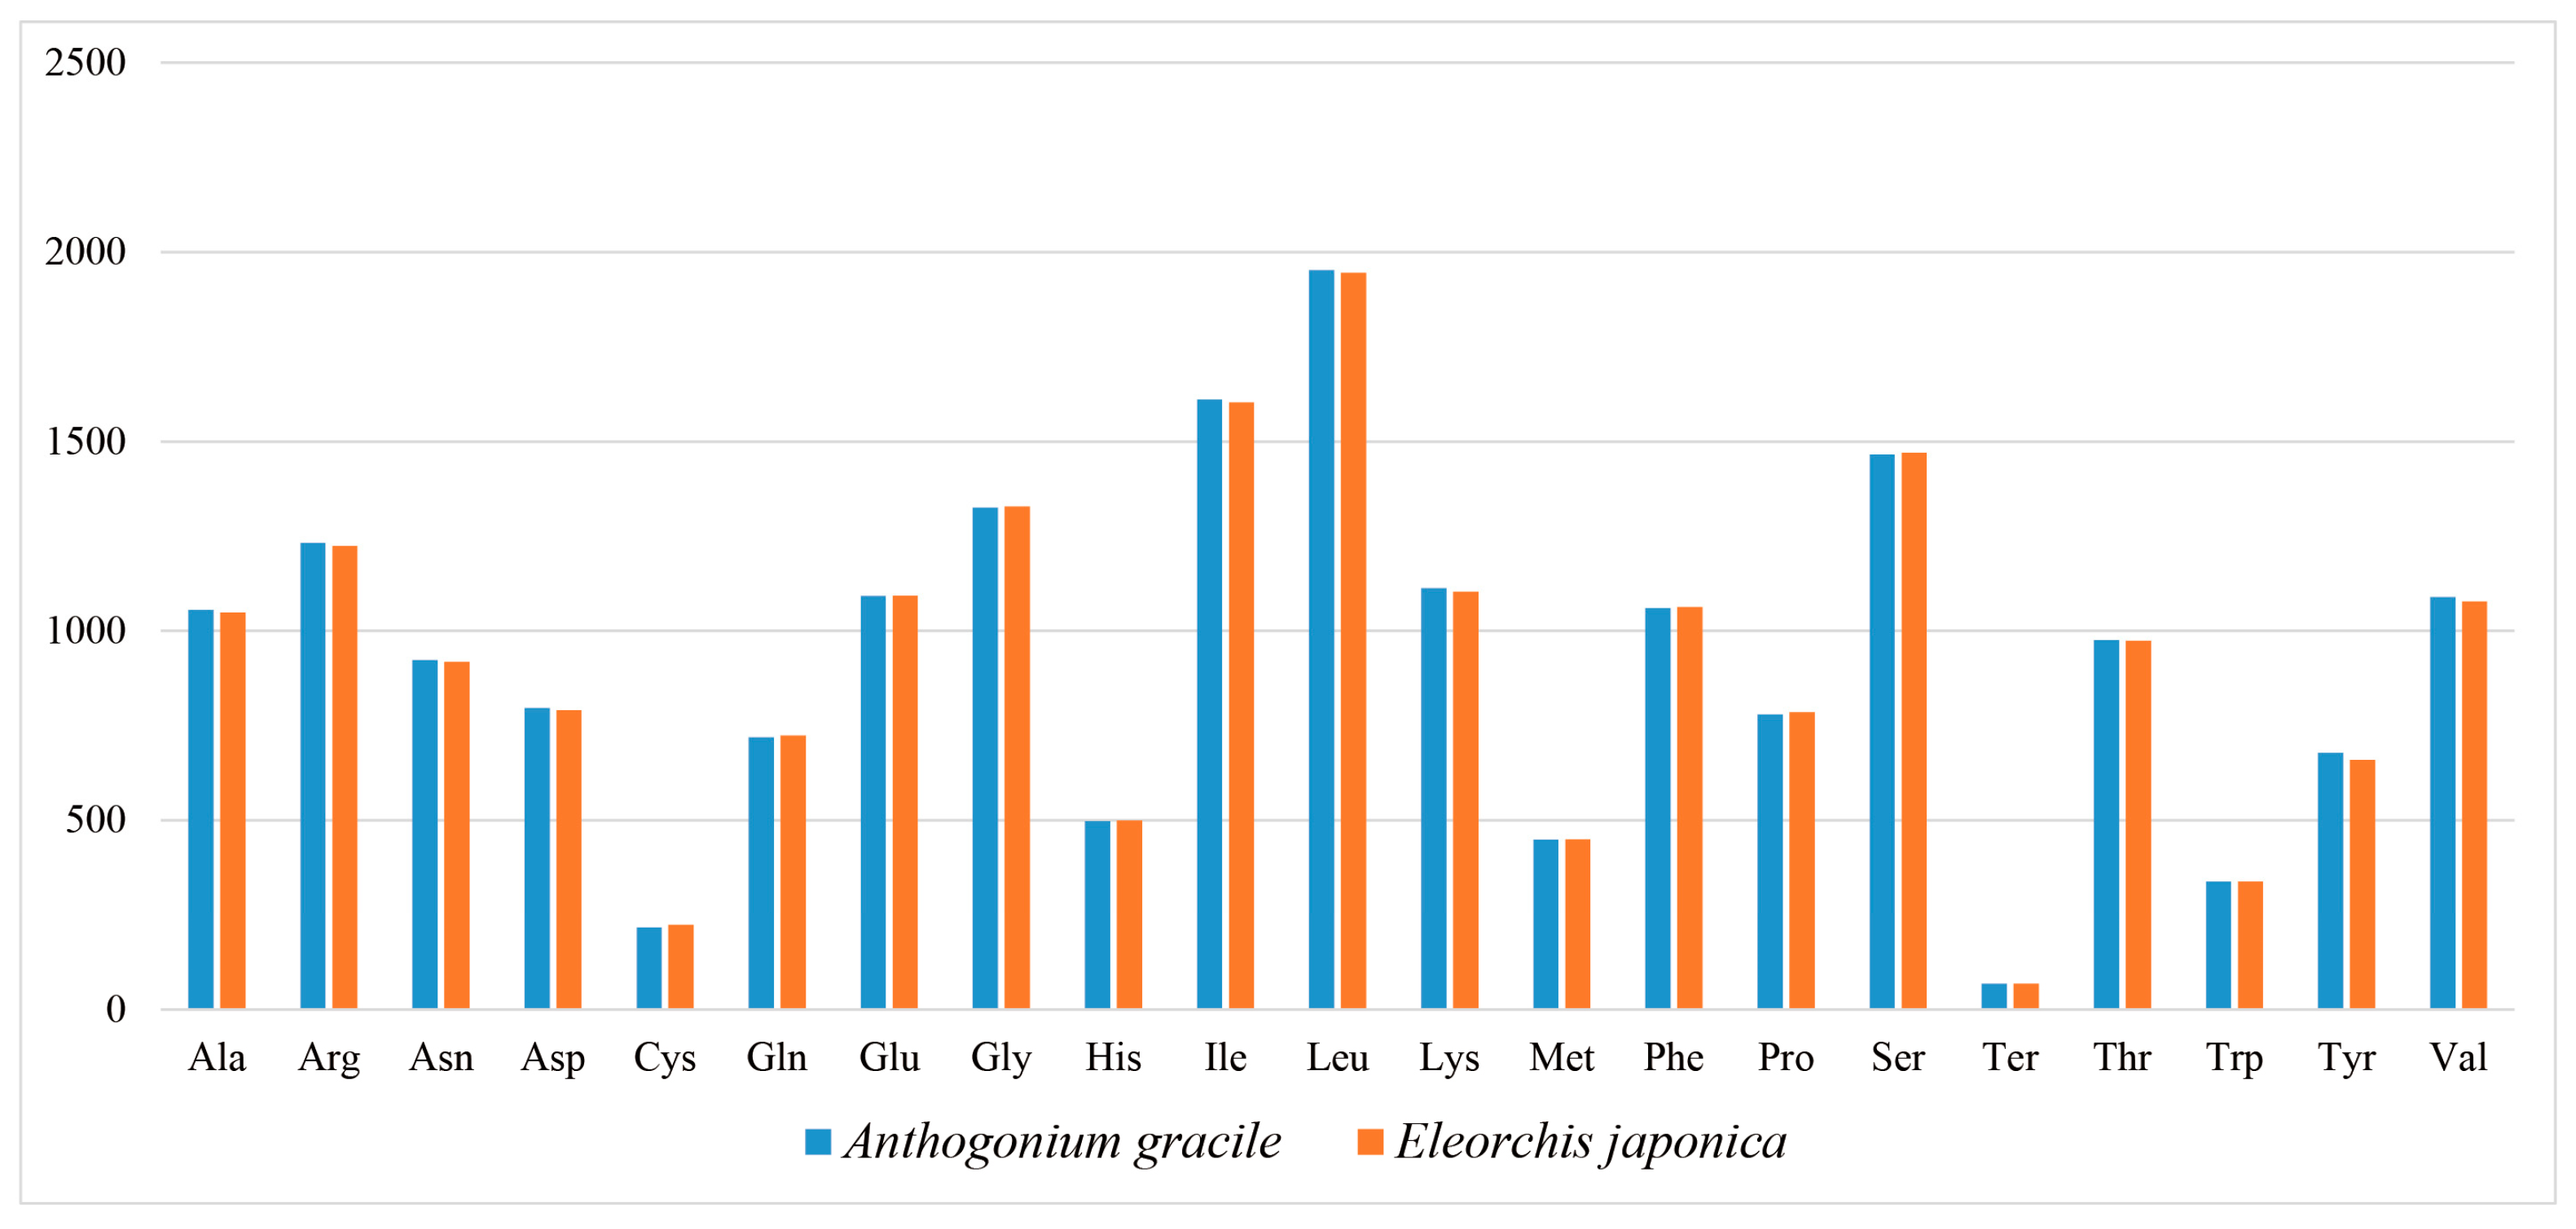
3.2. Codon Usage Analysis

These genes comprised 19,436 and 19,387 codons, showing high conservation in the codon usage patterns (Figure 3, Supplementary Table S2). Among these codons, leucine (Leu) emerged as the most frequent amino acid, which occurred 1952 and 1945 times, accounting for 10.04% and 10.03% of the total codon usage, respectively. This was followed by isoleucine (Ile), which occurred 1611 and 1603 times, contributing 8.29% and 8.27%. In contrast, cysteine (Cys) displayed the lowest abundance (217–224 codons; 1.12–1.16%), excluding stop codons. Overall, the RSCU values spanned 0.351–1.880, 30 showed an RSCU above 1, 32 had values below 1, and 2 (AUG, UGG) equaled 1. The RSCU value for the GCU codon was the highest, at 1.862 and 1.880, respectively. Among the stop codons, UAA was preferred over UAG and UGA, with values of 1.456 and 1.368, respectively. Additionally, the majority of codons terminated with A/U, accounting for 70.06% and 70.23%.

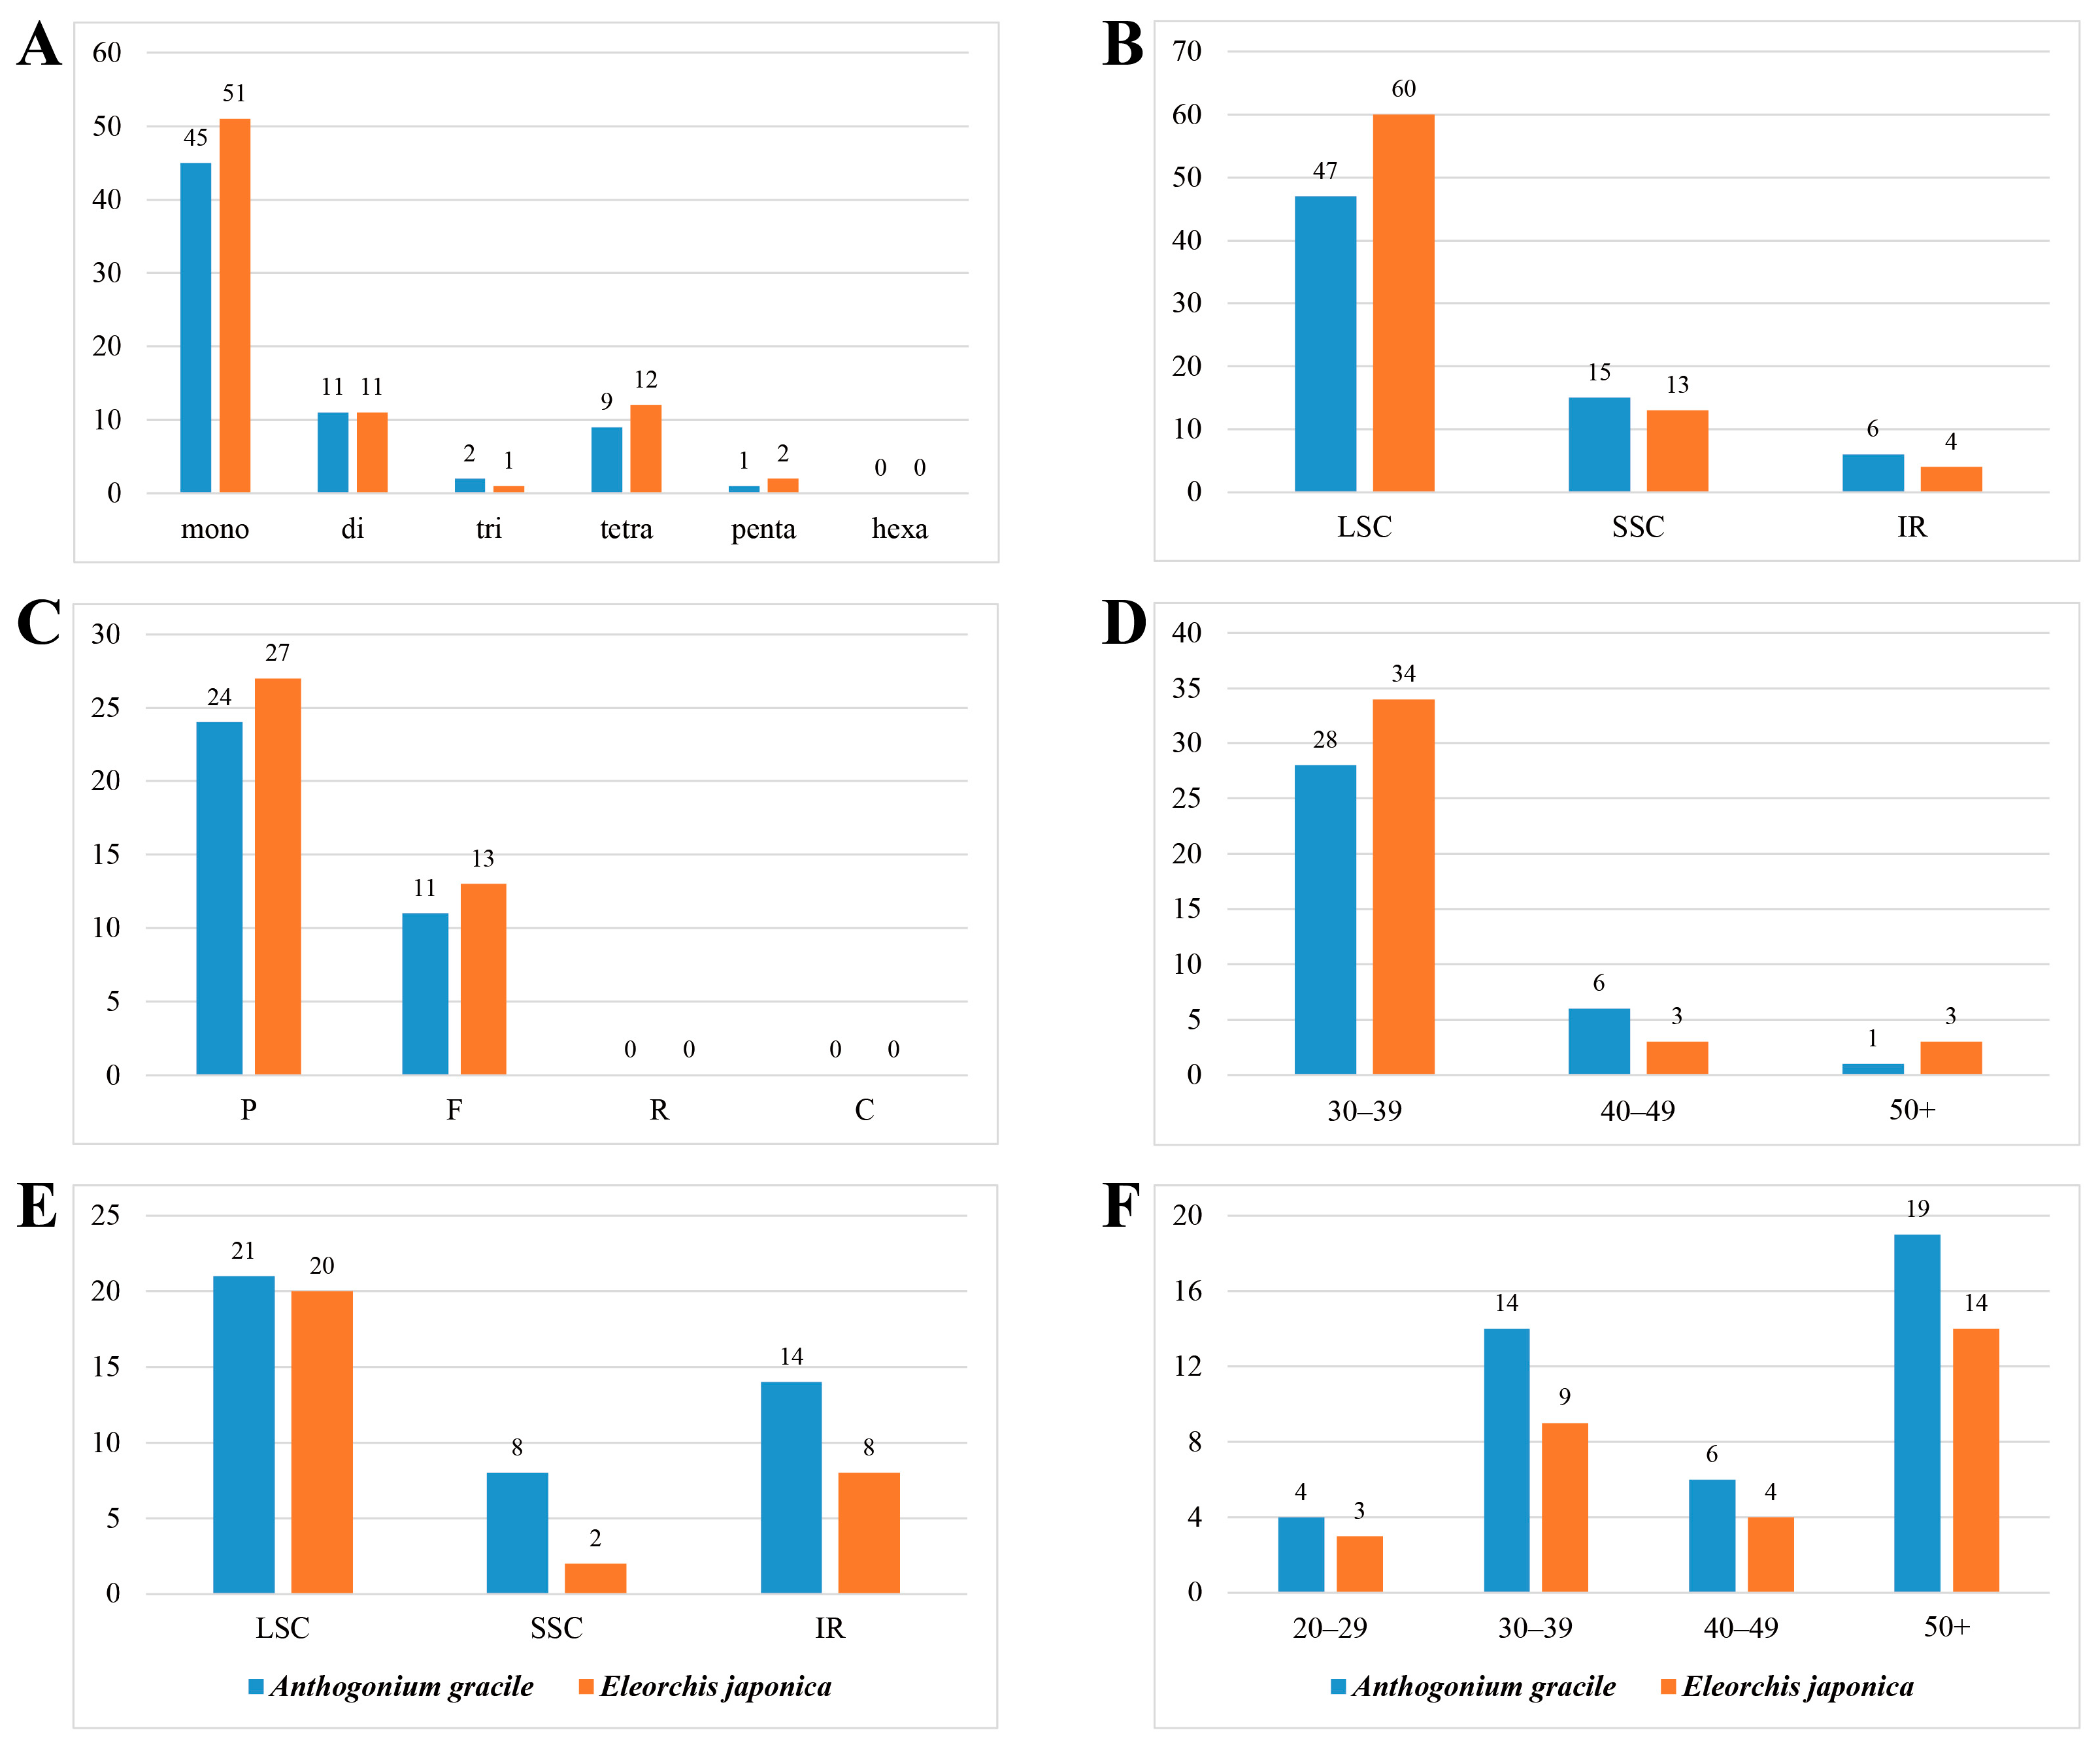
3.3. Repeat Sequence Analysis

The plastomes of A. gracile and E. japonica harbored 145 SSRs, 75 long repeats, and 73 tandem repeats (Figure 4, Supplementary Tables S3–S5). The number of SSRs in A. gracile and E. japonica was 68 and 77, respectively (Figure 4A,B, Supplementary Table S3). Mononucleotide repeats were the most common type, with 45 and 51 occurrences in the two species. Notably, no hexanucleotide repeats were observed in either plastome (Figure 4A). The mononucleotide repeats predominantly consisted of A/T repeats, appearing 43 and 51 times, respectively. The dinucleotide repeats were primarily of the AT/AT type, appearing nine times in both species (Supplementary Table S3). SSRs were most frequently located within the LSC region (47 in A. gracile and 60 in E. japonica), whereas the IR region exhibited the fewest, with six and four repeats (Figure 4B). Long repeats were identified 35 times in A. gracile and 40 times in E. japonica (Figure 4C,D, Supplementary Table S4). Only palindrome (P) and forward (F) repeat types were identified among the long repeats, with palindrome repeats being the dominant type (24 and 27 occurrences, respectively) (Figure 4C). Most of the long repeats in both plastomes had lengths ranging from 30 to 39 bp, with 28 and 34 occurrences, respectively (Figure 4D). Tandem repeats were detected 43 times in A. gracile and 30 times in E. japonica (Figure 4E,F, Supplementary Table S5). Most tandem repeats were localized within the LSC region, followed by the IRs and SSC regions (Figure 4E). Most of the tandem repeats were longer than 50 bp, with 19 and 14 occurrences, respectively, followed by repeats within the 30–39 bp range, with 14 and 9 occurrences (Figure 4F).

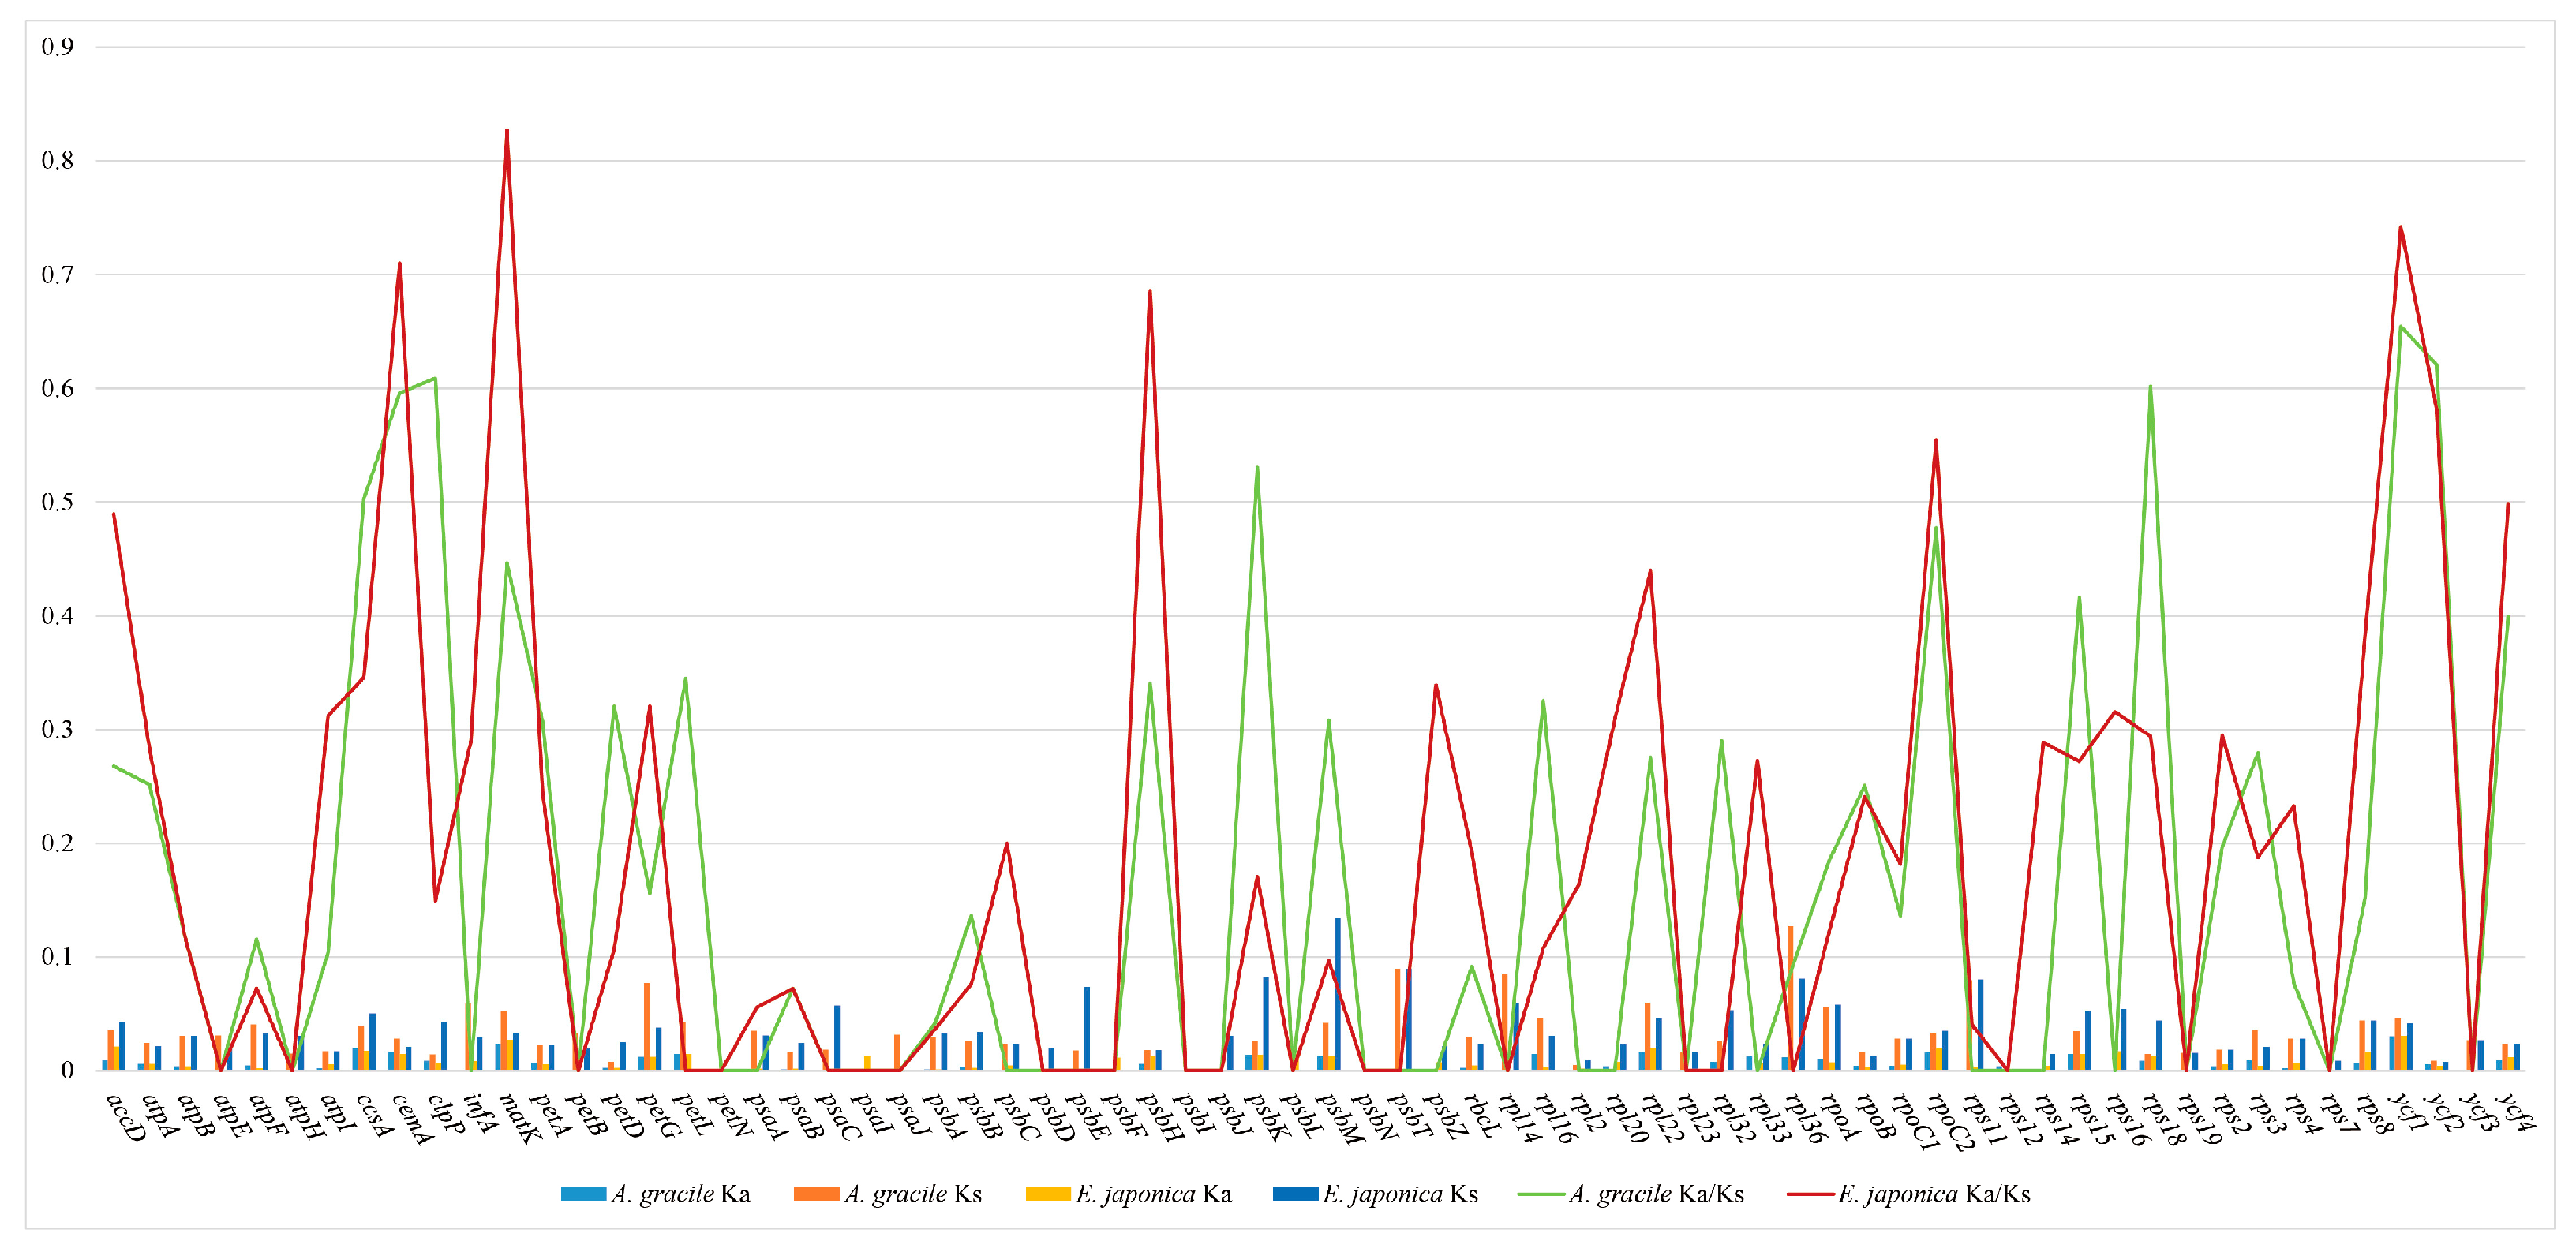
3.4. Selective Pressure Analysis

The Ka/Ks ratio serves as a key metric for inferring selective pressure, where ratios <1 reflect purifying selection, =1 indicate neutral evolution, and >1 suggest positive selection, because synonymous substitutions typically occur more frequently than non-synonymous ones, leading to Ka/Ks ratios below 1. We calculated the substitution rates (Ka, Ks) and their ratios across 68 PCGs in the plastomes of A. gracile and E. japonica (Figure 5, Supplementary Table S6). For A. gracile, Ka ranged from 0 to 0.0300 (ycf1), Ks from 0 to 0.1268 (rpl36), and Ka/Ks from 0 to 0.6545 (ycf1). Meanwhile, in E. japonica, the corresponding ranges were 0–0.0309 (ycf1), 0–0.1342 (psbM), and 0–0.8270 (matK).

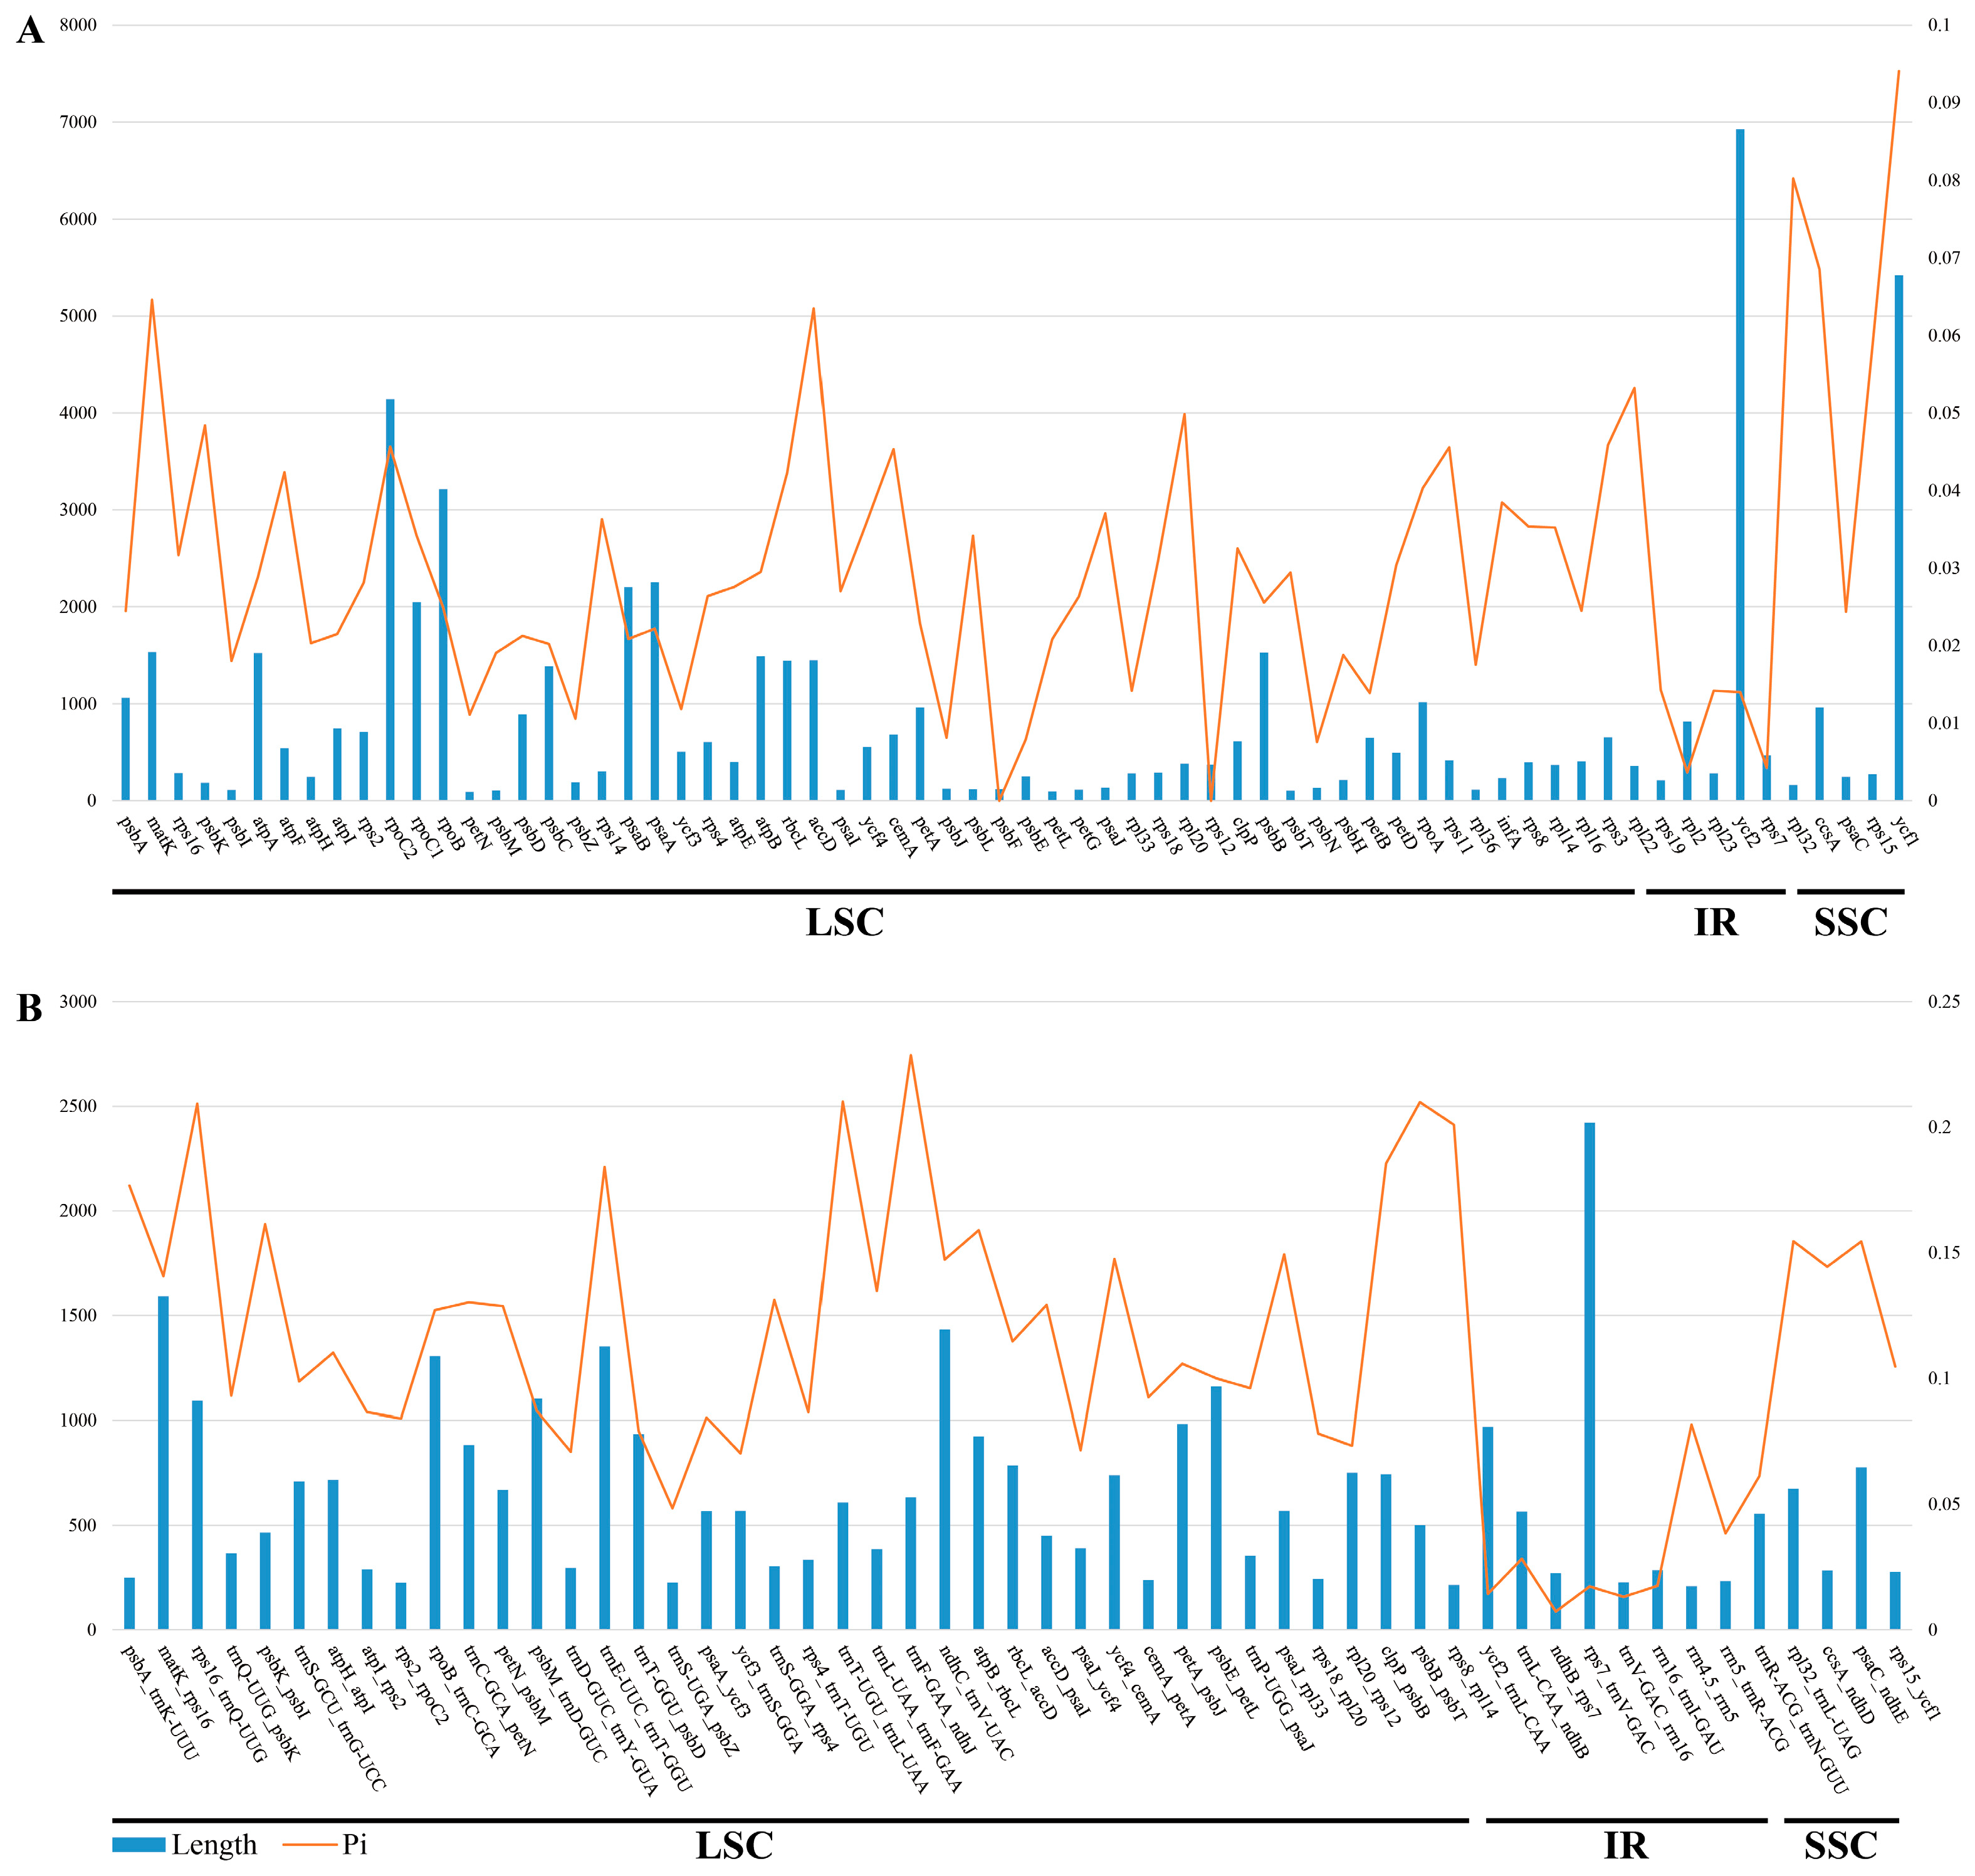
3.5. Sequence Divergence Analysis

The plastomes of six Arethuseae species, including A. gracile and E. japonica, were aligned using mVISTA to investigate the interspecific variations, with P. formosana serving as the reference (Supplementary Figure S3). The results revealed higher levels of sequence divergence in the LSC and SSC regions relative to the IRs, with intergenic regions exhibiting greater variability compared to coding regions. To identify hypervariable sequences within Arethuseae, the nucleotide diversity (Pi) was computed separately for protein-coding and intergenic regions (Figure 6, Supplementary Table S7). The PCGs exhibited Pi values of 0–0.09408 (ycf1), whereas those for intergenic regions varied from 0.00735 (ndhB-rps7) to 0.22871 (trnFGAA-ndhJ). Among the three plastome regions, SSC harbored the highest average Pi, reaching 0.06517 for PCGs and 0.13951 for intergenic sequences. This was followed by the LSC region, where PCGs and intergenic sequences exhibited average Pi values of 0.02846 and 0.12558, respectively. In contrast, the IR region exhibited the lowest mean Pi levels, measuring 0.01008 in PCGs and 0.03107 for intergenic sequences. Among the 68 PCGs analyzed, five exhibited high variability (Pi > 0.06): accD (0.06349), matK (0.06458), ccsA (0.06854), rpl32 (0.08025), and ycf1 (0.09408) (Figure 6A). Additionally, seven intergenic sequences were identified as highly variable (Pi > 0.18): trnEUUC-trnTGGU (0.18417), clpP-psbB (0.18548), rps8-rpl14 (0.20093), rps16-trnQUUG (0.20932), psbB-psbT (0.21000), trnTUGU-trnLUAA (0.21018), and trnFGAA-ndhJ (0.22871) (Figure 6B).

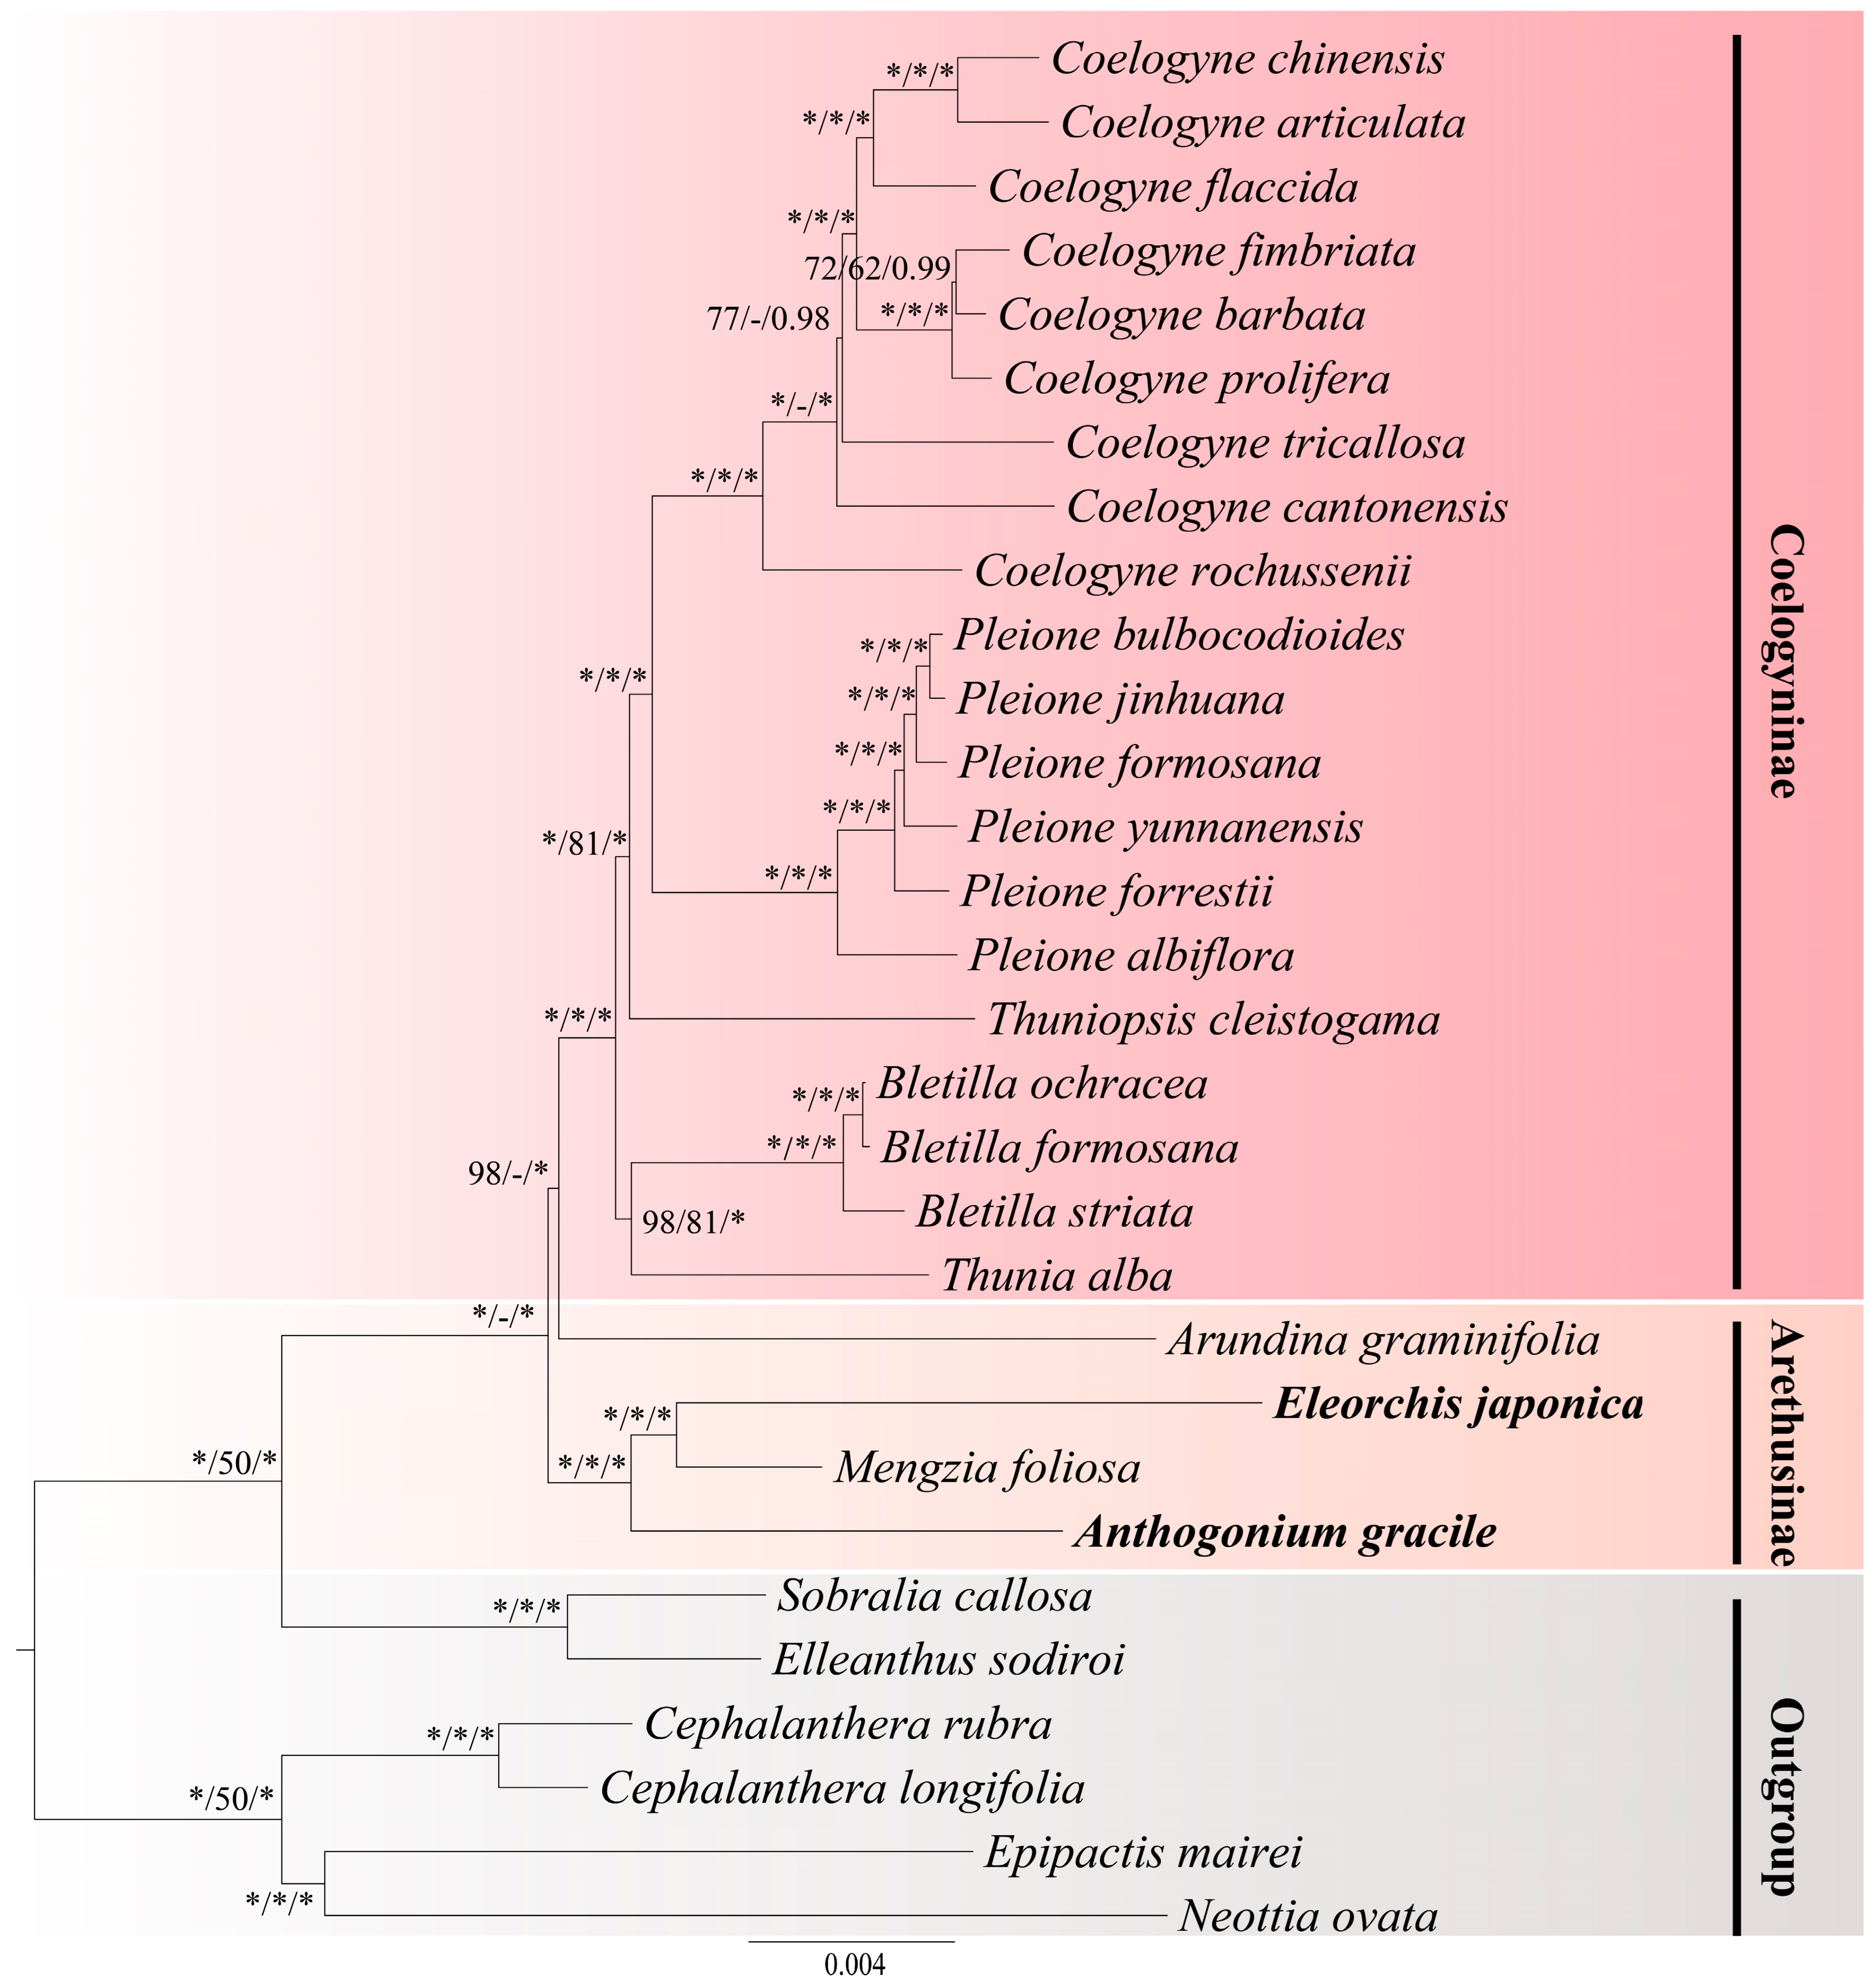
3.6. Phylogenetic Analysis

The phylogenetic trees constructed using ML, MP, and BI methods displayed highly congruent topologies, with robust bootstrap support and high posterior probabilities for most nodes (Figure 7). The findings revealed that Arethuseae could be delineated into six well-supported clades, arranged from the first diverging lineage to the terminal positions in the phylogenetic tree, as follows: (1) a clade comprising A. gracile, M. foliosa, and E. japonica; (2) the Ar. graminifolia clade; (3) a clade containing Thunia alba and Bletilla species (B. striata, B. formosana, and B. ochracea); (4) the Thuniopsis cleistogama clade; (5) a Pleione clade comprising of P. albiflora, P. forrestii, P. yunnanensis, P. formosana, P. jinhuana, and P. bulbocodioides; and (6) a Coelogyne clade, which includes C. rochussenii, C. cantonensis, C. tricallosa, C. prolifera, C. barbata, C. fimbriata, C. flaccida, C. articulata, and C. chinensis. M. foliosa and E. japonica formed a strongly supported sister group, which together were a sister to A. gracile (BS = 100, PP = 1.00). In the ML and BI phylogenetic trees, Ar. graminifolia was robustly supported as the sister group to members of Coelogyninae (BSML = 100, PP = 1.00). However, in the MP tree, Ar. graminifolia formed a sister relationship with taxa from Arethusinae (BSMP = 44).

4. Discussion

4.1. Plastome Characteristics and Comparison

The plastomes of A. gracile and E. japonica were successfully sequenced and assembled, revealing a conserved quadripartite structure (Figure 1), consistent with previously published orchid plastomes [16,20,44,45]. The plastome sizes of A. gracile and E. japonica were 158,358 bp and 152,432 bp, with GC contents of 37.1% and 37.3%, respectively. Previous studies have documented plastome sizes in the Arethuseae range from 156,939 bp to 160,433 bp, with GC content ranging from 37.1% to 37.5% [20]. The plastome of A. gracile fell within the previously documented size and GC content range of the tribe. Similarly, the GC content of E. japonica in this study fell within the reported range for this tribe, whereas the genome size of E. japonica exceeded the previously reported range, thereby broadening the known size variation for this tribe. Both plastomes attained their highest GC levels in the IR regions (43.2% and 43.5%), while the lowest was observed in the SSC region (30.0% and 29.7%). This pattern was primarily associated with the localization of all eight rRNA genes within the IR regions, aligning with previous findings for this tribe [16,44]. Additionally, the plastomes of A. gracile and E. japonica each exhibited 19 duplicated genes and 18 genes containing introns (Table 1), which was in agreement with other species within this tribe [20].
Previous studies have extensively documented the widespread gene loss and pseudogenization occurring in Orchidaceae plastomes, particularly affecting the ndh gene family [46]. This phenomenon has been reported in multiple genera, including Bulbophyllum [47], Renanthera [48], Chiloschista [49], Epidendrum [50], and Taeniophyllum [51]. In the present study, A. gracile retained 86 protein-coding genes, whereas E. japonica possessed only 79, primarily due to the loss of ndh genes, including ndhC, ndhD, ndhF, ndhG, ndhH, ndhI, and ndhK. Additionally, structural rearrangements have been reported in the plastomes of certain orchid species, such as the ycf3-trnSGCU region in Hexalectris warnockii [52] the ycf3-trnSGGA region in Cyrtosia septentrionalis [53], the clpP-accD region in Uncifera acuminata [17], and the rpl33-rps3 region in Oberonioides microtatantha [54]. However, no such structural variations were detected in the plastomes of A. gracile, E. japonica, and four other species within the tribe Arethuseae (Supplementary Figure S2).
The Ka/Ks ratio is commonly applied to evaluate selective pressures on genes and assess their evolutionary dynamics [55]. In most cases, synonymous substitutions exceed non-synonymous ones, resulting Ka/Ks ratios typically below 1. By calculating the Ka/Ks values for 68 PCGs in the plastomes of A. gracile and E. japonica (Figure 5, Supplementary Table S6), we found that their Ka/Ks ratios ranged from 0 to 0.6545 and 0 to 0.8270, respectively. Notably, none of these genes exhibited Ka/Ks values exceeding 1, suggesting that purifying selection serves as the dominant evolutionary mechanism. In contrast, Lin et al. analyzed Ka, Ks, and Ka/Ks across seven Coelogyne species and identified several genes, including ycf1 and ycf2, with Ka/Ks ratios exceeding 1, suggesting positive selection [20]. These findings diverge from our results, which indicate a more prominent role of purifying selection in A. gracile and E. japonica.
In angiosperms, the contraction and expansion of IRs are ubiquitous phenomena that have been recognized as primary drivers of plastome size variation [56]. A comparative investigation of JLB, JSB, JSA, and JLA boundaries in the plastomes of six species from the tribe Arethuseae revealed that, although the overall boundary architecture was largely conserved, subtle variations existed (Figure 2). In B. striata and E. japonica, the JLB boundary was located between rpl22 and rps19, whereas in the other four species, it fell within the rpl22 gene. Previous studies have consistently reported that, in most species of this tribe, the JLB boundary was positioned between rpl22 and rps19 [16,20,57]. Moreover, discrepancies in the JSB and JSA boundaries were noted, with E. japonica differing from the remaining five species. Distinct differences were observed at the JSB and JSA junctions in E. japonica compared to the remaining five species. The JSB boundary was typically located within the ndhF gene; however, E. japonica lacked this gene, leading to its absence at this boundary. Similarly, while the ycf1 gene normally spanned the JSA junction in other species, in E. japonica, it was entirely confined within the SSC region. Although earlier studies uniformly indicated that the JSA boundary intersected the ycf1 gene in this tribe [16,20,24,57,58], the deviation observed in E. japonica was likely attributable to the absence of the ndh gene.

4.2. Codon Usage and Repeat Sequences Analysis

Codon usage bias (CUB) has frequently been employed to elucidate genetic architecture and evolutionary patterns in different species [59]. Comparative analysis of codon preference in the plastomes of A. gracile and E. japonica revealed a strikingly similar codon usage pattern between the two species (Figure 3, Supplementary Table S2). Among amino acids, Leu and Ile were the most abundant. Notably, GCU exhibited the highest RSCU value, and, among the three stop codons, UAA showed the strongest usage preference. Moreover, the majority of codons displayed a bias toward A/U in their third nucleotide. These findings were consistent with previous studies on codon usage bias in other Orchidaceae species [20,48,60].
Repetitive sequences played a crucial role in species identification, molecular marker development, and phylogenetic studies [61,62,63]. Simple sequence repeats (SSRs), short tandem repeats consisting of 1–6 bp units, were widely dispersed throughout plastomes and served as valuable molecular markers for genetic and phylogenetic analyses [60,64]. In this study, 68 and 77 SSRs were identified in A. gracile and E. japonica, respectively (Figure 4, Supplementary Table S3). Mononucleotide repeats dominated the SSR category, with 45 and 51 occurrences in A. gracile and E. japonica, accounting for approximately two-thirds of the total SSRs in each species. These repeats occurred primarily in the LSC region, whereas the IR region exhibited the lowest SSR abundance. These patterns aligned with previous findings in other Arethuseae species [16,20,24,57].
Additionally, 35 and 40 long repeat sequences were detected in A. gracile and E. japonica, respectively, exclusively comprising palindromic and forward types (Figure 4, Supplementary Table S4). This result differed from previous studies on most Arethuseae species, which typically contained three repeat types, with a minority possessing four categories [16] (Li et al., 2024). Palindromic repeats were the most prevalent, with most measuring 30–39 bp in length. These findings were in agreement with previous reports on Orchidaceae plastomes [20,50,65].
In prior investigations, 13 Pholidota species were found to contain 25–40 tandem repeats [57]. In contrast, our study detected 43 and 30 tandem repeats in A. gracile and E. japonica, respectively (Figure 4, Supplementary Table S5). Notably, tandem repeats in A. gracile exceeded the previously reported range, thereby expanding the documented diversity of tandem repeat occurrences within Arethuseae. These sequences were predominantly located in the LSC region, followed by the IRs, with the fewest occurrences in the SSC region. This distribution pattern was consistent with observations in other Arethuseae species, such as P. articulata, P. chinensis, P. leveilleana, and P. longipes [57].

4.3. Hypervariable Regions Analysis

The mVISTA analysis of six Arethuseae species revealed higher levels of sequence divergence in the LSC and SSC regions relative to the IRs, with intergenic regions exhibiting greater variability compared to coding regions (Supplementary Figure S3). These findings were consistent with plastome patterns observed in other Orchidaceae species [16,20,60]. Highly variable regions serve as valuable resources for developing molecular markers and investigating phylogenetic relationships. Such markers are fundamental for species identification and genetic diversity assessment, which ultimately inform evolutionary studies and conservation strategies. By employing six plastid sequences (matK, rbcL, ycf1, rpoC1, rpl32-trnL, and trnL-F), Huang et al. constructed a phylogenetic tree for Arethuseae, leading to the identification of a new genus, Mengzia [4]. Similarly, Li et al. identified eight highly variable regions in Thuniopsis and its relatives [24], six in Pholidota [57], and four within Coelogyninae [16]. Lin et al. further reported eight hypervariable regions in Coelogyne s.l. [20]. In the present study, the nucleotide diversity analysis of coding and intergenic sequences identified six hypervariable sequences: rps8-rpl14, rps16-trnQUUG, psbB-psbT, trnTUGU-trnLUAA, trnFGAA-ndhJ, and ycf1 (Figure 6, Supplementary Table S7). Among them, rps8-rpl14, rps16-trnQUUG, psbB-psbT, and ycf1 have been previously reported [16,20,24,57], while ycf1 has long been recognized as an informative marker in phylogenetic studies of Arethuseae [4,12].

4.4. Phylogenetic Analysis

Since Bentham first established the subtribe Arethusinae in 1881, various taxonomists have proposed conflicting classification systems based on different morphological characteristics, leading to considerable changes in the delimitation and placement of Arethusinae over time [6,7,8,9]. The phylogenetic relationships within Arethusinae, as well as the systematic positions of A. gracile and E. japonica, have remained contentious, and the subtribe was often recognized as one of the most challenging taxa in Orchidaceae taxonomy. Previous phylogenetic analyses based on limited nuclear or plastid markers yielded low support values and unstable topologies for A. gracile, E. japonica, and their closely related taxa [3,4,10,11,12,13,14].
Górniak et al. reconstructed a phylogenetic tree using the nuclear gene Xdh and found that Arethusinae was non-monophyletic, with Anthogonium positioned at the base of the higher Epidendroideae [11]. Freudenstein and Chase later inferred the phylogenetic framework of the tribe Arethuseae and, similarly, concluded that Arethusinae was non-monophyletic, with Anthogonium forming a sister group with Calopogon, Eleorchis, and Arethusa, while Arundina was sister to members of Coelogyninae [12]. More recently, Huang et al. constructed the phylogeny of Arethuseae using six molecular markers, reporting that Arethusinae was monophyletic, with Ar. graminifolia at the basal position and A. gracile forming a sister relationship with M. foliosa, Calopogon tuberosus, E. japonica, and Arethusa bulbosa [4]. We reconstructed the phylogenetic trees of Arethuseae based on complete plastome data, using the ML, MP, and BI methods (Figure 7). Our results indicated that Arethusinae was non-monophyletic, aligning with previous studies [10,11,12,13]. Ar. graminifolia was recovered as sister to members of Coelogyninae, consistent with earlier findings [11,12]. Additionally, A. gracile formed a sister group with M. foliosa and E. japonica, corroborating the results of van den Berg et al. [14] and Freudenstein and Chase [12], but conflicting with those by Górniak et al. [11] and Li et al. [13]. Moreover, Mengzia was found to be sister to Eleorchis, whereas previous studies proposed a sister relationship between Eleorchis and Arethusa [12,14]. This study provided a crucial basis for resolving the phylogenetic relationships within Arethusinae. However, due to the limited taxa sampling, further studies incorporating broader sampling will be necessary to establish a more comprehensive and robust phylogenetic framework for this subtribe.

5. Conclusions

This research involved a detailed investigation of the complete plastomes of A. gracile and E. japonica, within the subtribe Arethusinae, elucidating their structural characteristics, genetic diversity, and phylogenetic relationships. The plastomes of A. gracile and E. japonica displayed the common quadripartite structure, with conserved gene composition, although E. japonica lacked seven ndh genes. The comparative analysis revealed higher variation in intergenic regions than in coding sequences, with divergence greater within the LSC and SSC regions compared to IRs. Codon analysis showed a pronounced preference for codons ending with A/U. Purifying selection predominantly drove the evolution of protein-coding genes (Ka/Ks < 1). Notably, six hypervariable regions (rps8-rpl14, rps16-trnQUUG, psbB-psbT, trnTUGU-trnLUAA, trnFGAA-ndhJ, and ycf1) were identified, providing potential molecular markers for phylogenetic studies. Phylogenomic reconstruction, based on complete plastome sequences, indicated that Arethusinae was not monophyletic. These results not only expand genomic resources for Orchidaceae, but also offer critical insights into species delimitation, evolutionary biology, and conservation strategies, thereby establishing a solid foundation for future investigations of this taxonomically significant lineage.

Supplementary Materials

The following supporting information can be downloaded at: https://www.mdpi.com/article/10.3390/horticulturae11060698/s1, Supplementary Figure S1: The sequencing depth and coverage of A. gracile and E. japonica plastomes; Supplementary Figure S2: Mauve analysis of six Arethuseae plastomes; Supplementary Figure S3: The mVISTA analysis of six Arethuseae plastomes; Supplementary Table S1: GenBank accession numbers of the plastomes used in this study; Supplementary Table S2: The relative synonymous codon usage values of all 64 codons for the A. gracile and E. japonica plastomes; Supplementary Table S3: SSRs identified on the plastomes of A. gracile and E. japonica; Supplementary Table S4: Long repeat sequences identified on the plastomes of A. gracile and E. japonica; Supplementary Table S5: Tandem repeats of A. gracile and E. japonica; Supplementary Table S6: The Ka, Ks, and Ka/Ks values of 68 protein-coding genes; Supplementary Table S7: The Pi values of protein-coding genes and intergenic sequences.

Author Contributions

Conceptualization, M.L. and Z.Z.; methodology, X.G., Y.C. and X.X.; software, X.G. and Y.C.; data curation, X.G., Y.C., X.X. and H.C.; writing—original draft preparation, X.G., Y.C., X.X., H.C., B.X. and J.P.; writing—reviewing and editing, X.G., Y.C., X.X., H.C., B.X. and J.P.; validation, M.L. and Z.Z. All authors have read and agreed to the published version of the manuscript.

Funding

This research was funded by the Key Research and Development Program of Zhejiang Province (Grant no. 2021C02043), and the Science Fund for Distinguished Young Scholars of Fujian Province (Grant no. 2024J010023).

Data Availability Statement

The two plastome sequences of A. gracile and E. japonica generated in this study are available in the NCBI (https://www.ncbi.nlm.nih.gov, accessed on 10 March 2025) database under accession numbers PV252187 and PV252188. The raw sequencing data have been deposited in the Genome Sequence Archive (https://ngdc.cncb.ac.cn/gsa/, accessed on 21 March 2025) of the National Genomics Data Center (NGDC) database, with BioProject accession PRJCA037344, BioSample accession numbers SAMC4860194 and SAMC4860195, and GSA accession CRA023907. Voucher specimens were identified by Dr. Ming-He Li (Fujian Agriculture and Forestry University) and deposited at the Herbarium of Fujian Agriculture and Forestry University, with deposition numbers MHLi or151 and MHLi or173.

Acknowledgments

We acknowledge the technical support from the laboratory staff during the conduction of the laboratory experiments.

Conflicts of Interest

Author Jianli Pan was employed by the company Tonglu Bishui Ecological Agriculture Development Co., Ltd. The remaining authors declare that the research was conducted in the absence of any commercial or financial relationships that could be construed as a potential conflict of interest.

References

  1. Chase, M.W.; Cameron, K.M.; Freudestein, J.V.; Pridgeon, A.M.; Salazar, G.; Van den Berg, C.; Schuiteman, A. An update classification of Orchidaceae. Bot. J. Linn. Soc. 2015, 177, 151–174. [Google Scholar] [CrossRef]
  2. Chase, M.W.; Gravendeel, B.; Sulistyo, B.P.; Wti, R.K.; Schuiteman, A. Expansion of the orchid genus Coelogyne (Arethuseae; Epidendroideae) to include Bracisepalum, Bulleyia, Chelonistele, Dendrochilum, Dickasonia, Entomophobia, Geesinkorchis, Gynoglottis, Ischnogyne, Nabaluia, Neogyna, Otochilus, Panisea and Pholidota. Phytotaxa 2021, 510, 94–134. [Google Scholar] [CrossRef]
  3. Li, L.; Ye, D.P.; Niu, M.; Yan, H.F.; Wen, T.L.; Li, S.J. Thuniopsis: A new orchid genus and phylogeny of the tribe Arethuseae (Orchidaceae). PLoS ONE 2015, 10, e0132777. [Google Scholar] [CrossRef]
  4. Huang, W.C.; Liu, Z.J.; Jiang, K.; Luo, Y.B.; Jin, X.H.; Zhang, Z.; Xu, R.H.; Muchuku, J.K.; Musungwa, S.S.; Yukawa, T.; et al. Phylogenetic analysis and character evolution of tribe Arethuseae (Orchidaceae) reveal a new genus Mengzia. Mol. Phylogenet. Evol. 2022, 167, 107362. [Google Scholar] [CrossRef]
  5. Pridgeon, A.M.; Cribb, P.J.; Chase, M.W.; Rasmussen, F.N. Genera Ochidacearum Volume 4: Epidendroideae (Part One); Oxford University Press: Oxford, UK, 2005. [Google Scholar]
  6. Bentham, G. Notes on Orchideae. Biol. J. Linn. Soc. 1881, 18, 281–360. [Google Scholar] [CrossRef]
  7. Dressler, R.L. The Orchids: Natural History and Classification; Harvard University Press: Cambridge, MA, USA, 1981. [Google Scholar]
  8. Dressler, R.L. Phylogeny and Classification of the Orchid Family; Cambridge University Press: Cambridge, UK, 1993. [Google Scholar]
  9. Szlachetko, D.L. Systema orchidalium. Fragm. Florist. Geobot. Pol. 1995, 3, 1–152. [Google Scholar]
  10. Goldman, D.H.; Freudenstein, J.V.; Kores, P.J.; Molvray, M.; Jarrell, D.C.; Whitten, W.M.; Cameron, K.M.; Jansen, R.K.; Chase, M.W. Phylogenetics of Arethuseae (Orchidaceae) based on plastid matK and rbcL sequences. Syst. Bot. 2001, 37, 670–695. [Google Scholar]
  11. Górniak, M.; Paun, O.; Chase, M.W. Phylogenetic relationships within Orchidaceae based on a low-copy nuclear coding gene, Xdh: Congruence with organellar and nuclear ribosomal DNA results. Mol. Phylogenet. Evol. 2010, 56, 784–795. [Google Scholar] [CrossRef]
  12. Freudenstein, J.V.; Chase, M.W. Phylogenetic relationships in Epidendroideae (Orchidaceae), one of the great flowering plant radiations: Progressive specialization and diversification. Ann. Bot. 2015, 115, 665–681. [Google Scholar] [CrossRef]
  13. Li, Y.X.; Li, Z.H.; Schuiteman, A.; Chase, M.W.; Li, J.W.; Huang, W.C.; Hidayat, A.; Wu, S.S.; Jin, X.H. Phylogenomics of Orchidaceae based on plastid and mitochondrial genomes. Mol. Phylogenet. Evol. 2019, 139, 106540. [Google Scholar] [CrossRef]
  14. Van den Berg, C.; Goldman, D.H.; Freudenstein, J.V.; Pridgeon, A.M.; Cameron, K.M.; Chase, M.W. An overview of the phylogenetic relationships within Epidendroideae inferred from multiple DNA regions and recircumscription of Epidendreae and Arethuseae (Orchidaceae). Am. J. Bot. 2005, 92, 613–624. [Google Scholar] [CrossRef]
  15. Jansen, R.K.; Ruhlman, T.A. Plastid Genomes of Seed Plants. In Genomics of Chloroplasts and Mitochondria; Springer: Dordrecht, The Netherlands, 2012. [Google Scholar]
  16. Li, L.; Wu, Q.P.; Zhai, J.W.; Wu, K.L.; Fang, L.; Li, M.Z.; Zeng, S.J.; Li, S.J. Comparative chloroplast genomics of 24 species shed light on the genome evolution and phylogeny of subtribe Coelogyninae (Orchidaceae). BMC Plant Biol. 2024, 24, 31. [Google Scholar] [CrossRef]
  17. Liu, D.K.; Tu, X.D.; Zhao, Z.; Zeng, M.Y.; Zhang, S.; Ma, L.; Zhang, G.Q.; Wang, M.M.; Liu, Z.J.; Lan, S.R.; et al. Plastid phylogenomic data yield new and robust insights into the phylogeny of CleisostomaGastrochilus clades (Orchidaceae, Aeridinae). Mol. Phylogenet. Evol. 2020, 145, 106729. [Google Scholar] [CrossRef]
  18. Serna-Sánchez, M.A.; Pérez-Escobar, O.A.; Bogarín, D.; Torres-Jimenez, M.F.; Alvarez-Yela, A.C.; Arcila-Galvis, J.E.; Hall, C.F.; de Barros, F.; Pinheiro, F.; Dodsworth, S.; et al. Plastid phylogenomics resolves ambiguous relationships within the orchid family and provides a solid timeframe for biogeography and macroevolution. Sci. Rep. 2021, 11, 6858. [Google Scholar]
  19. Tu, X.D.; Liu, D.K.; Xu, S.W.; Zhou, C.Y.; Gao, X.Y.; Zeng, M.Y.; Zhang, S.; Chen, J.L.; Ma, L.; Zhou, Z.; et al. Plastid phylogenomics improves resolution of phylogenetic relationship in the Cheirostylis and Goodyera clades of Goodyerinae (Orchidoideae, Orchidaceae). Mol. Phylogenet. Evol. 2021, 164, 107269. [Google Scholar] [CrossRef] [PubMed]
  20. Lin, S.; Li, R.; Tang, S.; Chen, Y.; Yan, Y.; Gao, X.; Zhuo, X. Plastomes of Seven Coelogyne s.l. (Arethuseae, Orchidaceae) Species: Comparative Analysis and Phylogenetic Relationships. Horticulturae 2025, 11, 144. [Google Scholar] [CrossRef]
  21. Ai, Y.; Xie, T.-X.; Liu, D.-K.; Tu, X.-D.; Zhou, J.; Liu, Z.-J. Complete chloroplast genome of Arundina graminifolia (Orchidaceae). Mitochondrial DNA Part B 2019, 4, 2898–2899. [Google Scholar] [CrossRef] [PubMed]
  22. Jiang, M.-T.; Chao, W.-C.; Huang, C.-L.; Lan, S.-R.; Liu, Z.-J.; Wu, S.-S. The complete chloroplast genome of Pleione formosana (Orchidaceae). Mitochondrial DNA Part B 2019, 4, 1044–1046. [Google Scholar] [CrossRef]
  23. Zhang, R. Characterization and phylogenetic analysis of the complete plastome sequence of Thunia alba (Lindley) HG Reichenbach (Orchidaceae), a rare wild ornamental orchid. Mitochondrial DNA Part B 2019, 4, 4039–4040. [Google Scholar] [CrossRef]
  24. Li, L.; Wu, Q.; Fang, L.; Wu, K.; Li, M.; Zeng, S. Comparative chloroplast genomics and phylogenetic analysis of Thuniopsis and closely related genera within Coelogyninae (Orchidaceae). Front. Genet. 2022, 13, 850201. [Google Scholar] [CrossRef]
  25. Li, J.; Wang, S.; Yu, J.; Wang, L.; Zhou, S. A Modified CTAB Protocol for Plant DNA Extraction. Chin. Bull. Bot. 2013, 48, 72–78. [Google Scholar]
  26. Chen, S.F.; Zhou, Y.Q.; Chen, Y.R.; Gu, J. fastp: An ultra-fast all-in-one FASTQ preprocessor. Bioinformatics 2018, 34, 884–890. [Google Scholar] [CrossRef] [PubMed]
  27. Jin, J.J.; Yu, W.B.; Yang, J.B.; Song, Y.; dePamphilis, C.W.; Yi, T.S.; Li, D.Z. GetOrganelle: A fast and versatile toolkit for accurate de novo assembly of organelle genomes. Genome Biol. 2020, 21, 241. [Google Scholar] [CrossRef]
  28. Kearse, M.; Moir, R.; Wilson, A.; Stones-Havas, S.; Cheung, M.; Sturrock, S.; Buxton, S.; Cooper, A.; Markowitz, S.; Duran, C.; et al. Geneious basic: An integrated and extendable desktop software platform for the organization and analysis of sequence data. Bioinformatics 2012, 28, 1647–1649. [Google Scholar] [CrossRef] [PubMed]
  29. Ni, Y.; Li, J.L.; Zhang, C.; Liu, C. Generating Sequencing Depth and Coverage Map for Organelle Genomes. Protocols.io 2023. [Google Scholar] [CrossRef]
  30. Qu, X.-J.; Moore, M.J.; Li, D.-Z.; Yi, T.-S. PGA: A software package for rapid, accurate, and flexible batch annotation of plastomes. Plant Methods 2019, 15, 50. [Google Scholar] [CrossRef]
  31. Beier, S.; Thiel, T.; Münch, T.; Scholz, U.; Mascher, M. MISA-web: A web server for microsatellite prediction. Bioinformatics 2017, 33, 2583–2585. [Google Scholar] [CrossRef]
  32. Kurtz, S.; Choudhuri, J.V.; Ohlebusch, E.; Schleiermacher, C.; Stoye, J.; Giegerich, R. REPuter: The manifold applications of repeat analysis on a genomic scale. Nucleic Acids Res. 2001, 29, 4633–4642. [Google Scholar] [CrossRef]
  33. Benson, G. Tandem repeats finder: A program to analyze DNA sequences. Nucleic Acids Res. 1999, 27, 573–580. [Google Scholar] [CrossRef]
  34. Darling, A.E.; Mau, B.; Perna, N.T. progressiveMauve: Multiple genome alignment with gene gain, loss and rearrangement. PLoS ONE 2010, 5, e11147. [Google Scholar] [CrossRef]
  35. Brudno, M.; Malde, S.; Poliakov, A.; Do, C.B.; Couronne, O.; Dubchak, I.; Batzoglou, S. Glocal alignment: Finding rearrangements during alignment. Bioinformatics 2003, 19, i54–i62. [Google Scholar] [CrossRef] [PubMed]
  36. Zhang, D.; Gao, F.; Jakovlić, I.; Zou, H.; Zhang, J.; Li, W.X.; Wang, G.T. PhyloSuite: An integrated and scalable desktop platform for streamlined molecular sequence data management and evolutionary phylogenetics studies. Mol. Ecol. Resour. 2020, 20, 348–355. [Google Scholar] [CrossRef] [PubMed]
  37. Kumar, S.; Nei, M.; Dudley, J.; Tamura, K. MEGA: A biologist-centric software for evolutionary analysis of DNA and protein sequences. Brief. Bioinform. 2008, 9, 299–306. [Google Scholar] [CrossRef]
  38. Xia, X. Dambe7: New and improved tools for data analysis in molecular biology and evolution. Mol. Biol. Evol. 2018, 35, 1550–1552. [Google Scholar] [CrossRef] [PubMed]
  39. Katoh, K.; Standley, D.M. MAFFT multiple sequence alignment software version 7: Improvements in performance and usability. Mol. Biol. Evol. 2013, 30, 772–780. [Google Scholar] [CrossRef]
  40. Glez-Peña, D.; Gómez-Blanco, D.; Reboiro-Jato, M.; Fdez-Riverola, F.; Posada, D. ALTER: Program-oriented format conversion of DNA and protein alignments. Nucleic Acids Res. 2010, 38, W14–W18. [Google Scholar] [CrossRef] [PubMed]
  41. Wang, D.; Zhang, Y.; Zhang, Z.; Zhu, J.; Yu, J. KaKs_Calculator 2.0: A toolkit incorporating gamma-series methods and sliding window strategies. Genom. Proteom. Bioinform. 2010, 8, 77–80. [Google Scholar] [CrossRef]
  42. Capella-Gutierrez, S.; Silla-Martinez, J.M.; Gabaldon, T. Trimal: A tool for automated alignment trimming in large-scale phylogenetic analyses. Bioinformatics 2009, 25, 1972–1973. [Google Scholar] [CrossRef]
  43. Miller, M.A.; Pfeiffer, W.; Schwartz, T. Creating the CIPRES Science Gateway for Inference of Large Phylogenetic Trees. In Proceedings of the 2010 Gateway Computing Environments Workshop, GCE, New Orleans, LA, USA, 14 November 2010. [Google Scholar]
  44. Tao, L.; Duan, H.; Tao, K.; Luo, Y.; Li, Q.; Li, L. Complete chloroplast genome structural characterization of two Phalaenopsis (Orchidaceae) species and comparative analysis with their alliance. BMC Genom. 2023, 24, 359. [Google Scholar] [CrossRef]
  45. Wu, Y.; Zeng, M.-Y.; Wang, H.-X.; Lan, S.; Liu, Z.-J.; Zhang, S.; Li, M.-H.; Guan, Y. The Complete Chloroplast Genomes of Bulbophyllum (Orchidaceae) Species: Insight into Genome Structure Divergence and Phylogenetic Analysis. Int. J. Mol. Sci. 2024, 25, 2665. [Google Scholar] [CrossRef]
  46. Lin, C.S.; Chen, J.J.W.; Chiu, C.C.; Hsiao, H.C.W.; Yang, C.J.; Jin, X.H.; Leebens-Mack, J.; de Pamphilis, C.W.; Huang, Y.T.; Yang, L.H.; et al. Concomitant loss of NDH complex-related genes within chloroplast and nuclear genomes in some orchids. Plant J. 2017, 90, 994–1006. [Google Scholar] [CrossRef]
  47. Zavala-Páez, M.; Vieira, L.D.N.; Baura, V.A.D.; Balsanelli, E.; Souza, E.M.D.; Cevallos, M.C.; Smidt, E.D.C. Comparative plastid genomics of neotropical Bulbophyllum (Orchidaceae; Epidendroideae). Front. Plant Sci. 2020, 11, 799. [Google Scholar] [CrossRef] [PubMed]
  48. Xiao, T.; He, L.; Yue, L.; Zhang, Y.; Lee, S.Y. Comparative phylogenetic analysis of complete plastid genomes of Renanthera (Orchidaceae). Front. Genet. 2022, 13, 998575. [Google Scholar] [CrossRef] [PubMed]
  49. Liu, D.K.; Zhou, C.Y.; Tu, X.D.; Zhao, Z.; Chen, J.L.; Gao, X.Y.; Xu, S.W.; Zeng, M.Y.; Ma, L.; Ahmad, S.; et al. Comparative and phylogenetic analysis of Chiloschista (Orchidaceae) species and DNA barcoding investigation based on plastid genomes. BMC Genom. 2023, 24, 749. [Google Scholar] [CrossRef]
  50. Zhao, Z.; Zeng, M.Y.; Wu, Y.W.; Li, J.W.; Zhou, Z.; Liu, Z.J.; Li, M.H. Characterization and comparative analysis of the complete plastomes of five Epidendrum (Epidendreae, Orchidaceae) species. Int. J. Mol. Sci. 2023, 24, 14437. [Google Scholar] [CrossRef]
  51. Zhou, Z.; Chen, J.; Wang, F.; Wu, X.; Liu, Z.; Peng, D.; Lan, S. The Complete Chloroplast Genome of an Epiphytic Leafless Orchid, Taeniophyllum complanatum: Comparative Analysis and Phylogenetic Relationships. Horticulturae 2024, 10, 660. [Google Scholar] [CrossRef]
  52. Barrett, C.F.; Kennedy, A.H. Plastid genome degradation in the endangered, mycoheterotrophic, North American orchid Hexalectris warnockii. Genome Biol. Evol. 2018, 10, 1657–1662. [Google Scholar] [CrossRef] [PubMed]
  53. Kim, Y.K.; Jo, S.; Cheon, S.H.; Joo, M.J.; Hong, J.R.; Kwak, M.H.; Kim, K.J. Extensive losses of photosynthesis genes in the plastome of a mycoheterotrophic orchid, Cyrtosia septentrionalis (Vanilloideae: Orchidaceae). Genome Biol. Evol. 2019, 11, 565–571. [Google Scholar] [CrossRef]
  54. Zeng, M.Y.; Li, M.H.; Lan, S.; Yin, W.L.; Liu, Z.J. Comparative phylogenomic study of Malaxidinae (Orchidaceae) sheds light on plastome evolution and gene divergence. Int. J. Mol. Sci. 2024, 25, 11181. [Google Scholar] [CrossRef]
  55. Kimura, M. The neutral theory of molecular evolution and the world view of the neutralists. Genome 1989, 31, 24–31. [Google Scholar] [CrossRef]
  56. Weng, M.L.; Ruhlman, T.A.; Jansen, R.K. Expansion of inverted repeat does not decrease substitution rates in Pelargonium plastid genomes. New Phytol. 2017, 214, 842–851. [Google Scholar] [CrossRef] [PubMed]
  57. Li, L.; Wang, W.; Zhang, G.; Wu, K.; Fang, L.; Li, M.; Liu, Z.; Zeng, S. Comparative analyses and phylogenetic relationships of thirteen Pholidota species (Orchidaceae) inferred from complete chloroplast genomes. BMC Plant Biol. 2023, 23, 269. [Google Scholar] [CrossRef] [PubMed]
  58. Han, S.; Wang, R.; Hong, X.; Wu, C.; Zhang, S.; Kan, X. Plastomes of Bletilla (Orchidaceae) and phylogenetic implications. Int. J. Mol. Sci. 2022, 23, 10151. [Google Scholar] [CrossRef]
  59. Yu, X.; Liu, J.; Li, H.; Liu, B.Y.; Zhao, B.Q.; Ning, Z.Y. Comprehensive analysis of synonymous codon usage bias for complete genomes and E2 gene of atypical porcine pestivirus. Biochem. Genet. 2021, 59, 799–812. [Google Scholar] [CrossRef]
  60. Jiang, H.; Tian, J.; Yang, J.; Dong, X.; Zhong, Z.; Mwachala, G.; Zhang, C.; Hu, G.; Wang, Q. Comparative and phylogenetic analyses of six Kenya Polystachya (Orchidaceae) species based on the complete chloroplast genome sequences. BMC Plant Biol. 2022, 22, 177. [Google Scholar] [CrossRef]
  61. Agrama, H.; Tuinstra, M. Phylogenetic diversity and relationships among sorghum accessions using SSRs and RAPDs. Afr. J. Biotechnol. 2003, 2, 334–340. [Google Scholar] [CrossRef]
  62. Doorduin, L.; Gravendeel, B.; Lammers, Y.; Ariyurek, Y.; Chin-A-Woeng, T.; Vrieling, K. The complete chloroplast genome of 17 individuals of pest species Jacobaea vulgaris: SNPs, microsatellites and barcoding markers for population and phylogenetic studies. DNA Res. 2011, 18, 93–105. [Google Scholar] [CrossRef]
  63. Yang, A.H.; Zhang, J.J.; Yao, X.H.; Huang, H.W. Chloroplast microsatellite markers in Liriodendron tulipifera (Magnoliaceae) and cross-species amplification in L. chinense. Am. J. Bot. 2011, 98, e123–e126. [Google Scholar] [CrossRef] [PubMed]
  64. Madhumati, B. Potential and application of molecular markers techniques for plant genome analysis. Int. J. Pure App. Biosci. 2014, 2, 169–188. [Google Scholar]
  65. Zhou, C.Y.; Zeng, M.Y.; Gao, X.Y.; Zhao, Z.; Li, R.Y.; Wu, Y.H.; Liu, Z.J.; Zhang, D.Y.; Li, M.H. Characteristics and comparative analysis of seven complete plastomes of Trichoglottis s.l. (Aeridinae, Orchidaceae). Int. J. Mol. Sci. 2023, 24, 14544. [Google Scholar] [CrossRef]
Figure 1. Plastome annotation maps of A. gracile (A) and E. japonica (B). The transcriptional directions of genes in the inner and outer circles are opposite, the inner ring genes are transcribed clockwise, while the outer ring genes are transcribed counterclockwise. Genes are represented by distinct colors to indicate their functions, and GC content gradients are depicted by the gray intensity in the inner circle.
Horticulturae 11 00698 g001
Figure 2. Comparison of four boundaries for six Arethuseae plastomes.
Horticulturae 11 00698 g002
Figure 3. Amino acid numbers in terms of A. gracile and E. japonica.
Horticulturae 11 00698 g003
Figure 4. Repeat sequences in terms of A. gracile and E. japonica: (A) number of SSRs (mono, di, tri, tetra, penta, and hexa); (B) number of SSRs in LSC, SSC, and IR regions; (C) number of long repeats; (D) number of long repeats by length; (E) number of tandem repeats in LSC, SSC, and IR regions; and (F) number of tandem repeats by length.
Horticulturae 11 00698 g004
Figure 5. The Ka, Ks, and Ka/Ks values of 68 PCGs in A. gracile and E. japonica.
Horticulturae 11 00698 g005
Figure 6. Pi and sequence length of PCGs (A) and intergenic regions (B).
Horticulturae 11 00698 g006
Figure 7. The ML tree of 24 Arethuseae and 6 outgroup species was constructed based on complete plastomes. Node supports are indicated as bootstrap values for ML/MP (BSML/BSMP) and Bayesian posterior probabilities (PP), with asterisks “*” denoting full support (BS = 100 or PP = 1.00). Dash “-” represents topological conflicts among ML/MP/BI. Newly sequenced data are in bold.
Horticulturae 11 00698 g007
Table 1. Annotated gene information of the plastomes of A. gracile and E. japonica. The symbols “#” and “##” denote genes containing one and two introns, respectively. An asterisk “*” indicates that the gene is missing in E. japonica, and “(2)” indicates that the gene copies twice.
Gene Function ClassificationGroup of GenesGene Name
Self-replicationRibosomal RNA genesrrn4.5(2)rrn5(2)rrn16(2)rrn23(2)
Transfer RNA genestrnA-UGC(2),#trnC-GCAtrnD-GUCtrnE-UUC
trnF-GAAtrnfM-CAUtrnG-GCCtrnG-UCC#
trnH-GUG(2)trnI-CAU(2)trnI-GAU(2),#trnK-UUU#
trnL-CAA(2)trnL-UAA#trnL-UAGtrnM-CAU
trnN-GUU(2)trnP-UGGtrnQ-UUGtrnR-ACG(2)
trnR-UCUtrnS-GCUtrnS-GGAtrnS-UGA
trnT-GGUtrnT-UGUtrnV-GAC(2)trnV-UAC#
trnW-CCAtrnY-GUA
RNA polymeraserpoArpoBrpoC1#rpoC2
Small subunits of ribosomerps2rps3rps4rps7(2)
rps8rps11rps12(2),##* rps14
rps15rps16#rps18rps19(2)
Lange subunits of ribosomerpl2(2),#rpl14rpl16#rpl20
rpl22rpl23(2)rpl32rpl33
rpl36
Genes for photosynthesisPhotosystem IpsaApsaBpsaCpsaI
psaJ
Photosystem IIpsbApsbBpsbCpsbD
psbEpsbFpsbHpsbI
psbJpsbKpsbLpsbM
psbNpsbTpsbZ
RubisCO large subunitsrbcL
Cytochrome b/f complexpetApetB#petD#petG
petLpetN
Subunits of ATP synthaseatpAatpBatpEatpF#
atpHatpI
NADH dehydrogenasendhA#ndhB(2),#ndhC*ndhD*
ndhEndhF*ndhG*ndhH*
ndhI*ndhJndhK*
Other genesProteaseclpP##
MaturasematK
Envelope membrane proteincemA
Subunits of acetyl-CoA-carboxylaseaccD
C-type cytochrome synthesisccsA
Translational initiation factorinfA
Unknown function geneHypothetical chloroplast reading framesycf1ycf2(2)ycf3##ycf4
Disclaimer/Publisher’s Note: The statements, opinions and data contained in all publications are solely those of the individual author(s) and contributor(s) and not of MDPI and/or the editor(s). MDPI and/or the editor(s) disclaim responsibility for any injury to people or property resulting from any ideas, methods, instructions or products referred to in the content.

