Article

Genotype × Environment Interaction and Correlations Between Agronomic Traits, Flowering, and Fruit Set in Cassava

by
Luana da Silva Guedes
1,
Massaine Bandeira e Sousa
2 and
Eder Jorge de Oliveira
2,*
1
Centro de Ciências Agrárias, Ambientais e Biológicas, Campus Cruz das Almas, Universidade Federal do Recôncavo da Bahia, Cruz das Almas 44380-000, BA, Brazil
2
Embrapa Mandioca e Fruticultura, Nugene, Cruz das Almas 44380-000, BA, Brazil
*
Author to whom correspondence should be addressed.
Horticulturae 2025, 11(6), 648; https://doi.org/10.3390/horticulturae11060648 (registering DOI)
Submission received: 14 April 2025 / Revised: 5 May 2025 / Accepted: 20 May 2025 / Published: 7 June 2025
(This article belongs to the Section Propagation and Seeds)

Abstract

:
The lack of synchronization and low flowering rates in cassava (Manihot esculenta Crantz) present significant challenges for breeding programs. This study evaluated (i) genetic variability in flowering and fruiting; (ii) genotype × environment interactions and climatic influences on flowering; and (iii) correlations between plant architecture, flowering traits, and yield. Two field experiments were conducted with 290 and 343 genotypes, respectively. From 4 months after planting (MAPs), flowering and fruiting traits were monitored monthly. At 12 MAPs, plant architecture, root yield, and quality traits were assessed. Genotypes were grouped using discriminant analysis of principal components (DAPC). The results showed significant genetic variability for flowering and fruiting. About 76% of genotypes flowered in both environments, while 24% flowered in only one. Early flowering (by 4 MAPs) occurred in 86% of genotypes. Five distinct genotype groups were identified, with Group 1 showing superior flowering and early onset. Optimal flower production occurred at mean daily temperatures within the range 21.5–24 °C in Experiment 2. However, no significant correlations were found between flowering and yield traits. This study provides insights into cassava flowering dynamics and supports breeding efforts to develop improved populations with more-predictable flowering behavior.

1. Introduction

Cassava (Manihot esculenta Crantz) originated in South America [1,2] and is now a staple crop in the tropical regions of Asia and Africa [3]. It ranks as the third-most abundant crop in these regions, following rice and maize and is cultivated for food, animal feed, and industrial uses [4,5], including applications in the food, pharmaceutical, cosmetic, biofuel, and paper industries. Known for its adaptability to diverse climates and low-fertility soils [6,7], cassava plays a critical role in food security and climate resilience for smallholder farmers [8].
Cassava is a major source of carbohydrates, producing approximately 40% and 25% more per hectare than rice and maize, respectively [4]. Although all parts of the plant are economically valuable, the root is the primary commercial product. In 2022, global cassava production reached 300 million tons across 28.2 million hectares [9]. Yields, however, vary widely—ranging from 7.33 t/ha in Bahia to 23.65 t/ha in Paraná, Brazil—mainly due to differences in agronomic practices and the use of improved varieties [10]. This has driven the growing demand for high-yielding genotypes tailored to industrial needs [9].
Cassava is typically propagated asexually via stem cuttings, preserving the genetic identity of the “mother plant” in the next generation. For breeding, however, sexual propagation through botanical seeds enables recombination and the development of superior genotypes [11,12]. Despite this potential, the use of elite parental lines is constrained by factors such as poor or asynchronous flowering [13]. Some clones flower early (4–5 months after planting), others late (8–10 months) or not at all [13].
Flowering is also linked to plant architecture—particularly branching, which promotes flower production [13,14,15]. Yet many farmers prefer erect genotypes with minimal branching, especially for mechanized systems, limiting the use of highly branched types in breeding programs. Thus, a key challenge is to select parental lines that combine synchronized flowering, high genetic value, and agronomic traits such as erect growth or late branching (>1.60 m).
Understanding the impact of environmental factors on cassava flowering is crucial for optimizing crossbreeding by ensuring that flowering aligns with the most favorable climatic conditions [8]. Although the mechanisms regulating cassava flowering remain incompletely understood, existing research indicates that both genetic and environmental factors—such as temperature, rainfall, and photoperiod—affect flowering and fruiting in different varieties [16,17,18]. Additionally, while correlations between flowering and yield traits have been reported in various crops, particularly cereals and other grains [19,20], such relationships remain underexplored in tuberous crops like cassava. Although some previous studies have examined flowering diversity and its agronomic correlations in cassava, the novelty of this study lies in its detailed analysis of how genotype–environment (G × E) interactions influence flowering and fruiting dynamics—an area still poorly understood. Moreover, this study is one of the first to link flowering behavior with root yield and quality in cassava, providing novel insights from multi-environment data that support breeding efforts to improve both reproductive synchronization and productivity.
The limited understanding of the environmental and genetic factors that influence flowering in cassava has hindered the effective use of the species’ genetic resources in breeding programs, thus limiting genetic gains in root production, resistance to biotic stresses, and tolerance to environmental stresses [18]. In cassava germplasm evaluation, significant variation exists for flowering as well as for morphological, agronomic, and yield traits [21,22,23,24]. Therefore, it is possible to select genotypes that are agronomically useful and capable of producing progenies with a higher number of individuals. The objectives of the present study were: (i) to assess the genetic variability of flowering and fruiting capacity; (ii) to evaluate genotype × environment interactions and the influence of climatic factors on flowering; and (iii) to estimate genetic parameters by correlating plant architecture and flowering data with yield traits in cassava germplasm.

2. Materials and Methods

2.1. Plant Material and Environmental Characterization of the Experiments

Two field trials were evaluated.
Experiment 1 was conducted from November 2019 to July 2020 (2019/2020 crop season) in the experimental area of Embrapa Mandioca e Fruticultura (CNPMF—latitude 12°39′25″ S, longitude 39°07′27″ W, 226 m above sea level) in the municipality of Cruz das Almas, BA, Brazil. This experiment consisted of 290 cassava genotypes, including both improved and local varieties (Supplementary Materials, Tables S1 and S2). The total rainfall during the evaluation period was 1279 mm (Figure 1). Monthly rainfall ranged from 24 mm, recorded in December 2019 during the summer, to 326 mm, recorded in April 2020 during the autumn. The average temperature ranged from 21.7 to 26.4 °C, with higher temperatures during the summer months of February and March, and milder temperatures between April and June.
Experiment 2 was conducted from August 2022 to April 2023 (2022/2023 crop season) in the experimental area of the Universidade Federal do Recôncavo da Bahia (UFRB—Cruz das Almas, BA, Brazil, latitude 12°40′10.6″ S, longitude 39°04′26.4″ W, 226 m above sea level). This experiment involved 343 genotypes, including both improved and local varieties (Supplementary Materials, Tables S1 and S2). The total rainfall during the experiment was 888 mm (Figure 1). November 2022 had the highest rainfall (261 mm), while the lowest was in April 2023 (43.7 mm). The average temperature ranged from 21.5 to 25.8 °C, with higher temperatures during the summer months (December to March) and milder temperatures during the winter (July to September).
A total of 546 genotypes were evaluated, with 87 genotypes common to both experiments (Tables S1 and S2). For planting, stem cuttings measuring 15 to 20 cm in length, with an average of eight buds, were used. These cuttings were taken from the middle third of 12-month-old plants that were in good phytosanitary condition. The cuttings were planted horizontally in furrows approximately 10 cm deep in plowed and harrowed soil. The planting arrangement followed a row spacing of 0.90 m and a plant spacing of 0.80 m. Each plot consisted of two rows with 10 plants each, totaling 20 plants per plot. The experimental design used in both trials was the augmented block design (ABD), with 15 check varieties distributed across 14 blocks in Experiment 1 and 15 blocks in Experiment 2. The check varieties served as regular treatments (repeated across blocks), while the remaining genotypes were non-regular treatments. The selection of accessions was based on flowering evaluations from Experiment 1 and germination potential. The same check varieties were used in both experiments: BR-11-24-156, BGM-2097, BRS-Verdinha, BRS Tapioqueira, BRS Novo Horizonte, BRS Mulatinha, BR-11-34-41, BRS Amansa Burro, BRS Gema de Ovo, BRS Dourada, BRS CS01, BRS Poti Branca, BGM-2339, BRS 399, and BGM-2151. Standard agronomic practices, including weed and pest control and top-dressing fertilization, were carried out following the recommendations of Souza et al. [25].

2.2. Flowering Evaluation

Flowering and fruit set were evaluated monthly on three plants per experimental plot, specifically selected from the center of the plot and properly labeled for identification. Evaluations began four months after planting (MAPs) and continued for nine months, spanning from 4 to 12 MAPs in both experiments.
The qualitative characteristic “flowering score” was assessed using the flowering incidence scale established by Souza et al. [18]: 0—no flowering observed; 1—low flowering incidence (one to two inflorescences, with up to four female flowers and/or 20 male flowers); 2—moderate flowering (two to three inflorescences, with up to four female flowers and/or 20–30 male flowers); 3—abundant flowering (more than three inflorescences, with more than four female flowers and over 30 male flowers). Based on this scale, three additional flowering-related traits were derived: (a) mean flowering score (MFS): the mean flowering score across all monthly evaluations for each genotype; (b) weighted average score according to early flowering (WAS): a score assigning higher weights to early-flowering genotypes, with values decreasing from 18 to 2, following the methodology of Souza et al. [18]; (c) number of flowering months (NFM): the total number of months in which clones exhibited flowering during the evaluation period, from 3 to 12 months after planting.
The quantitative traits evaluated included: (a) number of female flowers (NFF); (b) number of male flowers (NMFl); (c) number of fruits (NFr). For these quantitative evaluations, all flowers and fruits present on each of the three plants per plot were carefully counted. To avoid duplication, the inflorescences assessed each month were marked, ensuring accurate data collection in subsequent evaluations.

2.3. Agronomic Trait Evaluation

At harvest time (12 MAPs), seven agronomic traits were evaluated: (1) plant height (PlHe, cm)—measured from the ground level to the highest point of the plant; (2) number of stems per plant (NSP)—count of total stems per individual plant; (3) plant growth habit (PlArc, scale of 1–5)—assessed using a standardized scale; (4) dry matter content in roots (DMC, %)—determined using a hydrostatic scale, following the methodology of Kawano et al. [26]; (5) above-ground yield (ShY, t ha−1)—biomass yield of stems and leaves per hectare; (6) root yield (FRY, t ha−1)—total fresh root yield per hectare; and (7) leaf retention (LeRet, scale of 1–5)—evaluated based on the plant’s ability to retain leaves, using a five-point scale.

2.4. Data Analyses

Phenotypic data were analyzed both individually and jointly to estimate genotype × environment (G × E) interaction. The following mixed model was used for the individual analysis: y = X b + Z g + W m a p + e , where y is the vector of phenotypic observations; b is the vector of fixed effects (overall mean and block effects); g is the vector of genotype effects, treated as random; m a p is the vector of fixed effects for the evaluation month; and e is the vector of random errors. The matrices X , Z , and W link the unknown parameters ( b , g , and m a p ) with the data vector y . For the joint analysis, the mixed model used was: y = X b + Z g + W p + I g p + W m a p + e , where b is the vector of fixed effects (overall mean and block effects); g is the vector of genotype effects, treated as random; p is the vector of fixed effects for the environment; g p   is the vector of random genotype × environment interaction effects; and m a p is the vector of fixed effects for the evaluation month. The matrices X , Z , W , and I link the unknown parameters ( g ,   p , g p , and m a p ) with the data vector y . For the environmental factor, the location and year of evaluation were considered. Experiments 1 and 2 were conducted in the same city (Cruz das Almas, BA, Brazil), but at different sites within the municipality and in different years. As such, Experiment 1 (CNPMF—2019/2020) and Experiment 2 (UFRB—2022/2023) were considered distinct environments.
Broad-sense heritability (H2) was estimated using variance components derived from the mixed models. For individual analyses, H2 was calculated as: H 2 = σ g 2 σ g 2 + σ e 2 r , where σ g 2 is the genetic variance (genotype), σ e 2   is the residual variance (error), and r is the number of replications. For the joint analysis across environments, the model included the genotype × environment interaction, and H2 was calculated as: H 2 = σ g 2 σ g 2 + σ g e 2 e + σ e 2 r e , where σ g e 2 is the genotype × environment interaction variance, and e is the number of environments.
Genetic and phenotypic parameter estimates were obtained using the lme4 package [27] in R software version 4.3.2 [28]. The F-test was used to assess fixed effects, and the likelihood ratio test (LRT) was used for random effects at the 5 and 1% significance levels. The best linear unbiased predictions (BLUPs) were estimated for flowering/fruiting and agronomic data.
A cubic regression analysis was conducted to examine the relationship between flowering and fruiting data and climatic variables, including rainfall (mm) and maximum, mean, and minimum temperatures (°C). Temporal best linear unbiased estimation (BLUE), accounting for the effect of the number of MAPs on the number of male and female flowers and number of fruits, were used in this regression analysis. Additionally, Spearman’s correlations were calculated to assess the relationships between flowering/fruiting traits and agronomic data. Genotypes were classified using discriminant analysis of principal components (DAPC) to identify clustering patterns in the multivariate dataset. This analysis was performed using the adegenet package version 2.1.11 [29] in R software version 4.3.2 [28].

3. Results

3.1. General Flowering Traits

Out of the 87 genotypes evaluated in both experiments, 10% did not flower, while the rest flowered in at least one of the experiments. These genotypes were classified based on flowering stability, with the results shown in Table S1. Most genotypes (76%) displayed high stability, flowering in both years of evaluation, while the remaining 24% flowered in only one experiment. Additionally, 86% of the genotypes flowered early, by the 4th MAP.
Of the 459 genotypes evaluated in one of the two experiments, 90 genotypes (20%) did not flower during the 9-month evaluation period (4th to 12th MAP) (Table S2). The remaining 366 genotypes were categorized based on flowering timing, with 73.2% flowering early, 24.3% flowering at an intermediate stage (between the 5th and 10th MAP), and 2.5% flowering late (during the 11th or 12th MAP).

3.2. Deviance Analysis of Flowering and Fruiting Traits in Cassava

Significant differences (p ≤ 0.05) were observed among the genotypes regarding the flowering and fruiting traits of the cassava evaluated in both experiments (Table 1). This indicates genetic variability in the evaluated germplasm for male, female, and fruit production.
The broad-sense heritability (H2) ranged from low to moderate (>0.30), indicating that while male and female flower production and fruit yield are influenced by environmental factors, there is still some genetic variation that can be used for species improvement and selection through progeny testing. The H2 values from individual trials for the number of fruits and number of male and female flowers were 0.32, 0.47, and 0.31, respectively (Experiment 1) and 0.32, 0.26, and 0.17, respectively (Experiment 2). In the joint analysis, H2 decreased for the number of fruits (0.27) and number of male flowers (0.02) but increased significantly for the number of female flowers to 0.59, indicating moderate heritability for this trait.
The average performance of cassava genotypes for the number of male flowers and female flowers and number of fruits across both years is summarized in Table 1. Genotypes in Experiment 1 had lower averages (1.89 fruits, 4.16 male flowers, and 1.33 female flowers) compared to genotypes in Experiment 2, which had higher averages (2.07 fruits, 15.18 male flowers, and 1.51 female flowers).
The joint analysis showed that environmental variance (combination of year and location) was greater than genetic variance, G × E interaction variance, and residual variance for the number of male and female flowers (Table 1), suggesting that the year and location of planting had a major impact on these traits. For the number of fruits, residual variance was the dominant factor, indicating that uncontrollable influences had a greater effect on the differences observed than genetic factors. Overall, flowering traits were more influenced by environmental factors than genetic differences among genotypes.
The analysis of the mean flowering score, weighted average score according to early flowering, and number of flowering months found significant differences (p ≤ 0.05) among the evaluated genotypes (Table 2). However, the G × E interaction was not significant, meaning that genotypic effects on flowering and fruiting traits remained stable across both experiments.
The H2 values for the mean flowering score and weighted average score according to early flowering were higher in Experiment 2 (0.52 and 0.54, respectively) compared to Experiment 1 (0.43 and 0.50, respectively) (Table 2). The H2 values for the mean flowering score and number of flowering months in the joint analysis were higher than in the individual analysis, reaching 0.97 and 0.96, respectively. For the weighted average score according to early flowering, the H2 values remained stable with a moderate magnitude (ranging between 0.50 and 0.54). Additionally, the environmental effect was significant (p < 0.05) in the joint analysis, further emphasizing the influence of the evaluation period on the results for these three traits.

3.3. Average Performance of Flower and Fruit Set During the Experimental Period

Overall, flower and fruit production varied across the different evaluation months in the experiments (Figure 2). In Experiment 1, the highest production of female flowers (an average of 3.4 flowers) and male flowers (an average of 9.9 flowers) was observed in the 4th MAP (November 2019—spring). After this period, flower production declined from the 5th to the 9th MAP, except for a slight increase in the 7th MAP. Following this phase, flower production rose again, particularly for male flowers. Regarding the number of fruits, the highest fruit production was recorded between the 4th and 5th MAP, with averages of 6.3 and 4.8 fruits, respectively, coinciding with peak flower production. This suggests that flowering had already begun before the 4th MAP.
In Experiment 2, early flowering was observed, with an average of 2.6 female flowers and 19.0 male flowers recorded in the 4th MAP (August 2022). Flower production then slightly declined from the 5th MAP onward, remaining relatively stable until the 9th MAP (Figure 2). A sharp decrease was observed in the 10th MAP (February 2023), with only 0.8 female flowers and 10.0 male flowers recorded. However, flower production increased again in the following months (March and April 2023). The highest fruit production occurred in the 9th MAP, averaging 3.5 fruits, while the lowest was recorded in the 4th MAP. This suggests that flowering in Experiment 2 occurred later compared to Experiment 1.
Although climatic factors such as temperature and rainfall likely influenced the observed differences in flowering and fruiting dynamics between the two experiments, it is also possible that genotypic variation contributed significantly to these patterns. Despite the presence of many genotypes in common across both years of evaluation, the use of partially distinct sets of genotypes makes it difficult to fully disentangle the effects of environmental versus genetic factors.

3.4. Relationship Between Flowering and Fruiting with Climatic Variables

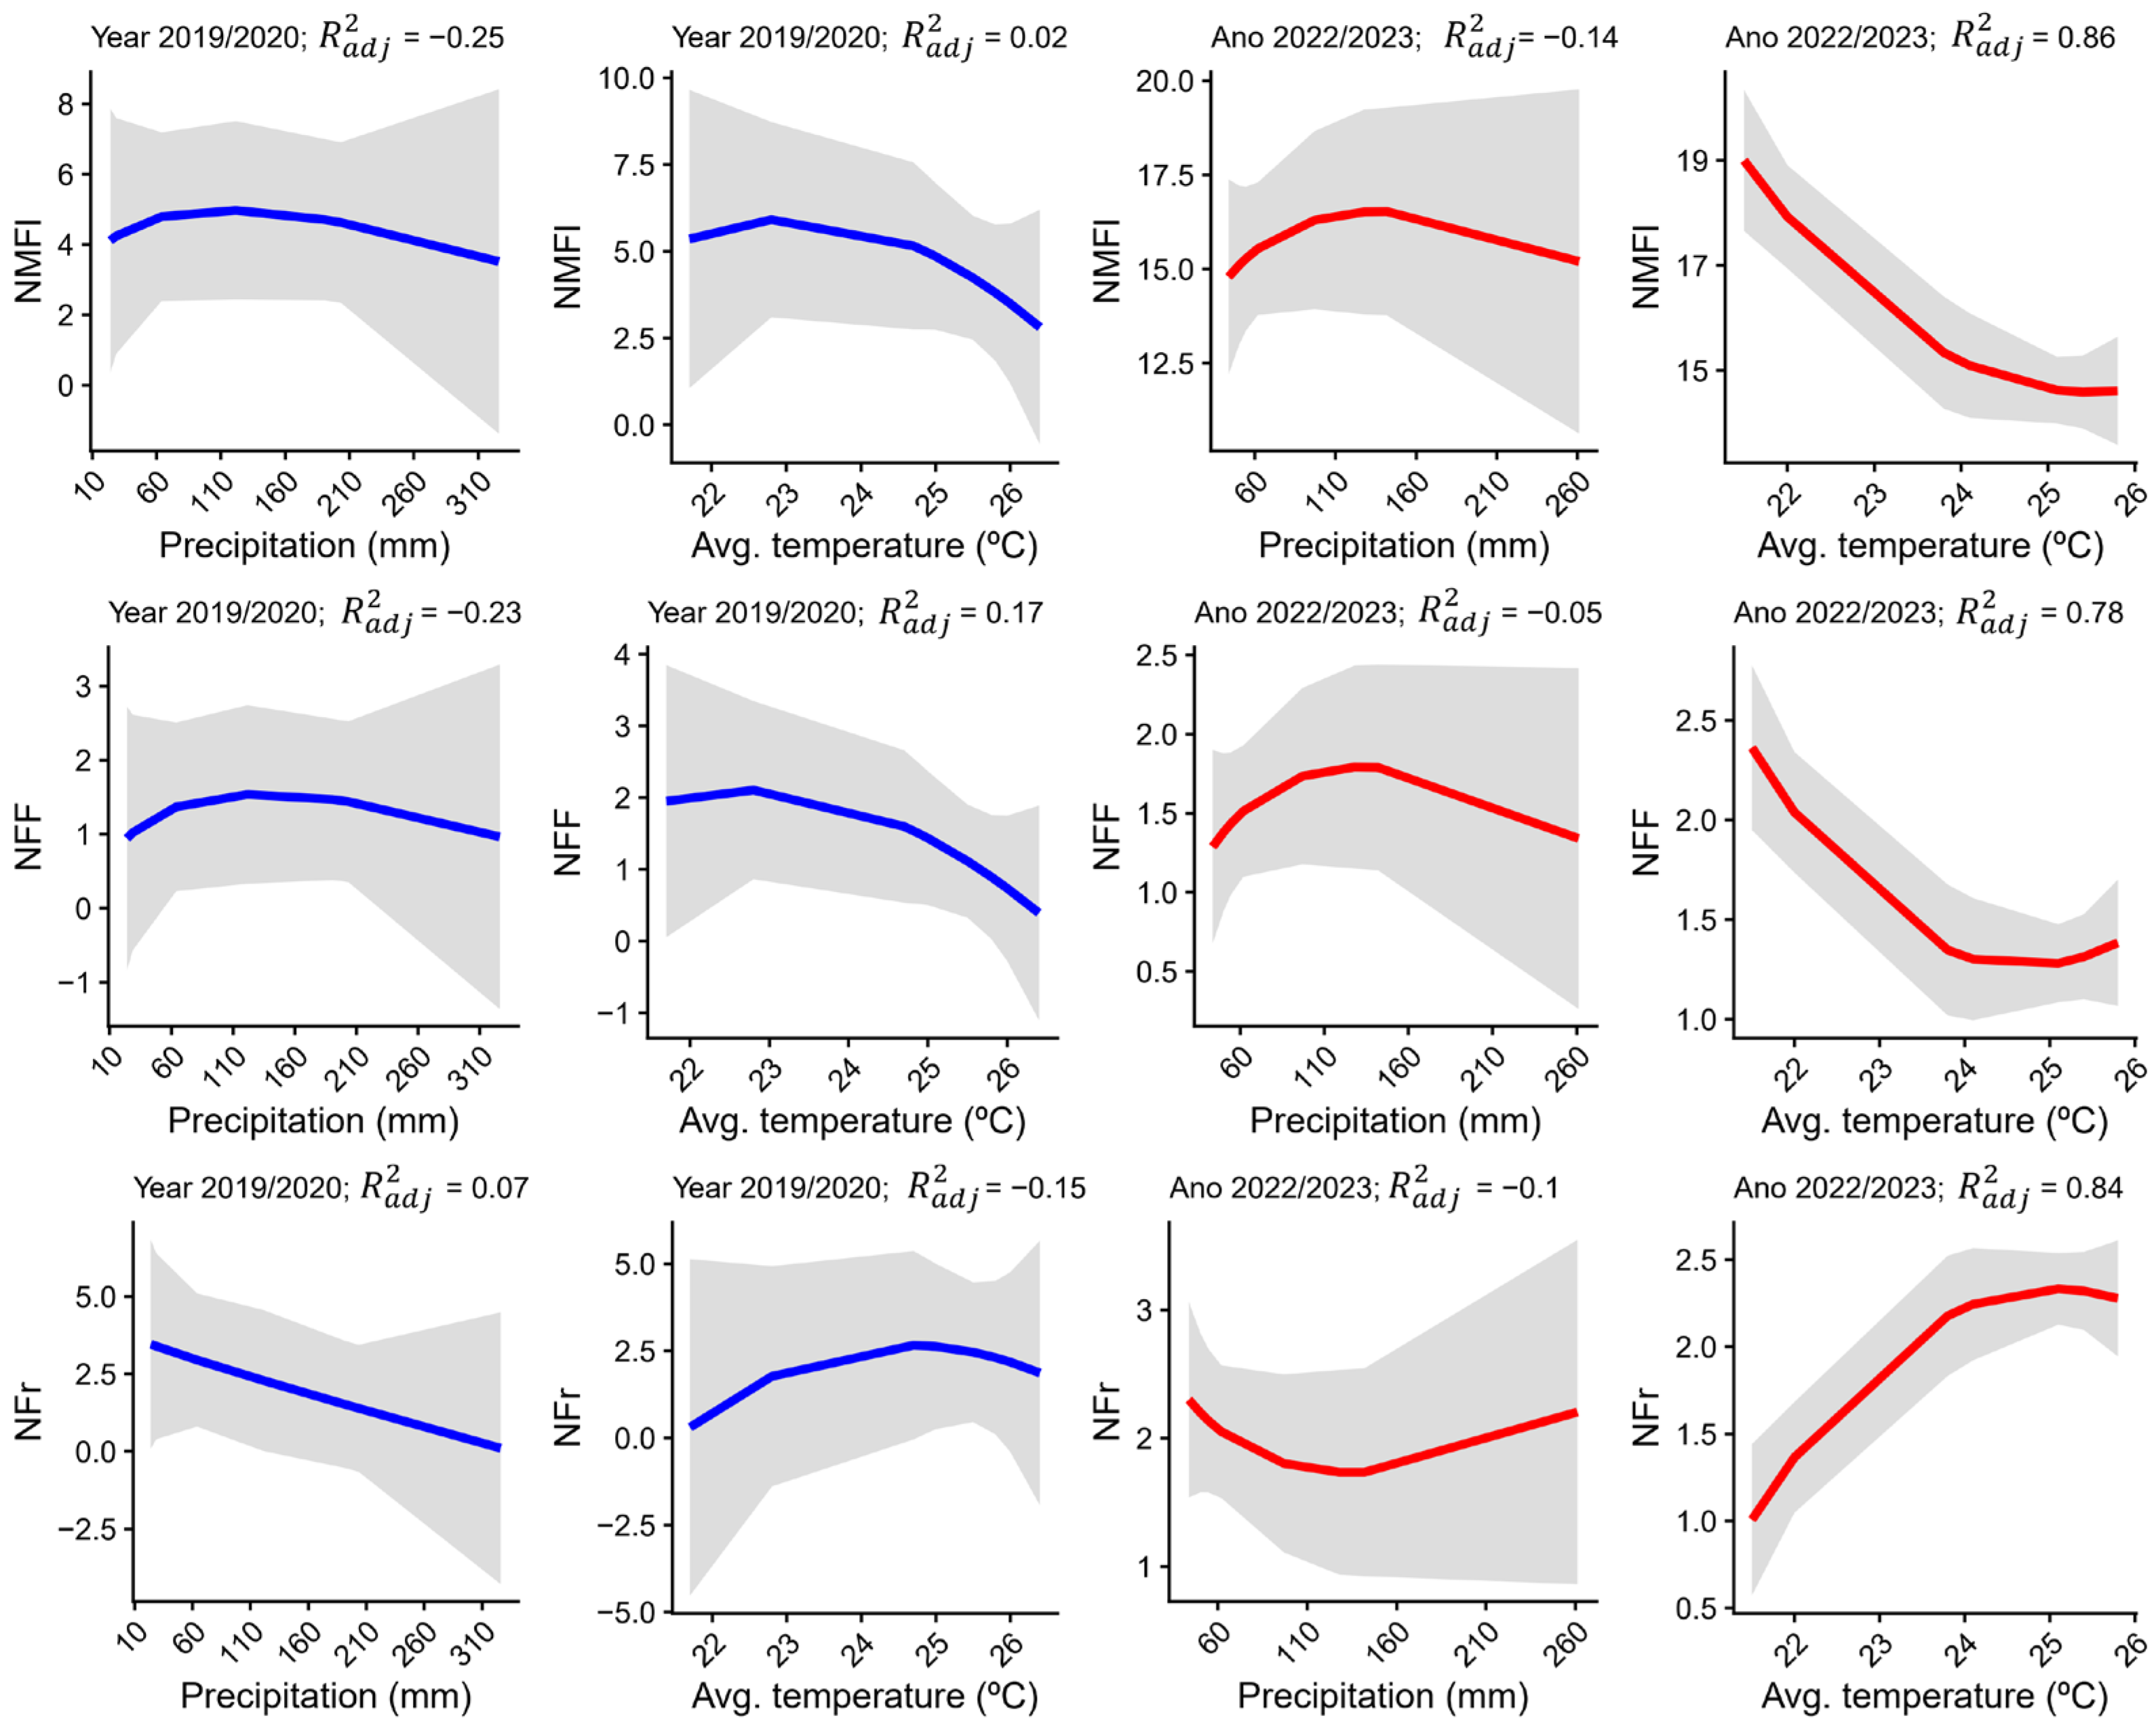
The relationships between flowering and fruiting ability and the climatic variables (rainfall and average temperature) during the experimental period are presented in Table S3 and Figure 3. The cubic regression analysis showed a strong fit (R2 between 0.78 and 0.86) for the average temperature variable in relation to the number of fruits, number of female flowers, and number of male flowers during the 2022/2023 growing season.
An increase in average temperature was associated with a decrease in flower production, especially in the 2022/2023 season, while fruit production increased. This can be explained by the fact that fruit harvest usually occurs 60 to 70 days after pollination, which coincides with the transition from winter to spring, a period when temperatures tend to rise. However, this trend was not observed in the 2019/2020 season, possibly because that year’s spring had higher maximum temperatures and lower cumulative rainfall compared to the 2022/2023 season (Figure 1), which likely had a significant negative impact on cassava flowering.
In general, average daily temperatures between 21.5 and 24 °C favored flower production. For other conditions, no significant relationship was observed between rainfall and flowering characteristics (Figure 3). This suggests that rainfall variation did not directly affect flower and fruit production. Its most direct effect may have been reducing the average environmental temperature, as seen in Figure 1.

3.5. Phenotypic Correlations Between Flowering/Fruiting Traits and Agronomic Attributes

The network constructed based on significant correlations between flowering/fruiting traits and agronomic attributes clearly distinguished between these two types of traits (Figure 4). Strong, significant correlations (indicated by the thicker green lines) were observed between flowering/fruiting traits and agronomic attributes, such as fresh root yield × above-ground yield, fresh root yield × plant height, and plant height × above-ground yield. In contrast, the relationships between flowering traits and agronomic traits were negative, though not significant, according to the regularized partial correlation network analysis.
To assess the influence of plant architecture on the correlations between traits, cassava genotypes were classified into three groups based on their architecture: erect (plants with no branching or branching above 1.60 m), intermediate (plants with erect type and branching between 1.20 and 1.60 m), and early-branched (plants with multiple forks and branches below 1.20 m) (Figure 5). This classification confirmed strong positive correlations (ranging from 0.59 to 0.96) between flowering and fruiting traits, with these correlations increasing in plants with more branching. Specifically, for intermediate plant architecture, the correlations ranged from 0.79 to 0.97, while for early-branched plants, they ranged from 0.75 to 0.96.
For erect genotypes, significant correlations were found between plant height and the number of female flowers, number of fruits, number of flowering months, weighted average score according to early flowering, and mean flowering score, ranging from −0.25 to −0.38, as well as between fresh root yield and the number of fruits (−0.26) (Figure 5). In intermediate and early-branched plants, the negative correlations between plant height and flowering traits were weaker, possibly because branching plants tend to have lower plant height.
In intermediate plant architecture, significant correlations were observed between number of stems per plant and the number of female flowers, and between above-ground yield and mean flowering score, weighted average score according to early flowering, and the number of female flowers (ranging from −0.21 to −0.15). In early-branched genotypes, correlations between flowering traits and leaf retention showed the opposite trend compared to plant height. Although these correlations were weak, the relationships between leaf retention and the number of male and female flowers, number of fruits, number of flowering months, weighted average score according to early flowering, and mean flowering score ranged from −0.18 to −0.28, indicating that increased flowering in early-branched genotypes tends to reduce leaf retention.
Variation in correlations was observed among agronomic traits such as fresh root yield × above-ground yield, plant height × fresh root yield, and plant height × above-ground yield based on plant architecture. Positive correlations of high magnitude between these traits decreased as plant architecture changed from erect to early-branched (Figure 5). The correlations between fresh root yield and above-ground yield were 0.82, 0.73, and 0.59 for erect, intermediate, and early-branched genotypes, respectively. For plant height × fresh root yield, these values were 0.61, 0.48, and 0.36, and for plant height × above-ground yield, they were 0.70, 0.68, and 0.48, respectively.
To consider the phenotypic correlations between agronomic traits, genotype groups were analyzed based on flowering status (flowering or non-flowering in at least one year of evaluation). Significant positive correlations were found for plant height × above-ground yield and fresh root yield × above-ground yield in both groups (Figure 6). The correlations between plant height and above-ground yield were 0.73 and 0.62 for non-flowering and flowering genotypes, respectively. The correlations for fresh root yield × above-ground yield were similar for both groups (0.71 and 0.73).
For the correlation between plant height and leaf retention in non-flowering plants, the correlation coefficient was 0.32, whereas for flowering genotypes, it decreased to 0.22. For plant height × fresh root yield, a similar trend was observed: in non-flowering plants, the correlation coefficient was 0.57, while for flowering genotypes, it decreased to 0.47. The correlation between leaf retention and above-ground yield was positive but weak, with values of 0.31 for non-flowering genotypes and 0.28 for flowering genotypes. Several low-magnitude positive correlations were found only in the flowering genotypes, including plant height × dry matter content (0.23), leaf retention × fresh root yield (0.19), above-ground yield × dry matter content (0.25), and fresh root yield × dry matter content (0.14).

3.6. Discriminant Analysis of Principal Components (DAPC) for Flowering/Fruiting Traits and Agronomic Attributes

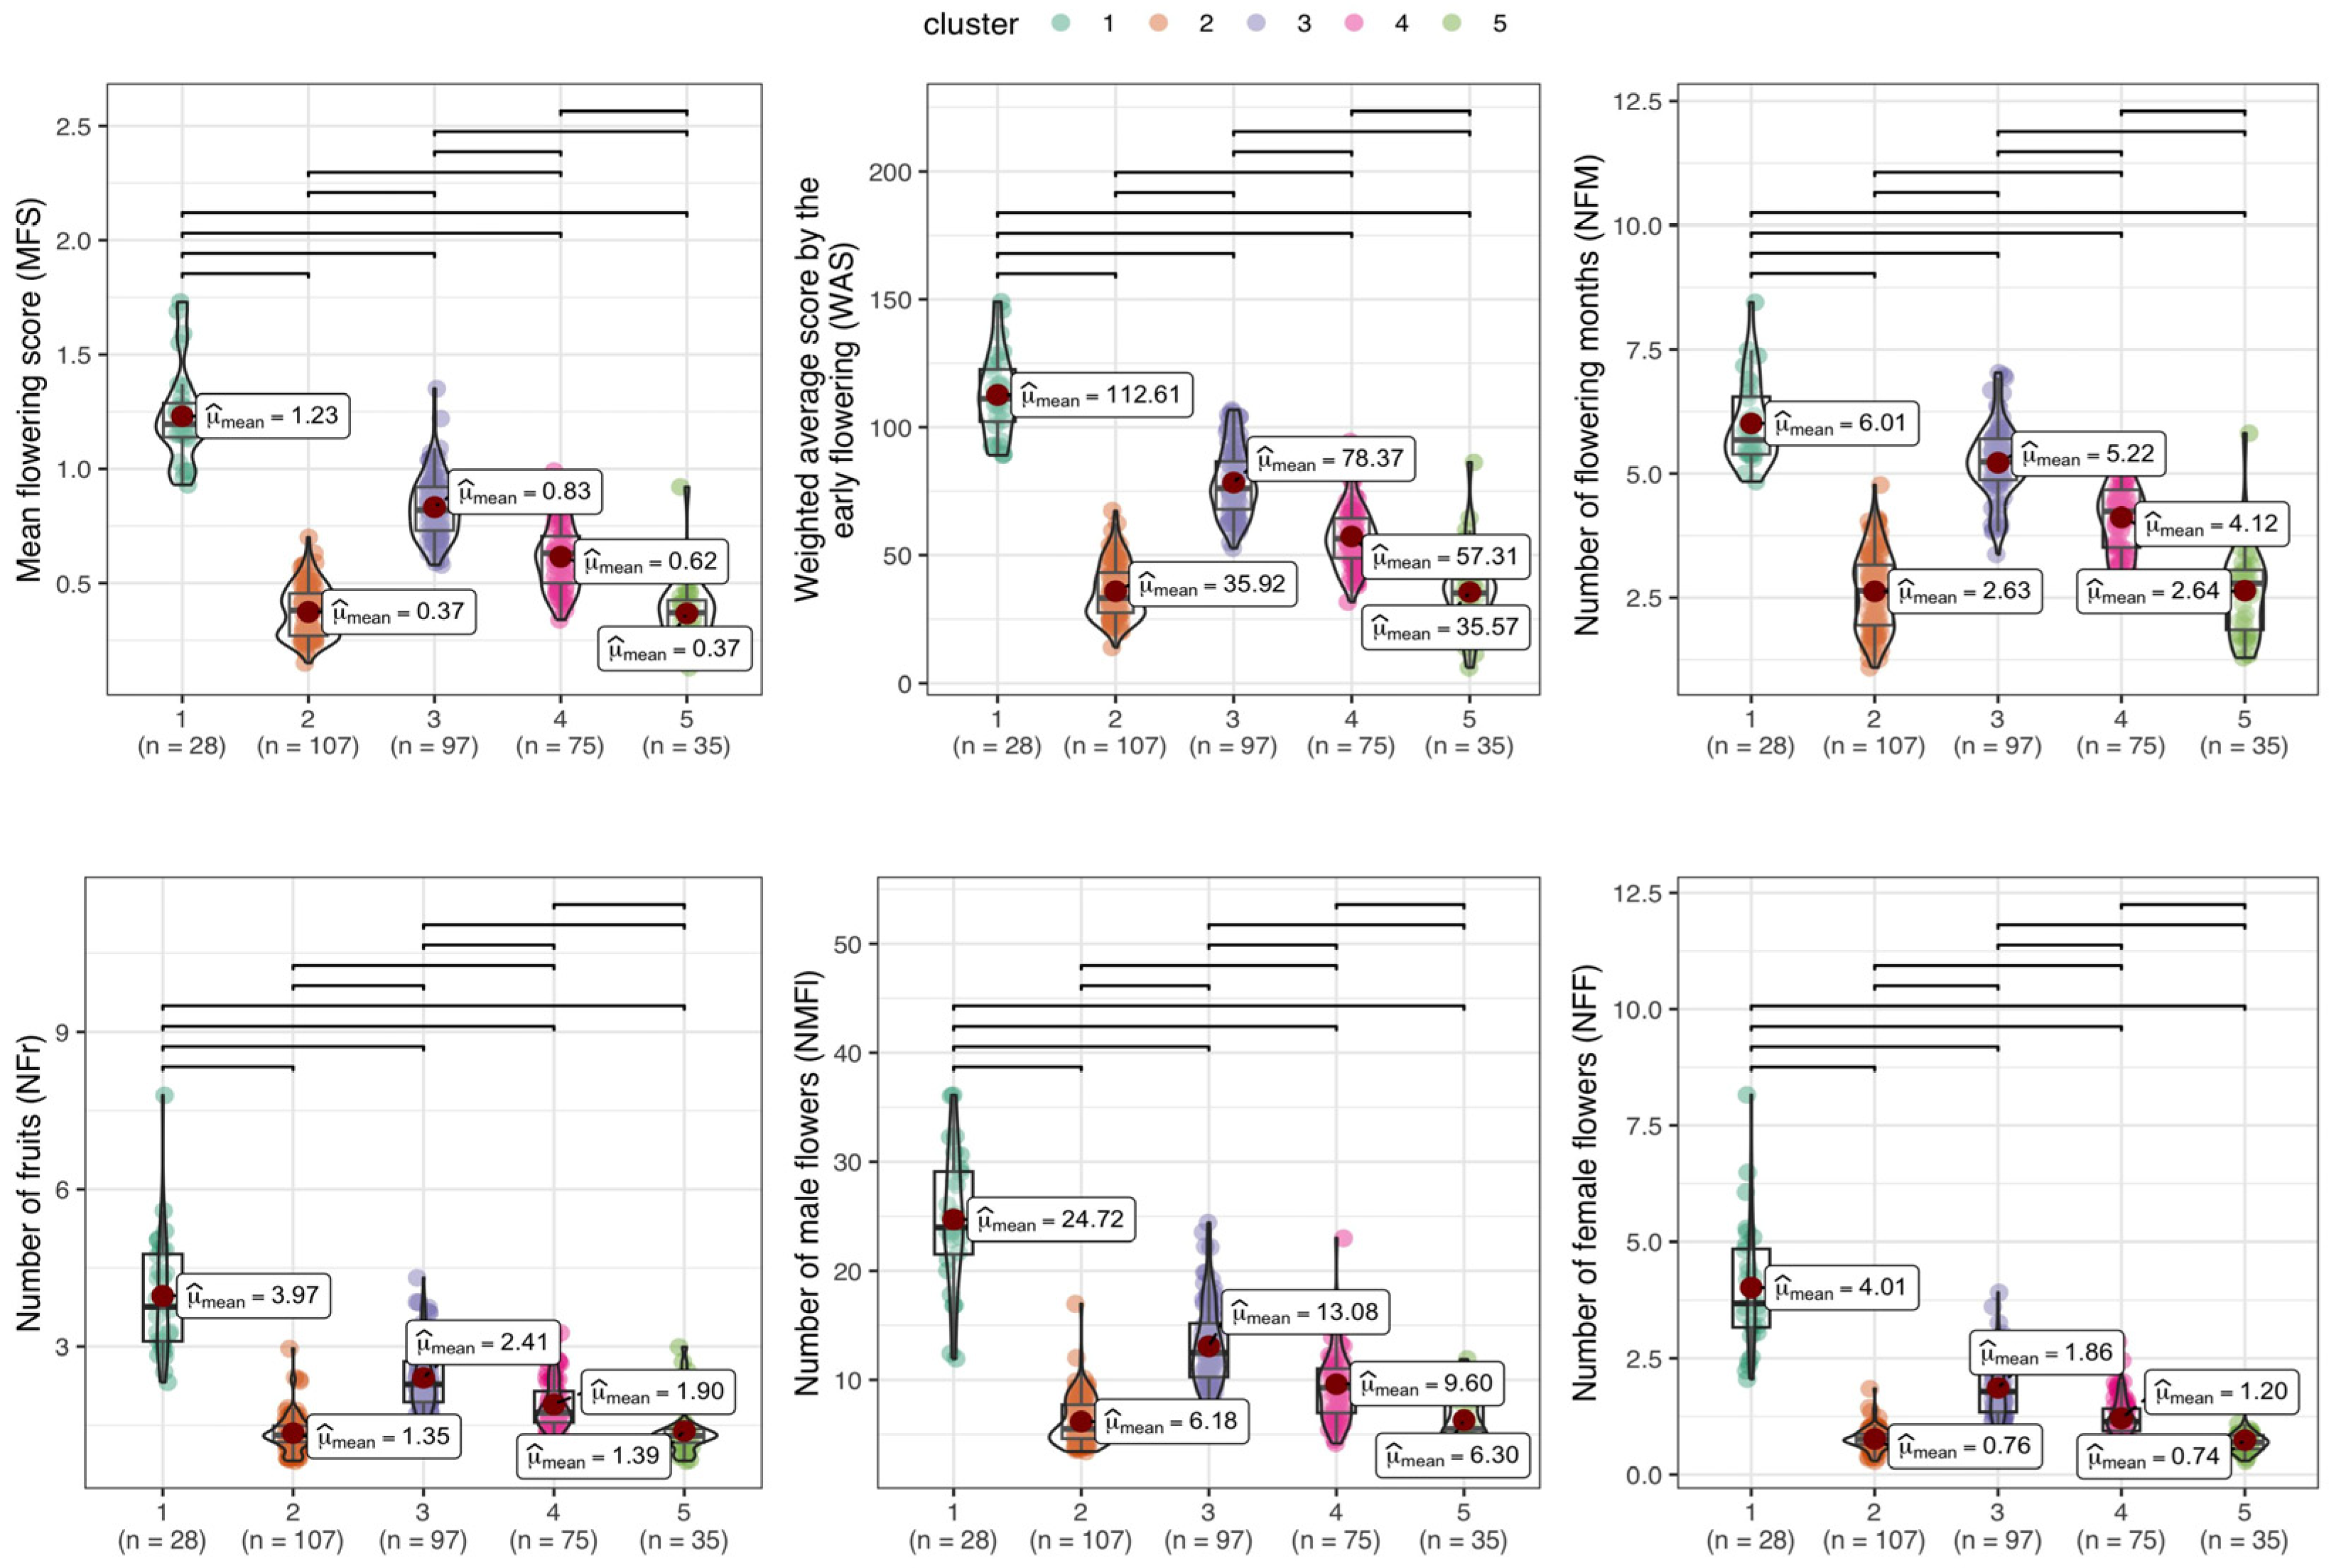
DAPC was performed using phenotypic data for flowering/fruiting and agronomic traits. The cassava genotypes were grouped into five distinct clusters (Figure 7). In general, the main characteristics of Group 1 (28 genotypes) included higher flowering scores (average = 1.23), early flowering (average = 112.61), and higher production of fruits and male and female flowers (averages = 3.97, 24.72, and 4.01, respectively) (Figure 8). Group 2 (107 genotypes) exhibited lower flowering scores (average = 0.37) and a stronger tendency for late flowering (average = 35.92), intermediate fruit production (average = 1.35), low female flower production (average = 0.76), and intermediate male flower production (average = 6.18). Groups 3 (97 genotypes) and 4 (75 genotypes) contained genotypes with similar flowering characteristics, showing intermediate mean flowering score (average = 0.62), neither early nor late flowering, and intermediate numbers of male and female flowers (averages = 9.60 and 1.20, respectively). Group 5 (35 genotypes) included genotypes with low flowering scores (average = 0.62), late flowering (average = 57.31), low fruit production (average = 1.39), intermediate male flower production (average = 6.3), and low female flower production (average = 1.20) compared to other groups.
Regarding agronomic traits (Figure 9), genotypes from Groups 1, 2, and 3 generally showed similar performance in traits such as plant height, number of stems per plant, fresh root yield, above-ground yield, and dry matter content. On the other hand, genotypes from Groups 4 and 5 exhibited higher values for plant height, number of stems per plant, fresh root yield, and above-ground yield. For dry matter content, no significant differences were observed between the average values of the five groups.
In addition to the DAPC-based grouping, we assessed the influence of flowering ability on agronomic traits by classifying the cassava genotypes into two distinct categories: Group A—genotypes with no flowering across both years of evaluation, and Group B—genotypes that flowered in at least one year of evaluation (Figure 10). Based on this classification alone, there were no significant differences between the mean values of the agronomic traits evaluated in the two groups. However, several genotypes in Group B, despite having an erect growth habit or taller branching, showed some level of flowering and fruit production, indicating that not all clones with this type of plant architecture fail to flower.

4. Discussion

4.1. Genetic Variability and Stability for Flowering and Fruiting Traits in Cassava Germplasm

The variability in flowering-related traits in cassava should be more thoroughly explored in breeding programs to optimize the development of segregating populations. This can be achieved by increasing the number of individuals produced per progeny, either through controlled crosses or natural pollination. Currently, the limited number of seeds produced per progeny restricts selection and genetic gains, particularly given the low recombination in smaller populations. Furthermore, understanding the variation in flowering in cassava can help synchronize crosses [13], especially for parents with high breeding value.
This study observed substantial variation in flowering traits. In Experiment 1 (2019/2020), the average variation in the number of female flowers per plant across different months of evaluation ranged from 0.5 to 3.4, and from 0.9 to 2.6 in Experiment 2. In contrast, the average variation in male flowers in Experiments 1 and 2 ranged from 1.5 to 9.9 and from 10.1 to 19.0, respectively. Baguma et al. [30], in a study with 20 cassava genotypes (10 with early flowering and 10 with late flowering) evaluated over two years up to 12 months after planting (MAPs), reported variation from 0.0 to 0.9 for female flowers in early-flowering genotypes and from 0.0 to 0.7 in late-flowering genotypes. In another study, Ibrahim et al. [12] investigated flower production in six elite genotypes at four branching levels, reporting variation from 0.26 to 168.33 for male flowers and from 0.0 to 16.52 for female flowers, based on the average flower production across genotypes for each branching level.
Flowering onset varied between the two experiments, indicating differences in the timing and intensity of reproductive development. In Experiment 1, peak flower and fruit production occurred as early as the 4th MAP, suggesting that flowering had likely begun before this time point. In contrast, Experiment 2 showed a later flowering pattern, with the highest fruit production observed in the 9th MAP, and lower flower counts recorded in earlier months. These findings suggest that the study may not have fully captured the earliest stages of flowering. To address this, future studies are encouraged to begin phenological observations as early as the 2nd MAP to more accurately monitor the complete flowering dynamics and their association with fruit set in cassava.
The variation observed in flowering and fruiting among genotypes in different studies can be explained by a combination of factors such as genetic differences (different genotypes and genetic diversity), evaluation periods, climatic and environmental conditions (e.g., soil type and agricultural management), different evaluation methodologies (differences in sample sizes), and genotype–environment interaction (G × E). The small number of genotypes evaluated in other studies contrasts with the large number evaluated in the present study. However, the smaller sample sizes in those studies may have limited the observation of flowering and fruiting variation in the species.
In a similar study, Souza et al. [18] also found wide genetic variability for flowering and fruiting in cassava germplasm across different cultivation months. These authors reported that in the first few months of evaluation, only a few genotypes produced flowers. From the 3rd to the 5th month after planting (MAP), 33% of genotypes flowered, and from the 6th MAP, 40% produced flowers and fruits abundantly. From the 7th to the 9th MAP, 14% of genotypes flowered with low flowering intensity. From the 10th to the 12th MAP, only 4% of genotypes flowered.
In terms of variances, our study found that although genetic variance was significant for both years of evaluation, residual variance was higher and of greater magnitude for all flowering and fruiting traits. This suggests that, in addition to genetic factors controlling the expression of flowering and fruiting in these genotypes, other unknown factors, such as environmental and climatic conditions, may also be influencing the phenotypic expression of these traits, which cannot be solely attributed to genetic effects.
Du et al. [31] evaluated the G × E interaction for flowering-related traits in two maize populations over two years and across different locations. They found that both genotypic variance and environmental variance were significant (<0.001), suggesting genetic differences for these traits and indicating that, in addition to the genetic effects, environmental factors were also playing a role. Similarly, Navas-Lopez et al. [32] studied the genetic and environmental influences on the flowering period of olive trees in four distinct agro-climatic conditions in Andalusia, Southern Spain. A large portion of the variability in phenological flowering parameters was attributed to environmental influences. However, for flowering quality parameters, most of the variability was of genetic origin. For all traits, the G × A interaction was significant, and most genotypes showed low stability across the traits evaluated.
Studies on the G × E interaction for flowering traits in cassava are crucial for enhancing genetic improvement efforts, particularly in selecting progeny for crossing blocks. Identifying genotypes that exhibit greater flowering stability across different environments can help in choosing parental lines that will produce progeny with desirable traits, optimizing breeding strategies. In our study, 76% of the 87 genotypes that flowered in both experimental years showed high stability, flowering early in both years. These genotypes, which possess desirable agronomic traits, have great potential for use in crossing blocks while maintaining flowering synchronization. Genotypes such as BGM-0006, BGM-0440, BGM-0030, BGM-0047, BGM-0498, BGM-0052, BGM-0507, BGM-0076, BGM-0087, BGM-0089, BGM-0536, BGM-0560, BGM-0609, BGM-0661, BGM-0893, BGM-0945, BGM-0959, BGM-0967, BGM-1511, BGM-1604, BGM-1606, BGM-1675, BGM-2047, and others exhibited this desirable behavior consistently throughout the evaluations.

4.2. Influence of Climatic and Environmental Factors on Flower and Fruit Production

A major challenge in cassava breeding is the limited knowledge about the environmental and climatic conditions that favor flowering and fruiting. Information on the conditions that trigger flowering is essential to ensure the success of breeding programs, allowing for the selection of optimal planting times to maximize successful seed production [33]. With cassava being grown across a wide range of climates, and considering the impact of global climate variations, research institutions must continue to evaluate cassava germplasm to identify factors influencing reproductive success and pinpoint accessions less susceptible to environmental changes [8].
This study found differences between the two experimental periods in terms of flower and fruit production, and regarding the climatic variables such as precipitation and average temperature. This variation in flowering and fruiting intensity across genotypes during each period can be attributed to both the genetic factors of the genotypes and the environmental/climatic influences of each period, which together impacted floral phenology. Specifically, 24% of the genotypes evaluated showed inconsistent flowering—flowering in one year but not the other—indicating that factors other than climatic variables, such as nutrient availability, intra-plot competition, and pest or disease pressure, also influenced flowering and fruiting variation [17,18,34].
In terms of flowering patterns, the peak occurred early during spring in both years. However, in Experiment 1, a significant reduction in flower production was observed by the 5th MAP (coinciding with the end of spring), with flowering increasing again in late autumn as daily temperatures dropped. In Experiment 2, flower production declined more gradually from the start of the evaluation, remaining steady throughout the experiment. This difference between experiments may be explained by the fact that the early months of Experiment 2 coincided with the winter/spring period when temperatures were lower. Higher temperatures (25 to 29 °C) and rainfall between 100 mm and 200 mm were associated with reduced flowering and fruiting. Conversely, periods with average temperatures between 22 and 24 °C were more favorable for flower and fruit production.
For fruit production, periods with rainfall above 120 mm and temperatures exceeding 29 °C led to higher rates of abortion, reducing fruit production. These findings support previous studies indicating that high temperatures (30 to 34 °C) can lead to flower abortion and reduced seed formation [8]. Adeyemo et al. [17] reported that cassava varieties had reduced flowering at temperatures between 31 and 34 °C, while performing better in temperatures between 22 and 25 °C. Additionally, Souza et al. [18] noted that cassava genotypes exhibited increased flowering under higher temperatures (~25 °C) during certain times of the year. According to Souza [25], the ideal temperature range for cassava flowering is around 24 °C, although it is influenced by genetic factors and other climatic variables. The photoperiod also appears to play a role in regulating genes associated with floral expression in cassava, promoting or inhibiting flowering depending on the genotype [17]. Santos et al. [34] observed differences in flowering among 35 cassava genotypes across six planting periods, with early flowering occurring during the dry season, while planting at the end of the rainy season resulted in reduced flowering. The authors further demonstrated that temperature and accumulated degree days are correlated with increased flowering in cassava, reinforcing the notion that climatic variables affect cassava flowering and fruiting performance. Proper planning of planting periods and locations can help maximize seed production.
The lack of correlation between flowering/fruiting and climatic variation in Experiment 1, compared to Experiment 2, can be explained by several factors, including differences in genotype sensitivity to climatic factors, as well as variations in the intensity and patterns of climatic variation between the two years. It is possible that the genotypes in Experiment 2 exhibited greater sensitivity to climatic variables, or that differences in flowering patterns were due to the distinct genotypes across the two trials.
Other studies on different plant species highlight how flowering stability can vary significantly due to environmental factors such as temperature, photoperiod, and precipitation. Genotypes may respond differently to the same environmental conditions, which could explain the observed variations between the years in the present study [35]. Additionally, Tun et al. [36] reported the importance of interactions between temperature and photoperiod in altering flowering timing, while Xu et al. [37] demonstrated that genetic differences can lead to distinct responses to climate across different years or locations on Brassica napus.

4.3. Correlation Between Flowering/Fruiting Traits and Agronomic Yield Attributes

Previous studies have examined the relationship between flowering and yield-related traits in various plant species, with different results depending on the crop. In grain-producing crops like beans [19] and chickpeas [20], the quantity of flowers produced is directly linked to grain yield and quality, emphasizing the importance of flowering for reproductive success in these crops. However, in crops like sugarcane, flowering has been shown to negatively affect yield. It can reduce the quality and quantity of sugar in the stem, increase fiber formation, and complicate agricultural management [38].
In cassava, several studies have explored correlations between agronomic traits, irrigation responses, and harvest timing effects on yield attributes [21,39]. Other research has focused on the relationship between morphological and physiological traits and yield [23]. These studies highlight that improving root yield and quality is a key objective of cassava breeding programs. However, there have been no reports on the influence of flowering-related traits on agronomic performance and root quality, particularly regarding whether genotypes with more branching and higher flowering rates are more productive than those of more-erect types, which might have higher photosynthetic capacity. Our study addresses this gap and is the first to explore this potential connection in cassava. By investigating whether traits like the number of flowers and branching patterns are linked to agronomic performance, we aimed to understand how flowering could impact root yield and quality. This research could have important implications for cassava breeding, as it may help identify genotypes that, despite having high flowering rates, also demonstrate desirable traits for high root yield and quality.
In general, correlation studies between flowering/fruiting traits and agronomic attributes revealed a clear separation among cassava genotypes based on these traits, showing no significant correlations between flowering and yield variables. However, as expected, flowering/fruiting traits were closely related, indicated by positive correlations with moderate-to-high magnitude (ranging from 0.59 to 0.96). These correlations were particularly strong in genotypes with more branching (early-branched), supporting the idea that cassava flowering is directly correlated with stem branching [13,15]. The timing and level of branching influence flower availability and fertility, with Ibrahim et al. [12] noting variation in the timing of stem branching among genotypes and recommending different planting dates to synchronize flowering.
Regarding agronomic and root quality traits, significant but weak correlations (ranging from −0.38 to −0.15) with flowering and fruiting traits were found, depending on plant architecture. For instance, in erect genotypes, plant height showed negative correlations with the number of female flowers, number of fruits, number of male flowers, weighted average score according to early flowering, and average flowering score (ranging from −0.25 to −0.38). Fresh root yield also showed a negative correlation with the number of fruits (−0.26). These negative correlations suggest that plants with more branching tend to be shorter. Additionally, a higher number of branches corresponds to a higher number of flowers, but more flowers meant reduced leaf retention (leaf retention × number of female and male flowers, number of fruits, number of flowering months, weighted average score according to early flowering, and mean flowering score, ranging from −0.18 to −0.28). However, it is important to note that these correlations, while significant, are of low magnitude.
Some significant correlations between agronomic attributes also varied with plant architecture. As plant architecture ranged from erect to intermediate to early-branched, the correlations between certain traits decreased. For example, the fresh root yield × above-ground yield correlation was 0.82, 0.73, and 0.59 for erect, intermediate, and early-branched plants, respectively. Similarly, that of plant height × fresh root yield was 0.61, 0.48, and 0.36, respectively, and that of plant height × above-ground yield was 0.70, 0.68, and 0.48, respectively. These patterns suggest that plant architecture can influence harvest indices, with more erect plants tending to have more consistent responses in terms of fresh root yield and above-ground yield. Taller plants also tended to show stronger correlations with root and above-ground yield, indicating that cassava plant architecture contributes to differences in plant architecture and biomass distribution. Taller, more erect plants tend to have stronger correlations with yield traits like fresh root yield and above-ground yield.
In general, taller plants produce more above-ground yield, which may correlate with higher fresh root yield due to the larger leaf area available for photosynthesis, thus providing more energy for root growth. Rós et al. [40] found that the cultivar IAC 14, which reaches heights of up to 272 cm, also produced a good fresh root yield. They also reported that two cultivars (Espeto and Fécula Branca) produced lower above-ground yield, with most plants in these varieties characterized by fewer branches and lower plant height. These authors noted that highly early-branched cassava genotypes might have lower root yields due to reduced planting space, as they require more area for branch development and photosynthesis [40].
Vieira et al. [41] reported a significant but weak correlation between plant height and above-ground yield (r = 0.22), suggesting that taller plants have more biomass due to a greater mass of stems and leaves [42,43]. However, genetic and environmental factors such as water and nutrient availability can affect the relationships between root yield, above-ground yield, and plant height [23].
Based on the correlations between agronomic traits and cassava flowering, we found that all correlations between agronomic attributes were more evident in plants that did not flower. This suggests that plants that do not flower may allocate more nutrients to root development.

4.4. Phenotypic Similarity in Flowering, Fruiting, and Agronomic Traits

DAPC was used to identify phenotypic similarity patterns among cassava genotypes based on flowering, fruiting, and agronomic traits. This analysis classified the germplasm into five distinct groups, which can help optimize hybridization management in breeding fields. By organizing genotypes into these groups, the breeding process becomes more efficient, facilitating the generation of new progenies for the development of improved varieties [15]. Once desirable traits are identified and high-value breeding parents are selected, genotypes can be planted at different times to synchronize their peak flowering periods. This synchronization maximizes the success of hybridization [18]. Understanding the genetic structure of cassava genotypes allows breeding programs to refine their selection processes, enabling more-precise controlled crosses and reducing the time and resources needed to develop superior varieties.
This study provides valuable insights into flowering patterns among genotypes. For example, Group 1 showed the highest capacity for flower and fruit production, while Groups 2 and 5 exhibited lower flowering and fruiting potential. Additionally, genotypes in Groups 1 and 2 tended to flower earlier, whereas those in Groups 4 and 5 had later flowering periods. A similar study by Souza et al. [18] classified cassava germplasm into seven groups based on flowering and fruiting traits. Their findings identified early-flowering genotypes (8.5% of accessions), those with abundant flowering (0.6%), and those with reduced flowering (54%).
Based on the results of this study, future research should focus on the 28 genotypes classified in Group 1, as they demonstrated superior flowering and fruiting performance. These genotypes also flowered earlier than those in other groups. However, it is important to note that elite breeding genotypes were also found in other groups. Since these elite genotypes show low flowering ability, strategies may be needed to stimulate flower production, such as specialized flowering induction techniques. Ibrahim et al. [12] recommend using growth regulators, extending the photoperiod, selecting optimal planting locations for flowering, and adjusting planting schedules to ensure that plants reach peak physiological vigor during favorable flowering periods (e.g., spring). Similarly, Baguma et al. [30] reported that a combination of regulated light exposure (RLE), plant growth regulators (PGRs), and pruning can significantly enhance cassava flower production.
Regarding agronomic traits, significant differences were observed among the groups for all evaluated characteristics. These differences are crucial for selecting genotypes with specific agronomic advantages, such as improved leaf retention, higher root yield, increased biomass production, and favorable plant height and branching patterns. The study identified groups with both similar and more distinct distributions of agronomic traits, particularly Groups 1, 4, and 5. Group 1 was characterized by shorter plants (~190 cm), fewer stems per plant (~1.55), lower plant vigor scores (3.39), lower fresh root yield (20.31 t/ha), and lower above-ground yield production (18.32 t/ha). In contrast, Groups 4 and 5 included genotypes with taller plants (207.37 cm and 217.88 cm, respectively), a higher number of stems per plant (1.62 and 1.63, respectively), lower plant vigor scores (3.32 and 3.00, respectively), greater leaf retention capacity (1.27 and 1.54, respectively), and higher fresh root yield (25.19 t/ha and 26.49 t/ha, respectively), as well as higher above-ground yield production (22.38 t/ha and 26.49 t/ha, respectively).

4.5. Future Perspectives for Cassava Breeding Based on Flowering and Fruiting Traits

The findings of this study provide a solid foundation for incorporating flowering and fruiting traits into cassava breeding strategies. One key future direction is the utilization of early and consistently flowering genotypes to accelerate genetic gains by enabling more efficient and timely hybridization schemes. The identification of genotypes exhibiting high flowering synchrony and resilience to environmental variability supports the development of crossing blocks that remain productive across different seasons and growing conditions.
Future research would greatly benefit from the integration of advanced molecular and genetic approaches to unravel the genetic architecture underlying flowering and fruiting traits. Techniques such as genome-wide association studies (GWAS) and quantitative trait loci (QTL) mapping can facilitate the discovery of key loci and alleles associated with reproductive development. GWAS, in particular, has been successfully applied in cassava to pinpoint genomic regions linked to critical agronomic and developmental traits [44,45,46]. These approaches leverage natural genetic variation to identify candidate genes and regulatory regions, providing a robust framework for understanding the polygenic control of reproductive traits. The insights gained can inform the development of molecular markers for use in marker-assisted selection and genomic selection, thus accelerating breeding progress.
Another promising avenue is the adoption of high-throughput phenotyping platforms to monitor flowering dynamics with greater precision across temporal and spatial scales. Technologies such as drone-based multispectral imaging and automated flowering detection using deep learning algorithms are being refined to reduce labor intensity and enhance the accuracy of phenological assessments [47]. When integrated with detailed environmental characterization and crop modeling, these innovations can deepen our understanding of genotype × environment × management (G × E × M) interactions affecting reproductive traits in cassava.
Lastly, in the context of ongoing climate change, breeding efforts should prioritize the identification of genotypes exhibiting both plasticity and stability in flowering behavior. Such genotypes can mitigate the effects of erratic weather patterns, ensuring consistent sexual reproduction for breeding programs. Targeted breeding for thermal and photoperiodic adaptability in cassava flowering will be essential to preserve and expand genetic diversity through true seed production across diverse agroecological zones.

5. Conclusions

The cassava germplasm exhibited significant variation in flowering and fruiting characteristics across the evaluation years and locations, influenced by both genetic and environmental factors. The interaction between these factors was also substantial, indicating that breeding strategies should not only focus on selecting genotypes with strong performance across different environmental conditions but also develop specific agronomic practices to optimize flowering and fruiting in various environments.
The analysis of climatic variables (temperature and precipitation) showed that during Experiment 2, flowering was influenced by changes in average temperature, while fruiting was affected by both average temperature and, indirectly, precipitation. Therefore, when establishing crossing fields, these factors should be considered to synchronize the plants’ maximum physiological vigor with the most suitable seasons for flower production, optimizing progeny generation.
The classification of cassava germplasm into five distinct groups based on flowering/fruiting and agronomic traits provides valuable insights for conservation studies and the use of these genetic resources in breeding programs. Genotypes in Group 1 demonstrated high performance in flowering and fruiting over the 12-month period after planting, with earlier flowering. Several genotypes with high stability for flowering and early blooming were identified, including: BGM-0006, BGM-0440, BGM-0030, BGM-0047, BGM-0498, BGM-0052, BGM-0507, BGM-0076, BGM-0087, BGM-0089, BGM-0536, BGM-0560, BGM-0609, BGM-0661, BGM-0893, BGM-0945, BGM-0959, BGM-0967, BGM-1511, BGM-1604, BGM-1606, BGM-1675, and BGM-2047. These and other genotypes exhibiting these traits can be selected as parent plants for crossing blocks to maintain synchronized flowering. No significant or strong correlations were found between flowering/fruiting traits and agronomic attributes in cassava.

Supplementary Materials

The following supporting information can be downloaded at: https://www.mdpi.com/article/10.3390/horticulturae11060648/s1. Table S1. Flowering stability of 87 cassava genotypes evaluated in two growing years (2019 and 2022). Table S2. Flowering characteristics of cassava genotypes evaluated in only one assessment year. Table S3. Cubic regression analysis of female flower count (NFF), male flower count (NFM), and fruit count (NFr) in relation to climatic variables (precipitation and mean temperature) across two experimental periods (2019/2020 and 2022/2023).

Author Contributions

L.d.S.G.: conceptualization, data curation, formal analysis, writing—original draft; M.B.e.S.: methodology, writing—review and editing; E.J.d.O.: conceptualization, project administration, funding acquisition, supervision, writing—review and editing. All authors have read and agreed to the published version of the manuscript.

Funding

Luana da Silva Guedes: CAPES (Coordenação de Aperfeiçoamento de Pessoa de Nivel Superior), grant number: 28022017003P8. Massaine Bandeira e Sousa: Empresa Brasileira de Pesquisa Agropecuária, grant number: 20.18.01.012.00.00. Eder Jorge de Oliveira: CNPq (Conselho Nacional de Desenvolvimento Científico e Tecnológico), grant number: 310980/2021-6 and 402422/2023-6; FAPESB (Fundação de Amparo à Pesquisa do Estado da Bahia), grant number: Pronem 15/2014. This work was partially funded by the UK’s Foreign, Commonwealth & Development Office (FCDO) and the Bill & Melinda Gates Foundation, grant INV-007637. Under the grant conditions of the Foundation, a Creative Commons Attribution 4.0 Generic License has already been assigned to the Author Accepted Manuscript version that might arise from this submission. The funder provided support in the form of fellowship and funds for the research but did not have any additional role in the study design, data collection and analysis, decision to publish, nor preparation of the manuscript.

Data Availability Statement

The raw data supporting the conclusions of this article will be made available by the authors on request.

Acknowledgments

The authors express their sincere gratitude to all the Embrapa staff who contributed to the management of the field trials.

Conflicts of Interest

The authors declare that the research was conducted in the absence of any commercial or financial relationships that could be construed as a potential conflict of interest.

References

  1. Allem, A.C. The Origins and Taxonomy of Cassava. In Cassava: Biology, Production and Utilization; Hillocks, R.J., Thresh, J.M., Eds.; CABI Books; CABI Publishing: Wallingford, UK, 2001; pp. 1–16. [Google Scholar] [CrossRef]
  2. Halsey, M.E.; Olsen, K.M.; Taylor, N.J.; Chavarriaga-Aguirre, P. Reproductive Biology of Cassava (Manihot Esculenta Crantz) and Isolation of Experimental Field Trials. Crop Sci. 2008, 48, 49–58. [Google Scholar] [CrossRef]
  3. Ceballos, H.; Okogbenin, E.; Pérez, J.C.; López-Valle, L.A.B.; Debouck, D. Cassava. In Root and Tuber Crops; Bradshaw, J.E., Ed.; Springer: New York, NY, USA, 2010; pp. 53–96. [Google Scholar] [CrossRef]
  4. Tonukari, N.J. Cassava and the Future of Starch. Electron. J. Biotechnol. 2004, 7, 5–8. [Google Scholar] [CrossRef]
  5. Dankwa, K.O.; Peprah, B.B. Industrialization of Cassava Sector in Ghana: Progress and the Role of Developing High Starch Cassava Varieties. Ghana J. Agric. Sci. 2019, 54, 79–85. [Google Scholar] [CrossRef]
  6. Egesi, C.N.; Ilona, P.; Ogbe, F.O.; Akoroda, M.; Dixon, A. Genetic Variation and Genotype × Environment Interaction for Yield and Other Agronomic Traits in Cassava in Nigeria. Agron. J. 2007, 99, 1137–1142. [Google Scholar] [CrossRef]
  7. Bayata, A. Review on Nutritional Value of Cassava for Use as a Staple Food. Sci. J. Anal. Chem. 2019, 7, 83–91. [Google Scholar] [CrossRef]
  8. Sousa, M.B.E.; de Andrade, L.R.B.; de Souza, E.H.; Alves, A.A.C.; de Oliveira, E.J. Reproductive Barriers in Cassava: Factors and Implications for Genetic Improvement. PLoS ONE 2021, 16, e0260576. [Google Scholar] [CrossRef]
  9. FAOSTAT. Food and Agriculture Organization of the United Nations. Participation of Continents in Cassava Production in 2021. Available online: https://www.fao.org/faostat/en/#data/QCL/visualize (accessed on 28 August 2022).
  10. IBGE. Levantamento Sistemático da Produção Agrícola. Instituto Brasileiro de Geografia e Estatística. Available online: https://www.ibge.gov.br/estatisticas/economicas/agricultura-e-pecuaria/9201-levantamento-sistematico-da-producao-agricola.html (accessed on 14 February 2025).
  11. Ramos Abril, L.N.; Pineda, L.M.; Wasek, I.; Wedzony, M.; Ceballos, H. Reproductive Biology in Cassava: Stigma Receptivity and Pollen Tube Growth. Commun. Integr. Biol. 2019, 12, 96–111. [Google Scholar] [CrossRef]
  12. Ibrahim, Y.; Baguma, Y.; Abincha, W.; Gibson, P.; Edema, R.; Bisikwa, J. Flowering Problems and Their Possible Solution in Cassava Breeding. J. Sci. Agric. 2020, 4, 83–89. [Google Scholar] [CrossRef]
  13. Ceballos, H.; Davrieux, F.; Talsma, E.F.; Belalcazar, J.; Chavarriaga, P.; Andersson, M.S.; Ceballos, H.; Davrieux, F.; Talsma, E.F.; Belalcazar, J.; et al. Carotenoids in Cassava Roots. In Carotenoids; Cvetkovic, D.J., Nikolic, G.S., Eds.; IntechOpen: London, UK, 2017. [Google Scholar] [CrossRef]
  14. Alves, A.A.C. Cassava Botany and Physiology. In Cassava: Biology, Production and Utilization; Hillocks, R.J., Thresh, J.M., Eds.; CABI Books; CABI Books: London, UK, 2001; pp. 67–89. [Google Scholar] [CrossRef]
  15. Souza, L.S.; Diniz, R.P.; de Jesus Neves, R.; Alves, A.A.C.; de Oliveira, E.J. Grafting as a Strategy to Increase Flowering of Cassava. Sci. Hortic. 2018, 240, 544–551. [Google Scholar] [CrossRef]
  16. Ceballos, H.; Luna, J.; Escobar, A.F.; Ortiz, D.; Pérez, J.C.; Sánchez, T.; Pachón, H.; Dufour, D. Spatial Distribution of Dry Matter in Yellow Fleshed Cassava Roots and Its Influence on Carotenoid Retention upon Boiling. Food Res. Int. 2012, 45, 52–59. [Google Scholar] [CrossRef]
  17. Adeyemo, O.S.; Hyde, P.T.; Setter, T.L. Identification of FT Family Genes That Respond to Photoperiod, Temperature and Genotype in Relation to Flowering in Cassava (Manihot Esculenta, Crantz). Plant Reprod. 2019, 32, 181–191. [Google Scholar] [CrossRef] [PubMed]
  18. Souza, L.S.; Alves, A.A.C.; de Oliveira, E.J. Phenological Diversity of Flowering and Fruiting in Cassava Germplasm. Sci. Hortic. 2020, 265, 109253. [Google Scholar] [CrossRef]
  19. Didonet, A.D. Importância do período de pré-floração na produtividade do feijoeiro. Pesqui. Agropecuária Trop. 2010, 40, 505–512. [Google Scholar] [CrossRef]
  20. Mallikarjuna, B.P.; Viswanatha, K.P.; Samineni, S.; Gaur, P.M. Association of Flowering Time with Phenological and Productivity Traits in Chickpea. Euphytica 2019, 215, 77. [Google Scholar] [CrossRef]
  21. de Souza, M.J.L.; Viana, A.E.S.; Matsumoto, S.N.; de Vasconcelos, R.C.; Sediyama, T.; Morais, O.M. Características agronômicas da mandioca relacionadas à interação entre irrigação, épocas de colheita e cloreto de mepiquat. Acta Sci. Agron. 2010, 32, 45–53. [Google Scholar] [CrossRef]
  22. Rosario-Arellano, J.L.D.; Meneses-Márquez, I.; Leyva-Ovalle, O.R.; Aguilar-Rivera, N.; Bolio-López, G.I.; Andrés-Meza, P. Morphoagronomic and Industrial Performance of Cassava (Manihot Esculenta Crantz) Germplasm for the Production of Starch and Solid Byproducts. AIMS Agric. Food 2020, 5, 617–634. [Google Scholar] [CrossRef]
  23. Amarullah. Morphological, Physiological and Agronomic Characteristics of Cassava Superior Variety of Coastal Land. IOP Conf. Ser. Earth Environ. Sci. 2021, 748, 012030. [Google Scholar] [CrossRef]
  24. Carvalho, R.R.B.; Bandeira ESousa, M.; de Oliveira, L.A.; de Oliveira, E.J. Phenotypic Diversity and Selection in Biofortified Cassava Germplasm for Yield and Quality Root Traits. Euphytica Neth. J. Plant Breed. 2022, 218, 173. [Google Scholar] [CrossRef] [PubMed]
  25. Souza, L.d.S.; Farias, A.R.N.; Mattos, P.L.P.d.; Fukuda, W.M.G. Livro Aspectos Socioeconomicos e Agronomicos da Mandioca; Embrapa Mandioca e Fruticultura: Cruz das Almas, Brazil, 2006; Volume 1. [Google Scholar]
  26. Kawano, K.; Fukuda, W.; Cenpukdee, U. Genetic and Environmental Effects on Dry Matter Content of Cassava Root. Crop Sci. 1987, 27, 69–74. [Google Scholar] [CrossRef]
  27. Bates, D.; Mächler, M.; Bolker, B.; Walker, S. Fitting Linear Mixed-Effects Models Using Lme4. J. Stat. Softw. 2015, 67, 1–48. [Google Scholar] [CrossRef]
  28. R Core Team. R: A Language and Environment for Statistical Computing. Available online: https://www.r-project.org/ (accessed on 28 August 2023).
  29. Jombart, T.; Devillard, S.; Balloux, F. Discriminant Analysis of Principal Components: A New Method for the Analysis of Genetically Structured Populations. BMC Genet. 2010, 11, 94. [Google Scholar] [CrossRef]
  30. Baguma, J.K.; Mukasa, S.B.; Nuwamanya, E.; Alicai, T.; Omongo, C.; Hyde, P.T.; Setter, T.L.; Ochwo-Ssemakula, M.; Esuma, W.; Kanaabi, M.; et al. Flowering and Fruit-Set in Cassava under Extended Red-Light Photoperiod Supplemented with Plant-Growth Regulators and Pruning. BMC Plant Biol. 2023, 23, 335. [Google Scholar] [CrossRef] [PubMed]
  31. Du, L.; Zhang, H.; Xin, W.; Ma, K.; Du, D.; Yu, C.; Liu, Y. Dissecting the Genetic Basis of Flowering Time and Height Related-Traits Using Two Doubled Haploid Populations in Maize. Plants 2021, 10, 1585. [Google Scholar] [CrossRef]
  32. Navas-Lopez, J.F.; León, L.; Rapoport, H.F.; Moreno-Alías, I.; Lorite, I.J.; de la Rosa, R. Genotype, Environment and Their Interaction Effects on Olive Tree Flowering Phenology and Flower Quality. Euphytica 2019, 215, 184. [Google Scholar] [CrossRef]
  33. Zeng, Q.; Zhao, Z.-H.; Zhao, S.-Q. Signal pathways of flowering time regulation in plant. Hereditas 2006, 28, 1031–1036. [Google Scholar] [PubMed]
  34. Santos, A.D.; Bandeira e Sousa, M.; Alves, A.A.C.; Oliveira, E.J.D. Environmental Factors Influence the Production of Flowers and Fruits of Cassava. Sci. Hortic. 2024, 323, 112498. [Google Scholar] [CrossRef]
  35. Lee, Z.; Kim, S.; Choi, S.J.; Joung, E.; Kwon, M.; Park, H.J.; Shim, J.S. Regulation of Flowering Time by Environmental Factors in Plants. Plants 2023, 12, 3680. [Google Scholar] [CrossRef]
  36. Tun, W.; Yoon, J.; Jeon, J.-S.; An, G. Influence of Climate Change on Flowering Time. J. Plant Biol. 2021, 64, 193–203. [Google Scholar] [CrossRef]
  37. Xu, Y.; Kong, X.; Guo, Y.; Wang, R.; Yao, X.; Chen, X.; Yan, T.; Wu, D.; Lu, Y.; Dong, J.; et al. Structural Variations and Environmental Specificities of Flowering Time-Related Genes in Brassica Napus. Theor. Appl. Genet. 2023, 136, 42. [Google Scholar] [CrossRef]
  38. Araldi, R.; Silva, F.M.L.; Ono, E.O.; Rodrigues, J.D. Florescimento em cana-de-açúcar. Ciênc. Rural 2010, 40, 694–702. [Google Scholar] [CrossRef]
  39. Lessa, L.S.; da Silva Ledo, C.A.; da Silva Santos, V. Effect of Harvesting Times on Agronomic Characteristics of Industrial Cassava Genotypes. Rev. Bras. Ciênc. Agrár. 2019, 14, e5647. [Google Scholar] [CrossRef]
  40. Rós, A.B.; Hirata, A.C.S.; Araújo, H.S.d.; Narita, N. Crescimento, fenologia e produtividade de cultivares de mandioca. Pesqui. Agropecuária Trop. 2011, 41, 552–558. [Google Scholar] [CrossRef]
  41. Vieira, E.A.; Fialho, J.d.F.; Carvalho, L.J.C.B. Correlação fenotípica entre caracteres agronômicos em população segregante de mandioca de mesa. Rev. Ceres 2014, 61, 523–529. [Google Scholar] [CrossRef]
  42. Cach, N.T.; Lenis, J.I.; Perez, J.C.; Morante, N.; Calle, F.; Ceballos, H. Inheritance of Useful Traits in Cassava Grown in Subhumid Conditions. Plant Breed. 2006, 125, 177–182. [Google Scholar] [CrossRef]
  43. Gomes, C.N.; Carvalho, S.P.d.; Jesus, A.M.S.; Custódio, T.N. Caracterização morfoagronômica e coeficientes de trilha de caracteres componentes da produção em mandioca. Pesqui. Agropecuária Bras. 2007, 42, 1121–1130. [Google Scholar] [CrossRef]
  44. Esuma, W.; Herselman, L.; Labuschagne, M.; Ramu, P.; Lu, F.; Baguma, Y.; Buckler, E.; Kawuki, R. Genome-Wide Association Mapping of Provitamin A Carotenoid Content in Cassava. Euphytica 2016, 212, 97–110. [Google Scholar] [CrossRef]
  45. Santos, C.S.D.; Sousa, M.B.; Brito, A.C.; de Oliveira, L.A.; Carvalho, C.W.P.; de Oliveira, E.J. Genome-Wide Association Study of Cassava Starch Paste Properties. PLoS ONE 2022, 17, e0262888. [Google Scholar] [CrossRef]
  46. Ogbonna, A.C.; Braatz de Andrade, L.R.; Mueller, L.A.; de Oliveira, E.J.; Bauchet, G.J. Comprehensive Genotyping of a Brazilian Cassava (Manihot Esculenta Crantz) Germplasm Bank: Insights into Diversification and Domestication. Theor. Appl. Genet. 2021, 134, 1343–1362. [Google Scholar] [CrossRef]
  47. Araus, J.L.; Kefauver, S.C.; Zaman-Allah, M.; Olsen, M.S.; Cairns, J.E. Translating High-Throughput Phenotyping into Genetic Gain. Trends Plant Sci. 2018, 23, 451–466. [Google Scholar] [CrossRef]
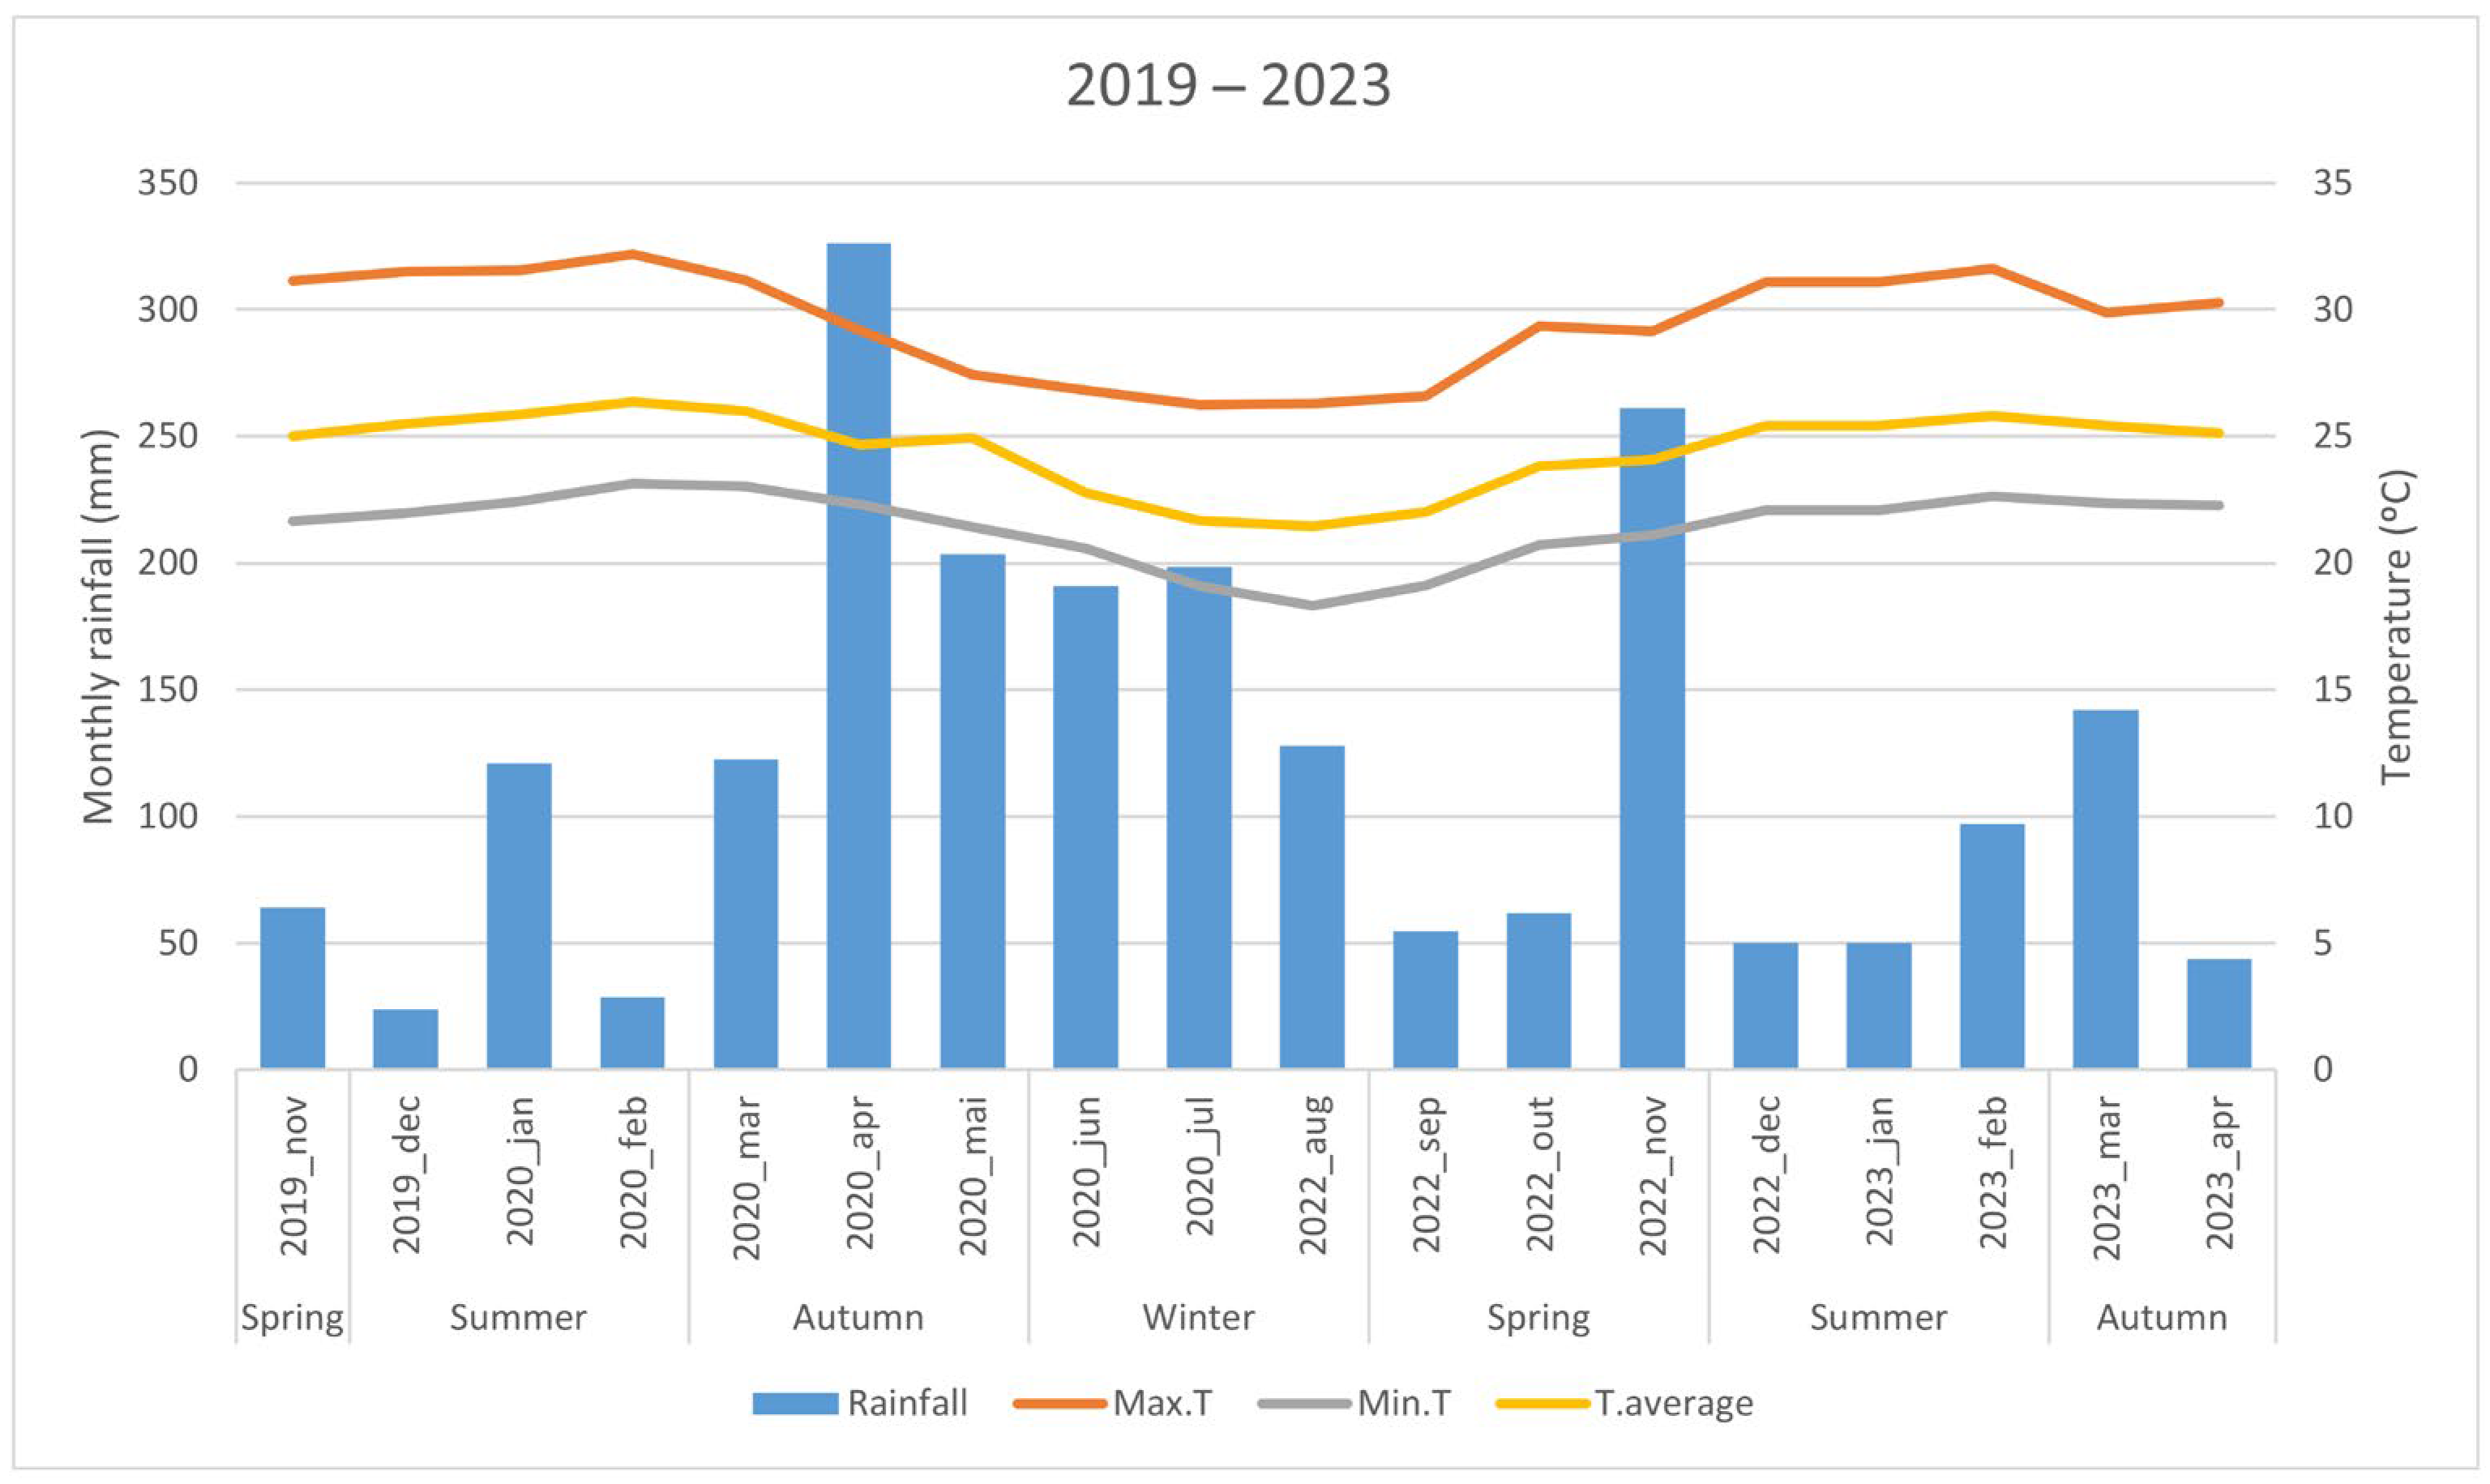
Figure 1. Monthly rainfall (mm) and maximum, minimum, and average temperature recorded during the evaluation period of cassava germplasm trials for flowering traits, from November 2019 to April 2023 in Cruz das Almas, BA, Brazil.
Horticulturae 11 00648 g001
Figure 2. Average flower and fruit production in cassava from the 4th to the 12th month after planting (MAP), including NMFl (number of male flowers), NFF (number of female flowers), and NFr (number of fruits), evaluated in cassava germplasm during the 2019/2020 (November 2019 to July 2020) and 2022/2023 (August 2022 to April 2023) growing seasons.
Horticulturae 11 00648 g002
Figure 3. Cubic regression of climatic variables (precipitation and average temperature) for the number of female flowers (NFF), number of male flowers (NMFl), and number of fruits (NFr) in both experiments (2019/2020 and 2022/2023). The blue line represents the cubic regression for 2019/2020, the red line represents the cubic regression for 2022/2023, and the gray area represents the confidence interval of the regression.
Horticulturae 11 00648 g003
Figure 4. Regularized partial correlation network between flowering/fruiting traits and agronomic attributes in cassava genotypes. The thickness of the lines represents the strength of the correlations, while the green and red colors indicate positive and negative correlations, respectively. NMFl: number of male flowers; NFF: number of female flowers; NFr: number of fruits; MSF: mean flowering score; WAS: weighted average score according to early flowering; NFM: number of flowering months; PlHe: plant height; DMC: dry matter content; NSP: number of stems; ShY: above-ground yield; PlArc: plant architecture; FRY: fresh root yield; LeRet: leaf retention.
Horticulturae 11 00648 g004
Figure 5. Phenotypic correlations by Spearman method for erect, intermediate, and early-branched cassava genotypes across flowering/fruiting traits and agronomic attributes. NMFl: number of male flowers; NFF: number of female flowers; NFr: number of fruits; MSF: mean flowering score; WAS: weighted average score according to early flowering; NFM: number of flowering months; PlHe: plant height; DMC: dry matter content; NSP: number of stems; ShY: above-ground yield; FRY: fresh root yield; LeRet: leaf retention. The × symbol indicates non-significant correlations based on the t-test at a 5% probability level.
Horticulturae 11 00648 g005
Figure 6. Phenotypic correlations between agronomic traits in cassava germplasm according to the Spearman method, considering the classification of genotypes as flowering or non-flowering. PlHe: plant height; DMC: dry matter content; NSP: number of stems; ShY: above-ground yield; PlArc: plant architecture; FRY: fresh root yield; LeRet: leaf retention. The × symbol indicates non-significant correlations based on the t-test at a 5% probability level.
Horticulturae 11 00648 g006
Figure 7. Discriminant analysis of principal components (DAPC) of cassava genotypes based on phenotypic data for flowering/fruiting traits, agronomic attributes, and root quality traits. The cassava genotypes were grouped into five distinct clusters. The proximity between groups in the graph indicates the level of similarity based on the analyzed traits.
Horticulturae 11 00648 g007
Figure 8. Boxplot graphs of the five genotype groups formed by discriminant analysis of principal components (DAPC), considering the qualitative and quantitative traits of flowering and fruiting. Mean flowering score (MFS), weighted average score according to early flowering (WAS), number of flowering months (NFM), number of fruits (NFr), number of male flowers (NMFl), number of female flowers (NFF). The horizontal lines indicate statistically significant differences (p ≤ 0.05) according to the Holm-adjusted test.
Horticulturae 11 00648 g008
Figure 9. Boxplot graphs for the five genotype groups formed by discriminant analysis of principal components (DAPC), considering the agronomic traits of cassava genotypes. Plant height (PlHe); number of stems (NSP); plant architecture (PlArc); leaf retention (LeRet); fresh root yield (FRY); above-ground yield (ShY); dry matter content (DMC). The cassava genotypes were grouped into five distinct clusters. The horizontal lines indicate statistically significant differences (p ≤ 0.05) according to the Holm-adjusted test.
Horticulturae 11 00648 g009
Figure 10. Boxplot graphs for two groups of cassava genotypes (Group A—genotypes with no flowering across both years of evaluation; Group B—genotypes that flowered in at least one year of evaluation), considering the agronomic traits of cassava genotypes. Plant height (PlHe); number of stems (NSP); plant architecture (PlArc); leaf retention (LeRet); fresh root yield (FRY); above-ground yield (ShY); dry matter content (DMC). Holm-adjusted p-values at a 5% probability level.
Horticulturae 11 00648 g010
Table 1. Analysis of individual and combined deviance and broad-sense heritability (H2) for the quantitative traits evaluated: number of fruits per plant (NFr), number of male flowers per plant (NMFl), and number of female flowers per plant (NFF) across two environments (CNPMF—2019/2020 and UFRB—2022/2023), considering monthly assessments from the 4th to the 12th month after planting (MAP).
Components of VarianceDFNFrNMFlNFF
Experiment 1 (2019/2020)Genotypes (G) (r)18.01 *62.43 *4.88 *
MAP (f)81820.88 *2419.20 *409.62 *
Block (f)1323.95243.4128.75
Error116.9571.1911.09
H2 0.320.470.31
Average 1.894.161.33
Experiment 2 (2022/2023)Genotypes (G) (r)15.22 *251.69 *3.02 *
MAP (f)8350.52 *4405.47 *155.02 *
Block (f)1427.612259.9325.03
Error18.0412.116.99
H2 0.320.260.17
Average 2.0715.181.51
Combined analysisGenotypes (G) (r)12.70 *83.22 *2.41 *
Environment (E) (f)12.34 ns34,823.76 *22.46 ns
Interaction G × E (r)112.95 *7317.42 *2.39 *
MAP (f)8352.96 *3836.49 *376.23 *
Block (f)1434.161225.5916.79
Error113.56274.798.92
H2 0.270.020.59
Average 2.010.571.43
DF: degrees of freedom; (r) random effects; (f) fixed effects; ns,* not-significant and significant at 5% probability level according to the F-test for fixed effects and the LRT test for random effects.
Table 2. Analysis of individual and combined deviance and broad-sense heritability (H2) for the qualitative flowering traits: mean flowering score (MFS), weighted average score according to early flowering (WAS), and number of flowering months (NFM) across two environments (CNPMF—2019/2020 and UFRB—2022/2023), based on monthly assessments from the 4th to the 12th month after planting (MAP).
Components of VarianceDFMFSWASNFM
Experiment 1 (2019/2020)Genotypes (G) (r)10.15 *1267.68 *4.09 *
Block (f)130.241840.733.02
Error 0.201280.153.14
H2 0.430.500.57
Average 0.3835.392.00
Experiment 2 (2022/2023)Genotypes (G) (r)10.16 *1706.15 *4.06 *
Block (f)140.475797.6315.33
Error 0.151455.745.45
H2 0.520.540.43
Average 0.8076.15.32
Combined analysisGenotypes (G) (r)10.17 *1400.82 *4.01 *
Environment (E) (f)115.23 *155,612.5 *978.48 *
Interaction G × E (r)10.02 ns2455.6 ns0.01 ns
Block (f)140.384756.5418.39
Error 0.171460.394.55
H2 0.970.520.96
Average 0.6259.073.93
GL: degrees of freedom; (r) random effects; (f) fixed effects; ns,* not-significant and significant at the 5% probability level according to the F-test for fixed effects and the LRT test for random effects, respectively.
Disclaimer/Publisher’s Note: The statements, opinions and data contained in all publications are solely those of the individual author(s) and contributor(s) and not of MDPI and/or the editor(s). MDPI and/or the editor(s) disclaim responsibility for any injury to people or property resulting from any ideas, methods, instructions or products referred to in the content.