Article

Comparative Study on Aquaponic and Hydroponic Systems for Sustainable Hemp Production in a Controlled Environment

1
Environmental Science Program, University of Idaho, Boise, ID 83702, USA
2
Department of Soil and Water Systems, University of Idaho, Boise, ID 83702, USA
3
Department of Nuclear Engineering and Industrial Management, University of Idaho, Idaho Falls, ID 83402, USA
*
Author to whom correspondence should be addressed.
Horticulturae 2025, 11(6), 588; https://doi.org/10.3390/horticulturae11060588
Submission received: 15 April 2025 / Revised: 16 May 2025 / Accepted: 17 May 2025 / Published: 26 May 2025
(This article belongs to the Section Protected Culture)

Abstract

:
Optimizing nutrient usage and controlling environmental parameters are crucial for improved crop growth and yield in the cultivation of Cannabis sativa, commonly known as hemp, using controlled-environment agriculture (CEA) systems. Although hemp cultivation in CEA is rapidly growing, the effects of different light-intensity treatments on early vegetative stages of hemp grown in hydroponic and aquaponic systems, along with the impacts on the environment and human health remains limited. This study employed a split-plot design, consisting of two layers of plant grow beds where each layer was exposed to different light intensities (LIs): approximately 752 µmol/m2/s (high light intensity) on the upper layer and 141 µmol/m2/s (low light intensity) on the lower layer. To assess the influence of two different LIs on plant growth indicators, specifically plant length and leaf area, the environmental parameters, including dissolved oxygen (DO), electrical conductivity (EC), pH, and water temperature (WT) were maintained within the same range for both systems. Additionally, the study incorporated a cradle-to-gate life cycle assessment (LCA) to precisely evaluate the environmental performance of both systems. Under the specific environmental and design conditions of this study, hemp plants grown in aquaponics showed greater growth performance in plant length compared to hydroponics (more than 42% higher for both LIs) and leaf area (28.3% greater under 141 µmol/m2/s), although the leaf area was 2.1% lower under 752 µmol/m2/s compared to plants grown in hydroponics. The LCA demonstrated that the aquaponic system provided an efficient and sustainable approach by integrating fish with hemp cultivation. The LCA results showed that aquaponics had a 22% reduction in midpoint and a 15% reduction in endpoint impact in contrast to the hydroponics system for hemp leaf cultivation. This research highlights the potential of aquaponic systems as a viable and sustainable alternative to hydroponic systems for hemp leaf cultivation in CEA under uncertain future climates.

Graphical Abstract

1. Introduction

Cannabis sativa, commonly known as “hemp”, contains 0.3% or less of tetrahydrocannabinol (THC) and is widely recognized for its significant medical uses [1,2,3,4,5]. Cannabis sativa includes significant medicinal potential due to its abundant range of secondary metabolites, comprising more than 100 known cannabinoids, such as THC, cannabidiol (CBD), and cannabigerol, in addition to terpenes and flavonoids [6,7,8]. CBD has demonstrated efficacy in reducing seizures in individuals with epilepsy, particularly in cases of genetic juvenile epilepsy, such as Lennox-Gastaut and Dravet syndromes [9], whereas THC provides pain relief for those with fibromyalgia and neuropathic diseases [10,11,12]. Additionally, the medicinal usefulness of the decarboxylated forms of Δ9-tetrahydrocannbinolic acid and cannabidiolic acid is increasingly acknowledged, as they act as general symptom suppressors and exhibit antibacterial characteristics [13,14,15]. The growing recognition of C. sativa’s therapeutic value and significant economic potential emphasizes the increasing importance of its production, which has contributed to a USD 35 billion industry in 2022, potentially raising the global industry value to USD 80 billion by 2026 [1].
The implementation of diverse regulatory frameworks for cannabis uses and cultivation reflects a paradigm shift in societal attitudes and legislation [16]. In the United States, a significant turning point was the reclassification of hemp, which refers to cannabis with a THC content of less than 0.3% when measured by weight without moisture. This reclassification resulted in pilot programs at the state level for hemp cultivation, as authorized by the 2014 Agricultural Act [17]. In 2018, the Farm Bill removed hemp from the list of Schedule I drug classifications after a 45-year ban, allowing its production to be legal in the USA [2]. This change in classification helped to acknowledge the potential therapeutic benefits of hemp, especially in treating intractable pediatric epilepsy. As a result, the FDA approved Epidiolex in 2018, which is the first drug based on CBD to treat this condition [2,18]. In 2021, Idaho passed the Industrial Hemp Research and Development Act (House Bill 126), thereby becoming the 50th state in the United States to legalize industrial hemp. The act allows for the production and commercialization of hemp that contains a maximum of 0.3% THC [19].
With the legalization of cannabis, numerous cultivators have transitioned towards controlled environment agriculture (CEA), such as greenhouses and indoor settings, for medical and scientific objectives [20]. This transition has resulted in the creation of advanced indoor facilities, such as hydroponics and aquaponics, that are equipped with automated systems for lighting, ventilation, and irrigation [21,22]. These facilities allow for year-round production of large quantities of high-quality, uniform plant material [23]. The CEA system includes advanced approaches such as the nutrient film technique (NFT) and drip fertigation, using rockwool and peat substrates [20,24,25,26,27,28]. Among many types of soilless cultivation systems, aquaponics has garnered significant scientific and commercial interest [29]. This system combines fish farming with plant cultivation by using fish waste and nitrifying bacteria to nourish plants in a closed-loop ecosystem. It reduces the dependence on fertilizers and pesticides while generating both plant material and fish [30,31]. Recent research has investigated the use of aquaponics and hydroponics for cultivating C. sativa. These studies have examined how the root zone affects plant growth and the impacts of copper-rich environments on plants [14,32,33]. These studies emphasize the inventive techniques and the possible advantages and difficulties of soilless and aquaponic systems.
Hemp is a multi-purpose crop with many applications, including textile fibers, paper, biofuels, food, and medicinal products [34]. Its edible leaves have been described as grassy, floral, earthy, minty, and sometimes pungent, depending on the cultivar [35]. Recent studies [34,35] demonstrate its potential as a nutritious salad green in the form of baby leaves and microgreens. The studies conducted on the potential of baby hemp leaves as an edible salad green in greenhouse facilities are limited and have only been performed at Cornell University by Mi, et al. [35,36], highlighting nutrition, sowing density, seed size, and cultivar selection to improve yield and quality, alongside consumer sensory evaluations. Besides, previous studies on different Cannabis sativa varieties have demonstrated that light intensity is crucial during the vegetative stage. Light intensity during the vegetative stage has been found to significantly impact the plant architecture, biomass accumulation, and leaf structure in cannabis [37,38,39,40]. However, the impact of light intensity on baby hemp grown in soilless CEA systems has yet to be evaluated.
Despite the growing application of aquaponics and hydroponics systems to improve food security and mitigate climate change, a major obstacle depends on substantial energy consumption by these systems [41]. Life cycle assessment (LCA) has been recognized as an essential tool for assessing the environmental impacts of agricultural systems and practices, facilitating the development of more sustainable CEA systems [42]. LCA is renowned for its comprehensive method, which assesses both direct and indirect environmental effects, facilitating the assessment of local, regional, and global impacts such as eutrophication, smog formation, and greenhouse gas emissions, respectively [43]. Several studies suggest that hydroponics and aquaponics have the potential to significantly decrease water and fertilizer (specifically aquaponics) consumption when compared to conventional soil-based agriculture [44,45]. Barbosa et al. [46] found that hydroponic lettuce cultivation consumes up to 90% less water compared to conventional methods. However, the high energy consumption for artificial lighting and climate management in these systems can lessen the advantages [47]. Several LCAs have been conducted on the production of different crops, such as basil, lettuce, Swiss chard, kale, arugula, cilantro, Boston lettuce, and mustard greens, in combination with fish like tilapia or trout [41,42,48,49]. To the best of the author’s knowledge, there have been no published LCA studies on hemp production in aquaponics or hydroponics systems yet. As such, this study analyzed the impacts of light intensity on the early vegetative stage of salad-quality hemp plants cultivated in aquaponic and hydroponic systems, while a cradle-to-gate LCA was conducted to assess the environmental performance of the two production systems. The purpose of the study was to evaluate the performance of two soilless systems under different light conditions during the early vegetative stage of hemp growth and to analyze the environmental impact per unit of hemp produced in these systems.

2. Materials and Methods
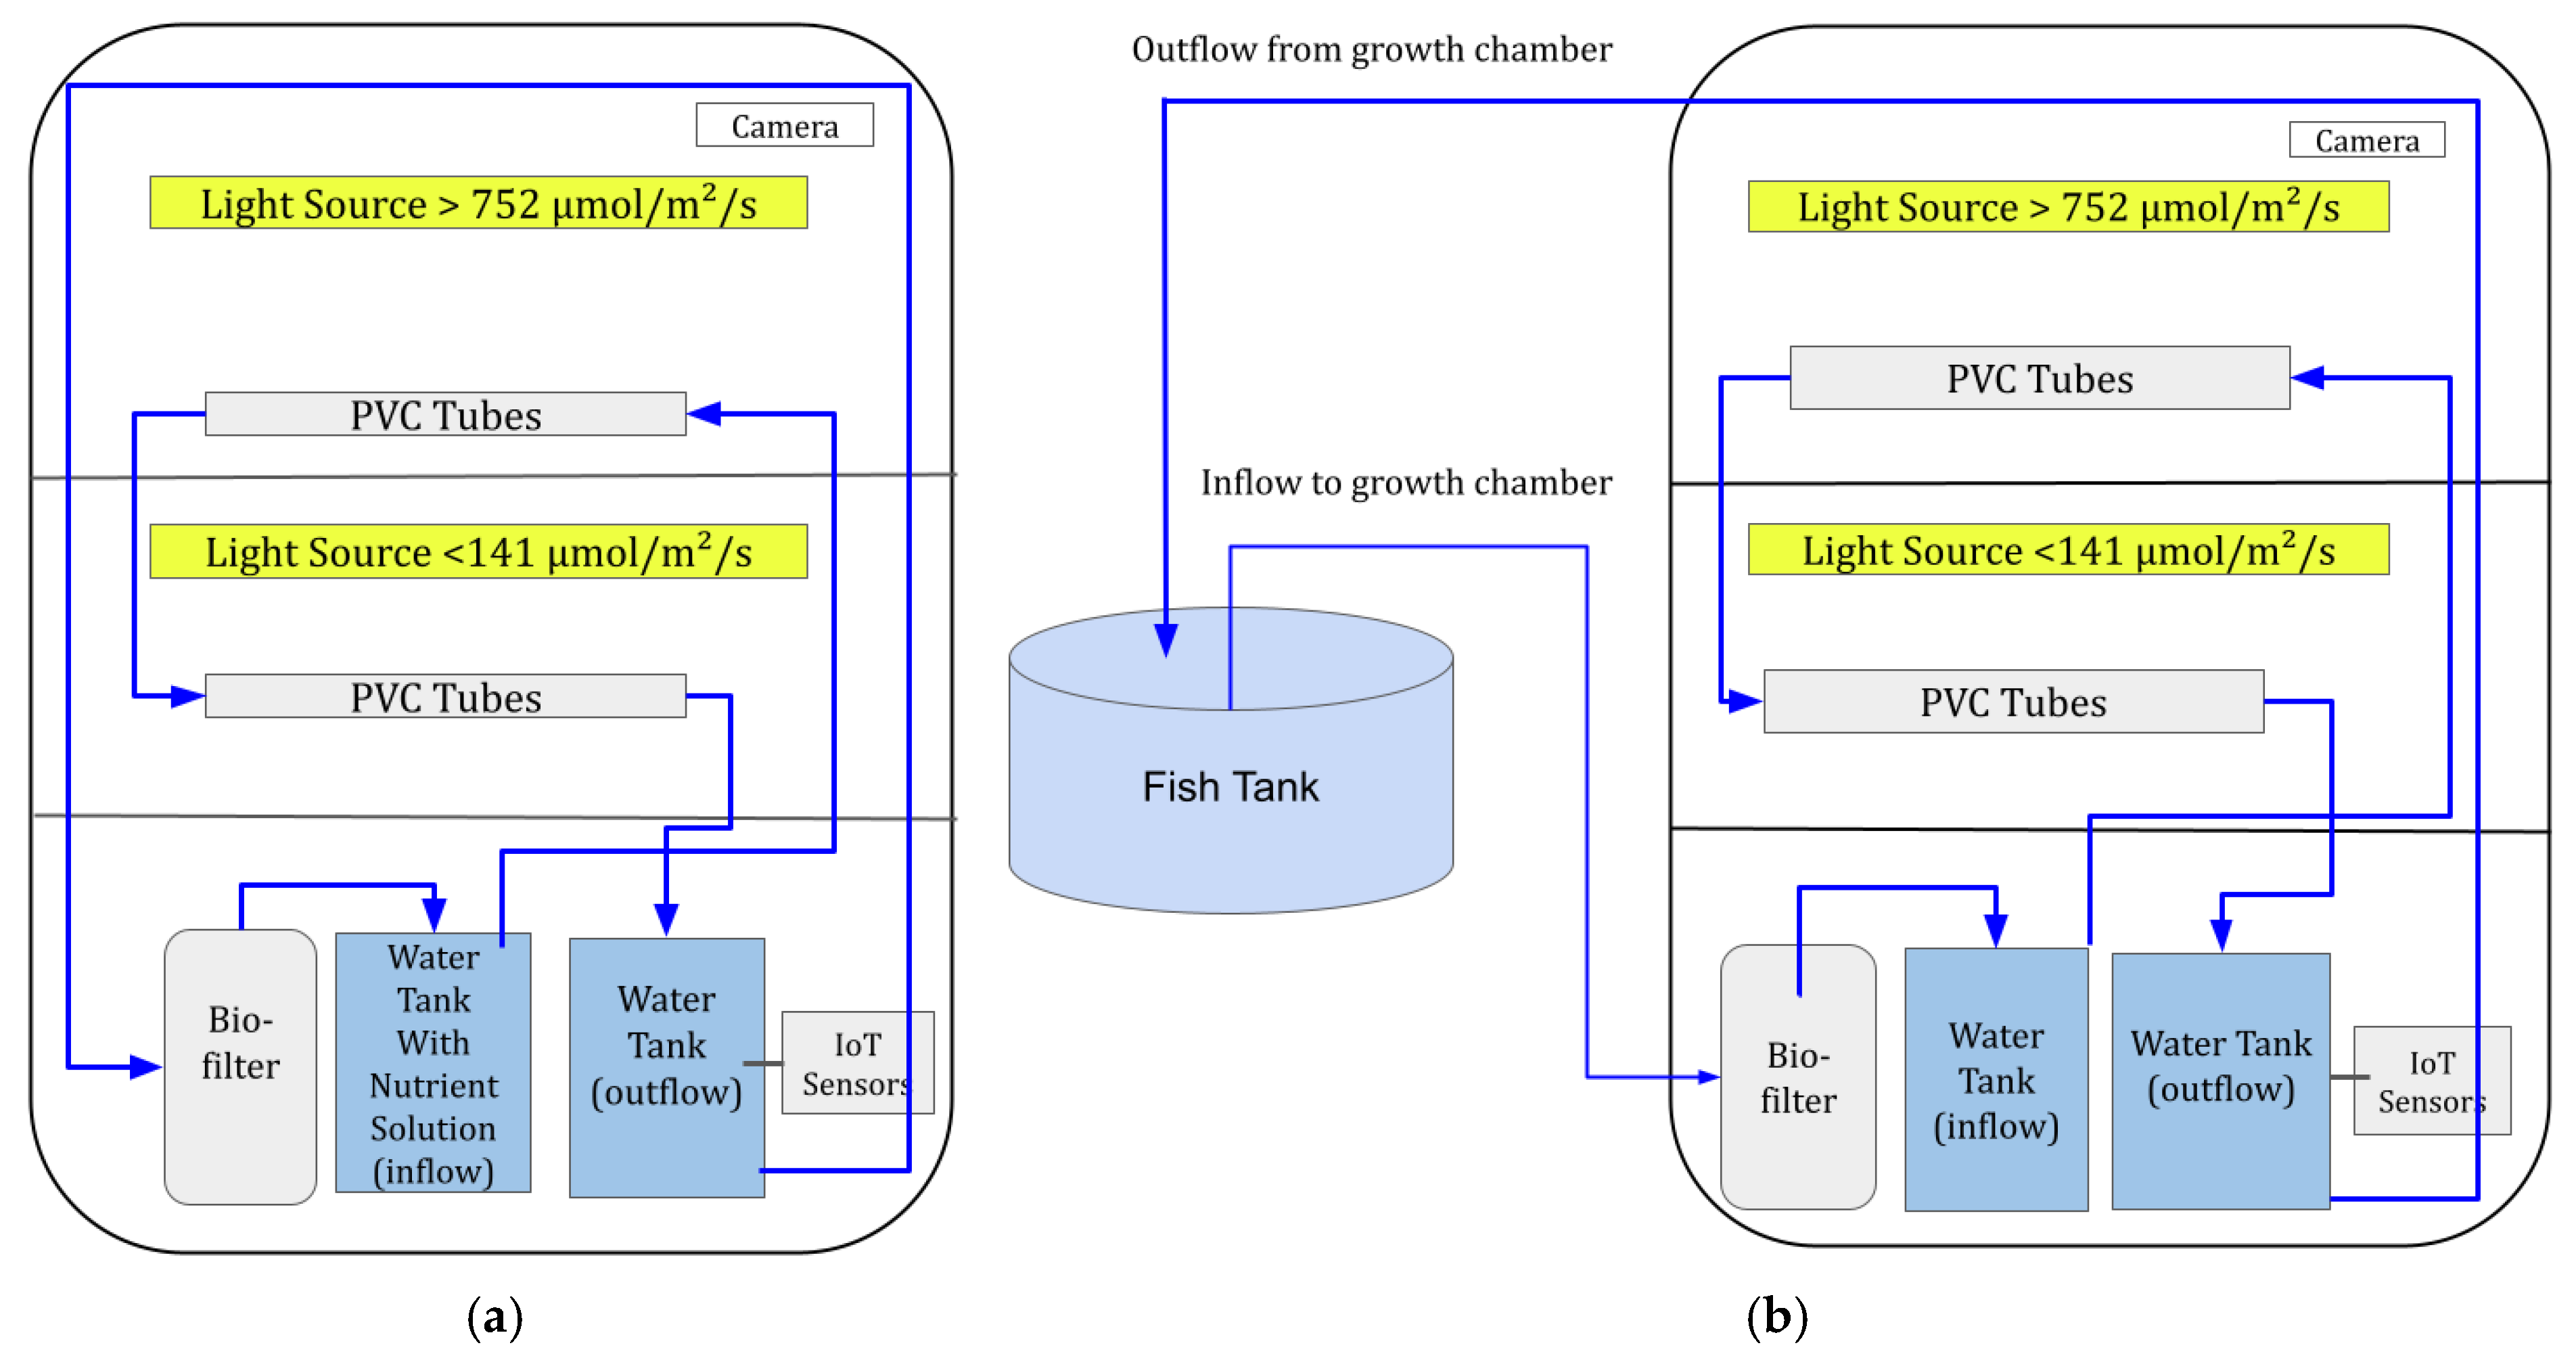
2.1. System Setup

The experiment was conducted in CEA platforms at the University of Idaho Boise, featuring a combination of hydroponic growth modules, 568 L of fish-rearing tank, bio-filtration units, and Internet of Things (IoT) sensors. The plant growth chamber is equipped with polyvinyl chloride (PVC) tubes as grow beds, and IoT sensors to monitor critical parameters, such as dissolved oxygen (DO), electrical conductivity (EC), pH, and water temperature (WT) in a reservoir. The length of the PVC tubes is 81 cm, with a diameter of 6.5 cm. A total of six tubes (three on top and three on the bottom) are connected to the water reservoirs. Nutrient film technique systems were used for this study. Also, the systems were incorporated with power over ethernet (POE) internet protocol cameras for the fish tank and each crop, enabling remote growth monitoring, and two layers of different light intensity light-emitting diode (LED) grow lights to investigate the impact of light on the crop growth. Figure 1 shows the schematic of the experimental setup for hydroponics and aquaponics.
The flow rate inside the fish tank is 10 L/min, ensuring a continuous flow within the tank. The water recirculation process, involving the inflow and outflow between the fish tank (or nutrient reservoir) and the grow bed, was programmed to operate on a cycle of 30 min, with a 5-min active flow duration during each cycle. The fish tank was equipped with four air stones to maintain the DO required for the fish. Environmental parameters were controlled and kept consistent across both systems: temperature was maintained between 20 and 22 °C, pH was 7 to 7.7, DO levels ranged from 7.8 to 7.9 ppm, and EC was maintained at 190 µS/cm. Drinking water was supplied following dichlorination and filtration processes. Water analysis at our site confirmed compliance with federal health-based drinking water standards. The monitoring report by Veolia Municipal Water Division, Boise, Idaho, assessed the concentrations of key substances, including fluoride (0.31 mg/L; standard: 4 mg/L), arsenic (<2.00 μg/L; standard: 10 μg/L), nitrate (0.08 mg/L; standard: 10 mg/L), chloride (1.69 mg/L; standard: 250 mg/L), iron (<0.01 mg/L; standard: 0.3 mg/L), manganese (<0.001 mg/L; standard: 0.05 mg/L), selenium (<0.002 mg/L; standard: 0.05 mg/L), and sulfate (8.9 mg/L; standard: 250 mg/L). No significant mineral additions were detected in the drinking water.

2.2. Plant and Fish in the Systems

The plant growth chambers of hydroponic and aquaponic systems were utilized to cultivate hemp leaves (Cannabis sativa L.). Prior to the experiment, the license to grow hemp in the university facility was obtained from the Idaho State Department of Agriculture (ISDA) in accordance with Idaho Code 22-1705. The variety used for this experiment is the Han NE variety, which is dioecious with a Tetrahydrocannabinol (THC) level of less than 0.3% and is primarily used for fiber production. The seeds were bought from a commercial hemp seed seller and 108 seeds in total were germinated in rockwool grow plugs. Each growth chamber was equipped with six polyvinyl chloride (PVC) tubes, organized in two layers with three tubes per layer, to provide specific light-intensity treatments. Each tube was designed with nine planting holes, allowing for the growth of 54 plants per system. The experiment focused on producing salad-quality hemp leaves with 0% THC; therefore, the trial ended before the flowering stage. The seeds were germinated on 5 November 2023, transplanted into grow tubes on 12 November, and harvested on 4 December 2023, when the plant length was observed to be 21.5 cm. We used three replicates for each system, and the experiment was conducted in a parallel setup. Note that we tested the hemp leaves cultivated in the facility by Columbia Laboratory to check the THC level in the leaves. The test result showed that the LOQ for ∆10-THC-9R, ∆10-THC-9S, ∆10-THC-Total, ∆8-THC, ∆9-THC, THC-A, and THC-Total were 0.0297, 0.0297, 0.0594, 0.0297, 0.0297, 0.0297, and 0.0557, respectively. All these analyte results came below the LOQ level and were negligible to mention.
The fish tank contained fingerlings of Butterfly Koi (Cyprinus carpio var. koi) with a stocking density of 880 g/m3. Although the system allows a stocking density of 6.16 kg/m3, we decided on a lower stocking density based on studies [50,51] indicating that a lower density of koi provides a sustainable approach for fish health and nutrient recycling in aquaponic systems. The feed provided to the fish was Blue Ridge Koi Food with a feed rate of 3% of total fish weight per day. The feed mainly consists of dehulled soybean meal, ground corn, fish meal, and wheat, with a guaranteed analysis provided by the manufacturer: crude protein not less than 36%, crude fat not less than 6%, crude fiber not more than 5%, phosphorus (P) not less than 0.75%, and ash not more than 8.5%. The EC in the aquaponics plant growth chamber reservoir was measured daily, and the nutrient application in the hydroponics system was controlled to ensure that it remained near the aquaponics EC. The nutrient solution applied in the hydroponics water was FLORAGRO® and the N-P-K ratio in the nutrient was 2-1-6. A total of 34 mL of nutrients was added to each hydroponic system.

2.3. Light Intensity Treatments

A split-plot design was used to compare two light intensity (LI) impacts on two different growing systems, e.g., hydroponics and aquaponics [52,53]. The upper layer of each plant growth chamber was provided with a high light intensity of approximately 752 µmol/m2/s, while the lower layer plants were treated with a low light intensity of 141 µmol/m2/s. The light intensities were selected based on a review of previous studies: Moher et al. [39] reported that 600 to 900 µmol/m2/s provided robust plant growth; Roman et al. [37] found that 30 to 180 µmol/m2/s effectively supported plant morphological responses; and Eaves et al. [40] observed that hemp yield increased linearly with light intensity up to at least 1500 141 µmol/m2/s.
The photoperiod for both systems was 12 h (7:00 am to 7:00 pm), consisting of full-spectrum LED grow lights. The two growing systems were considered whole plots, and the two layers within each system, receiving different LIs, were considered subplots. LI, the main effect, was applied at the subplot level, while the whole plot is the growth system.
The impact of two LIs (752 µmol/m2/s and 141 µmol/m2/s) was measured on the plant performance in the two systems, particularly the increase in plant length and leaf area, which were measured as plant growth indicators [54]. Plant growth data (plant length and leaf area) were collected daily under different light treatments; therefore, the experimental design can also be considered a repeated measures design. Box plots, interaction plots, and mixed model ANOVA table were used to analyze the effects of system and light treatments on plant growth. Since we had three replicates of each system, the boxplots and interaction plots presented here are based on data from a randomly selected replicate for illustrative purposes, while the ANOVA results were generated using data from all replicates. We used RStudio (R version 4.5.0) for all statistical analyses.

2.4. Data Collection

Data were collected both manually and using the Atlas Wi-Fi hydroponics kit to measure environmental parameters, such as water temperature of the reservoirs, DO, EC, pH, and WT for both aquaponic and hydroponic systems. Manual data collection was done using APERA Instruments AI209 Value Series PH20 Waterproof pH Tester Kit, AZ8403 Dissolved Oxygen Meter, and VIVOSUN Digital TDS and EC Meter for measuring pH, DO, and EC, respectively. The IoT sensor data were uploaded to ThingSpeak™ (a free, cloud-based data acquisition and visualization platform) and later downloaded from the cloud. Additionally, the temperature, humidity, and electricity consumption of each plant growth chamber were monitored and recorded manually. For the fish tank, water quality parameters critical for fish, such as ammonia, nitrite, and nitrate were regularly checked using the API Freshwater Master Test Kit 141. The fish biomass and length gain were measured every two weeks, and the plant length and leaf area gain were measured daily except on weekends.

2.5. Life Cycle Assessment

A Life Cycle Assessment (LCA) study was conducted for the systems, along with an investigation into the impact of light intensity on hemp growth. The goal of the assessment is to analyze the environmental impact of the aquaponics and hydroponics systems used for the cultivation of hemp in its early vegetative state. Utilizing the openLCA framework and the USLCI database, this study focuses on a cradle-to-gate system boundary [49]. The assessment aims to compare these two systems to reduce environmental impacts, thereby increasing the overall sustainability of the controlled environment agriculture techniques.
The products derived from aquaponic and hydroponic systems differ significantly, with aquaponics producing fish that command a higher market price. Therefore, we defined the physical functional units (FU) as the estimated value of each parameter per kilogram of hemp and fish produced by each system. Table 1 presents all relevant inputs and outputs of the systems. This inventory is critical in providing the necessary data for environmental impact assessment.
This assessment employed the TRACI 2.1 life cycle impact assessment [55] method to analyze various impacts using obtained data from various studies. The impact categories considered include Acidification, Eutrophication, Freshwater Ecotoxicity, Global Warming Potential, Human Health (Cancer, Non-Cancer, and Particulate Matter), Ozone Depletion, and Smog Formation. TRACI 2.1 helps in quantifying the potential environmental impacts across these categories, which include greenhouse gas emissions, energy use, and impacts on human health and ecosystems. Global warming potential (GWP) is used to quantify the relative potency of greenhouse gases in comparison to 1 kg of carbon dioxide (CO2) at time zero [56].

3. Results and Discussion

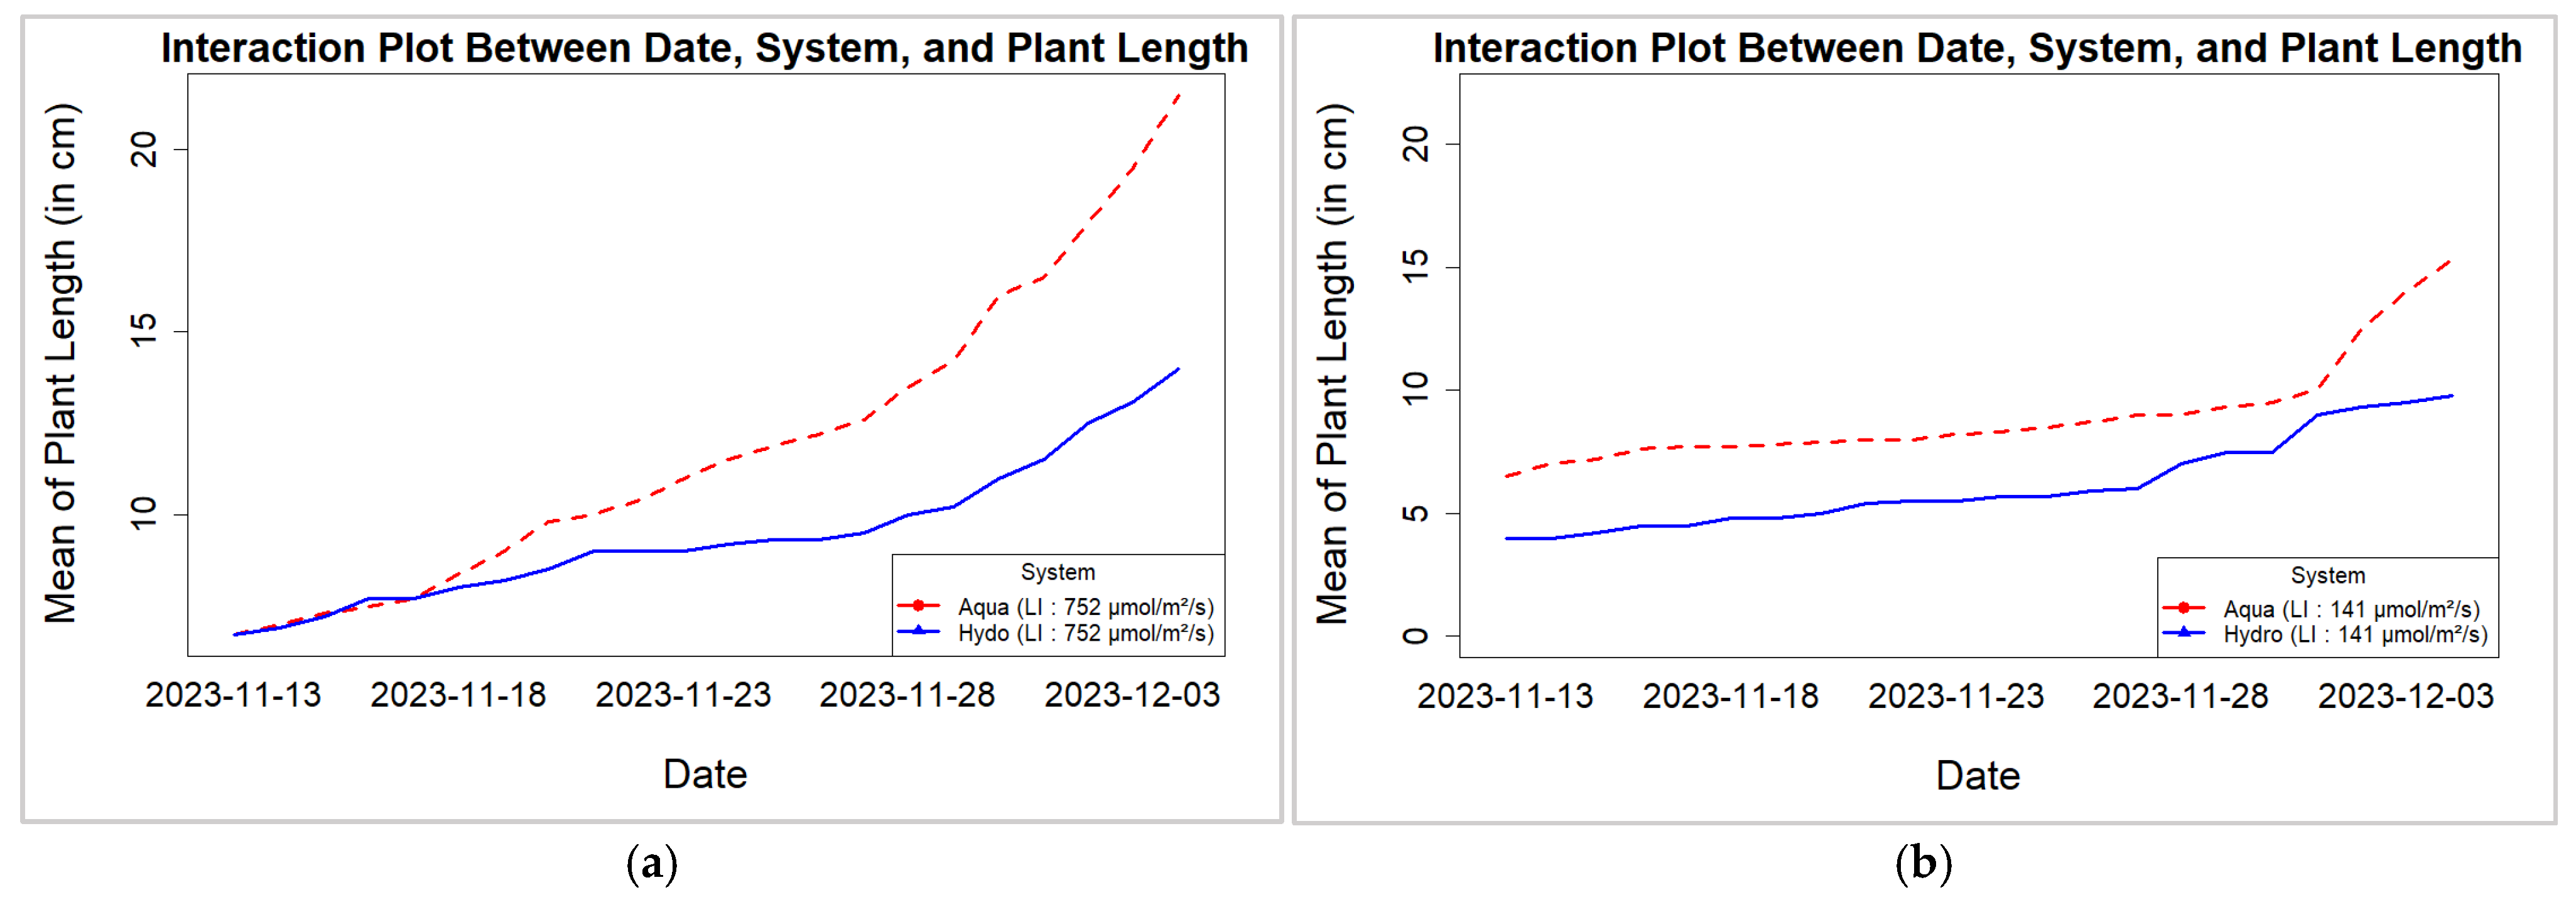
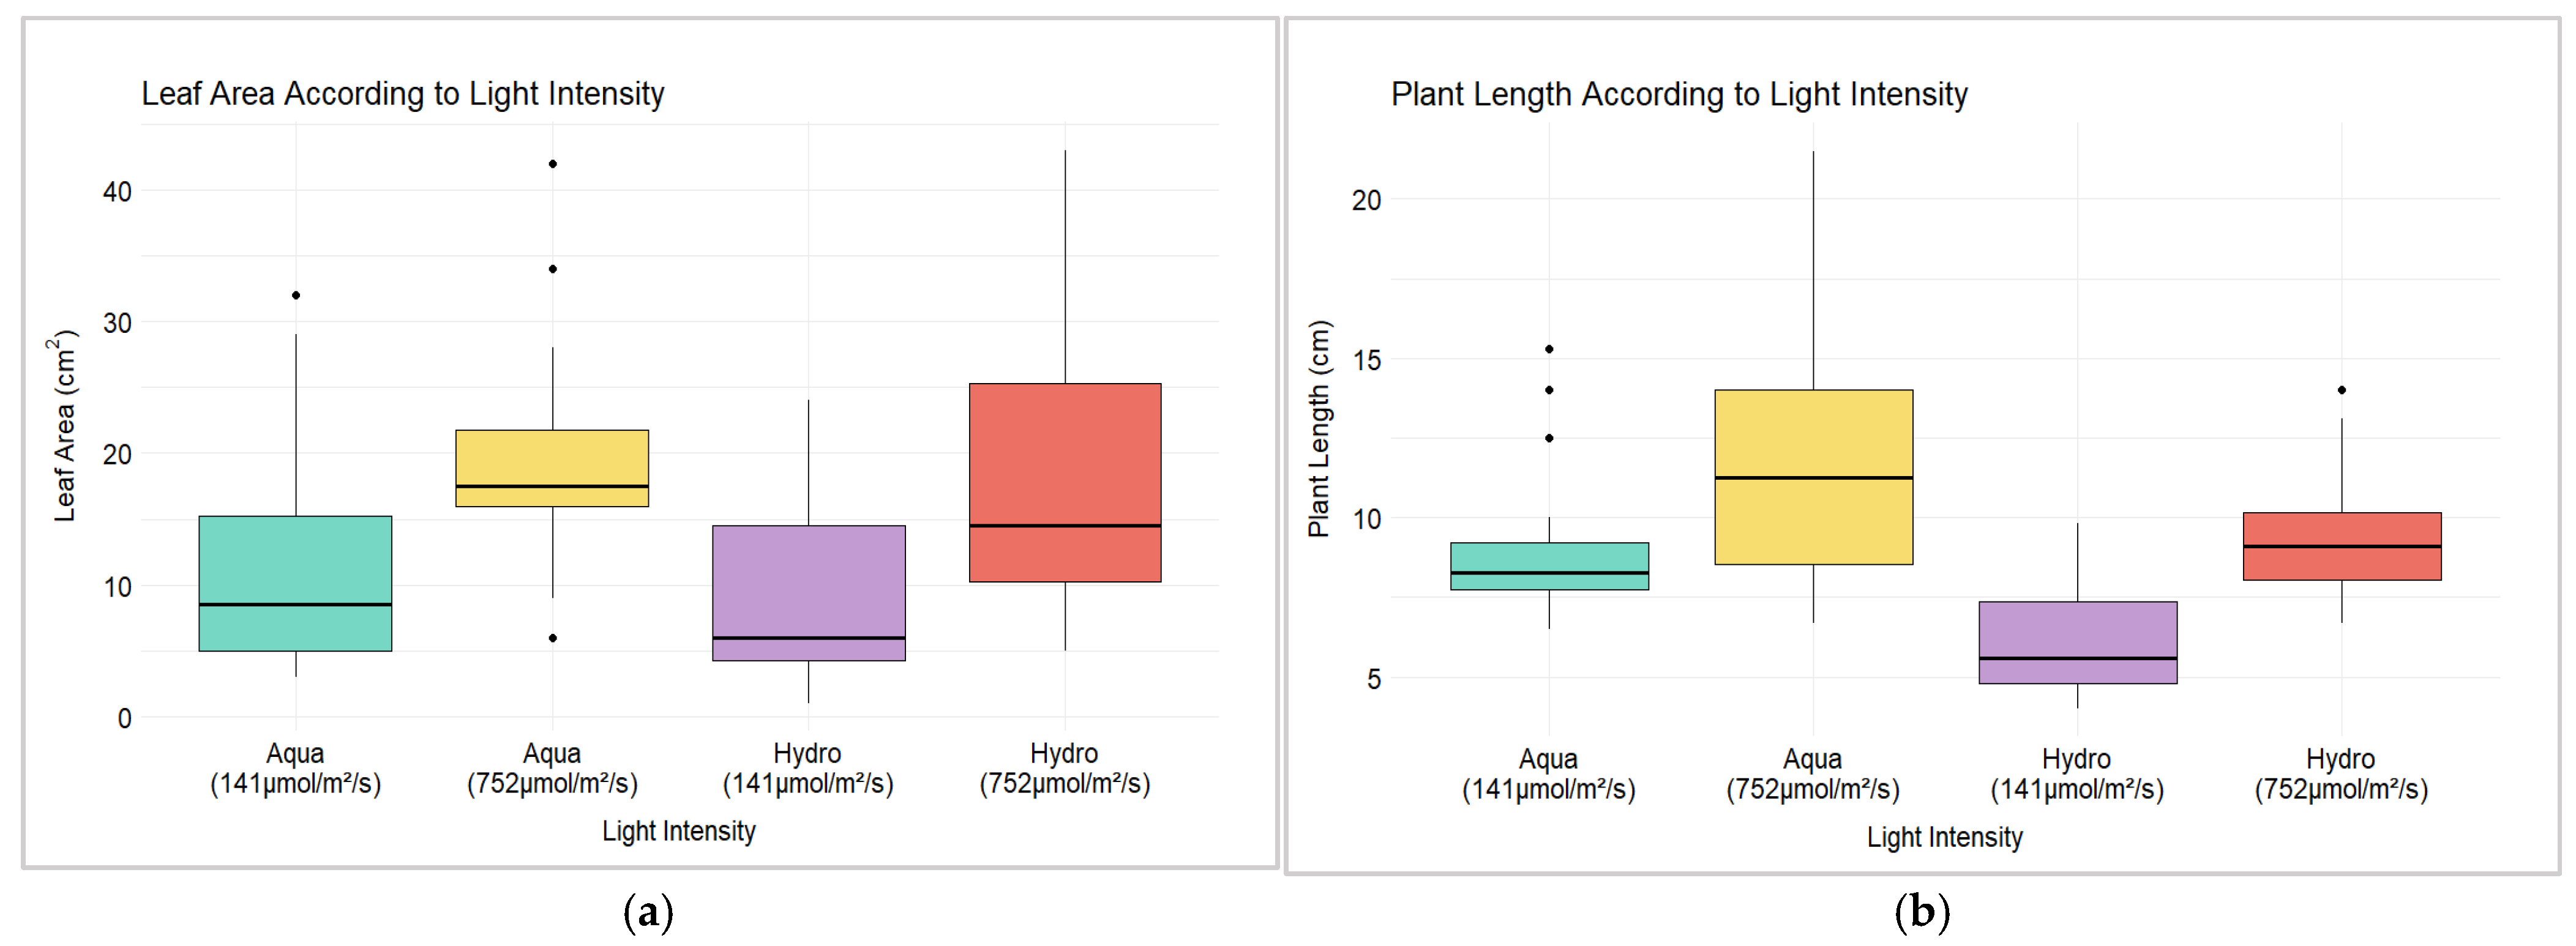
3.1. Hemp Leaf Area and Plant Length for Different Systems and LIs

The leaf area measured for hemp plants grown in two different systems under two LIs shows significant differences. The mixed-effects ANOVA (Table 2) showed that while light intensity had a marginal effect on leaf area, both the growing system and its interaction with light intensity significantly influenced leaf area (p < 0.001).
Figure 2a illustrates that when the LI is 752 µmol/m2/s, the aquaponic system initially exhibits greater leaf area growth. However, the hydroponic system surpasses it after 13 days, resulting in a larger leaf area. In contrast, the aquaponic system outperforms the hydroponic system in terms of mean leaf area at an LI of 141 µmol/m2/s (Figure 2b). This contrast suggests that the aquaponic system may be more effective at promoting leaf growth than the hydroponic system when operating under lower LIs.
When analyzing the impact of light intensity on plant length, the mixed-effects ANOVA (Table 3) revealed that all factors, light intensity, growing system (hydroponics vs. aquaponics), and their interaction, significantly influenced plant length (p < 0.05). The interaction between light intensity and the system was highly significant (p < 0.001), indicating strong system-specific responses to light.
Figure 3a,b displays the interaction plot for the two systems regarding mean plant length increase over time. At a light intensity of 752 µmol/m2/s, a significant increase in plant size was noted for aquaponics plants after five days of transplanting, compared to the hydroponic plants. At 141 µmol/m2/s, the mean plant length was found to be higher for aquaponics plants than for hydroponics plants from the very start until harvest time. While harvesting, it was found that aquaponics plants had greater lengths, 43.8% and 42% higher under 752 µmol/m2/s and 141 µmol/m2/s, respectively, compared to hydroponics plants.
The box plot in Figure 4a indicates the lowest median value for leaf area (less than 10 cm2) under LI of 141 µmol/m2/s in the hydroponic system, although the interquartile range (IQR) is the widest for the leaf area in the hydroponic system under 752 µmol/m2/s with the upper quartile beyond 40 cm2. Conversely, the aquaponic system with 752 µmol/m2/s presents the highest median leaf area. In percentage, the hemp grown in aquaponics had 2.1% less leaf area than hydroponics under 752 µmol/m2/s, and 28.3% more leaf area under 141 µmol/m2/s. Therefore, aquaponics with high LI shows slightly lower leaf area growth than hydroponics but significantly higher performance at a lower LI. Similarly, Salam et al. [57] found a higher leaf area for the Taro plant in aquaponics compared to hydroponics and soil-grown plants. Since all of the environmental parameters (e.g., DO, EC, pH, water temperature) were kept similar in the two systems, aquaponics’ performance in producing hemp leaves with a higher leaf area can be attributed to the light treatment and microorganisms present in the system [58,59].
The boxplot in Figure 4b shows at higher LIs (752 µmol/m2/s), the median plant length for aquaponics increases (higher than 10 cm), with a wider spread of data as indicated by the IQR, while hydroponics plants show a lower median length compared to their aquaponics counterparts and a more compact IQR. The lowest median is found for the hydroponic system with LI at 141 µmol/m2/s. A similar study conducted by Suhl et al. [60] on tomato plants found that while maintaining the same EC, the plant length was nearly the same in both aquaponics and hydroponics systems (10.9 m in aquaponics and 10.8 m in hydroponics). As our study was conducted on hemp in a vegetative state with 0% THC, the maximum plant length we observed was 21.5 cm in the aquaponics system. This length is suitable to produce salad-quality hemp leaves. We excluded the flowering stage from our experiment to ensure that the THC level does not exceed 0.03%. Hence, we confirmed that the hemp leaves produced in the facility meet the regulatory standards for THC levels, ensuring they are safe and compliant with legal requirements.
Among the two systems under similar environmental conditions, the aquaponic systems worked well for both LIs to promote plant growth in terms of increasing the length of the plant and the leaf area. Hydroponics only showed higher leaf area growth with high LI. In this regard, Yep et al. [14] studied hemp root zone growth and observed that hydroponic systems outperformed aquaponics and aquaculture systems due to higher EC, pH, and N-P-K concentrations in hydroponics, contributing to increased growth. On the contrary, we maintained similar environmental conditions, such as DO, EC, and pH, in both systems, and the aquaponic setup demonstrated improved plant growth performance compared to hydroponics under the specific conditions of this study. Delaide et al. [59] conducted similar research and found that crop growth is higher in aquaponics than in hydroponics while maintaining near ranges for nutrients and other parameters. The authors concluded that the increased plant growth in aquaponics was due to the presence of dissolved organic matter and microorganisms. Studies conducted by Jordan et al. [61] and Goddek et al. [47] also showed that lettuce grown through aquaponics demonstrated either a greater or equal yield compared to lettuce grown by hydroponics.

3.2. Life Cycle Assessment Results

LCA results comparing aquaponics with hydroponics, based on mass production, indicated that hydroponics produces higher values across most impact indicators, suggesting a heavier environmental burden. In this study, eutrophication, global warming potential, ozone depletion, and smog formation showed more than 20% higher values in hydroponics compared to aquaponics. The highest impact was found to be caused by hydroponics, with 63% for eutrophication, while aquaponics accounted for 37% of the contribution.

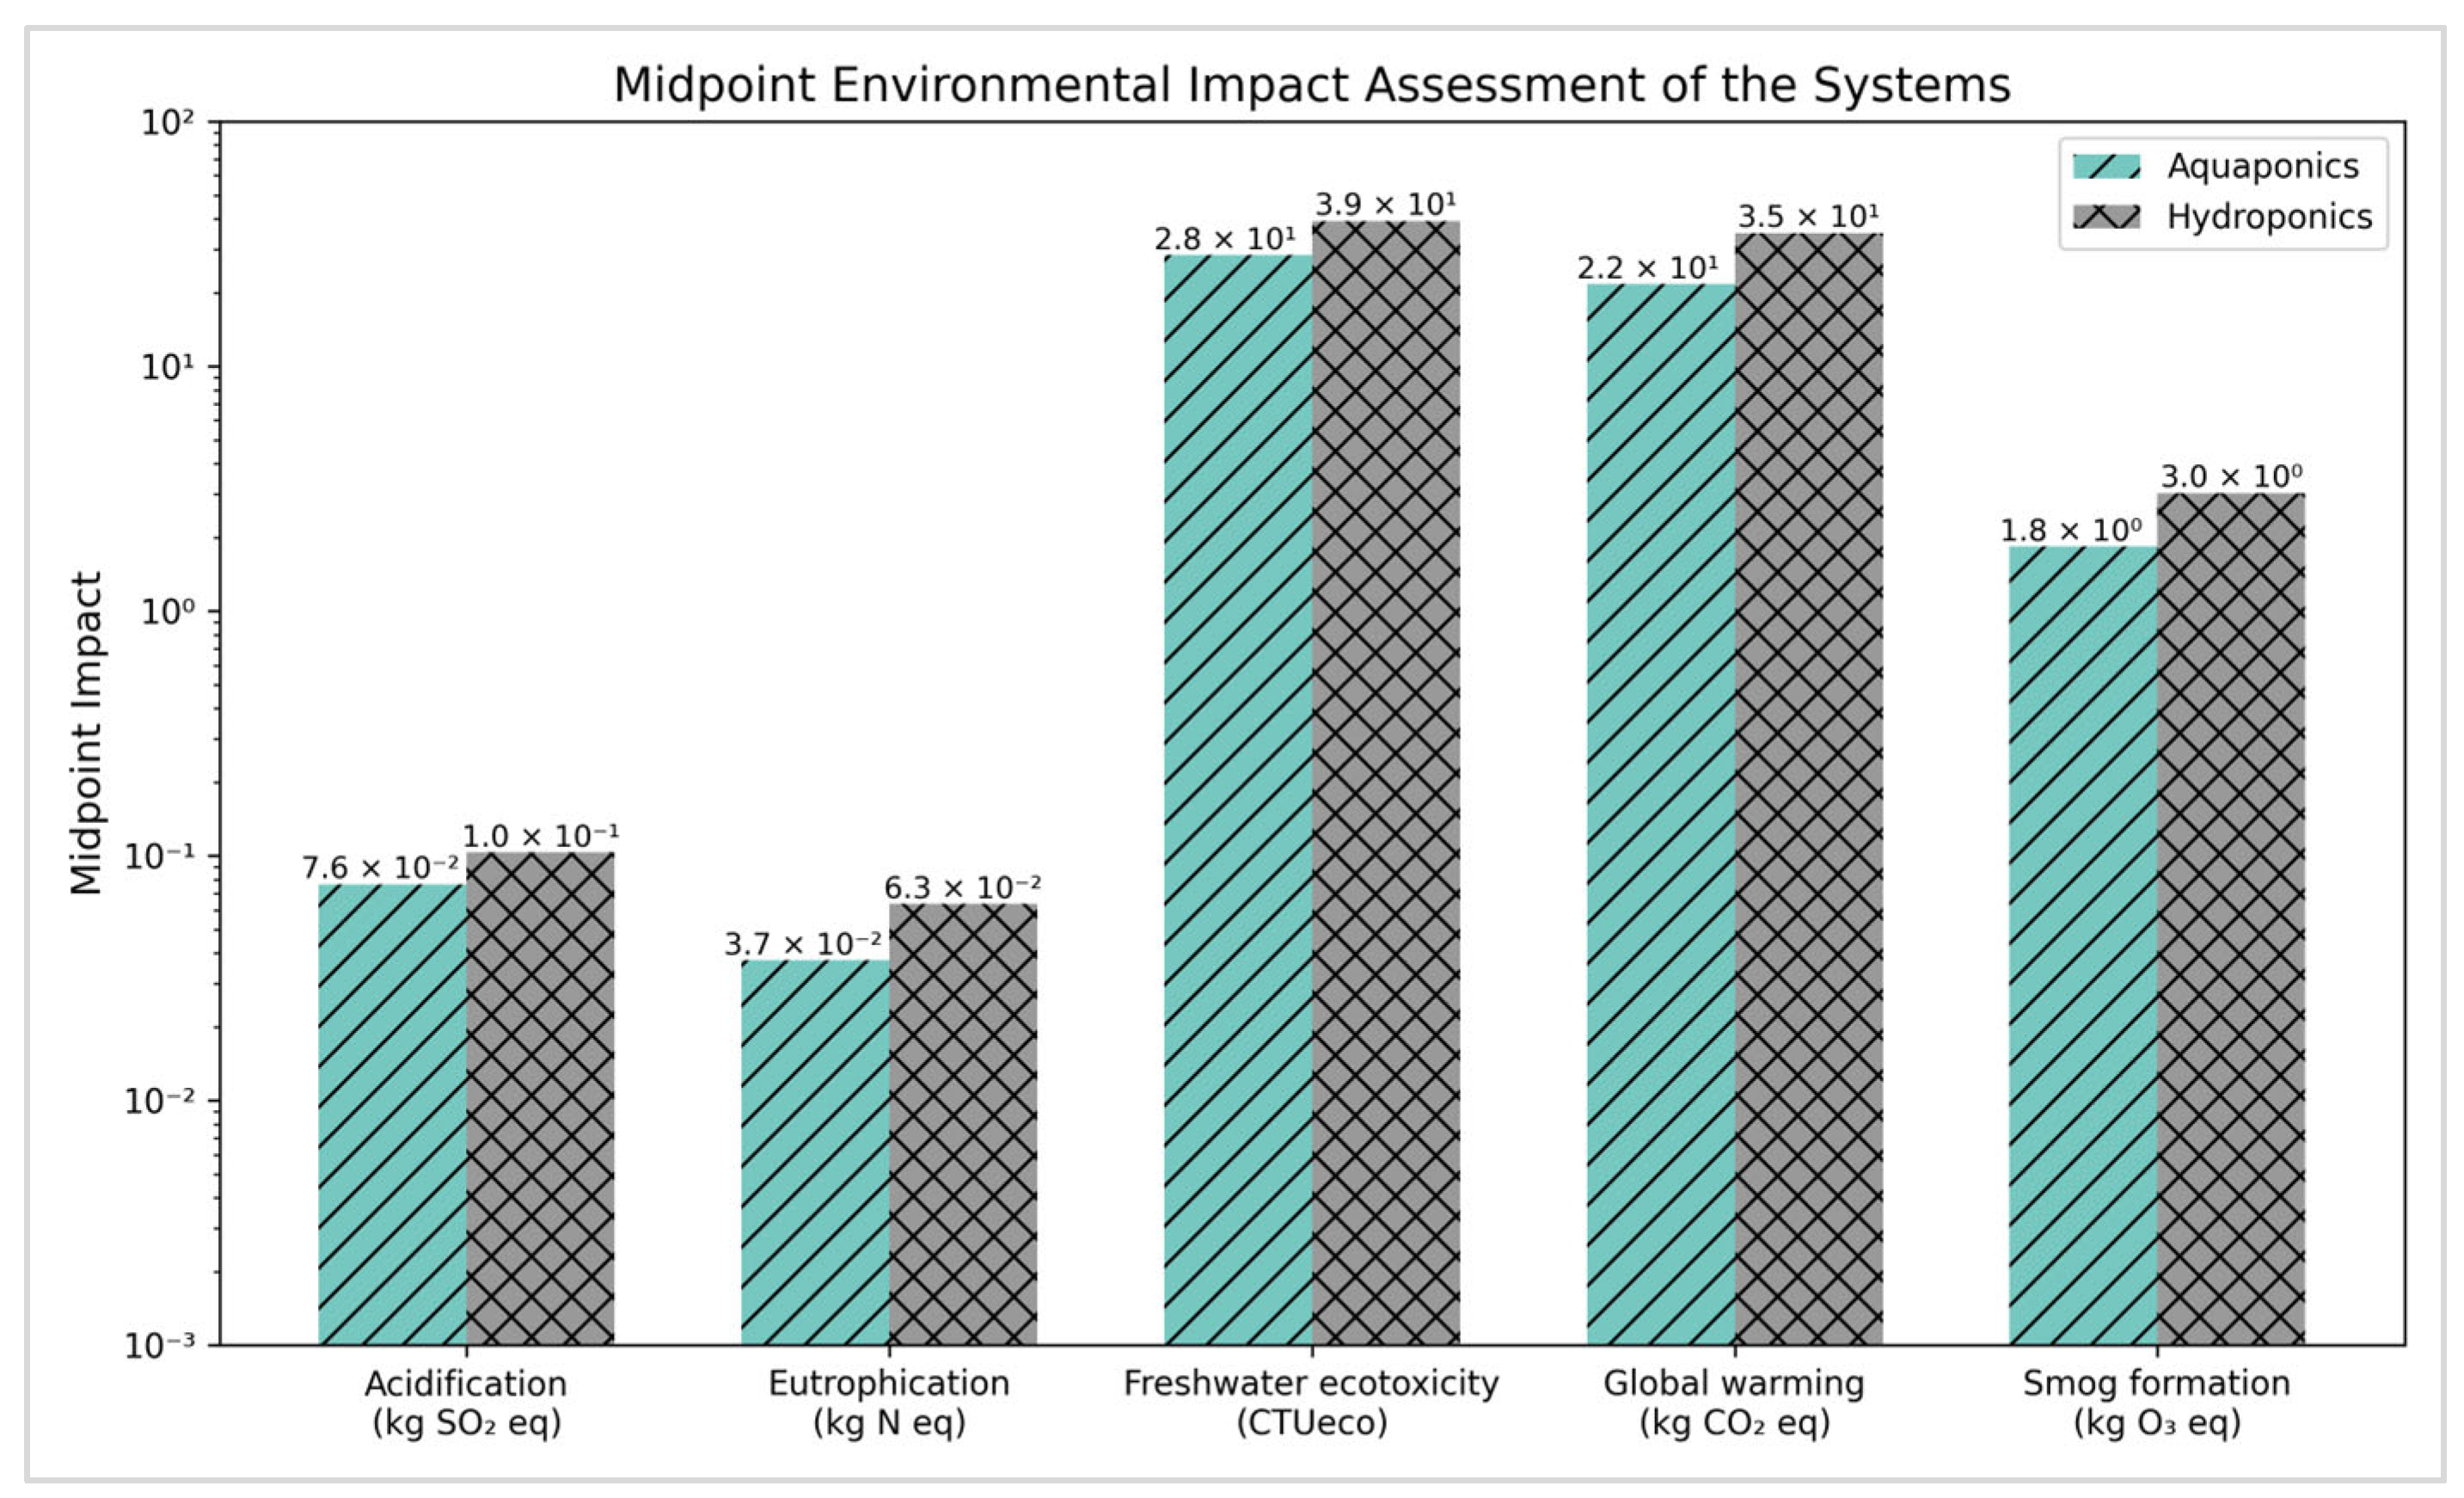
3.2.1. Midpoint Environmental Impacts

The aquaponics system exhibits a lower impact on acidification, eutrophication, freshwater ecotoxicity, global warming potential (a 100-year time horizon), and smog formation, with values of 0.07639 kg SO2 eq., 0.03735 kg N eq., 28.34265 CTUeco, 21.5879 kg CO2 eq., and 1.82892 kg O3 eq., respectively. Conversely, the hydroponics system demonstrates higher impacts in these categories, with values of 0.10303 kg SO2 eq., 0.06336 kg N eq., 39.1941 CTUeco, 35.00933 kg CO2 eq., and 3.02559 kg O3 eq., respectively. Previous LCA studies [42,62], comparing aquaponics and hydroponics methods for producing crops, found that aquaponics has a lower environmental impact than hydroponics. Figure 5 shows the chart of the midpoint environmental impacts for aquaponic and hydroponic systems per kg of mass produced in these systems.
Emissions of gases and chemical elements from aquaponic and hydroponic systems impact the environment. Hydroponics emits 59% nitrogen oxides and 36% sulfur dioxide, contributing to acidification. Aquaponics adds 19% ammonia (not present in hydroponics) to acidification, along with nitrogen oxides and sulfur dioxide. The high percentage of sulfur dioxide emissions from hydroponic systems can be attributed to the synthetic fertilizer used in the system, and ammonia emissions from aquaponics are generated from the feces of the fish [42,63]. Besides, aquaponics has 88% nitrogen in eutrophication, while hydroponics contributes 56% orthophosphate, 15% nitrogen, and 23% nitrogen oxides. Since eutrophication is twofold higher in hydroponics, the emission of orthophosphate and nitrogen oxides is 100% and 32%, respectively, higher than in aquaponics. Hydroponics water reservoirs generate orthophosphate from the phosphorus present in the N-P-K nutrient solution, whereas aquaponics significantly lack this phosphorus [64,65,66].
Both systems show similar emissions for freshwater ecotoxicity. Regarding global warming potential (GWP), carbon dioxide (CO2) emissions are almost identical in both systems, but hydroponics also emits methane 7% (CH4), adding to its GWP100. Here, both CO2 and CH4 have a significant impact on contributing to GWP, although CO2 has a long-lasting impact while CH4 has a more immediate and substantial impact on GWP than CO2 [67]. For smog formation, both systems show similar results, although aquaponics has a higher presence of volatile organic compounds (14%) compared to hydroponics (2%). On the contrary, nitrogen oxide contributes 95% to smog formation in hydroponics, compared to 84% in aquaponics. Figure 6 shows the emission profile contributing to midpoint impacts of aquaponic and hydroponic systems.

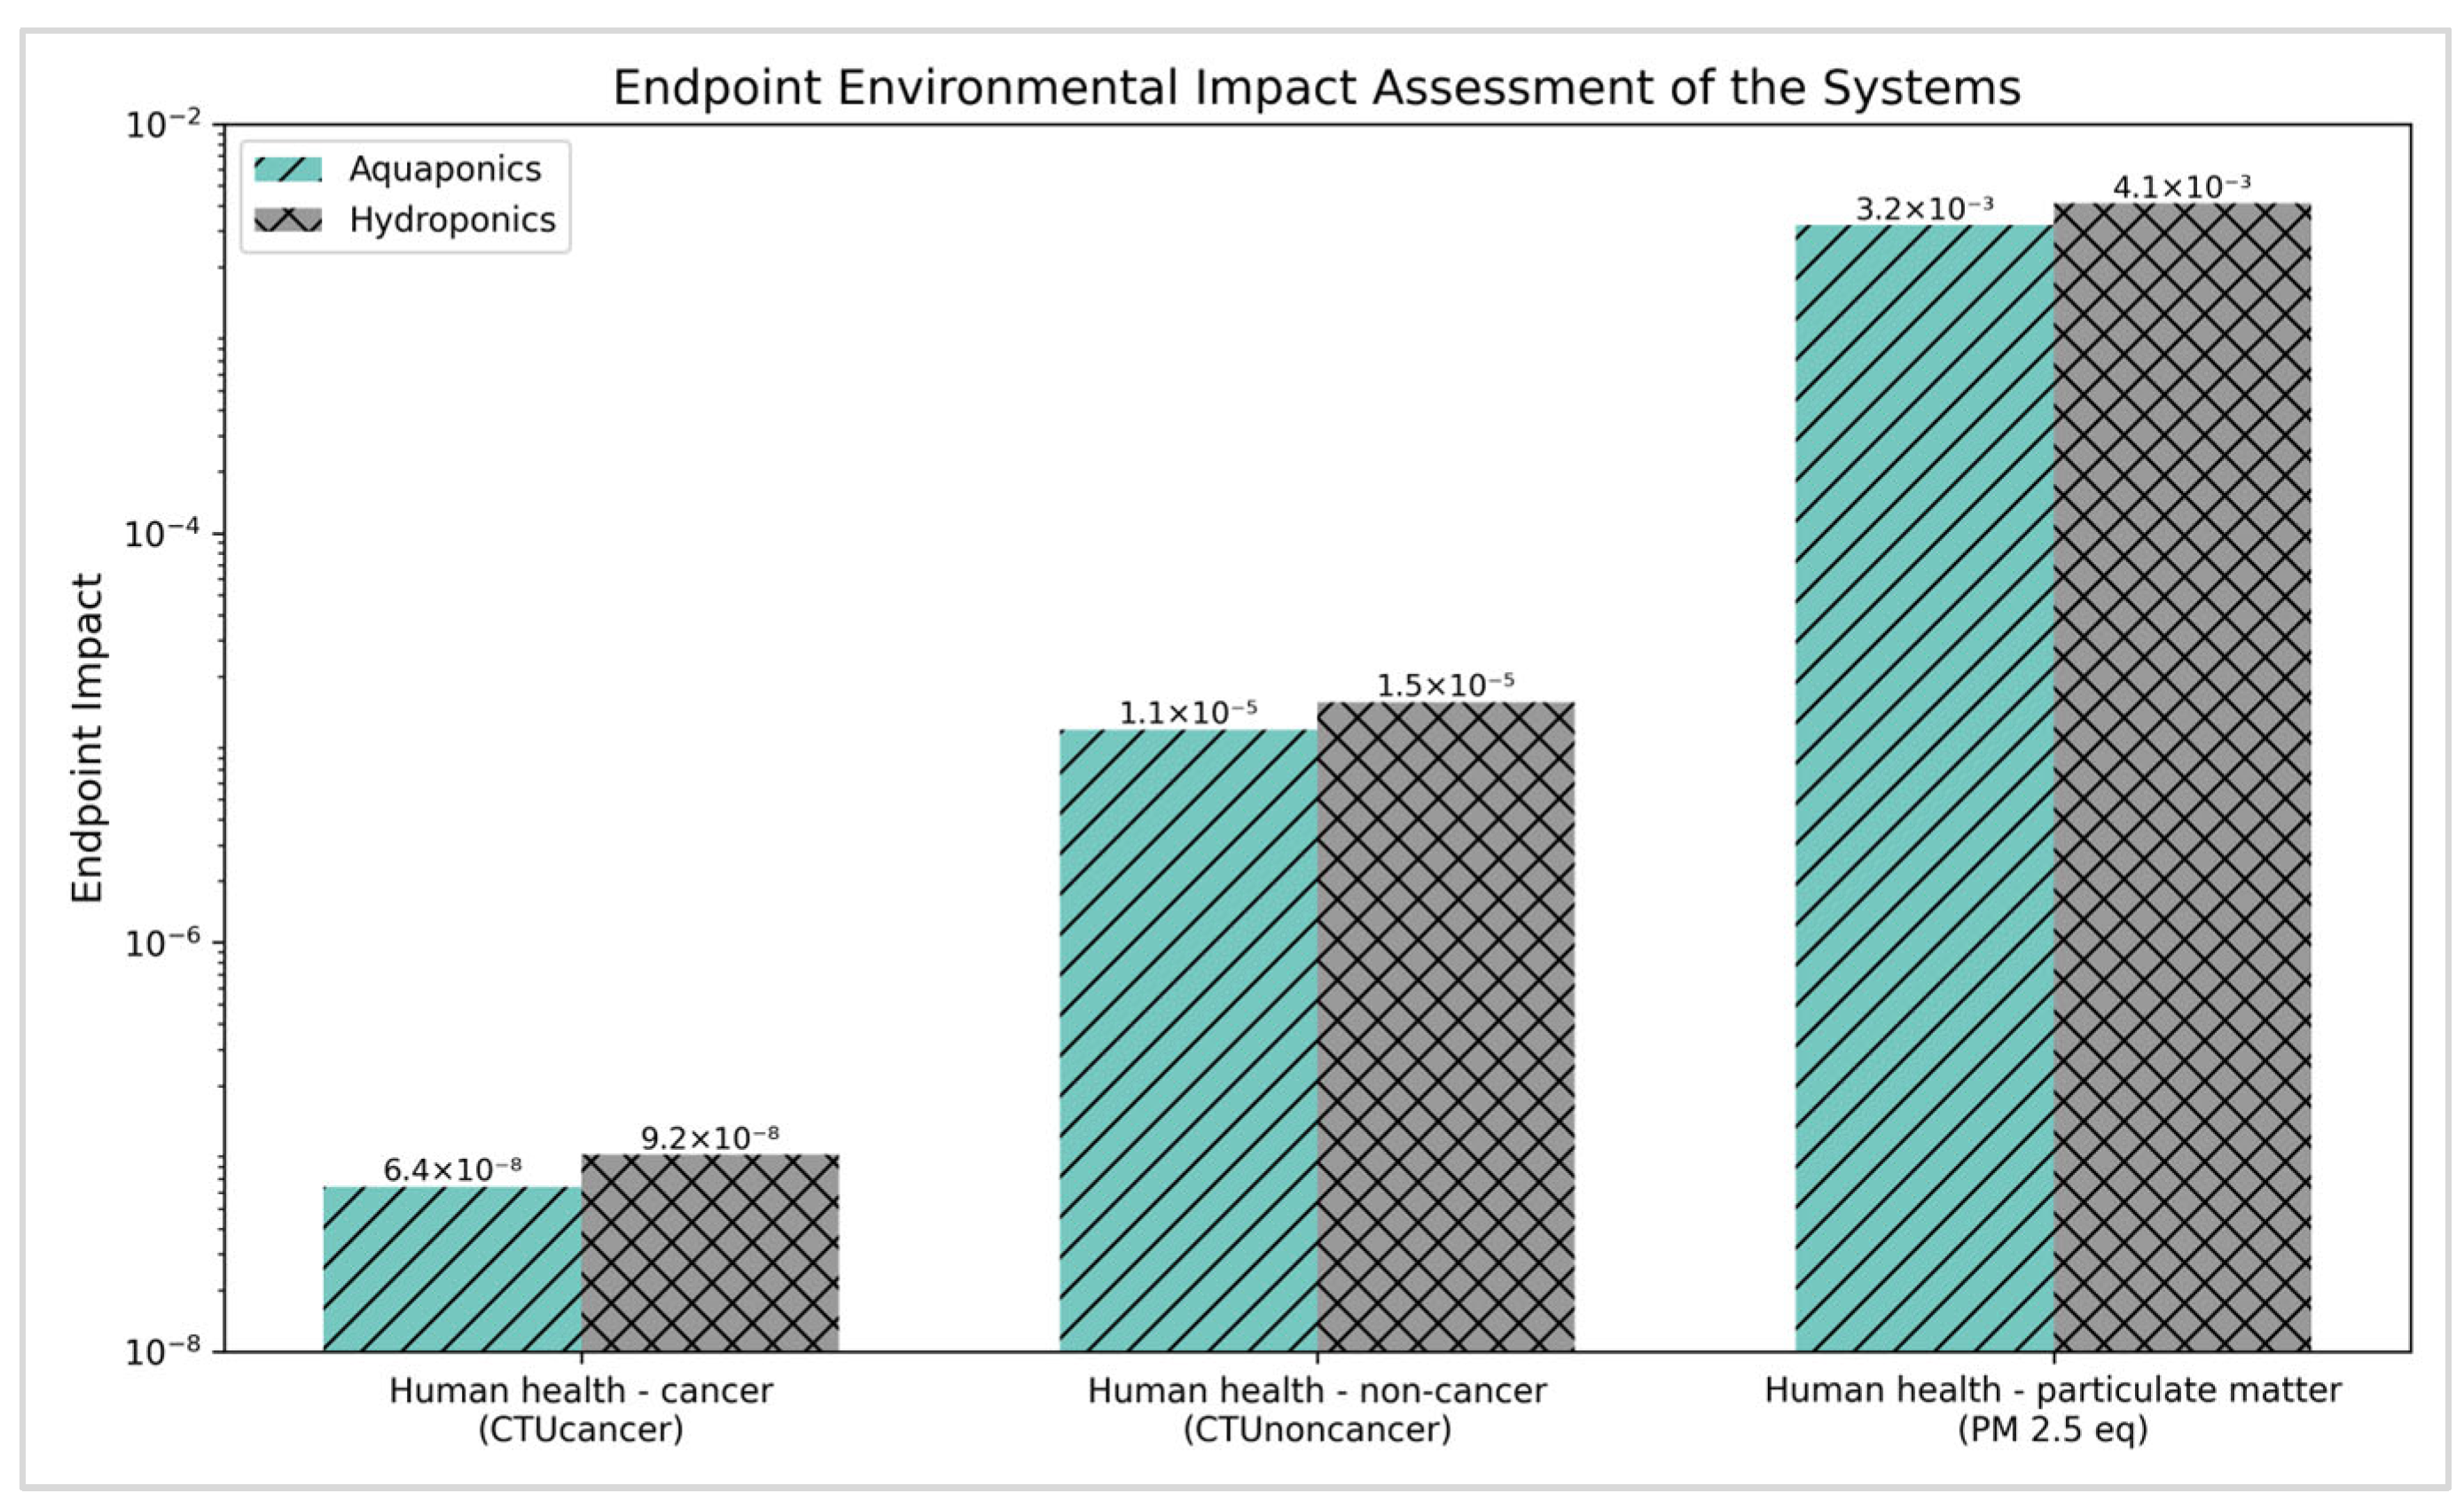
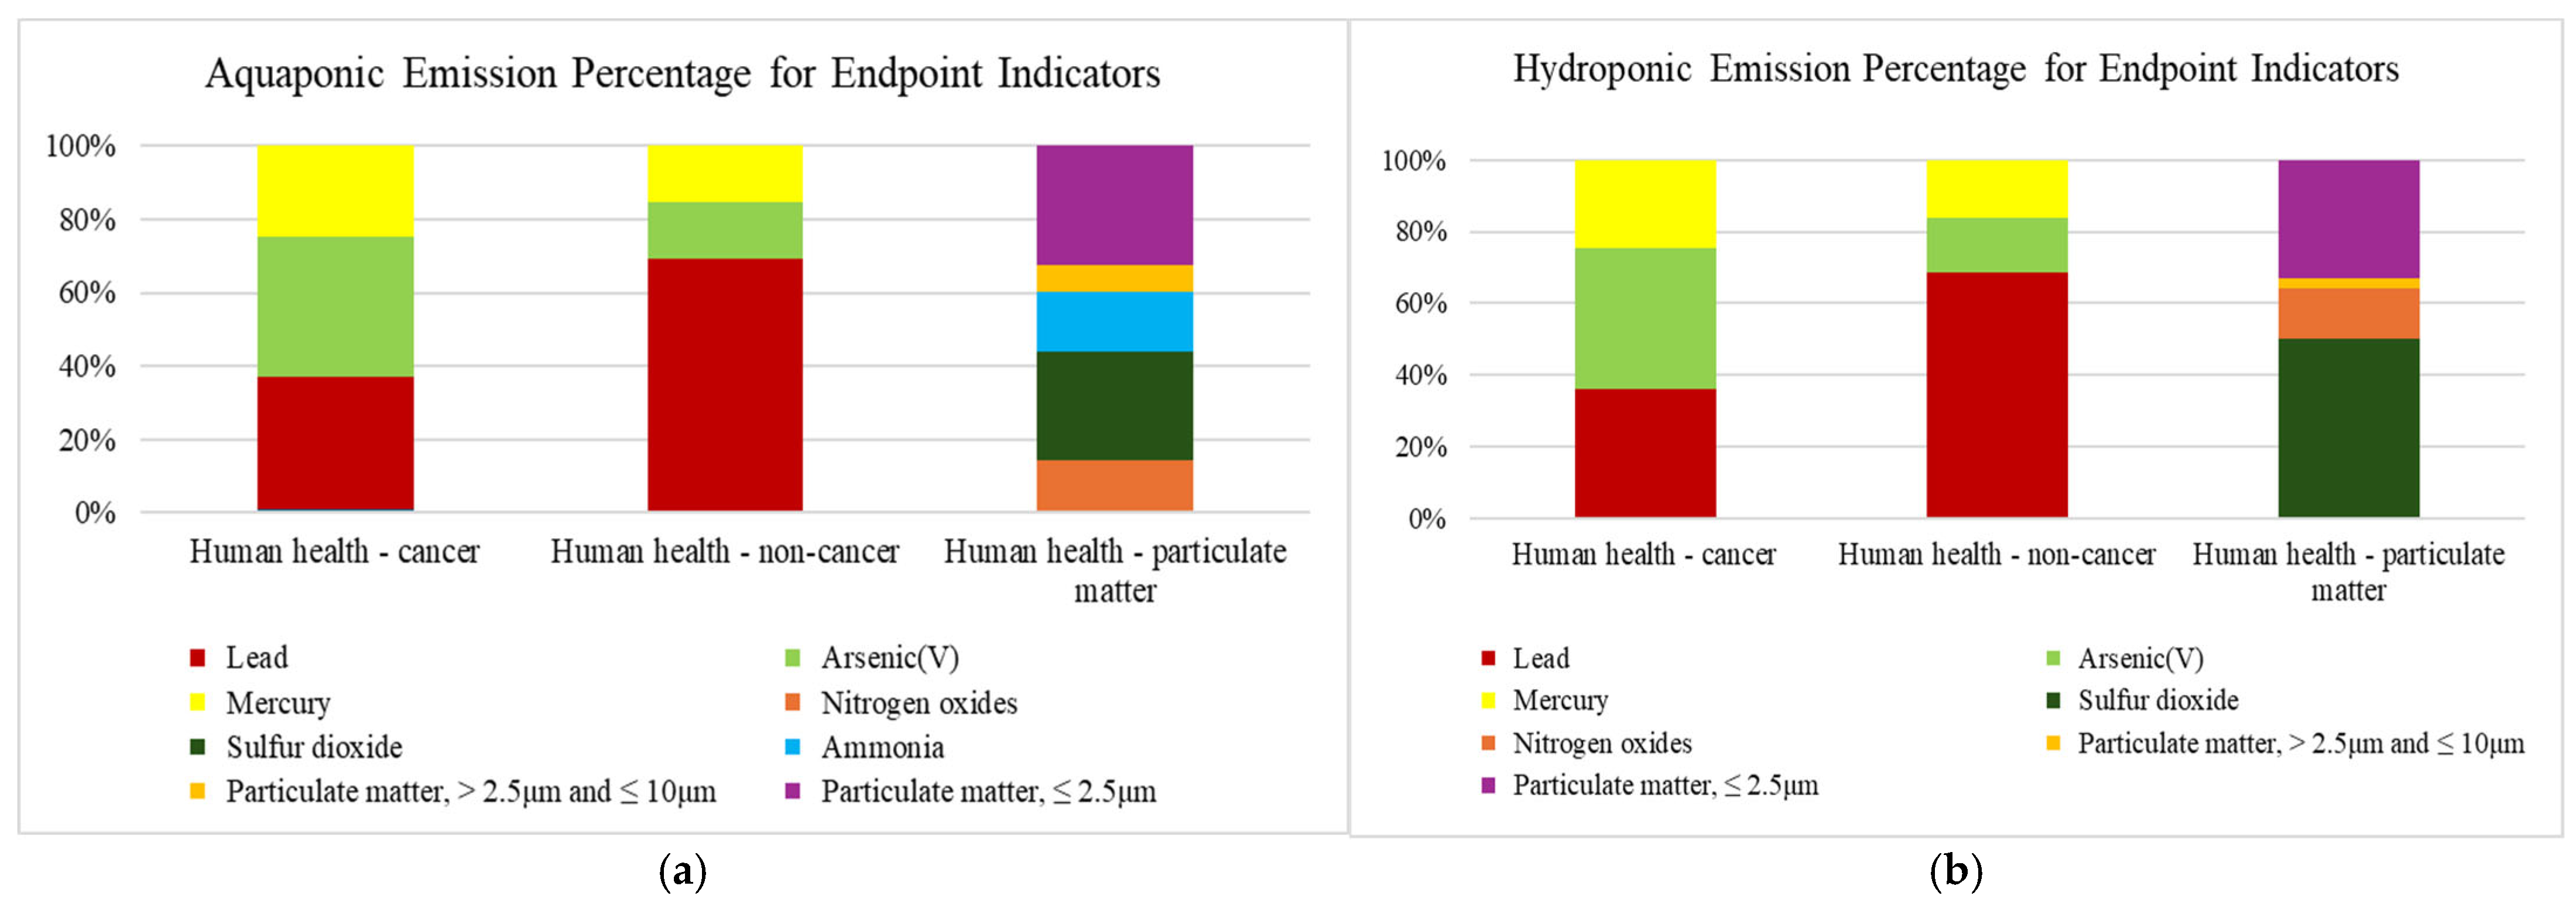
3.2.2. Endpoint Environmental Impacts

Endpoint indicators in the LCA study assess the total environmental impact by quantifying potential effects on areas of concern, such as human health, ecosystem quality, and resource depletion [68]. The endpoint impacts of aquaponics and hydroponics were evaluated based on three human health indicators: cancer, non-cancer, and particulate matter. The aquaponics system exhibited impacts of 6.4 × 10⁻⁸ CTUcancer, 1.1 × 10⁻⁵ CTUnoncancer, and 3.2 × 10⁻³ PM 2.5 eq. per kg of mass produced. In comparison, the hydroponics system showed slightly higher impacts of 9.2 × 10⁻⁸ CTUcancer, 1.5 × 10⁻⁵ CTUnoncancer, and 4.1 × 10⁻³ PM 2.5 eq. for the respective endpoint indicators. Previous research has demonstrated a significant reduction in harmful human health impacts when using aquaponics systems, as opposed to hydroponics [42] and conventional aquaculture systems [48,69]. This indicates that aquaponics is a more sustainable and health-conscious option than other systems. Figure 7 shows the chart of the endpoint environmental impacts for aquaponic and hydroponic systems. Although aquaponics has a slightly lower health impact, the health effects of both systems for cancer and non-cancer are almost negligible, and particulate matter values are also quite low (Figure 7).
Figure 8 shows the human health indicators for analyzing endpoint impact depending on the emission of some elements, e.g., lead, mercury, arsenic, sulfur dioxide, nitrogen oxides, ammonia, and particulate matter (≤2.5, and >2.5 μm). Although our results show negligible value for cancer risk for both systems, we found that the emissions of three elements (i.e., lead, arsenic, and mercury) contribute to the minimal human health cancer risk in both systems.
Emissions from lead ranged from 32% to 35%, arsenic ranged from 34% to 38%, and mercury ranged from 22% to 24% in both systems. Several studies discuss the cancer risk to human health from heavy metals, such as lead, arsenic, and mercury [70,71,72]. The risk of cancer from ingesting fish fillets containing heavy metals is higher than that of consuming leaves due to bioaccumulation [73,74].
According to the U.S. EPA, the non-cancer impacts are the potential health effects of toxic environmental contaminants that do not necessarily cause cancer but have severe health effects, such as reproductive, neurological, respiratory, or other issues [75]. For non-cancer human health impacts, the contributions of lead, arsenic, and mercury were almost identical in both systems (lead: 67%, arsenic: 15%, and mercury: 15% to 16%). However, these emissions are negligible because the total non-cancer impact on human health from the systems is also negligible.
The particulate matter (PM) emissions also exhibited similar contributions in both systems. Ammonia accounted for 16% of emissions in the aquaponics system (not present in hydroponics). Additionally, sulfur dioxide emissions were nearly twice as high in the hydroponic system compared to the aquaponic system for contributing to the human health particulate matter indicator. Because of the respiratory health risk associated with PM emissions, it is also referred to as respiratory effects from the system [69]. Both systems have low PM levels, and the ammonia and sulfur dioxide emissions can be caused by fish waste and synthetic nutrients, respectively [48,63]

4. Conclusions

This study provides a comprehensive assessment of hemp plant growth under different light intensities and the environmental impacts of cultivating hemp using aquaponic and hydroponic systems. The results of our study indicate that, under the specific experimental conditions applied, aquaponics consistently perform better than hydroponics in terms of plant growth performance, regardless of the light intensity conditions. The existence of microorganisms and dissolved organic matter in aquaponics is likely to enhance its efficacy, especially under lower light conditions. Also, the LCA findings show that aquaponics imposes a considerably reduced burden on the environment in comparison to hydroponics. Therefore, aquaponic systems offer a viable and sustainable alternative to conventional hydroponic systems for producing hemp leaves. Further studies are needed to investigate the organic cultivation methods of hemp in these systems, along with their economic feasibility and potential for scalability in commercial production.

Author Contributions

Conceptualization, Z.S. and J.H.R.; methodology and software, Z.S., J.H.R. and A.M.; data collection and analysis, Z.S.; manuscript review and supervising, J.H.R. and A.M. All authors have read and agreed to the published version of the manuscript.

Funding

J.H.R. is partially supported by the National Institute of Food and Agriculture, United States Department of Agriculture (USDA), under award ID01654 (for data acquisition and analysis). Any opinions, findings, conclusions, or recommendations expressed in this publication are those of the authors and do not necessarily reflect the views of the USDA.

Data Availability Statement

The data used in the study can be made available upon request to the corresponding author.

Conflicts of Interest

The authors declare no conflict of interest.

References

  1. Arsenault, T.L.; Prapayotin-Riveros, K.; Ammirata, M.A.; White, J.C.; Dimkpa, C.O. Compliance Testing of Hemp (Cannabis sativa L.) Cultivars for Total Delta-9 THC and Total CBD Using Gas Chromatography with Flame Ionization Detection. Plants 2024, 13, 519. [Google Scholar] [CrossRef] [PubMed]
  2. Johnson, R. Defining hemp: A fact sheet. Congr. Res. Serv. 2019, 44742, 1–12. [Google Scholar]
  3. Small, E.; Marcus, D. Tetrahydrocannabinol levels in hemp (Cannabis sativa) germplasm resources. Econ. Bot. 2003, 57, 545–558. [Google Scholar] [CrossRef]
  4. Yang, R.; Berthold, E.C.; McCurdy, C.R.; da Silva Benevenute, S.; Brym, Z.T.; Freeman, J.H. Development of cannabinoids in flowers of industrial hemp (Cannabis sativa L.): A pilot study. J. Agric. Food Chem. 2020, 68, 6058–6064. [Google Scholar] [CrossRef]
  5. Gonçalves, J.; Rosado, T.; Soares, S.; Simão, A.Y.; Caramelo, D.; Luís, Â.; Fernández, N.; Barroso, M.; Gallardo, E.; Duarte, A.P. Cannabis and its secondary metabolites: Their use as therapeutic drugs, toxicological aspects, and analytical determination. Medicines 2019, 6, 31. [Google Scholar] [CrossRef]
  6. ElSohly, M.; Gul, W. Constituents of Cannabis sativa. Handb. Cannabis 2014, 3, 187–188. [Google Scholar]
  7. Gorelick, J.; Bernstein, N. Chemical and physical elicitation for enhanced cannabinoid production in cannabis. In Cannabis sativa L.-Botany and Biotechnology; Springer: Cham, Switzerland, 2017; pp. 439–456. [Google Scholar]
  8. Hanuš, L.O.; Meyer, S.M.; Muñoz, E.; Taglialatela-Scafati, O.; Appendino, G. Phytocannabinoids: A unified critical inventory. Nat. Prod. Rep. 2016, 33, 1357–1392. [Google Scholar] [CrossRef] [PubMed]
  9. Nelson, K.M.; Bisson, J.; Singh, G.; Graham, J.G.; Chen, S.-N.; Friesen, J.B.; Dahlin, J.L.; Niemitz, M.; Walters, M.A.; Pauli, G.F. The essential medicinal chemistry of cannabidiol (CBD). J. Med. Chem. 2020, 63, 12137–12155. [Google Scholar] [CrossRef]
  10. Szaflarski, J.P.; Bebin, E.M.; Cutter, G.; DeWolfe, J.; Dure, L.S.; Gaston, T.E.; Kankirawatana, P.; Liu, Y.; Singh, R.; Standaert, D.G. Cannabidiol improves frequency and severity of seizures and reduces adverse events in an open-label add-on prospective study. Epilepsy Behav. 2018, 87, 131–136. [Google Scholar] [CrossRef]
  11. Rahn, E.J.; Hohmann, A.G. Cannabinoids as pharmacotherapies for neuropathic pain: From the bench to the bedside. Neurotherapeutics 2009, 6, 713–737. [Google Scholar] [CrossRef]
  12. Skrabek, R.Q.; Galimova, L.; Ethans, K.; Perry, D. Nabilone for the treatment of pain in fibromyalgia. J. Pain 2008, 9, 164–173. [Google Scholar] [CrossRef] [PubMed]
  13. Farha, M.A.; El-Halfawy, O.M.; Gale, R.T.; MacNair, C.R.; Carfrae, L.A.; Zhang, X.; Jentsch, N.G.; Magolan, J.; Brown, E.D. Uncovering the hidden antibiotic potential of cannabis. ACS Infect. Dis. 2020, 6, 338–346. [Google Scholar] [CrossRef]
  14. Yep, B.; Gale, N.V.; Zheng, Y. Comparing hydroponic and aquaponic rootzones on the growth of two drug-type Cannabis sativa L. cultivars during the flowering stage. Ind. Crops Prod. 2020, 157, 112881. [Google Scholar] [CrossRef]
  15. Perez, J.; Ribera, M.V. Managing neuropathic pain with Sativex®: A review of its pros and cons. Expert Opin. Pharmacother. 2008, 9, 1189–1195. [Google Scholar] [CrossRef]
  16. Vernon, M.; Kouzani, A.Z.; Webb, L.D.; Adams, S.D. A Survey of Modern Greenhouse Technologies and Practices for Commercial Cannabis Cultivation. IEEE Access 2023, 11, 62077–62090. [Google Scholar] [CrossRef]
  17. U.S. Congress. Agricultural Act of 2014, H.R. 2642, 113th Cong. Enacted. 7 February 2014. Available online: https://www.congress.gov/bill/113th-congress/house-bill/2642 (accessed on 22 June 2024).
  18. Abernethy, A. Hemp Production and the 2018 Farm Bill; US Food and Drug Administration: Silver Spring, MD, USA, 2019. [Google Scholar]
  19. Idaho State Legislature. Industrial Hemp Research and Development Act, H.B. 126, 66th Legislature, 1st Regular Session. 2021. Available online: https://legislature.idaho.gov/wp-content/uploads/sessioninfo/2021/legislation/H0126.pdf (accessed on 5 June 2024).
  20. Farag, S.; Kayser, O. Cultivation and breeding of Cannabis sativa L. for preparation of standardized extracts for medicinal purposes. In Medicinal and Aromatic Plants of the World: Scientific, Production, Commercial and Utilization Aspects; Springer: Dordrecht, The Netherlands, 2015; pp. 165–186. [Google Scholar]
  21. Vanhove, W.; Van Damme, P.; Meert, N. Factors determining yield and quality of illicit indoor cannabis (Cannabis spp.) production. Forensic Sci. Int. 2011, 212, 158–163. [Google Scholar] [CrossRef]
  22. Heo, J.; Baek, J.; Subah, Z.; Ryu, J.H. Evaluating crop growth between hydroponics and aquaponics with different light inputs. Front. Hortic. 2024, 3, 1413224. [Google Scholar] [CrossRef]
  23. Bouchard, M.; Dion, C.B. Growers and facilitators: Probing the role of entrepreneurs in the development of the cannabis cultivation industry. J. Small Bus. Entrep. 2009, 22, 25–37. [Google Scholar] [CrossRef]
  24. Ali, A.; Niu, G.; Masabni, J.; Ferrante, A.; Cocetta, G. Integrated nutrient management of fruits, vegetables, and crops through the use of biostimulants, soilless cultivation, and traditional and modern approaches—A mini review. Agriculture 2024, 14, 1330. [Google Scholar] [CrossRef]
  25. Bevan, L.; Jones, M.; Zheng, Y. Optimisation of nitrogen, phosphorus, and potassium for soilless production of Cannabis sativa in the flowering stage using response surface analysis. Front. Plant Sci. 2021, 12, 764103. [Google Scholar] [CrossRef]
  26. Jin, D.; Jin, S.; Chen, J. Cannabis indoor growing conditions, management practices, and post-harvest treatment: A review. Am. J. Plant Sci. 2019, 10, 925. [Google Scholar] [CrossRef]
  27. Ryu, J.H.; Subah, Z.; Baek, J. An Application of System Dynamics to Characterize Crop Production for Autonomous Indoor Farming Platforms (AIFP). Horticulturae 2023, 9, 1318. [Google Scholar] [CrossRef]
  28. Ryu, J.H.; Baek, J.; Subah, Z. A low-cost autonomous and scalable hydroponics system for space farming. HardwareX 2025, 21, e00625. [Google Scholar] [CrossRef]
  29. Yep, B.; Zheng, Y. Aquaponic trends and challenges—A review. J. Clean. Prod. 2019, 228, 1586–1599. [Google Scholar] [CrossRef]
  30. König, B.; Janker, J.; Reinhardt, T.; Villarroel, M.; Junge, R. Analysis of aquaponics as an emerging technological innovation system. J. Clean. Prod. 2018, 180, 232–243. [Google Scholar] [CrossRef]
  31. Palm, H.W.; Knaus, U.; Appelbaum, S.; Goddek, S.; Strauch, S.M.; Vermeulen, T.; Haїssam Jijakli, M.; Kotzen, B. Towards commercial aquaponics: A review of systems, designs, scales and nomenclature. Aquac. Int. 2018, 26, 813–842. [Google Scholar] [CrossRef]
  32. Punja, Z.K.; Rodriguez, G. Fusarium and Pythium species infecting roots of hydroponically grown marijuana (Cannabis sativa L.) plants. Can. J. Plant Pathol. 2018, 40, 498–513. [Google Scholar] [CrossRef]
  33. Arru, L.; Rognoni, S.; Baroncini, M.; Bonatti, P.M.; Perata, P. Copper localization in Cannabis sativa L. grown in a copper-rich solution. Euphytica 2004, 140, 33–38. [Google Scholar] [CrossRef]
  34. Pannico, A.; Kyriacou, M.C.; El-Nakhel, C.; Graziani, G.; Carillo, P.; Corrado, G.; Ritieni, A.; Rouphael, Y.; De Pascale, S. Hemp microgreens as an innovative functional food: Variation in the organic acids, amino acids, polyphenols, and cannabinoids composition of six hemp cultivars. Food Res. Int. 2022, 161, 111863. [Google Scholar] [CrossRef]
  35. Mi, R. Cultural Management, Production, and Consumer Sensory Evaluation of Baby Leaf Hemp (Cannabis sativa L.) as an Edible Salad Green. 2020. Available online: https://ecommons.cornell.edu/bitstream/1813/103091/1/Mi_cornell_0058O_10970.pdf (accessed on 5 June 2024).
  36. Mi, R.; Taylor, A.G.; Smart, L.B.; Mattson, N.S. Developing production guidelines for baby leaf hemp (Cannabis sativa L.) as an edible salad green: Cultivar, sowing density and seed size. Agriculture 2020, 10, 617. [Google Scholar] [CrossRef]
  37. Roman, M.; Li, M.; Yuan, J.; Rehman, M.; Liu, L. Dynamics of industrial hemp vegetative growth and metabolite accumulation in response to light intensity. S. Afr. J. Bot. 2024, 169, 82–94. [Google Scholar] [CrossRef]
  38. Wei, X.; Zhao, X.; Long, S.; Xiao, Q.; Guo, Y.; Qiu, C.; Qiu, H.; Wang, Y. Wavelengths of LED light affect the growth and cannabidiol content in Cannabis sativa L. Ind. Crops Prod. 2021, 165, 113433. [Google Scholar] [CrossRef]
  39. Moher, M.; Llewellyn, D.; Jones, M.; Zheng, Y. Light intensity can be used to modify the growth and morphological characteristics of cannabis during the vegetative stage of indoor production. Ind. Crops Prod. 2022, 183, 114909. [Google Scholar] [CrossRef]
  40. Eaves, J.; Eaves, S.; Morphy, C.; Murray, C. The relationship between light intensity, cannabis yields, and profitability. Agron. J. 2020, 112, 1466–1470. [Google Scholar] [CrossRef]
  41. Xie, K.; Rosentrater, K. Life cycle assessment (LCA) and Techno-economic analysis (TEA) of tilapia-basil aquaponics. In Proceedings of the 2015 ASABE Annual International Meeting, New Orleans, LA, USA, 26–29 July 2015; p. 1. [Google Scholar]
  42. Chen, P.; Zhu, G.; Kim, H.-J.; Brown, P.B.; Huang, J.-Y. Comparative life cycle assessment of aquaponics and hydroponics in the Midwestern United States. J. Clean. Prod. 2020, 275, 122888. [Google Scholar] [CrossRef]
  43. Boxman, S.E.; Zhang, Q.; Bailey, D.; Trotz, M.A. Life cycle assessment of a commercial-scale freshwater aquaponic system. Environ. Eng. Sci. 2017, 34, 299–311. [Google Scholar] [CrossRef]
  44. Lobillo-Eguíbar, J.; Fernández-Cabanás, V.M.; Bermejo, L.A.; Pérez-Urrestarazu, L. Economic sustainability of small-scale aquaponic systems for food self-production. Agronomy 2020, 10, 1468. [Google Scholar] [CrossRef]
  45. Love, D.C.; Fry, J.P.; Genello, L.; Hill, E.S.; Frederick, J.A.; Li, X.; Semmens, K. An international survey of aquaponics practitioners. PLoS ONE 2014, 9, e102662. [Google Scholar] [CrossRef]
  46. Lages Barbosa, G.; Almeida Gadelha, F.D.; Kublik, N.; Proctor, A.; Reichelm, L.; Weissinger, E.; Wohlleb, G.M.; Halden, R.U. Comparison of land, water, and energy requirements of lettuce grown using hydroponic vs. conventional agricultural methods. Int. J. Environ. Res. Public Health 2015, 12, 6879–6891. [Google Scholar] [CrossRef]
  47. Goddek, S.; Delaide, B.; Mankasingh, U.; Ragnarsdottir, K.V.; Jijakli, H.; Thorarinsdottir, R. Challenges of sustainable and commercial aquaponics. Sustainability 2015, 7, 4199–4224. [Google Scholar] [CrossRef]
  48. Cohen, A.; Malone, S.; Morris, Z.; Weissburg, M.; Bras, B. Combined fish and lettuce cultivation: An aquaponics life cycle assessment. Procedia Cirp 2018, 69, 551–556. [Google Scholar] [CrossRef]
  49. Forchino, A.A.; Lourguioui, H.; Brigolin, D.; Pastres, R. Aquaponics and sustainability: The comparison of two different aquaponic techniques using the Life Cycle Assessment (LCA). Aquac. Eng. 2017, 77, 80–88. [Google Scholar] [CrossRef]
  50. Nuwansi, K.; Verma, A.; Chandrakant, M.; Prabhath, G.; Peter, R. Optimization of stocking density of koi carp (Cyprinus carpio var. koi) with gotukola (Centella asiatica) in an aquaponic system using phytoremediated aquaculture wastewater. Aquaculture 2021, 532, 735993. [Google Scholar] [CrossRef]
  51. Hussain, T.; Verma, A.; Tiwari, V.; Prakash, C.; Rathore, G.; Shete, A.; Nuwansi, K. Optimizing koi carp, Cyprinus carpio var. koi (Linnaeus, 1758), stocking density and nutrient recycling with spinach in an aquaponic system. J. World Aquac. Soc. 2014, 45, 652–661. [Google Scholar] [CrossRef]
  52. Jones, B.; Nachtsheim, C.J. Split-plot designs: What, why, and how. J. Qual. Technol. 2009, 41, 340–361. [Google Scholar] [CrossRef]
  53. Altman, N.; Krzywinski, M. Points of significance: Split plot design. Nat. Methods 2015, 12, 165. [Google Scholar] [CrossRef]
  54. Ferrarezi, R.S.; Bailey, D.S. Basil performance evaluation in aquaponics. HortTechnology 2019, 29, 85–93. [Google Scholar] [CrossRef]
  55. Bare, J.C. TRACI: The tool for the reduction and assessment of chemical and other environmental impacts. J. Ind. Ecol. 2002, 6, 49–78. [Google Scholar] [CrossRef]
  56. Pacheco, R.; Silva, C. Global warming potential of biomass-to-ethanol: Review and sensitivity analysis through a case study. Energies 2019, 12, 2535. [Google Scholar] [CrossRef]
  57. Salam, M.; Prodhan, M.; Sayem, S.; Islam, M. Comparative growth performances of taro plant in aquaponics vs other systems. Int. J. Innov. Appl. Stud. 2014, 7, 941. [Google Scholar]
  58. Gebhart, B.; White, M.; Montouri, C.; Karl, V. Comparing Multiple Forms of Light on Different Cultivars of Swiss Chard in an Ebb and Flow Bench Aquaponics System; University of Minnesota Aquaponics: St. Paul, MN, USA, 2015. [Google Scholar]
  59. Delaide, B.; Goddek, S.; Gott, J.; Soyeurt, H.; Jijakli, M.H. Lettuce (Lactuca sativa L. var. Sucrine) growth performance in complemented aquaponic solution outperforms hydroponics. Water 2016, 8, 467. [Google Scholar] [CrossRef]
  60. Suhl, J.; Dannehl, D.; Kloas, W.; Baganz, D.; Jobs, S.; Scheibe, G.; Schmidt, U. Advanced aquaponics: Evaluation of intensive tomato production in aquaponics vs. conventional hydroponics. Agric. Water Manag. 2016, 178, 335–344. [Google Scholar] [CrossRef]
  61. Jordan, R.A.; Ribeiro, E.F.; Oliveira, F.C.d.; Geisenhoff, L.O.; Martins, E.A. Yield of lettuce grown in hydroponic and aquaponic systems using different substrates. Rev. Bras. de Eng. Agrícola e Ambient. 2018, 22, 525–529. [Google Scholar] [CrossRef]
  62. Jaeger, C.; Foucard, P.; Tocqueville, A.; Nahon, S.; Aubin, J. Mass balanced based LCA of a common carp-lettuce aquaponics system. Aquac. Eng. 2019, 84, 29–41. [Google Scholar] [CrossRef]
  63. Bugbee, B. Nutrient management in recirculating hydroponic culture. In Proceedings of the South Pacific Soilless Culture Conference-SPSCC 648, Palmerston North, New Zealand, 10–13 February 2003; pp. 99–112. [Google Scholar]
  64. Colt, J.; Schuur, A.M. Comparison of nutrient costs from fish feeds and inorganic fertilizers for aquaponics systems. Aquac. Eng. 2021, 95, 102205. [Google Scholar] [CrossRef]
  65. Cerozi, B.d.S.; Fitzsimmons, K. Phosphorus dynamics modeling and mass balance in an aquaponics system. Agric. Syst. 2017, 153, 94–100. [Google Scholar] [CrossRef]
  66. Dell, M.v.L.-M. Analysis of the Environmental Impacts of a Hydroponic System with Combined Wastewater Treatment Using Life Cycle Assessment. 2023. Available online: https://www.hypowave.de/fileadmin/user_upload/Ergebnisse/Publikationen/Masterarbeit_Laura-Maria_Dell_HyW_Website.pdf (accessed on 22 June 2024).
  67. Dessus, B.; Le Treut, H.; Laponche, B. Global Warming: The Significance of Methane. 2008. Available online: https://inis.iaea.org/search/search.aspx?orig_q=RN:42007554 (accessed on 22 June 2024).
  68. Hardaker, A.; Styles, D.; Williams, P.; Chadwick, D.; Dandy, N. A framework for integrating ecosystem services as endpoint impacts in life cycle assessment. J. Clean. Prod. 2022, 370, 133450. [Google Scholar] [CrossRef]
  69. Ghamkhar, R.; Hartleb, C.; Wu, F.; Hicks, A. Life cycle assessment of a cold weather aquaponic food production system. J. Clean. Prod. 2020, 244, 118767. [Google Scholar] [CrossRef]
  70. Barone, G.; Storelli, A.; Garofalo, R.; Mallamaci, R.; Storelli, M.M. Residual levels of mercury, cadmium, lead and arsenic in some commercially key species from Italian coasts (Adriatic Sea): Focus on human health. Toxics 2022, 10, 223. [Google Scholar] [CrossRef]
  71. Parker, G.H.; Gillie, C.E.; Miller, J.V.; Badger, D.E.; Kreider, M.L. Human health risk assessment of arsenic, cadmium, lead, and mercury ingestion from baby foods. Toxicol. Rep. 2022, 9, 238–249. [Google Scholar] [CrossRef]
  72. Pietrzak, S.; Wójcik, J.; Baszuk, P.; Marciniak, W.; Wojtyś, M.; Dębniak, T.; Cybulski, C.; Gronwald, J.; Alchimowicz, J.; Masojć, B. Influence of the levels of arsenic, cadmium, mercury and lead on overall survival in lung cancer. Biomolecules 2021, 11, 1160. [Google Scholar] [CrossRef] [PubMed]
  73. Ahmed, M.K.; Baki, M.A.; Islam, M.S.; Kundu, G.K.; Habibullah-Al-Mamun, M.; Sarkar, S.K.; Hossain, M.M. Human health risk assessment of heavy metals in tropical fish and shellfish collected from the river Buriganga, Bangladesh. Environ. Sci. Pollut. Res. 2015, 22, 15880–15890. [Google Scholar] [CrossRef] [PubMed]
  74. Khandaker, M.; Asaduzzaman, K.; Nawi, S.; Usman, A.; Amin, Y.; Daar, E.; Bradley, D.; Ahmed, H.; Okhunov, A. Assessment of radiation and heavy metals risk due to the dietary intake of marine fishes (Rastrelliger kanagurta) from the Straits of Malacca. PLoS ONE 2015, 10, e0128790. [Google Scholar] [CrossRef] [PubMed]
  75. US-EPA. Non-Cancer Screening Approaches for Health Effects. Available online: https://www.epa.gov/tsca-screening-tools/non-cancer-screening-approaches-health-effects (accessed on 21 June 2024).
Figure 1. A schematic of the experimental setup for (a) Hydroponics and (b) Aquaponics Systems.
Horticulturae 11 00588 g001
Figure 2. Interaction Plot Between Date, System, and Leaf Area For LI- (a) 752 µmol/m2/s and (b) 141 µmol/m2/s.
Horticulturae 11 00588 g002
Figure 3. Interaction Plot Between Date, System, and Plant Length For LI- (a) 752 µmol/m2/s and (b) 141 µmol/m2/s.
Horticulturae 11 00588 g003
Figure 4. Boxplot of hemp (a) Leaf area and (b) Plant Length according to LI.
Horticulturae 11 00588 g004
Figure 5. Comparison Between the Midpoint Environmental Impacts of Aquaponics and Hydroponics Systems.
Horticulturae 11 00588 g005
Figure 6. Emission Percentage for Midpoint Indicators by (a) Aquaponic And (b) Hydroponic Systems.
Horticulturae 11 00588 g006
Figure 7. Comparison Between the Endpoint Environmental Impacts of Aquaponics and Hydroponics Systems.
Horticulturae 11 00588 g007
Figure 8. Environmental Profiles of (a) Aquaponic and (b) Hydroponic Systems.
Horticulturae 11 00588 g008
Table 1. Life cycle inventory of aquaponic and hydroponic systems for a year of operation.
Inputs
IngredientsUnitAmountPer FU (Aqua)Per FU (Hydro)
Aqua Fish FeedTotalkg0.900.30-
Soybean mealkg0.270.09-
Ground cornkg0.130.04-
Fishmeal (including meat meal)kg0.360.12-
Wheatkg0.050.02-
NutrientTotal NL0.08-0.04
P2O5L0.04-0.02
K2OL0.23-0.13
MgSO4L0.02-0.01
BiofilterFilter materialkg0.150.050.03
Gravelkg3.851.282.14
Fish TankGlass Aquariumkg136.0845.36-
Hemp Seeds-kg0.140.050.08
Electronic EquipmentIoT deviceskg1.220.410.68
Light bulbskg1.860.621.03
Koi Fish-kg0.850.28-
Polyethylene-kg9.493.165.27
PVC-kg8.852.954.92
Water Usage (aqua)-L151.4250.47-
Water Usage (hydro)-L64.00-35.55
Electricity (aqua)TotalWh172.0057.33-
LightWh43.0014.33-
IoT devicesWh8.582.86-
Water pump motorWh120.4240.14-
Electricity (hydro)TotalWh144.00-80.00
LightWh36.00-20.00
IoT devicesWh7.20-4.00
Water pump motorWh100.80-56.00
Outputs
UnitAquaponicsHydroponics
Mass Producedkg3.01.8
Table 2. Mixed Model Anova Table (Type 3 tests, S-method) for Leaf Area.
Model: ‘Leaf Area’ ~ LI + (1 | LI:Day) + Systems + LI:Systems
EffectdfF Valuep-Value
1Light Intensity (LI)1, 303.57 +0.069
2Systems (Hydroponics and Aquaponics)5, 15034.33 ***<0.001
3LI:Systems5, 15015.25 ***<0.001
Signif. codes: 0 ‘***’ 0.001 ‘**’ 0.01 ‘*’ 0.05 ‘+’ 0.1 ‘ ’ 1.
Table 3. Mixed Model Anova Table (Type 3 tests, S-method) for Plant Length.
Model: ‘Plant Length’ ~ LI + (1 | LI:Day) + Systems + LI:Systems
EffectdfF Valuep-Value
1Light Intensity (LI)1, 427.26 *0.010
2Systems (Hydroponics and Aquaponics)5, 21062.60 ***<0.001
3LI:Systems5, 2107.98 ***<0.001
Signif. codes: 0 ‘***’ 0.001 ‘**’ 0.01 ‘*’ 0.05 ‘+’ 0.1 ‘ ’ 1.
Disclaimer/Publisher’s Note: The statements, opinions and data contained in all publications are solely those of the individual author(s) and contributor(s) and not of MDPI and/or the editor(s). MDPI and/or the editor(s) disclaim responsibility for any injury to people or property resulting from any ideas, methods, instructions or products referred to in the content.

