Article

Characterization and Evolutionary Analyses Reveal Differential Selection Pressures on PGIc and PGIp During Domestication in Castor Bean

1
Key Laboratory for Forest Resource Conservation and Utilization in the Southwest Mountains of China, Ministry of Education, Southwest Forestry University, Kunming 650224, China
2
Key Laboratory of Economic Plants and Biotechnology, Kunming Institute of Botany, Chinese Academy of Sciences, Kunming 650201, China
*
Author to whom correspondence should be addressed.
These authors contributed equally to this work.
Horticulturae 2025, 11(6), 569; https://doi.org/10.3390/horticulturae11060569
Submission received: 22 April 2025 / Revised: 18 May 2025 / Accepted: 21 May 2025 / Published: 23 May 2025
(This article belongs to the Section Medicinals, Herbs, and Specialty Crops)

Abstract

:
Phosphoglucose isomerase (PGI), which catalyzes the interconversion of glucose 6-phosphate (G6P) and fructose 6-phosphate (F6P), plays a key role in regulating carbohydrate synthesis and catabolism in plant growth and development. In higher plants, two PGI isoenzymes, plastidic (PGIp) and cytosolic (PGIc), have diverged significantly in sequence, structure, activity, and functional roles, despite catalyzing the same reaction. However, whether they experience distinct selection pressures during intraspecific population differentiation remains unknown. In this study, we identified the PGIc and PGIp genes in castor beans, an important industrial and horticultural crop, and revealed their different expression patterns across tissues, particularly during seed development. Population genetic analyses (Tajima’s D, ML-HKA, and CODEML) detected strong evidence of positive selection on RcPGIc, but not RcPGIp during domestication. Four positively selected sites in RcPGIc (114T, 310T, 338A, and 613S) were inferred with posterior probabilities > 95% in BEB analysis, and two of them (114T and 613S) were found to be significantly associated with higher seed oil content, suggesting that these two sites could potentially influence oil accumulation in castor seeds. This study provides the first evidence of differential selection pressures on PGIc and PGIp during intraspecific population differentiation, offering new insights into their functional divergence.

1. Introduction

Phosphoglucose isomerase (PGI, EC 5.3.1.9) catalyzing the interconversion of glucose 6-phosphate (G6P) and fructose 6-phosphate (F6P), which occurs at the second step in glycolysis, plays a critical role in both catabolic glycolysis and anabolic gluconeogenesis in plants and is closely linked to energy conversion and the biosynthesis of carbohydrates, oils, and proteins [1,2,3,4]. PGI proteins have two distinct isoforms according to their subcellular locations: cytosolic PGI (PGIc) and plastid PGI (PGIp) [3,5,6]. In chloroplast, PGIp catalyzes the primary photosynthetic product F6P to G6P, providing the substrate for starch synthesis. The PGIp mutant in Arabidopsis resulted in a decrease in starch synthesis, inflorescence growth, and seed yield [7,8]. While, in cytosol, PGIc is involved in sucrose synthesis and glycolysis, and disrupted function of PGIc Arabidopsis plants displayed diminished growth and excess accumulation of starch in chloroplasts but maintained low sucrose content at night [9]. These studies suggested the different functional roles of PGIc and PGIp in regulating plant growth and development.
Although catalyzing the same biochemical reaction, PGIc and PGIp have significantly diverged in amino acid sequences, crystal structure, and activity (including thermal stability, catalytic activity, and substrate binding affinity), with the activity of PGIc more robust than PGIp in wheat, rice, and Arabidopsis [10,11]. The incorporation of wheat (Triticum aestivum) TaPGIc in the chloroplast of an Arabidopsis thaliana pgip mutant resulted in starch overaccumulation, increased CO2 assimilation, and enhanced plant biomass and seed yield productivity [10]. The dramatic difference between PGI isoenzymes suggested that they have experienced different selection pressures during evolution [11]. Studies in several plants, including Arabidopsis thaliana L., Arabidopsis halleri subsp. gemmifera (Matsum.), Festuca ovina L., and Helianthus annuus L., have detected significant evidence for selection on PGIc genes [12,13,14,15]. But similar studies on PGIp are rare. It remains unclear whether the PGIc and PGIp genes within the same species have experienced different selection pressures during population differentiation. And the biological significance of these potential selective forces also requires further investigation. Elucidating these questions is important for us to understand their genetic and functional role differentiation.
The castor bean (Ricinus communis L., 2n = 20) is a versatile plant that has been grown for centuries due to its industrial applications, medicinal properties, and ornamental value. The unique biochemical composition of castor oil, particularly its high ricinoleic acid, makes it valuable for diverse industrial applications, including engine lubricants, biofuels, and coatings [16,17,18]. In addition, the castor bean exhibits remarkable pharmacological potential, with its various plant parts, including seeds, seed oil, leaves, and roots, demonstrating multiple bioactive properties such as antioxidant, anti-inflammatory, antitumor, antinociceptive, and antiasthmatic activities and having high values in both traditional medicine and modern pharmacopeia [19]. In horticultural contexts, the castor bean has gained increasing popularity due to its dual functional and esthetic benefits. The plants’ architectural form, characterized by large palmate leaves, striking red or green pericarps, and a substantial growth habit, provides dramatic visual interest in landscape designs. Additionally, the presence of ricin, a naturally occurring toxic protein, confers pest-resistant qualities, effectively deterring insects, rodents, and other garden pests [20]. This combination of ornamental value and natural pest management has made the castor bean popular among gardeners. Originating from Africa, the plant is now widely grown in many countries and regions worldwide due to its multiple functions, and there is increased demand for creating various castor varieties for industrial, medicinal, and horticultural applications. Due to the importance of PGI genes in regulating plant growth, development, and yield, we identified the PGIp and PGIc genes in castor beans and characterized their expression profiles, genetic variations, selection pressure, and associations of variants to phenotypes in this study. Our research provides us novel insights into understanding the genetic differentiation of PGI genes during plant evolution.

2. Materials and Methods

2.1. Identification of the PGI-Containing Proteins in the Castor Bean Genome

The amino acid sequences of PGIp (AT4G24620.1) and PGIc (AT5G42740.2) from Arabidopsis thaliana were obtained from Ensembl Plants’ Genome Annotation System (http://plants.Ensembl.org/index.html, accessed on 22 July 2023), and they were used as query sequences against the castor bean protein database [21] by running BLASTP with a thread of e-value < 1×10⁻⁵. All protein sequences returned were then checked for the presence of the PGI domain using the SMART (http://smart.emblheidelberg.de/, accessed on 23 July 2023) and InterPro (https://www.ebi.ac.uk/interpro/, accessed on 23 July 2023) databases. Domain architecture analysis was also carried out in SMART. The gene structure analysis was conducted using the GSDS2.0 mapping tool (http://gsds.gao-lab.org/, accessed on 24 July 2023). The subcellular localization of PGI proteins was predicted using WoLF PSORT (https://wolfpsort.hgc.jp/, accessed on 25 July 2023).

2.2. Phylogenetic Analysis of PGI Proteins

Amino acid sequences of PGIp and PGIc from Ricinus communis, Arabidopsis thaliana, Oryza sativa, Glycine max, Zea mays, Solanum tuberosum, Physcomitrium patens, and Pyropia yezoensis were used to constructed the maximum likelihood (ML) phylogenetic trees. PGI proteins of Arabidopsis thaliana, Oryza sativa, Glycine max, Zea mays, Solanum tuberosum, Physcomitrium patens, and Pyropia yezoensis were downloaded from NCBI, with accession numbers listed in Table S1. Initially, multiple sequence alignment was conducted in MAFFT (v7.490) [22]. ML phylogenetic trees were constructed in IQ-TREE (v1.6.12) using the ModelFinder module [23]. The best-fitted model of amino acid substitutions was determined (WAG + G4 model) according to the Bayesian information criterion (BIC). To assess branch support, the IQ-TREE analyses employed ultrafast bootstrap approximation (UFboot) with 10,000 replicates [24] and the approximate likelihood ratio test with 1000 replicates. The result file of the phylogenetic analysis was uploaded to iTOL (https://itol.embl.de/, accessed on 30 July 2023) for landscaping.

2.3. Gene Expression Analysis

To investigate the expression profiles of the castor bean’s PGI genes across different tissues, transcriptome sequencing data that we generated from different tissues such as the leaf, stem, root, pericarp, pollen, embryo, and seeds in a previous study [25,26] were acquired (http://eupdb.liu-lab.com/, accessed on 30 July 2023). The transcripts’ FPKM (Fragments Per Kilobase of exon model per Million mapped fragments) reads were used to represent the expression levels. The seeds of castor bean (Ricinus communis L.) cultivar ZB306 (from Zibo Academy of Agricultural Sciences, Shandong Province, China) were placed in a sterile glass Petri dish lined with two layers of water-saturated filter paper. Germination was conducted in a glasshouse at Southwest Forestry University under controlled conditions: 28 °C and a relative humidity of 45–55%. For qPCR gene expression validation, the root tip samples were collected at 14 DAG (days after germination), and a leaf was collected two weeks after the blade appeared. Pollens were collected from stamens. Developing seed tissues were collected at the development stages from 10 and 30 DAPs (days after pollination): S1: seeds 10 days after pollination, S2: seeds 20 days after pollination, and S3: seeds 30 days after pollination. All collected samples were immediately frozen in liquid nitrogen and stored at −80 °C for RNA extraction. Total RNA was extracted from each tissue using TRIzol followed by the RNeasy Plant Mini Kit (Qiagen, Valencia, CA, USA) according to the manufacturer’s protocol (Qiagen, Valencia, CA, USA). High-quality RNA was used to synthesize the cDNA with TransScript All-in-One First-Strand cDNA Synthesis SuperMix for qPCR (TransGene) following the procedure recommended by the manufacturer (TransGene Biotech Co., Ltd., Beijing, China). The primers for qPCR were designed using software Primer Premier 5 to ensure the specificity of the amplified product, and primer sequences are shown in Table S2. qPCR was carried out in a 20 µL PCR mixture containing 10 µL of the 2X TransStart Tip Green qPCR SuperMix (Transgene Biotech Co., Ltd., Beijing, China), 0.4 µL of the forward primer (10 µM), 0.4 µL of the reverse primer (10 µM), 1 ng of cDNA prepared from different materials, and variable amounts of ddH2O. Gene Rc04G007168, which showed a 50–100 FPKM value with relative small variances among different tissues based on our transcriptomic data, was used as a control to normalize different samples. All assays were performed at least three times from three biological replicates. The relative quantification of specific mRNA levels was performed using the cycle threshold (Ct) 2−ΔΔCT method [27].

2.4. Genetic Diversity and Evolutionary Selection Analysis

To investigate the genetic variation in PGIs in castor beans (Ricinus communis L.), the nucleotide data of RcPGIs were obtained from our genome re-sequencing data [21]. Sixty wild accessions and sixty cultivated accessions (including landraces and cultivars, LC) collected worldwide (Table S3) were included for population genetic diversity analyses. The DNA sequences of each gene of each accession were obtained by replacing SNP sites in the reference genome with the alternative allele using SAMtools (Version 1.10) and BCFtools (Version 1.10.2) [28]. Multiple sequence alignments of nucleotide data were then generated using MAFFT (v7.490) [22]. Estimates of nucleotide polymorphism, including the number of segregating sites (S), θw (from the number of polymorphic segregating sites), π, and Tajima’s D, were obtained using the DNASP software (version 6.12.03) [29].
In the maximum likelihood (ML) version of the Hudson–Kreitman–Aguade (HKA) test [30], the sequence diversity of each PGI gene was compared with that of the neutral genes in our previous studies [31]. First, a strictly neutral model was run, in which all loci were considered to be neutrally evolving, followed by a selection model in which each gene was compared to the neutral genes. These tests were carried out separately for the wild and cultivated datasets. Two times the difference in log-likelihoods of the models was then used in a χ2 test with one degree of freedom for the statistical significance test. The neutral genes were selected based on their Ka/Ks ratios (Ka: the number of nonsynonymous substitutions per nonsynonymous site; Ks: the number of synonymous substitutions per synonymous site), which were approximately equal to 1, in the comparisons of coding regions between the wild and cultivated genomes [31]. Their neutrality has been further confirmed by testing each of the putatively neutral loci against the other neutral loci using the ML-HKA test, and none of them showed evidence of selection, establishing their validity as the control loci for the investigation of selection on the candidate genes [31].
Positive selection was identified using site models in CODEML within the PAML package, and these analyses were conducted in EasyCodeML (Version 1.41) [32]. The CDS sequences of the PGI genes in each accession were retrieved, and six models (M0, M3, M1a, M2a, M7, and M8) were implemented [33,34,35]. The M0 model (null model) assumes a constant nonsynonymous/synonymous substitution rate (dN/dS = ω) across all codons in the gene (ω is constant across codons), while the M3 model (selection model) can be used to test for heterogeneity in selective constraint with 3 discrete ratio classes, ω0, ω1, and ω2, in proportions p0, p1, and p2 (p0 + p1+ p2 = 1), respectively. Model M1a (null model) is a neutral model that allows two classes of sites with ω0 (0 to 1) and ω1 = 1 in proportions p0 and p1 = 1 − p0, respectively, while Model M2a (selection model) is a positive selection model that has an additional class with ω2 > 1 with a proportion p2 of sites (p0 + p1+ p2 = 1). Model M7 (beta) (null model) assumes a beta distribution with parameters p and q to describe variable ω for sites in the range 0 ≤ ω ≤ 1, while in Model M8 (beta& ω) (selection model), a proportion p0 of sites are with ω from beta (p, q) as in M7, but an additional class is added in proportion p1 with ω > 1 [35]. Positive selection is able to be identified by comparing the log-likelihood difference using the likelihood ratio test (LRT) between M0 and M3, M1a and M2a, or M7 and M8. If M0 is rejected, with any ω > 1 in Model 3 supported by significant LRT, positive selection may be concluded. If M1a is rejected, with ω2 > 1 in M2a, positive selection may be concluded. Similarly, positive selection can also be concluded if M7 is rejected and ω > 1 in M8 [34,35]. In the case of positive selection, individual positively selected codons can be identified using a Bayes empirical Bayes (BEB) calculation [36]. Statistics significance for the models was obtained using the likelihood ratio test (LRT). Twice the log-likelihood [2Ln = 2 (L1 − L0)] difference between the two compared models is used in a chi-square test with the degree of freedom set to be the difference in the number of free parameters between the two models.

2.5. Measurements of Seed Oil Content, Weight, and Plant Height

The 120 castor accessions tested were grown in our castor planting base, and their seed oil content, seed weight, and plant height were measured. The seed weight of each accession was represented by the mean weight of seeds from three individuals. The plant height of each accession was represented by the mean of three individuals.
The seed oil content was determined using the MQ-ONE Seed Analyzer (BRUKER, Karlsruhe, Germany) based on nuclear magnetic resonance (NMR) technology. Prior to the analysis, the instrument was calibrated with certified castor bean oil standards. Seed samples were dried at 105 °C to constant weight to eliminate moisture interference. The dried samples were then placed in NMR tubes for the measurement. When exposed to the magnetic field, hydrogen nuclei in the oil molecules aligned and were excited by radiofrequency pulses, generating characteristic NMR signals. The signal amplitude, which correlates directly with oil content, was quantified against the pre-established calibration curve. This method provided rapid, non-destructive, and precise determination of the oil percentage in seeds.

2.6. Association Analysis of Agronomic Traits with Amino Acid Variants

Student’s t-tests were performed on the measured agronomic traits (plant height, seed oil content, and seed weight) between amino acid variants at each positively selected site. Significant statistical results were considered significant associations between agronomic traits and the amino acid variant.

3. Results

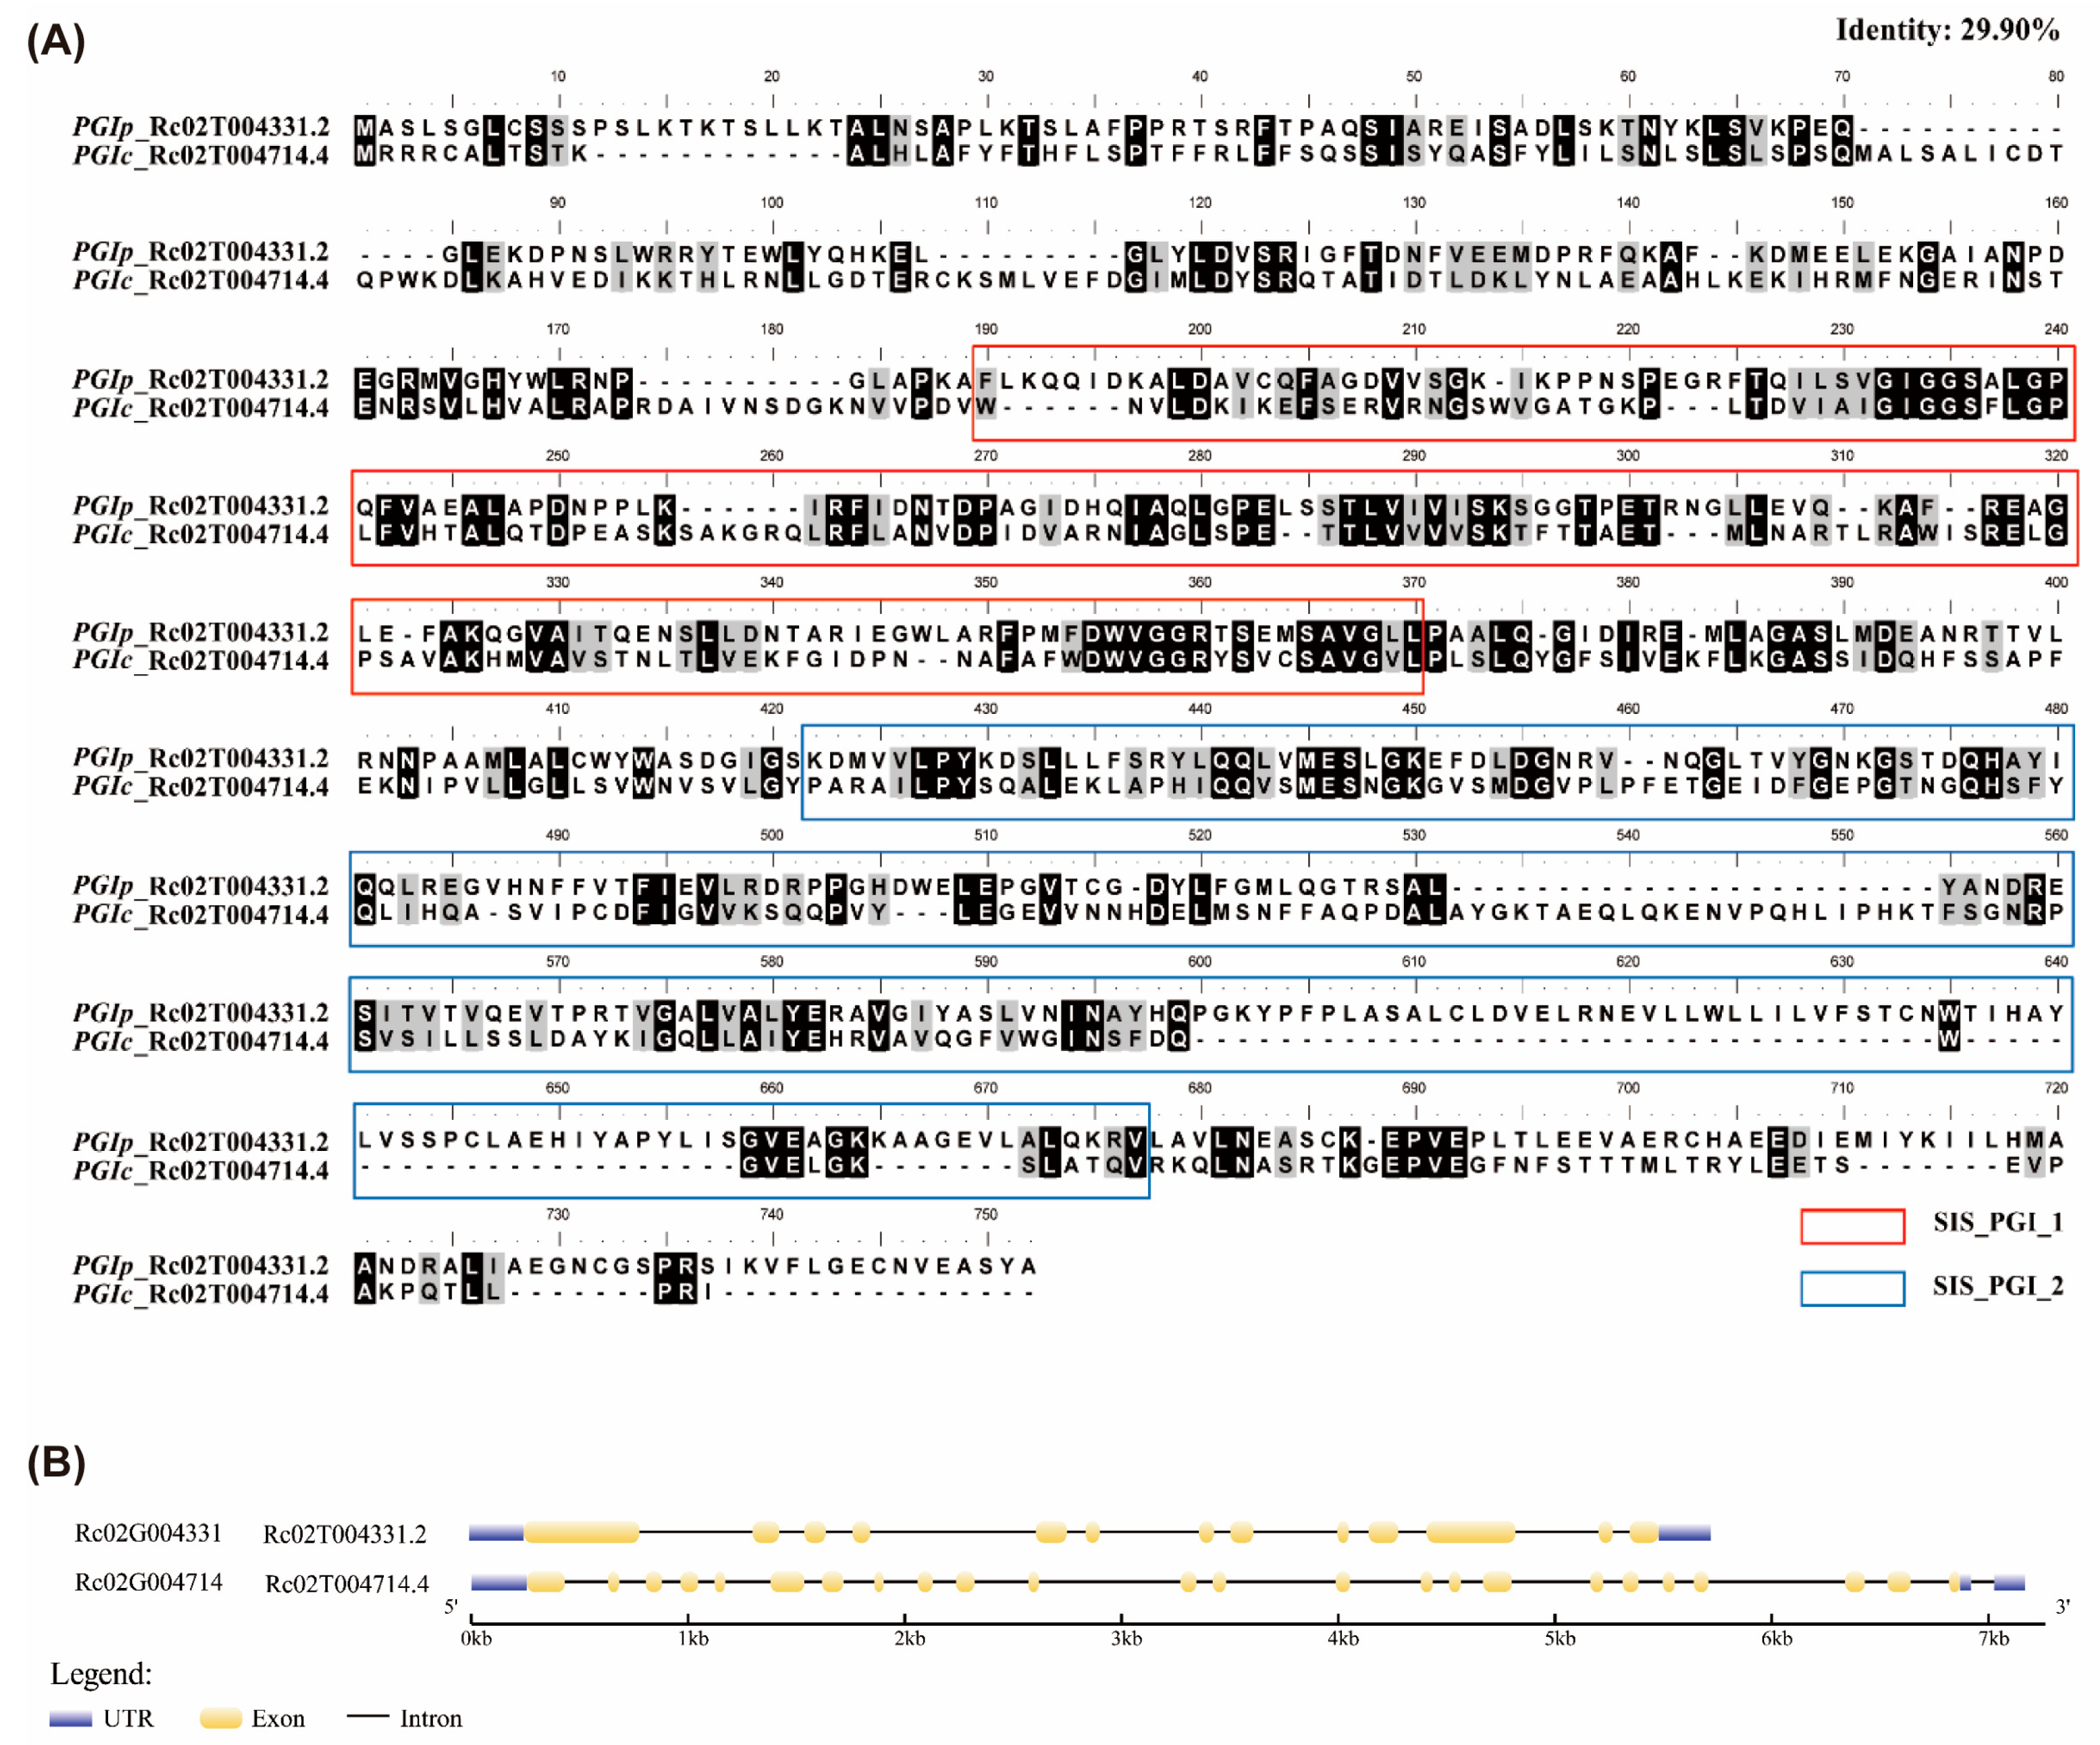
3.1. Identification of RcPGI Proteins

Based on the castor bean genome [21], two PGI proteins (Rc02T004331.2 and Rc02T004714.4) with 676 and 626 amino acids (aa), respectively, were identified (Table 1). The structure analysis revealed that both of the PGI aa sequences contained the two featured function domains SIS-PGI-1 and SIS-PGI-2 and the featured C-terminal domain (CTD) (Figure 1A). However, their amino acid sequences share only 29.90% identity (Figure 1A). Further gene structure analysis also showed a markedly different number and distribution of introns and exons between these two PGIs (Figure 1B, Table 1).
The subcellular localization prediction using WoLF PSORT based on the amino acid sequences reveals that Rc02T004331.2 and Rc02T004714.4 are located in the chloroplast (plastid) and cytosol, respectively, so they are named as RcPGIp (Rc02G004331) and RcPGIc (Rc02G004714), respectively. To verify the prediction of RcPGIp and RcPGIc, we constructed a maximum likelihood (ML) phylogenetic tree using the amino acid of RcPGIp and RcPGIc and identified PGIc and PGIp proteins in other species, including Arabidopsis thaliana, Oryza sativa, Glycine max, Zea mays, Solanum tuberosum, Physcomitrium patens, and Pyropia yezoensis. The ML phylogenetic tree (Figure 2A) demonstrated two well-supported (bootstrap > 90%) groups representing the PGIp and PGIc isoforms (except the single branch of PyPGIc, which showed low bootstrap support), where RcPGIp and RcPGIc were phylogenetically placed within the PGIp and PGIc clades, respectively. The phylogenetic results supported our predicted subcellular localization of RcPGIc (cytosolic) and RcPGIp (plastidic). Moreover, the distinct separation of plastidic and cytosolic PGIs from multiple species suggests that these two PGI isoforms evolved separately.

3.2. Different Expression Profiles of RcPGIc and RcPGIp Across Different Tissues

PGI genes are generally considered constitutively expressed in plant cells. Given their roles in energy conversion and the biosynthesis of carbohydrates, oils, and proteins, we examined their expression patterns across different tissues. We utilized transcriptome data generated from the leaf, stem, root, pollen, and embryo at different stages (S1 to S5) of developing seeds. According to our previous studies, the developing seeds represented five development stages, i.e., the initial stage S1, the early stage S2, the middle stages S3 and S4, and the late stage S5 of seed development [37]. The S1 and S2 stages represented fast seed growth and development and the initial and early stage of oil accumulation; the S3 stages represented fast oil accumulation; the S4 stage represented the late period of oil accumulation, and the S5 stage represented mature seeds [37]. RcPGIp exhibited relatively higher expression levels across all examined tissues except mature seeds (S5 stage), with its peak expression observed in mid-stage (S3) developing seeds (Figure 2B). In contrast, RcPGIc showed the highest expression levels in initial- (S1) and early-stage (S2) developing seeds, with relative lower expression in other tissues (Figure 2B). These expression patterns were consistently validated using RT-qPCR analysis (Figure 2C,D). Together, the transcriptomic and RT-qPCR analyses demonstrated that while both PGI genes are constitutively expressed across tissues, they display different expression patterns across different tissues, especially during seed development: RcPGIp showed high expression nearly throughout the seed development process (except the mature seeds), peaking at the mid stage (S3), whereas high expression of RcPGIc was restricted to the early stages of the developing seed (S1 and S2).

3.3. Variations in Genetic Diversity During Population Differentiation

To investigate the genetic diversity of PGI genes in castor beans during domestication, we utilized the nucleotide sequences of PGIc and PGIp from 120 accessions collected worldwide, including 60 wild accessions as the wild population and 60 landraces and cultivars (LC) as the cultivated populations, based on our genome resequencing dataset [21] (Table S3). In total, 32 single nucleotide polymorphisms (SNPs), with 26 and 6 SNPs occurring in the intron and exon regions, respectively, were identified from the RcPGIp nucleotide sequence across all accessions, resulting in an average of 1 SNP for every 179 bp of DNA sequence; conversely, 40 SNPs, with 31 and 9 SNPs occurring in the intron and exon regions, respectively, were identified from the RcPGIc nucleotide sequence across all accessions, resulting in an average of 1 SNP for every 182 bp of sequence (Table S4). Of the SNPs occurring within exon regions, four SNPs caused non-synonymous substitutions in RcPGIp, and five SNPs caused non-synonymous substitutions in RcPGIc.
The population nucleotide diversity of RcPGIc and RcPGIp was estimated (Table 2). The estimates of total nucleotide diversity (π) were 0.00092 and 0.00117 for RcPGIc and RcPGIp, respectively; Watterson’s θ (θw) values were 0.00103 and 0.00104 for RcPGIc and RcPGIp, respectively. Not surprisingly, π and θw were consistently higher in wild castor beans than in cultivars (RcPGIc: π = 0.00127 vs. 0.0005 and θw = 0.00106 vs. 0.00089; RcPGIp: π = 0.00144 vs. 0.00048 and θw = 0.00086 vs. 0.00049). A similar trend was observed for silent-site diversity (πsil), synonymous diversity (πsyn), and nonsynonymous diversity (πnonsyn), with wild populations exhibiting higher values than cultivars (RcPGIc: πsil = 0.00128 vs. 0.00047, πsyn = 0.0013 vs. 0.00051, and πnonsyn = 0.00119 vs. 0.00062; RcPGIp: πsil = 0.00176 vs. 0.0006, πsyn = 0.00162 vs. 0, and πnonsyn = 0.00056 vs. 0.00016) (Table 2).
To infer the distribution of nucleotide diversity in genes, π and θw were calculated in 300 bp sliding windows along the full-length nucleotide sequence and in 100 bp sliding windows along the coding sequence. As shown in Figure 3A,B, RcPGIp displayed elevated nucleotide polymorphism at the 3′ C-terminal region, whereas RcPGIc showed no apparent bias in polymorphism distribution across its sequence. In addition, we found uneven distribution patterns of nucleotide polymorphism across the CDS regions of both RcPGI genes, which exhibited polymorphism peaks in limited regions (Figure 3C,D).

3.4. Evolutionary Analysis Revealed Different Selection Pressures on RcPGIc and RcPGIp During Population Differentiation

To test whether selection occurs in RcPGI genes during population differentiation, we applied DNA sequence-based Tajima’s D estimate and ML-HKA tests at the gene level (analysis on the whole gene DNA sequence, including both the non-coding region and the coding region). For RcPGIp, we observed a significant positive Tajima’s D value (p < 0.05) and a significant ML-HKA test result (p < 0.05) for the wild population (Table 2), suggesting significant departures from the neutrality of RcPGIp during population differentiation. For RcPGIc, lower nucleotide diversity was observed in the LC population than in the wild population, and this resulted in a positive Tajima’s D value and an extremely significant ML-HKA test result for the LC population (p < 0.01) (Table 2), suggesting a bias toward selection during domestication. These results suggested significant gene DNA sequence-based evidence of selection during population differentiation in both RcPGIp and RcPGIc.
Natural selection acts primarily at the protein level, which always leads to synonymous and nonsynonymous mutations under very different selective pressures that are fixed at different rates [35]. Thus, with the synonymous rate serving as a reference, we can know whether the fixation of nonsynonymous mutations in the population is accelerated or decelerated due to natural selection [35]. A gene with an accelerated nonsynonymous substitution rate, as indicated by a nonsynonymous/synonymous rate ratio of dN/dS > 1, is said to be under positive selection [35]. To investigated whether positive selection acts on RcPGIs at the protein level, the complete CDSs (encoding amino acids) of RcPGIp and RcPGIc, respectively, were analyzed using codon-substitution models in CODEML [38]. The site models in CODEML, which allow for the nonsynonymous/synonymous rate ratio ω (ω = dN/dS) to vary among sites (codons), were selected for analysis, and positive selection is defined as the presence of some codons at ω > 1. A likelihood ratio test (LRT) is performed to compare a null model that does not allow for any codons with ω > 1 against a more general model that does.
As shown in Table 3, no significant evidence of positive selection in the CDS region in RcPGIp was detected through the LRTs of M3 vs. M0, M2a vs. M1a, or M8 vs. M7 (p > 0.05). Combined with the results that significant signatures of selection at the gene’s DNA sequence level were only detected in RcPGIp from the wild population (Table 2), this gene may not have undergone positive selection during domestication.
For RcPGIc, the LRT of M3 (discrete model) against M0 (one-ratio model) indicated significant positive selection affecting 0.79% of the sites (p2 = 0.00789 and ω2 = 77.09957; LRT: p < 0.0001). Consistent results were obtained in the M2a (positive selection model) vs. M1a (nearly neutral model) comparison, with the same proportion (0.79%) of sites under positive selection (p2 = 0.00789 and ω2 = 77.07921; LRT: p < 0.0001). Similarly, the M8 (beta + ω > 1) vs. M7 (beta-only) comparison supported positive selection at 0.79% of the sites (p1 = 0.00789 and ω1 = 77.09957; LRT: p < 0.0001). Subsequent Bayes Empirical Bayes (BEB) analysis under the M8 model provided strong evidence for four sites (114T, 310T, 338A, and 613S) under positive selection, with the posterior probabilities (PPs) for ω > 1 over 95% (Table 3). The consistent estimates of positively selected sites across the three independent LRTs (M3/M0, M2a/M1a, and M8/M7), with all showing the same proportion of sites (0.79%) with extremely high ω values (ω > 77), together with four positive selected sites (114T, 310T, 338A, and 613S) with >95% PP support for ω > 1 inferred via the BEB calculation (Table 3), a positive Tajima’s D value, and the significant MK-HKA results (Table 2) in the LC population, suggests strong evidence for sites under positive selection in RcPGIc during domestication.
The four detected positive selected sites in RcPGIc are further mapped onto the protein structures, and the results showed that 310T/K and 338A/S are located at the SIS-PGI-1 domain, whereas 114T/Q and 613L/S are located at the N- and C-terminal domains, respectively (Figure S1).
Given the known functional role of PGIc in regulating plant growth and development, as well as its influence on crop yield and biomass, we analyzed the associations between amino acid variants at the four positively selected sites (114T, 310T, 338A, and 613S) in RcPGIc and three key agronomic traits: plant height, seed weight, and seed oil content. Statistical analysis revealed that the threonine (T) variants at the 114T/Q site were significantly associated with higher seed oil content compared to the glutamine (Q) variants (Student’s t-test: p = 0.0102). Moreover, the serine (S) variants at the 613L/S site showed significantly elevated oil content relative to the leucine (L) variants (Student’s t-test: p = 0.00035) (Figure 3E). These findings provide evidence that the positively selected amino acid variants in RcPGIc, particularly 114T and 613S, are likely associated with enhanced seed oil accumulation, suggesting their potential functional importance in lipid biosynthesis pathways.

4. Discussion

PGI is well known for its involvement in the glycolysis process in bacteria, animals, and plants, therefore regulating energy conversion and biosynthesis in various biological processes. In higher plants, plastidic and cytosolic PGIs have diverged significantly in sequence, structure, phylogeny, activity, and functional roles, despite catalyzing the same reaction [7,8,9,10,11,39]. But research into the selection pressures acting on them and driving their differentiation is limited. And whether they have experienced different selection pressures within the same species during population differentiation remains unclear. In this study, we identified the PGIp and PGIc genes in castor beans and further characterized their expression patterns across tissues and selection pressures during population differentiation, providing novel insights into understanding the divergence of PGIc and PGIp in plants.
The expression profiles reveal that both PGI genes are constitutively expressed, but they still present dramatic differences in expression patterns across tissues, especially during seed development. RcPGIp showed relative high expression nearly across all examined tissues and throughout the seed developing stages, except in mature seeds, suggesting its fundamental roles in maintaining metabolic processes within plastids across multiple tissues. Similar expression patterns have also been reported in Arabidopsis, which was found due to the involvement of PGIp in coordinating primary carbohydrate accumulation and growth- and development-related secondary isoprenoid metabolism in plastids [8,40]. In contrast, high expression of RcPGIc was restricted to the early stages (S1 and S2) of developing seeds, when seed development and oil accumulation start [37]. PGIc has been found to play a vital role in carbohydrate partitioning, which is indispensable for organogenesis and tissue differentiation [41,42]. Therefore, the higher expression of RcPGIc at the early stages of developing seeds may be due to its essential roles in initiating seed development and oil accumulation in castor beans. The difference in expression patterns between RcPGIp and RcPGIc reflected their different roles in regulating plant growth and seed development in castor beans.
In view of this, it is interesting to explore whether they have experienced different selection pressures during population differentiation, especially domestication, in castor beans. To elucidate this issue, we conducted gene DNA sequence-based Tajima’s D estimates, ML-HKA tests, and amino acid codon-based CODEML analysis on both RcPGI genes. For RcPGIp, statistically significant evidence of departures from neutrality was detected in Tajima’s D and ML-HKA tests, but this signature was exclusively observed in the wild population and was absent in the cultivated population. Combined with the CODEML results that no significant evidence of positive selection was inferred at this locus, RcPGIp likely escaped domestication-related selective pressures in castor beans. For RcPGIc, statistically significant evidence of departures from neutrality in the cultivated population was detected in Tajima’s D and ML-HKA tests. Further CODEML analysis provided strong evidence of positive selection in RcPGIc, which was supported by significant LRT results in three model comparisons (M3 vs. M0, M2a vs. M1a, and M8 vs. M7), as well as four positive selected sites (114T, 310T, 338A, and 613S) inferred under the selection model M8 in BEB analysis with posterior probabilities > 95%. These results together strongly suggested that RcPGIc has experienced positive selection during domestication in castor beans. In summary, these results revealed that RcPGIc has experienced positive selection during domestication in castor beans, while RcPGIp has not, suggesting that the two RcPGI genes have experienced differential selection pressures during population differentiation.
Previous studies have also detected significant evidence of selection on PGIc in Arabidopsis thaliana, Arabis gemmifera, Helianthus annuus, and Festuca ovina [12,13,14,15], but these selection analyses were all conducted at the gene’s DNA sequence level but not at the protein level, and whether positive selection at the protein level occurred on their PGIc genes remains unclear. In addition, studies on selection pressure in PGIp are rare. Our study provides the first case for positive selection on PGIc at the protein level, as well as the first case for differential selection pressures acting on PGIc and PGIp during population differentiation in plants. These findings will provide researchers novel insights into understanding the evolutionary patterns of PGIc and PGIp during population differentiation.
The structural mapping of the four inferred positive selected sites in RcPGIc (114T, 310T, 338A, and 613S) revealed that 310T/K and 338A/S are located at the SIS-PGI domain 1, whereas 114T/Q and 613L/S are located at the N- and C-terminal domains, respectively. Further association analysis with agronomic traits revealed that the 114T (in the N-terminal domain) and 613S (in the C-terminal domain) variants were significantly associated with higher seed oil content. Studies in wheat reveal that the functional units of PGIc and PGIp are homodimers, and the C-terminal domains play essential roles in stabilizing the dimer, with hydrophilic serine sites in the C-terminal domain in TaPGIc playing important roles for the establishment and stabilization of homodimers [10,11]. Therefore, the hydrophilic serine (S) substitution at the 613 site in the C-terminal domain of RcPGIc, which replaces hydrophobic leucine (L), may enhance dimer stability and potentially facilitate seed oil accumulation. While the structural basis for the association between the 114T substitution at the N-terminal domain in RcPGIc and increased seed oil content remains poorly understood, the observed correlation between both substitutions (T114 and S613) with elevated seed oil content implies their potential role in enhancing this agriculturally important trait. This pattern is consistent with positive selection acting on these loci during domestication to improve seed oil production. Since only three traits (plant height, seed weight, and seed oil content) were associated with the four selected sites (114T, 310T, 338A, and 613S), the phenotypic effects of the 310T and 338A substitutions remain uncharacterized and need further studies.

5. Conclusions

In this study, we identified two PGI genes, RcPGIc and RcPGIp, in castor beans and revealed different expression patterns across tissues between these two genes. Gene DNA sequence-based Tajima’s D estimates, ML-HKA tests, and codon-based CODEML analysis provide strong evidence of positive selection on RcPGIc, whereas no evidence of positive selection on RcPGIp during domestication in castor beans was found, suggesting that differential selection pressures have acted on them during population differentiation. Furthermore, four positively selected sites in RcPGIc (114T, 310T, 338A, and 613S) were inferred with posterior probabilities > 95% in the BEB analysis. Notably, two amino acid substitutions (114T and 613S) were found to be significantly associated with higher seed oil content, suggesting that these two sites could potentially influence oil accumulation in castor seeds. To our knowledge, this is the first report of differential selection pressures on PGIc and PGIp within the same species during population differentiation, which provide us novel insights into understanding genetic differentiation between PGIc and PGIp in plants. The identified positively selected sites in RcPGIc provide valuable information for genetic improvement or molecular markers in breeding castor bean varieties for industrial or horticultural applications.

Supplementary Materials

The following supporting information can be downloaded at https://www.mdpi.com/article/10.3390/horticulturae11060569/s1. Table S1. Accession numbers and descriptions of PGI proteins in NCBI database. Table S2. Primer sequences used in RT-qPCR. Table S3. The germplasm, accession number, geographical origin, plant height and oil content of castor bean used in this study. Table S4. Summary of single nucleotide polymorphisms (SNPs) in PGI genes among 120 castor bean accessions. Figure S1. The location of selected amino acid sites (red framed) in RcPGIc.

Author Contributions

Conceptualization, A.L.; methodology, J.G., L.J., A.Y. and B.H.; investigation, L.J.; data analysis, J.G. and L.J.; data curation, A.L. and B.H.; writing of the article text, A.L. and J.G.; funding acquisition, A.L. and A.Y.; project administration, A.L. All authors have read and agreed to the published version of the manuscript.

Funding

This work was financially supported by the National Natural Science Foundation of China (32261143461, 32360475 and 32372135).

Data Availability Statement

The original contributions presented in this study are included in the article/Supplementary Materials. Further inquiries can be directed to the corresponding author.

Conflicts of Interest

The authors declare no conflicts of interest.

References

  1. Kunz, H.-H.; Häusler, R.E.; Fettke, J.; Herbst, K.; Niewiadomski, P.; Gierth, M.; Bell, K.; Steup, M.; Flügge, U.I.; Schneider, A. The role of plastidial glucose-6-phosphate/phosphate translocators in vegetative tissues of Arabidopsis thaliana mutants impaired in starch biosynthesis. Plant Biol. 2010, 12, 115–128. [Google Scholar] [CrossRef] [PubMed]
  2. Santelia, D.; Zeeman, S.C. Progress in Arabidopsis starch research and potential biotechnological applications. Curr. Opin. Biotechnol. 2011, 22, 271–280. [Google Scholar] [CrossRef] [PubMed]
  3. Schleucher, J.; Vanderveer, P.; Markley, J.L.; Sharkey, T.D. Intramolecular deuterium distributions reveal disequilibrium of chloroplast phosphoglucose isomerase. Plant Cell Environ. 1999, 22, 525–533. [Google Scholar] [CrossRef]
  4. Vanderwall, M.; Gendron, J.M. HEXOKINASE1 and glucose-6-phosphate fuel plant growth and development. Development 2023, 150, dev202346. [Google Scholar] [CrossRef]
  5. Kunz, B.A.; Ayre, B.G.; Downes, A.M.; Kohalmi, S.E.; McMaster, C.R.; Peters, M.G. Base-pair substitutions alter the site-specific mutagenicity of UV and MNNG in the SUP4-o gene of yeast. Mutat. Res. Lett. 1989, 226, 273–278. [Google Scholar] [CrossRef]
  6. Weise, S.E.; Liu, T.; Childs, K.L.; Preiser, A.L.; Katulski, H.M.; Perrin-Porzondek, C.; Sharkey, T.D. Transcriptional Regulation of the Glucose-6-Phosphate/Phosphate Translocator 2 Is Related to Carbon Exchange Across the Chloroplast Envelope. Front. Plant Sci. 2019, 10, 827. [Google Scholar] [CrossRef]
  7. Yu, T.-S.; Lue, W.-L.; Wang, S.-M.; Chen, J. Mutation of Arabidopsis Plastid Phosphoglucose Isomerase Affects Leaf Starch Synthesis and Floral Initiation. Plant Physiol. 2000, 123, 319–326. [Google Scholar] [CrossRef]
  8. Bahaji, A.; Almagro, G.; Ezquer, I.; Gámez-Arcas, S.; Sánchez-López, Á.M.; Muñoz, F.J.; Barrio, R.J.; Sampedro, M.C.; Diego, N.D.; Spíchal, L.; et al. Plastidial Phosphoglucose Isomerase is an Important Determinant of Seed Yield through its Involvement in Gibberellin-mediated Reproductive Development and Storage Reserve Biosynthesis in Arabidopsis. Plant Cell 2018, 30, 2082–2098. [Google Scholar] [CrossRef]
  9. Kunz, H.-H.; Zamani-Nour, S.; Häusler, R.E.; Ludewig, K.; Schroeder, J.I.; Malinova, I.; Fettke, J.; Flügge, U.-I.; Gierth, M. Loss of cytosolic phosphoglucose isomerase affects carbohydrate metabolism in leaves and is essential for fertility of Arabidopsis. Plant Physiol. 2014, 166, 753–765. [Google Scholar] [CrossRef]
  10. Gao, F.; Zhang, H.; Zhang, W.; Wang, N.; Zhang, S.; Chu, C.; Liu, C. Engineering of the cytosolic form of phosphoglucose isomerase into chloroplasts improves plant photosynthesis and biomass. New Phytol. 2021, 231, 315–325. [Google Scholar] [CrossRef]
  11. Jiao, J.; Gao, F.; Liu, J.; Lv, Z.; Liu, C. A structural basis for the functional differences between the cytosolic and plastid phosphoglucose isomerase isozymes. PLoS ONE 2022, 17, e0272647. [Google Scholar] [CrossRef] [PubMed]
  12. Kawabe, A.; Yamane, K.; Miyashita, N.T. DNA polymorphism at the cytosolic phosphoglucose isomerase (PgiC) locus of the wild plant Arabidopsis thaliana. Genetics 2000, 156, 1339–1347. [Google Scholar] [CrossRef] [PubMed]
  13. Liu, A.; Burke, J.M. Patterns of Nucleotide Diversity in Wild and Cultivated Sunflower. Genetics 2006, 173, 321–330. [Google Scholar] [CrossRef]
  14. Kawabe, A.; Miyashita, N.T. DNA Polymorphism in Active Gene and Pseudogene of the Cytosolic Phosphoglucose Isomerase (PgiC) Loci in Arabidopsis halleri ssp. gemmifera. Mol. Biol. Evol. 2003, 20, 1043–1050. [Google Scholar] [CrossRef]
  15. Li, Y.; Hansson, B.; Ghatnekar, L.; Prentice, H.C. Contrasting patterns of nucleotide polymorphism suggest different selective regimes within different parts of the PgiC1 gene in Festuca ovina L. Hereditas 2017, 154, 11. [Google Scholar] [CrossRef]
  16. Lima Da Silva, N.; Maciel, M.R.W.; Batistella, C.B.; Filho, R.M. Optimization of biodiesel production from castor oil. Appl. Biochem. Biotechnol. 2006, 130, 405–414. [Google Scholar] [CrossRef]
  17. Ogunniyi, D.S. Castor oil: A vital industrial raw material. Bioresour. Technol. 2006, 97, 1086–1091. [Google Scholar] [CrossRef]
  18. Patel, V.R.; Dumancas, G.G.; Viswanath, L.C.K.; Maples, R.; Subong, B.J.J. Castor Oil: Properties, Uses, and Optimization of Processing Parameters in Commercial Production. Lipid Insights 2016, 9, 1–12. [Google Scholar] [CrossRef] [PubMed]
  19. Singh, R.; Geetanjali. Phytochemical and Pharmacological Investigations of Ricinus communis Linn. Alger. J. Nat. Prod. 2015, 3, 120–129. [Google Scholar]
  20. Rao, M.S.; Rao, C.R.; Srinivas, K.; Pratibha, G.; Sekhar, S.V.; Vani, G.S.; Venkateswarlu, B. Intercropping for Management of Insect Pests of Castor, Ricinus communis, in the Semi-Arid Tropics of India. J. Insect Sci. 2012, 12, 14. [Google Scholar]
  21. Xu, W.; Wu, D.; Yang, T.; Sun, C.; Wang, Z.; Han, B.; Wu, S.; Yu, A.; Chapman, M.A.; Muraguri, S.; et al. Genomic insights into the origin, domestication and genetic basis of agronomic traits of castor bean. Genome Biol. 2021, 22, 113. [Google Scholar] [CrossRef] [PubMed]
  22. Katoh, K.; Standley, D.M. MAFFT multiple sequence alignment software version 7: Improvements in performance and usability. Mol. Biol. Evol. 2013, 30, 772–780. [Google Scholar] [CrossRef] [PubMed]
  23. Nguyen, L.-T.; Schmidt, H.A.; von Haeseler, A.; Minh, B.Q. IQ-TREE: A Fast and Effective Stochastic Algorithm for Estimating Maximum-Likelihood Phylogenies. Mol. Biol. Evol. 2014, 32, 268–274. [Google Scholar] [CrossRef] [PubMed]
  24. Minh, B.Q.; Nguyen, M.A.T.; von Haeseler, A. Ultrafast Approximation for Phylogenetic Bootstrap. Mol. Biol. Evol. 2013, 30, 1188–1195. [Google Scholar] [CrossRef]
  25. Han, B.; Wu, D.; Zhang, Y.; Li, D.Z.; Xu, W.; Liu, A. Epigenetic regulation of seed-specific gene expression by DNA methylation valleys in castor bean. BMC Biol. 2022, 20, 57. [Google Scholar] [CrossRef]
  26. Han, B.; Li, Y.; Wu, D.; Li, D.-Z.; Liu, A.; Xu, W. Dynamics of imprinted genes and their epigenetic mechanisms in castor bean seed with persistent endosperm. New Phytol. 2023, 240, 1868–1882. [Google Scholar] [CrossRef]
  27. Livak, K.J.; Schmittgen, T.D. Analysis of Relative Gene Expression Data Using Real-Time Quantitative PCR and the 2−ΔΔCT Method. Methods 2001, 25, 402–408. [Google Scholar] [CrossRef]
  28. Danecek, P.; Bonfield, J.K.; Liddle, J.; Marshall, J.; Ohan, V.; Pollard, M.O.; Whitwham, A.; Keane, T.; McCarthy, S.A.; Davies, R.M.; et al. Twelve years of SAMtools and BCFtools. GigaScience 2021, 10, giab008. [Google Scholar] [CrossRef]
  29. Rozas, J.; Ferrer-Mata, A.; Sánchez-DelBarrio, J.C.; Guirao-Rico, S.; Librado, P.; Ramos-Onsins, S.; Sánchez-Gracia, A. DnaSP 6: DNA Sequence Polymorphism Analysis of Large Data Sets. Mol. Biol. Evol. 2017, 34, 3299–3302. [Google Scholar] [CrossRef]
  30. Wright, S.I.; Charlesworth, B. The HKA Test Revisited: A Maximum-Likelihood-Ratio Test of the Standard Neutral Model. Genetics 2004, 168, 1071–1076. [Google Scholar] [CrossRef]
  31. Xu, W.; Yang, T.; Qiu, L.; Chapman, M.A.; Li, D.Z.; Liu, A. Genomic analysis reveals rich genetic variation and potential targets of selection during domestication of castor bean from perennial woody tree to annual semi-woody crop. Plant Direct 2019, 3, e00173. [Google Scholar] [CrossRef] [PubMed]
  32. Gao, F.; Chen, C.; Arab, D.; Du, Z.; He, Y.; Ho, S.Y.W. EasyCodeML: A visual tool for analysis of selection using CodeML. Ecol. Evol. 2019, 9, 3891–3898. [Google Scholar] [CrossRef] [PubMed]
  33. Yang, Z. Complexity of the Simplest Phylogenetic Estimation. Proc. Biol. Sci. 2000, 267, 109–116. [Google Scholar] [CrossRef] [PubMed]
  34. Wong, W.S.W.; Yang, Z.; Nick Goldman, R.N. Accuracy and power of statistical methods for detecting adaptive evolution in protein coding sequences and for identifying positively selected sites. Genetics 2004, 168, 1041–1051. [Google Scholar] [CrossRef] [PubMed]
  35. Álvarez-Carretero, S.; Kapli, P.; Yang, Z. Beginner’s Guide on the Use of PAML to Detect Positive Selection. Mol. Biol. Evol. 2023, 40, msad041. [Google Scholar] [CrossRef]
  36. Yang, Z.; Wong, W.S.W.; Nielsen, R. Bayes empirical bayes inference of amino acid sites under positive selection. Mol. Biol. Evol. 2005, 22, 1107–1118. [Google Scholar] [CrossRef]
  37. Tan, Q.; Han, B.; Haque, M.E.; Li, Y.-L.; Wang, Y.; Wu, D.; Wu, S.-B.; Liu, A.-Z. The molecular mechanism of WRINKLED1 transcription factor regulating oil accumulation in developing seeds of castor bean. Plant Divers. 2023, 45, 469–478. [Google Scholar] [CrossRef]
  38. Yang, Z. PAML: A program package for phylogenetic analysis by maximum likelihood. Comput. Appl. Biosci. Cabios 1997, 13, 555–556. [Google Scholar] [CrossRef]
  39. Chen, L.; Kuai, P.; Lu, J.; Li, L.; Lou, Y. A Cytosolic Phosphoglucose Isomerase, OsPGI1c, Enhances Plant Growth and Herbivore Resistance in Rice. Int. J. Mol. Sci. 2025, 26, 169. [Google Scholar] [CrossRef]
  40. Bahaji, A.; Sánchez-López, Á.M.; Diego, N.D.; Muñoz, F.J.; Baroja-Fernández, E.; Li, J.; Ricarte-Bermejo, A.; Baslam, M.; Aranjuelo, I.; Almagro, G.; et al. Plastidic Phosphoglucose Isomerase Is an Important Determinant of Starch Accumulation in Mesophyll Cells, Growth, Photosynthetic Capacity, and Biosynthesis of Plastidic Cytokinins in Arabidopsis. PLoS ONE 2015, 10, e0119641. [Google Scholar] [CrossRef]
  41. Preiser, A.L.; Banerjee, A.; Weise, S.E.; Renna, L.; Brandizzi, F.; Sharkey, T.D. Phosphoglucoisomerase Is an Important Regulatory Enzyme in Partitioning Carbon out of the Calvin-Benson Cycle. Front. Plant Sci. 2020, 11, 580726. [Google Scholar] [CrossRef] [PubMed]
  42. Liu, H.-C.; Chen, H.-C.; Huang, T.-H.; Lue, W.-L.; Chen, J.; Suen, D.-F. Cytosolic phosphoglucose isomerase is essential for microsporogenesis and embryogenesis in Arabidopsis. Plant Physiol. 2023, 191, 177–198. [Google Scholar] [CrossRef] [PubMed]
Figure 1. (A) Structure features of PGI proteins in castor beans. (B) The gene structure of PGIs in castor beans.
Horticulturae 11 00569 g001
Figure 2. (A) ML phylogenetic tree of PGI proteins from Ricinus communis, Arabidopsis thaliana, Oryza sativa, Glycine max, Zea mays, Solanum tuberosum, Physcomitrium patens, and Pyropia yezoensis using the WAG + G4 model; the branches labeled by light gray circles indicate > 50% SH-like support of the approximate likelihood ratio test (SH-aLRT) and over 60% ultrafast bootstrap support. (B) Expression profiles of RcPGIp and RcPGIc across different tissues; expression is based on the FPKM values. (C,D) Relative expression of RcPGIp (C) and RcPGIc (D) in RT-qPCR analysis; the gene expression levels were normalized to 1. Error bars indicate the standard error of the mean; Student’s t-test is applied for the statistical analysis; ** p < 0.01. GraphPad Prism (version 8.0.2) was used to create the histograms.
Horticulturae 11 00569 g002
Figure 3. (AD) Moving sum plot of nucleotide diversity (π and θ) for RcPGIp and RcPGIc along the whole gene (A,B) and exon regions (C,D); π and θ were estimated in a 300 bp sliding window along the whole gene and in a 100 bp sliding window along exon regions; OriginPro (Version 2021b) was used to create the moving sum plot. (E) Association analysis of amino acid variants in RcPGIc with agronomic traits (plant height, seed oil content, and seed weight); Student’s t-test is applied for the statistical analysis; ns, not significant; * p < 0.05; ** p < 0.01. GraphPad Prism (version 8.0.2) was used to create the histograms.
Horticulturae 11 00569 g003
Table 1. Genetic information of the identified PGI genes in the castor genome.
Protein IDGene IDProtein Length (aa)Gene Length (bp)Exon No.Intron No.
Rc02T004331.2 (RcPGIp)Rc02G00433167657291312
Rc02T004714.4 (RcPGIc)Rc02G00471462672612423
Table 2. Summary of nucleotide diversity (π, θw), Tajima’s D, and the ML-HKA test at PGI genes in castor beans.
Gene_IDPopulationθwππsilπsynπnonsynπnonsynsynTajima’s Dp-Value in the ML-HKA Test
Rc02G004331Total0.001040.001170.001450.000970.000420.432990.36572-
(RcPGIp)LC0.000490.000480.000600.00016-−0.04090.1386
Wild0.000860.001440.001760.001620.000560.345682.1135 *0.0210 *
Rc02G004714Total0.001030.000920.000910.000930.0011.07527−0.30889-
(RcPGIc)LC0.000890.00050.000470.000510.000621.215691.412910.0074 **
Wild0.001060.001270.001280.00130.001190.915380.619030.1738
* p < 0.05 and ** p < 0.01. Comparisons that are significant according to Tajima’s D and ML-HKA tests are indicated in bold. -, no data.
Table 3. Parameter estimates and likelihood values for RcPGIs using different models implemented in EasyCodeML.
Protein NameModelLn LEstimates of ParametersModel ComparedLRT p-ValuePositive Sites
RcPGIpM3 (discrete)−2786.800012p0 = 0.98946, p1 = 0.00002, p2 = 0.01053; ω0 = 0.00000, ω1 = 0.00000, ω2 = 76.79742M0 vs. M30.076124393Not Allowed
M0 (one-ratio)−2791.029762ω0 = 0.56896
M2a (Selection)−2786.801929p0 = 0.98947, p1 = 0.00000, p2 = 0.01053; ω2 = 76.81691 (ω0 = 0.00000, ω1 = 1.00000)M1a vs. M2a0.033215455Not Allowed
M1a (Neutral)−2790.206669p0 = 0.65994, p1 = 0.34006; ω0 = 0.00000, ω1 = 1.00000
M8 (beta and ω)−2786.799758p0 = 0.98947, p1 = 0.01053; p = 0.00500, q = 1.64348; ω1= 76.78703M7 vs. M80.0331180779 S Pr = 0.575, 107 N Pr = 0.870, 292 D Pr = 0.569, 537 C Pr = 0.567
M7 (beta)−2790.207434p = 0.03048, q = 0.06257
RcPGIcM3 (discrete)−2625.365411p0 = 0.98663, p1 = 0.00549, p2 = 0.00789; ω0 = 0.00000, ω1 = 0.00000, ω2 = 77.09957M0 vs. M30.000000121Not Allowed
M0 (one-ratio)−2644.286875ω0 = 0.42373
M2a (Selection)−2625.365469p0 = 0.99211, p1 = 0.00000, p2 = 0.00789; ω2 = 77.07921 (ω0 = 0.00000, ω1 = 1.00000)M1a vs. M2a0.000002433Not Allowed
M1a (Neutral)−2638.291883p0 = 0.88274, p1 = 0.11726; ω0 = 0.00000, ω1 = 1.00000
M8 (beta and ω)−2625.365392p0 = 0.99211, p1= 0.00789; p = 0.00500, q = 1.48765; ω1= 77.10353M7 vs. M80.000000462114 T Pr = 0.977 *, 310 T Pr = 0.978 *, 338 A Pr = 0.976 *, 613 S Pr = 0.979 *
M7 (beta)−2639.953038p = 0.00526, q = 0.01852
* posterior probabilities > 95%.
Disclaimer/Publisher’s Note: The statements, opinions and data contained in all publications are solely those of the individual author(s) and contributor(s) and not of MDPI and/or the editor(s). MDPI and/or the editor(s) disclaim responsibility for any injury to people or property resulting from any ideas, methods, instructions or products referred to in the content.

