Article

Terpene Synthase (TPS) Family Member Identification and Expression Pattern Analysis in Flowers of Dendrobium chrysotoxum

1
Guangxi Key Laboratory of Plant Functional Phytochemicals and Sustainable Utilization, Guangxi Institute of Botany, Guangxi Zhuang Autonomous Region and Chinese Academy of Sciences, Guilin 541006, China
2
Guangxi Zhuang Autonomous Region Forestry Research Institute, No. 23 Yongwu Road, Nanning 530022, China
3
Environmental Horticulture Research Institute, Guangdong Academy of Agricultural Sciences/Guangdong Provincial Key Lab of Ornamental Plant Germplasm Innovation and Utilization, Guangzhou 510640, China
*
Authors to whom correspondence should be addressed.
These authors contributed equally to this work.
Horticulturae 2025, 11(6), 566; https://doi.org/10.3390/horticulturae11060566
Submission received: 11 April 2025 / Revised: 13 May 2025 / Accepted: 20 May 2025 / Published: 22 May 2025

Abstract

:
Flower fragrance is a crucial ornamental and economic trait of Dendrobium chrysotoxum, and the most abundant and diverse aroma-active compounds are terpenes. Terpene synthase (TPS) is the ultimate enzyme for the biosynthesis of various types of terpenes, and TPS genes were identified as the key regulators governing the spatiotemporal release of volatile terpene compounds. Until recently, the TPS gene family in D. chrysotoxum has remained largely unexplored. Our study characterizes the TPS genes in D. chrysotoxum and identifies 37 DcTPS gene family members. It helped identify the DcTPS genes, gene characteristics, the phylogeny relationship, conserved motif location, gene exon/intron structure, cis-elements in the promoter regions, protein–protein interaction (PPI) network, tissue specific expression and verification of the expression across different flowering stages and floral organs. Three highly expressed DcTPS genes were cloned, and their functions were verified using a transient expressed in tobacco leaves. Further functional verification showed that the proteins encoded by these genes were enzymes involved in monoterpene synthesis, and they were all involved in the synthesis of linalool. This study comprehensively expatiates on the TPS gene family members in D. chrysotoxum for the first time. These data will help us gain a deeper understanding of both the molecular mechanisms and the effects of the TPS genes. Furthermore, the discovery that three TPS-b genes (DcTPS 02, 10, 32) specifically drive linalool-based scent in D. chrysotoxum, will provide new insights for expanding the TPS-b subfamily in orchids and identifying the linalool synthases contributing to orchid fragrance.

1. Introduction

Dendrobium chrysotoxum Lindl. belongs to the Orchidaceae family, and its floral fragrance is one of its most important ornamental characteristics. In addition, floral fragrances also have the function of attracting pollinators [1], defending against natural enemies and resisting abiotic stress in various ecological habitats [2]. The high volatility organic compounds (VOCs) promote the aroma in orchids, and the floral components include a large number of generally lipophilic plant products with a molecular mass of less than 300, which can be classified into three categories based on their independent origins: terpenes, benzenoid aromatics, and fatty acid derivatives [3]. Among them, terpenes are one of the most diverse VOCs, and their molecular weight is relatively low, e.g., 5-carbon isoprene, 10-carbon monoterpenes, 15-carbon sesquiterpenes, and 20-carbon diterpenes constitute the largest proportion of volatile components in flowers [3,4,5]. To date, more than 80,000 terpenes have been identified from Dendrobium. The volatile floral scent compounds in Dendrobium flowers are mainly 10-carbon monoterpenes like linalool, β-ocimene, pinene, ylangene and limonene [6,7,8,9].
In plants, the intricate metabolic pathways of volatile terpenes have been thoroughly elucidated and extensively explored. The formation of terpenes occurs through two primary pathways: the mevalonate pathway (MVA pathway) and the 2C-methyl-D-erythritol-4-phosphate pathway (MEP pathway) [10]. The MVA pathway occurs in the cytoplasm, endoplasmic reticulum and peroxisomes, giving rise to the synthesis of 15-carbon sesquiterpenoids. The MEP pathway occurs in the plastid and is mainly responsible for the synthesis of 10-carbon monoterpenes and 20-carbon diterpenoids [11,12]. The 5-carbon compounds isopentenyl diphosphate (IPP) and dimethylallyl diphosphate (DMAPP) serve as precursors, and a sequence of enzymes associated with volatile terpene catalyzed reactions have been identified in both pathways [10,11,12,13]. Terpene synthases (TPSs) serve as the final enzymes that transform the substrates farnesyl diphosphate (FPP), farnesyl diphosphate (GPP) and all-trans-geranylgeranyl diphosphate (GGPP) into kinds of sesquiterpene, monoterpenes and diterpene, which are regarded as pivotal in the two pathways [14,15].
Recent studies have verified that TPSs are highly differentiated gene families, and are present in the genomes of all angiosperms and gymnosperms [16]. The applied bioinformatics techniques are classified into seven TPS subfamilies based on phylogenic analysis: TPS-a (encodes sesquiterpenes synthase), TPS-b (encodes cyclic monoterpenes and hemiterpenes synthase), TPS-c (catalyzes copalyl diphospate synthases), TPS-d (gymnosperm-specific), TPS-e/f (encodes copalyl diphosphate/kaurene synthases), TPS-g (encodes acyclic monoterpenes) and TPS-h (lycopod-specific) [14]. Despite intriguing differences between the TPS subfamilies, most full-length TPSs have two identical conserved domains: PF19086 (C-terminal) and PF01397 (N-terminal), defined in the Pfam (http://pfam.xfam.org/, accessed on 18 May 2024) database [17,18]. In addition, TPS harbors three conserved motif structures such as an N-terminal domain containing R(R)X8W, a C-terminal domain containing a DDxxD and an NSE/DTE motif [15].
The research on various terrestrial plants confirmed that the TPSs are encoded by a specific gene family involved in the biosynthesis of terpenoids [14,19]. These TPS genes have been successfully extracted from nutrient-rich tissues, as well as from fruits and flowers. The genome-wide analyses of TPSs have been identified in Arabidopsis thaliana [20], Solanum lycopersicum [21], Vitis vinifera [22], Gossypium hirsutum [23], Brachypodium distachyon [24] and Liriodendron chinense [25] when exploring their defensive functions after herbivore damage in different organs except flowers. On the other hand, the researchers note that these genes might be equally important in the biosynthesis of flower fragrance, as they carry out essential functions in attracting insects and guiding pollinators to determine the reproductive syndromes of plants [26]. Research has demonstrated that pollinators often show different preferences for floral traits, such as those related to scent and color, which might lead to reproductive isolation in some species [27,28,29]. The most well-studied TPS enzyme of floral scent biosynthesis is linalool synthase (LIS), which converts geranyl diphosphate to linalool [30,31]. The initial linalool can be further modified into other terpene synthase products [32,33].
Orchids are one of the largest families of flowering plants in the plant kingdom, and various terpenes are predominant volatile compounds in orchids. Monoterpenes, including compounds like linalool, pinene, ylangene and limonene, serve as primary contributors to the floral scent in orchid flowers [31]. To date, only a few TPS genes have been identified; thus, genome-wide TPS identification is limited in orchids. In recent reports, TPS genes have been identified in Dendrobium officinale (34 TPSs) [34], Cymbidium faberi (32 TPSs) [35], and Freesia folwers (31 terpenes) [16]. Some TPS genes have also been functionally validated, for example, the PbTPS5 and PbTPS10 genes were integral to the biosynthesis of monoterpenes in Phalaenopsis bellina [36]. In Freesia hybrid flowers, FhTPS1 is responsible for catalyzing the production of linalool. In contrast, FhTPS4, FhTPS6, and FhTPS7 have the ability to interact with both GPP and FPP substrates [16].
Until recently, the TPS gene family in D. chrysotoxum has not been well-characterized. In the current study, all DcTPS family members were identified and characterized from D. chrysotoxum, using a previous D. chrysotoxum genomic database and a comprehensive analysis of members was performed. It facilitated the identification of DcTPS genes, characterization of their gene features, analysis of phylogenetic relationships, determination of conserved motif locations, examination of gene exon/intron structures, investigation of cis-elements in promoter regions, construction of protein–protein interaction (PPI) networks, evaluation of the tissue-specific expression, and verification of expression patterns under different flowering stages and in various floral organs. Three highly expressed DcTPS genes were cloned, and their functions were verified by transient expression in tobacco leaves. On this basis, the DcTPS genes reported in this study are helpful to further understand the molecular mechanism of monoterpene synthesis. In addition, our results will provide valuable candidate genes for scent modification in D. chrysotoxum and other orchids.

2. Methods

2.1. Identification of TPS Genes in D. chrysotoxum

To identify the TPS genes, the latest recently released whole-genome annotations of D. chrysotoxum were downloaded from NCBI (https://ftp.ncbi.nlm.nih.gov/genomes/all/GCA/019/514/585/GCA_019514585.1_ASM1951458v1/, accessed on 19 May 2024). The annotated protein databases were scanned using HMMER 3.0 (http://hmmer.org/, accessed on 19 May 2024) with the Hidden Markov model (HMM) of TPS N-terminal domain (PF01397) and TPS C-terminal domain (PF19086), which were downloaded from Pfam (http://pfam.xfam.org/, accessed on 19 May 2024). By obtaining proteins from the TPS HMM, a high-quality protein set (E-value < 1 × 10⁻²⁰) was arranged and used to construct a D. chrysotoxum-specific TPS HMM by hmmbuild in HMMER 3.0. The D. chrysotoxum-specific TPS HMM was used to align all protein sequences with an E-value lower than 1 × 10⁻⁵. In order to avoid any non-specific sequences outside the TPS cluster, all A. thaliana TPS proteins were used as queries to explore the D. chrysotoxum database with default parameters. Using the Pfam database and Conserved Domain Database (CDD, https://www.ncbi.nlm.nih.gov/Structure/cdd/wrpsb.cgi, accessed on 19 May 2024) for filtering redundant sequences. Only a total full length of TPS domain sequences were selected as DcTPS protein for subsequent analysis. As a result, a total of 37 highly similar TPS genes were identified in the D. chrysotoxum genome.

2.2. Characteristics of TPS Genes

To characterize and align the DcTPS sequences, the ProtParam tool (https://www.expasy.org/, accessed on 19 May 2024) was employed to predict the physicochemical properties of the DcTPS proteins, including protein length, molecular weight (MW), predicted theoretical isoelectric point (pI), instability index, aliphatic index, and grand average of hydropathicity of the encoded proteins.

2.3. Phylogenetic, Conserved Motifs and Gene Structure Analysis

The ClustalW algorithm was used to select the target protein sequences, Supplementary Table: Tables S1 and S3 list the gene IDs of the DcTPS (37) and AtTPS (32) members. In the MEGA-7.0 (https://www.megasoftware.net/, accessed on 20 May 2024) software, an unrooted phylogenetic tree was constructed using the maximum likelihood statistics method. The bootstrap-replicates number was set to 1000 repetitions using the Poisson model. The generated tree was redrawn and annotated by the FigTree v1.4.3 software. Based on the well-established division in A. thaliana, the D. chrysotoxum TPS members were further categorized into multiple subcategories.
The MEME program (http://meme-suite.org/tools/meme, accessed on 2 July 2024) was employed to detect the conserved motifs. All other default parameters were kept at their standard values, except that the maximum number was established at 20. The intricate exon–intron architecture of the DcTPS genes was visualized through the Gene Structure Display Server (GSDS) 2.0 (https://gsds.gao-lab.org/, accessed on 3 July 2024) program, offering a vivid glimpse into its complex genomic blueprint.

2.4. Cis-Elements in the Promoter Regions Analysis

The 2000 bp upstream regions of the candidate DcTPS genes were utilized for analyzing cis-elements regulatory elements in their promoters. Plant care software (http://bioinformatics.psb.ugent.be/webtools/plant-care/html/, accessed on 13 June 2024) was used for searching registry. The Gene Structure Display Server (GSDS) 2.0 (http://gsds.cbi.pku.edu.cn/, accessed on 8 July 2024) was utilized to generate the figure.

2.5. Protein–Protein Interaction (PPI) Network Prediction Analysis

To delve deeper into the relationships among the DcTPS genes, we utilized the interologues of A. thaliana to predict PPI networks. The PPI network diagram was constructed using the STRING software (Version 11.0), with a confidence score threshold of 0.4.

2.6. GO Classification and Enrichment Analysis

The transcriptome data of D. chrysotoxum were retrieved from the NCBI database (https://www.ncbi.nlm.nih.gov/datasets/taxonomy/161865/, accessed on 25 July 2024) and 37 DcTPS genes were screened. Transcript abundance was assessed using the read per million mapping (FPKM) values per kilobase transcript of the DcTPS genes. All the genes and transcripts obtained from the transcriptome assembly were compared with gene ontology (GO) databases to obtain the functional information of DcTPS genes comprehensively and made statistics on annotation in the databases. Six samples (leaves, pseudobulbs, petals, sepals, labellums and gynandrium) were completed, and a total of 49.77 Gb of Clean Data was obtained, and the Clean Data of each sample reached 7.15 Gb, and the percentage of Q30 base was more than 92.09%. Trinity is used to assemble clean data of all samples from scratch, and the assembly results are optimized and evaluated. The results show that the number of unigene assembled is 72,621, the number of Transcript is 122,375, and the average length of N50 is 1326 bp, and Salmon Version 0.14.1 was used to quantify gene expression, with the default settings. The software Goatools (v0.6.5) was used to conduct GO enrichment analysis, so as to obtain the main GO functions of the DcTPS genes. The Fisher exact test was applied, and if the adjusted p-value was less than 0.05, the GO function was deemed to be significantly enriched.

2.7. Cultivation of D. chrysotoxum

The plant material selected in this study was D. chrysotoxum, from which the flowers are both highly scented and beautiful. D. chrysotoxum was bought from Zhejiang Senhe Seed Co., Ltd. (Hangzhou, Zhejiang Province, China) and was one of the cultivars popularized for planting in China. The cultivar used in this experiment was obtained from the laboratory of Professor Shuo Qiu of the Guangxi Institute of Botany (Guilin, Guangxi Province, China), complying with Chinese legislation. The growth was observed under natural light and temperatures about 20–25 °C. Fresh flowers of D. chrysotoxum were sampled in different fluorescence stages (bud stage, first flowering stage, full bloom stage, and declining stage) and flower parts (leaves, pseudobulbs, petals, sepals, labellums and gynandrium). The flowering process of Dendrobium can be divided into four stages according to the changes of flower organ development: bud stage, petals not open; first flowering stage, petals begin to unfold; full bloom stage, petals fully open; declining stage, the petals become smaller and gradually fall. All samples with three replicates were immediately frozen in liquid nitrogen for storage at −80 °C until needed. The selection of different flowering stages and different flower parts are shown in Figure 1 and Figure 2.

2.8. RNA Extraction and qRT-PCR Expression Analysis

Total RNA was extracted from each sample using an RNA extraction kit (Huayueyang Biotechnology (Beijing) Co., Ltd., Beijing, China). Subsequently, 1 μg of total RNA was reverse-transcribed into cDNA using the Takara cDNA Synthesis Kit (Takara Biotechnology (Dalian) Co., Ltd., Dalian, China). Primers for qRT-PCR were designed using Primer 5.0 software (Supplementary Table: Table S10). The qRT-PCR was performed using ACT-1 housekeeping gene as endogenous reference. The PCR was mixed by Roche Lightcycler 480 Real-time PCR System in 10 μL with SYBR Green PCR reactions Master Mix kit (Vazyme, Nanjing, China), following the manufacturer’s protocol. Each reaction was performed with three replicates. The relative gene expression level was calculated by the 2 −ΔΔCT method, using the Thermal Cycler software (version 7500 Real-Time PCR Systems).

2.9. Transient Expression of DcTPS Genes in Nicotiana benthamiana

The CDS of DcTPS02, DcTPS10 and DcTPS32 were amplified using specific primers (listed in Supplementary Table S11) and cloned into the pBI121 binary vector. The resulting constructs were subsequently introduced into the Agrobacterium strain GV3101 for further transformation (Supplementary Figures S1 and S2). These Agrobacterium strains carrying DcTPSs and strains carrying the gene encoding the viral suppressor p19 infiltrated four-week-old Nicotiana benthamiana youngest leaves [16,37,38]. When the freshly cultured Agrobacterium reached an optical density (OD600 nm) of 0.6 to 0.8, they were harvested by centrifugation and re-suspended in an infiltration buffer containing 2-(N-morpholino) ethanesulfonic acid (10 mM) and magnesium chloride (10 mM). When freshly grown Agrobacterium cultures reached an OD600 nm of 0.6–0.8, they were centrifuged and resuspended in 2-(N-morpholino) ethanesulfonic acid (10 mM) and MgCl2 (10 mM) infiltration media. The above substances were incubated for 2 h at 28 °C in a non-shaking environment. The cultures containing target gene and p19 were mixed in a 1:1 ratio before infiltration into N. benthamiana leaves. The plants were kept in a growing chamber at 22 °C with 16 h of light/8 h of darkness for 5 days. After transformation, the infected leaves were collected and placed in 20 mL SPME vial for GC–MS analysis of volatile compounds. Leaves infiltrated with empty binary vectors were used as a control. New product peaks were observed in contrast to controls and were identified by comparing mass spectra with the NIST 2005 Mass Spectral Library.

2.10. GC–MS Analysis

Ten D. chrysotoxum fresh flowers during the bloom stage were enclosed and sampled in 40 mL brown headspace sampling bottles with three biological replicates. The manual solid-phase microextraction (SPME) injector, along with the 50/30 μm PDMS/CAR/DVB fiber (SUPELCO, Inc., Bellefonte, PA, USA), was introduced into the 6890N-5975B Gas Chromatography–Mass Spectrometry (GC–MS) system (Agilent Technologies, Santa Clara, California, USA). This process was carried out at a temperature of 250 °C for a duration of 30 min. Fiber heads were placed into brown headspace sampling bottles, and the headspace was extracted at 40 °C for 30 min to facilitate the extraction process. Following this, the fiber head was taken out and inserted into the GC–MS injection port. After a 5 min analysis, the samples were injected for additional examination [39].
The HP5-MS quartz capillary column (30 m × 0.25 mm × 0.25 μm) was operated at a flow rate of 0.8 mL·min−1. High-purity helium (99.999%) was used as the carrier gas, and the injection mode was set to splitless. The temperature program was set as follows: 40 °C for 3 min, 3 °C min−1 up to 73 °C for 3 min, then 220 °C at 5 °C min−1 for 2 min. The electron ionization (EI) ion source temperature was 230 °C, and the electron energy was 70 eV. The GC–MS transmission line temperature was 250 °C, and the scanning range was 40–450 amu [40]. According to the total ionization chromatography of GC–MS, the retention time was compared with the National Institute of Standards and Technology (https://www.nist.gov/, accessed on 7 June 2024) to determine the volatile compounds detected during the experiment [41]. Xcalibur1.2 software was used to conduct quantitative analysis according to peak area normalization method, and the phase pair content of each chemical component was obtained, respectively.

3. Results

3.1. Identification and Characterization of TPS Gene Family in D. chrysotoxum Genome Resources

A total of thirty-seven non-redundant terpene synthase genes (DcTPSs) were identified from the D. chrysotoxum genome and subjected to subsequent analyses. As shown in Table 1, the physical and chemical properties of the DcTPS genes were systematically analyzed. The protein sequence of the DcTPS genes varied in length from 360 (DcTPS31) to 1305 (DcTPS21) amino acid (aa) residues, with a corresponding molecular weight (MW) ranging from 41.82 to 152.19 kDa. The theoretical isoelectric point (pI) of DcTPSs ranged from 5.19 to 9.79, with an average pI of 6.12, suggesting that most DcTPS proteins were slightly acidic. With the exception of six DcTPS proteins (DcTPS18, 36, 37, 11, 8 and 25), all the other thirty-one DcTPS proteins were considered unstable (Instability index > 40). The content of aliphatic acids in DcTPS genes was high, and the aliphatic index ranged from 83.17 to 99.83. Because of the low average hydropathy value (<−0.084), most DcTPS were predicted to be hydrophilic.
The gene IDs for the DcTPS members are provided in Supplementary Table: Table S1. All DcTPS proteins possessed two conserved domains characteristic of terpene synthases: PF19086 (C-terminal) and PF01397 (N-terminal). A summary of the DcTPS genes, along with their corresponding HMM profiles, is presented in Supplementary Table: Table S2.

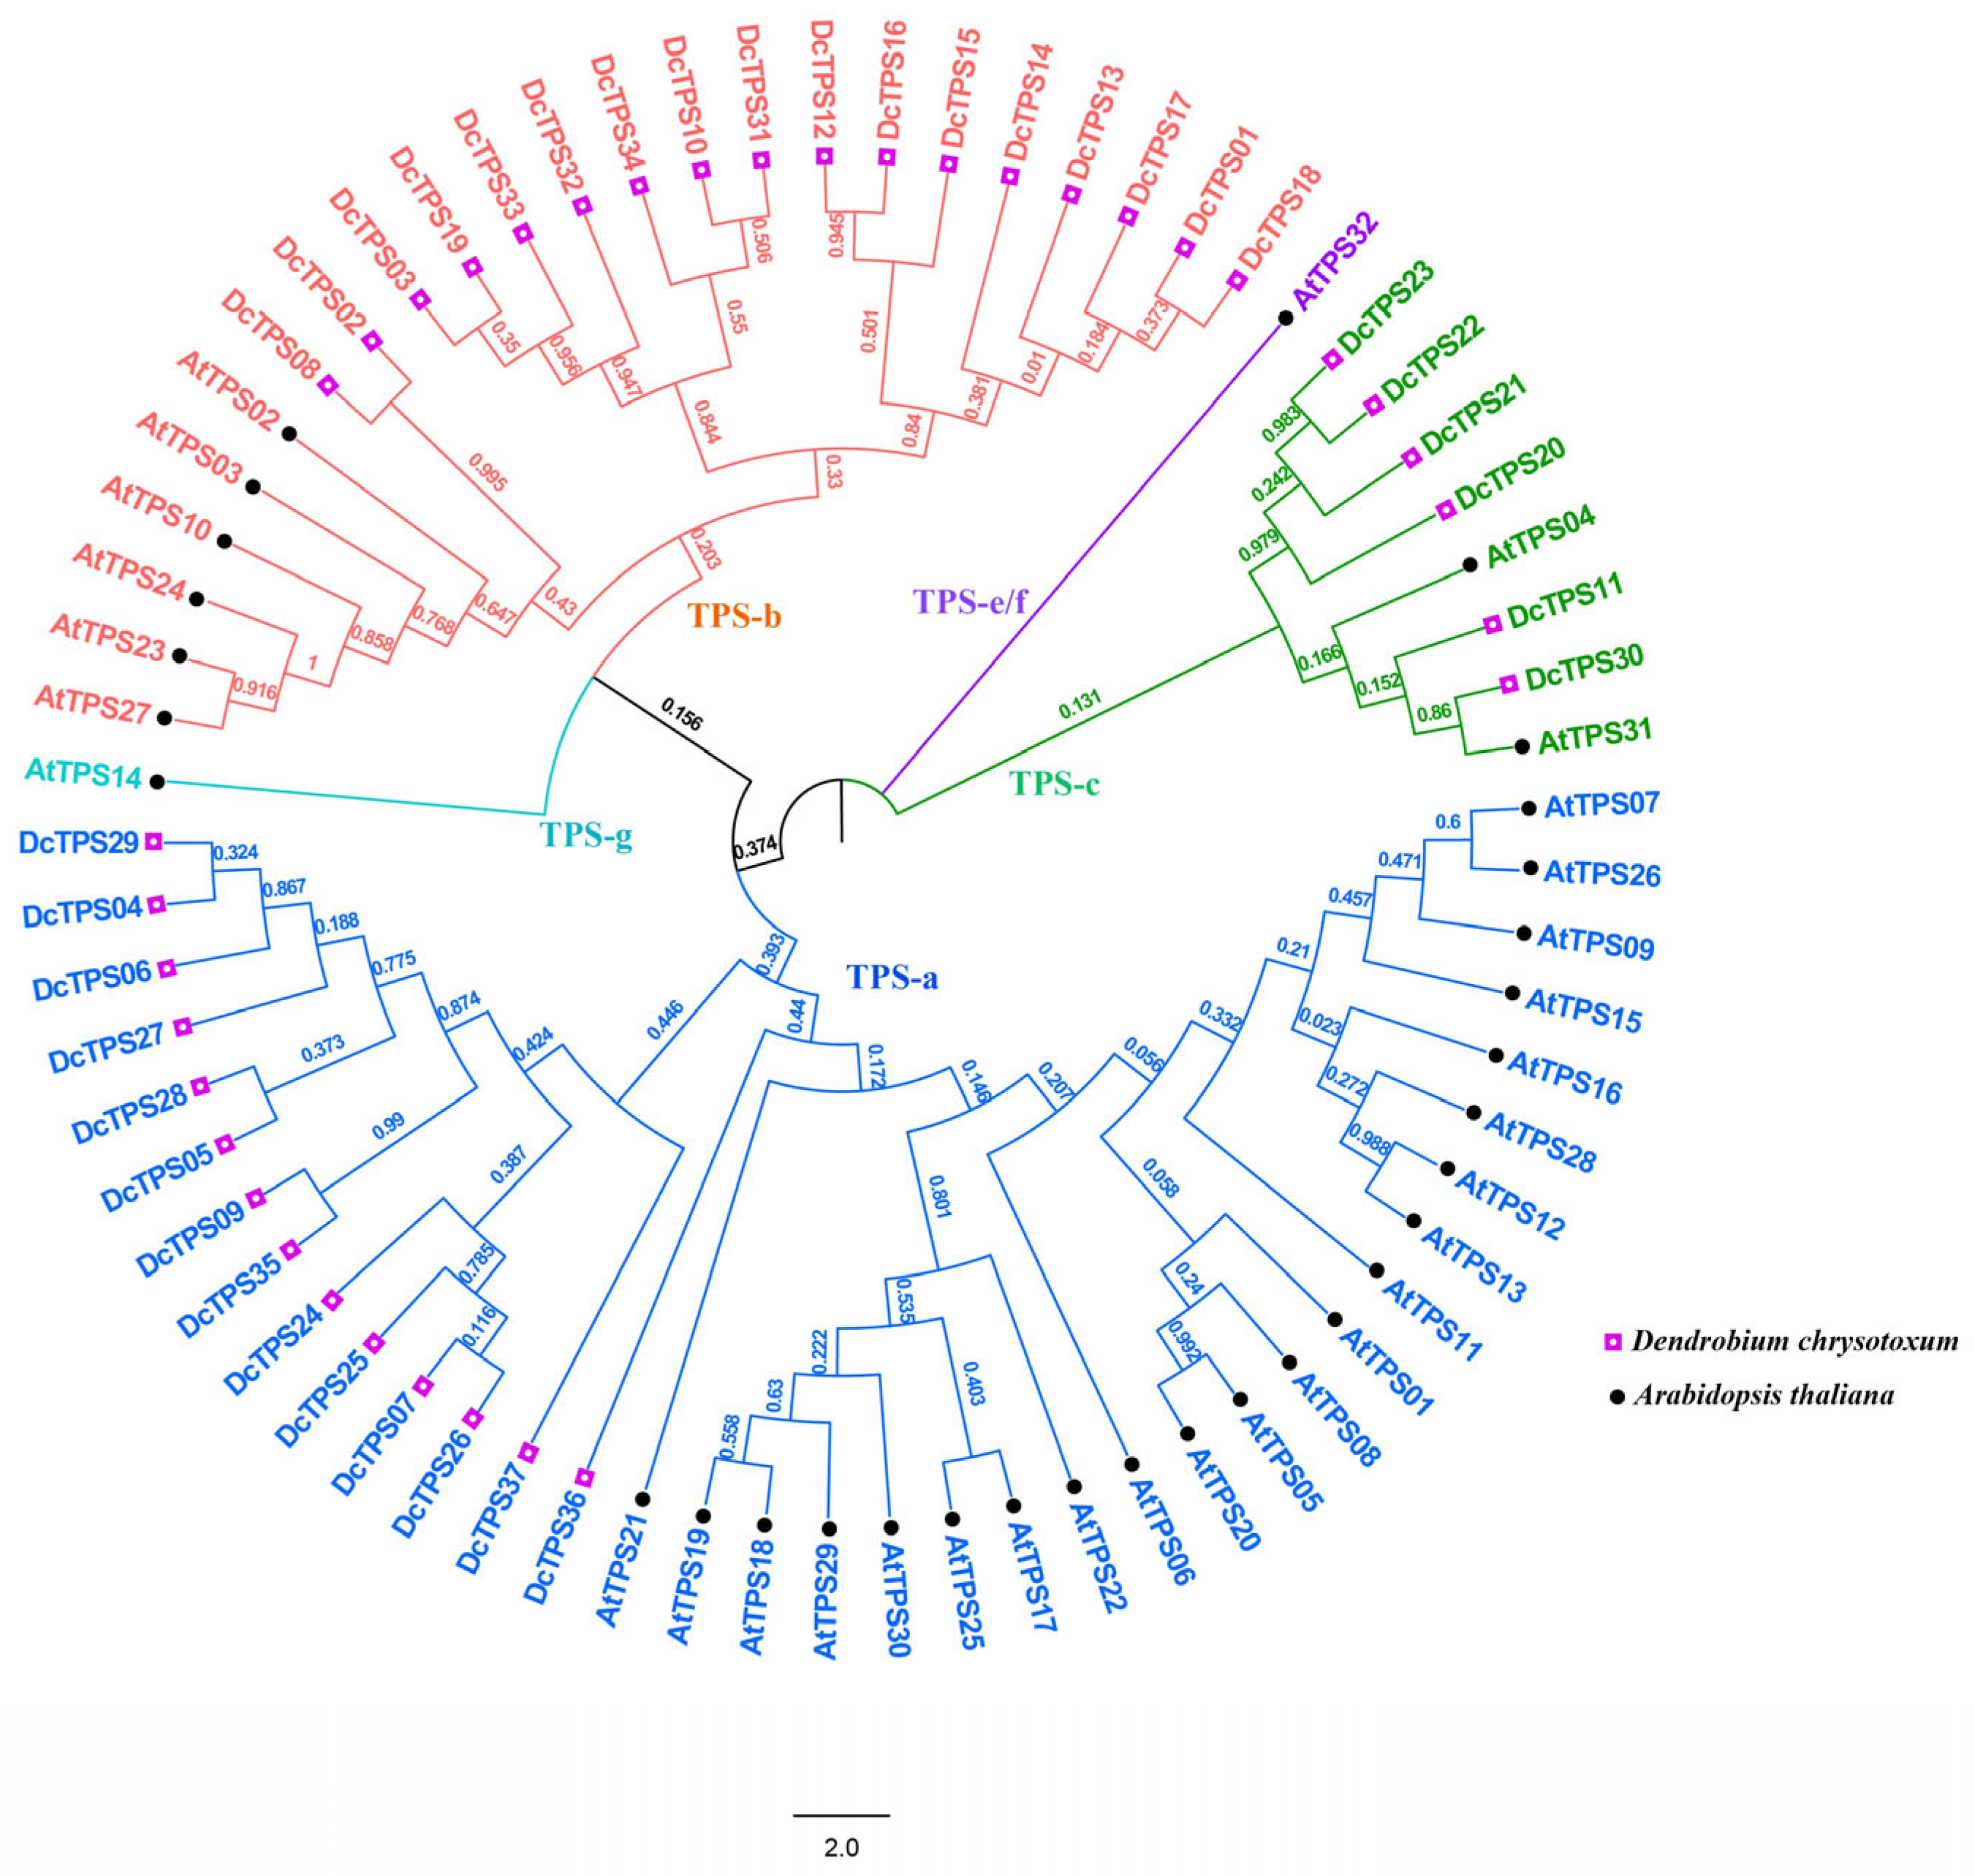
3.2. Phylogenetic Relationship of DcTPS Family

To further explore the evolutionary relationships within the TPS gene families, a total of 69 TPS proteins were analyzed, including 37 from D. chrysotoxum and 32 from A. thaliana (Supplementary Table: Table S3). An unrooted phylogenetic tree was constructed using the MEGA-7.0 software.
All the 69 TPS full-length protein sequences were clearly clustered into five categories with a bootstrap value of 100%. These categories could be further classified into TPS-a, TPS-b, TPS-c, TPS-e/f and TPS-g subgroups (Figure 3). Among these, the TPS-c subgroup contains the least number of DcTPSs (6), while TPS-b has the most numbers of DcTPSs (17), and the TPS-a subgroup contains DcTPSs (14).

3.3. Conserved Motifs and Gene Structure Analysis

The diversity of DcTPS is crucial for a deeper understanding of the characteristics and functions of this family in D. chrysotoxum. Evolutionary mechanisms, conserved motifs, and gene intron/exon distribution were identified within the 37 DcTPS protein sequences. A total of 10 conserved motifs (referred to as motifs 1–10) were finally identified by MEME (http://meme-suite.org/tools/meme, accessed on 20 June 2024). The lengths of the conserved motifs varied between 21 and 41 amino acids, and the detailed features of these motifs are summarized in Supplementary Table: Table S4. As shown in Figure 4A, all the DcTPS genes are divided into three subfamilies, TPS-a, TPS-b and TPS-c. In Figure 4B, motifs from the same subfamily show a similar pattern, further verifying their evolutionary relationship. The numbers of DcTPSs motifs ranged in length from 5 to 10. The majority of the members of the TPS-a gene family contained the largest number of motifs, with 10, while DcTPS31 had only 5 motifs. Interestingly, we found that most of the genes with variation in the number of these motifs were in the TPS-b subfamily, suggesting the diversity and extension of this subgroup. Thirty-six DcTPSs (except for DcTPS31) contained the DDxxD motif (motif 1), and thirty-three DcTPSs (except for DcTPS9, 11, 20, 30) contained the RRX8W motif (motif 9). These findings provided additional evidence to support specific evolutionary characteristics of the DcTPS gene family. Moreover, the motifs and arrangement sequences that are distinctive to each DcTPS group may be considered to have a special function for DcTPS proteins.
The evolutionary investigation through the structural diversity of polygenic families constituted a crucial component of the study.
For this purpose, a detailed structural analysis of the DcTPS genes was conducted by creating an exon–intron map (Figure 4C). Variations in the number of introns was observed among the 37 DcTPS members, ranging from 0 to 3. Of the 37 DcTPS genes, 14 lacked introns, 15 possessed a single intron, and 8 had between 2 and 3 introns. Additionally, members within the same subfamily of the phylogenetic tree exhibited similar protein-conserved motifs and intron counts. For example, the TPS-a subfamily had no introns, the TPS-b had one–two introns, and the TPS-c gene had two–three introns, respectively. Notably, conserved motif arrangement of intron–exon was found among most of the subfamilies but some differences were observed as well. Taken as an example, DcTPS 20/21 exhibits identical exon and intron phase counts but demonstrates variation in intron length. Such elements could possibly account for the variations in the size and structure of the DcTPS genes.

3.4. Promoters Cis-Elements Analysis

To gain a deeper understanding of the potential regulatory mechanisms of DcTPS genes, an investigation of cis-elements was conducted in the promoter region (2000 bp upstream of the DcTPSs translation initiation site, ATG). The promoter sequences were analyzed using the online software Plantcare database [42]. In total, we identified 824 cis-acting regulatory elements and classified them into 16 functions, which are listed in Supplementary Table: Table S5. Using TBtools software (Version 2.1), these cis-acting elements and their locations were generated in Figure 5A. These cis-elements could be divided into three groups: elements related to plant growth and development (Figure 5B), elements related to plant phytohormone responsiveness (Figure 5C), and stress responsiveness (Figure 5D). The plant phytohormone responsiveness category (258/824) contained ABRE, AuxRR-core and CGTCA-motif, etc., and the ABRE motif (79/258) was an essential element in the promoter that was related to abscisic acid responsiveness. The stress responsiveness category (135/824) contained nine cis-acting regulatory elements and just consisted of six motifs. The MBS motif (35/135) was an essential element in the promoter that was related to drought-inducibility. Most of the cis-elements were in the plant growth and development category (420/824), which contained twenty-five cis-acting regulatory elements. Among them, the Box 4 motifs, G-box motifs and TCT motifs accounted for the largest proportion (50.48%), which are associated with light response. In addition, the motifs related to light response accounted for 44.17% (364/824) of the total motifs. These findings indicated that the expression pattern of the DcTPS genes may be regulated by the light period.

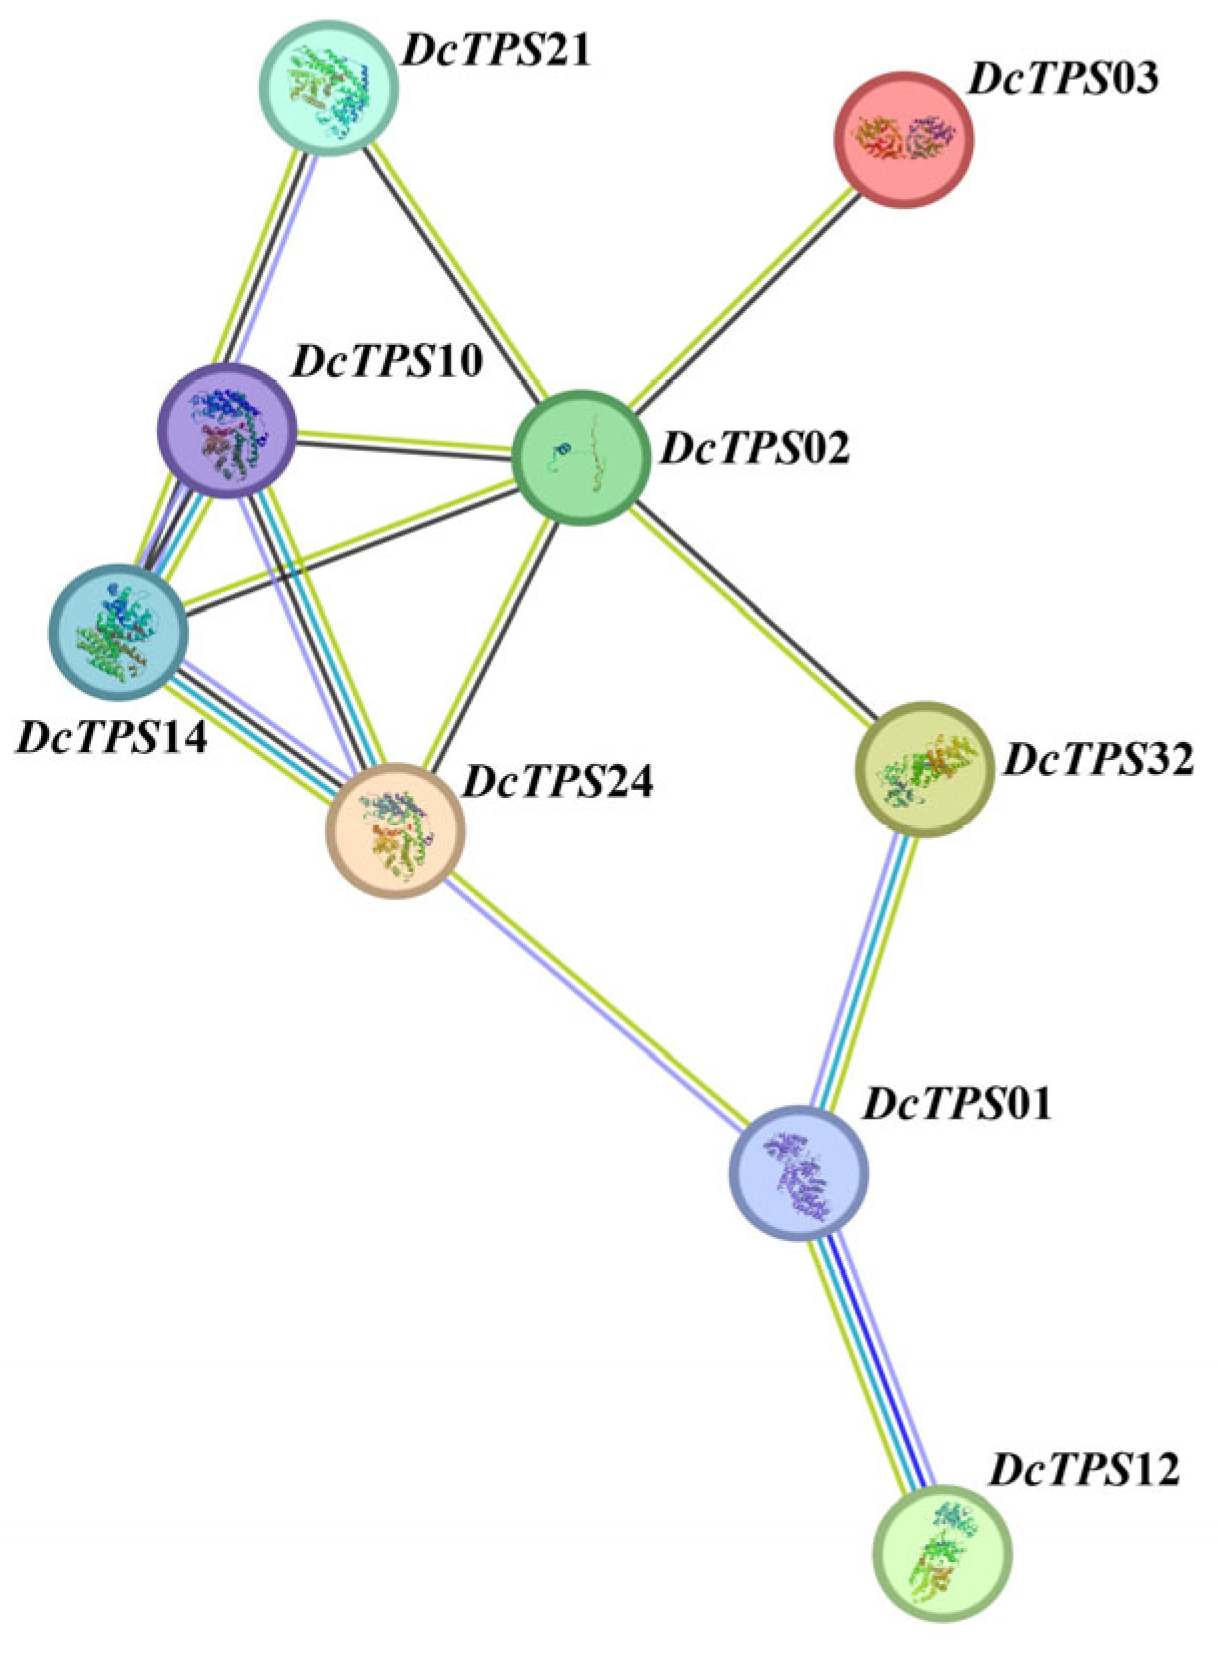
3.5. Protein–Protein Interaction (PPI) Network Analysis

We used A. thaliana orthologue proteins to construct a PPI network using STRING software to further understand the association of the DcTPS proteins and predict their relationships. For reliability, only nine DcTPS proteins with the highest combined score were selected (Table S6). As shown in Figure 6, the DcTPS02 and DcTPS10 proteins are more closely related to other family members, both of which are members of the TPS-b subfamily. These interaction networks may provide important clues for understanding the function of unknown proteins, indicating the greater importance of these genes in the PPI network.

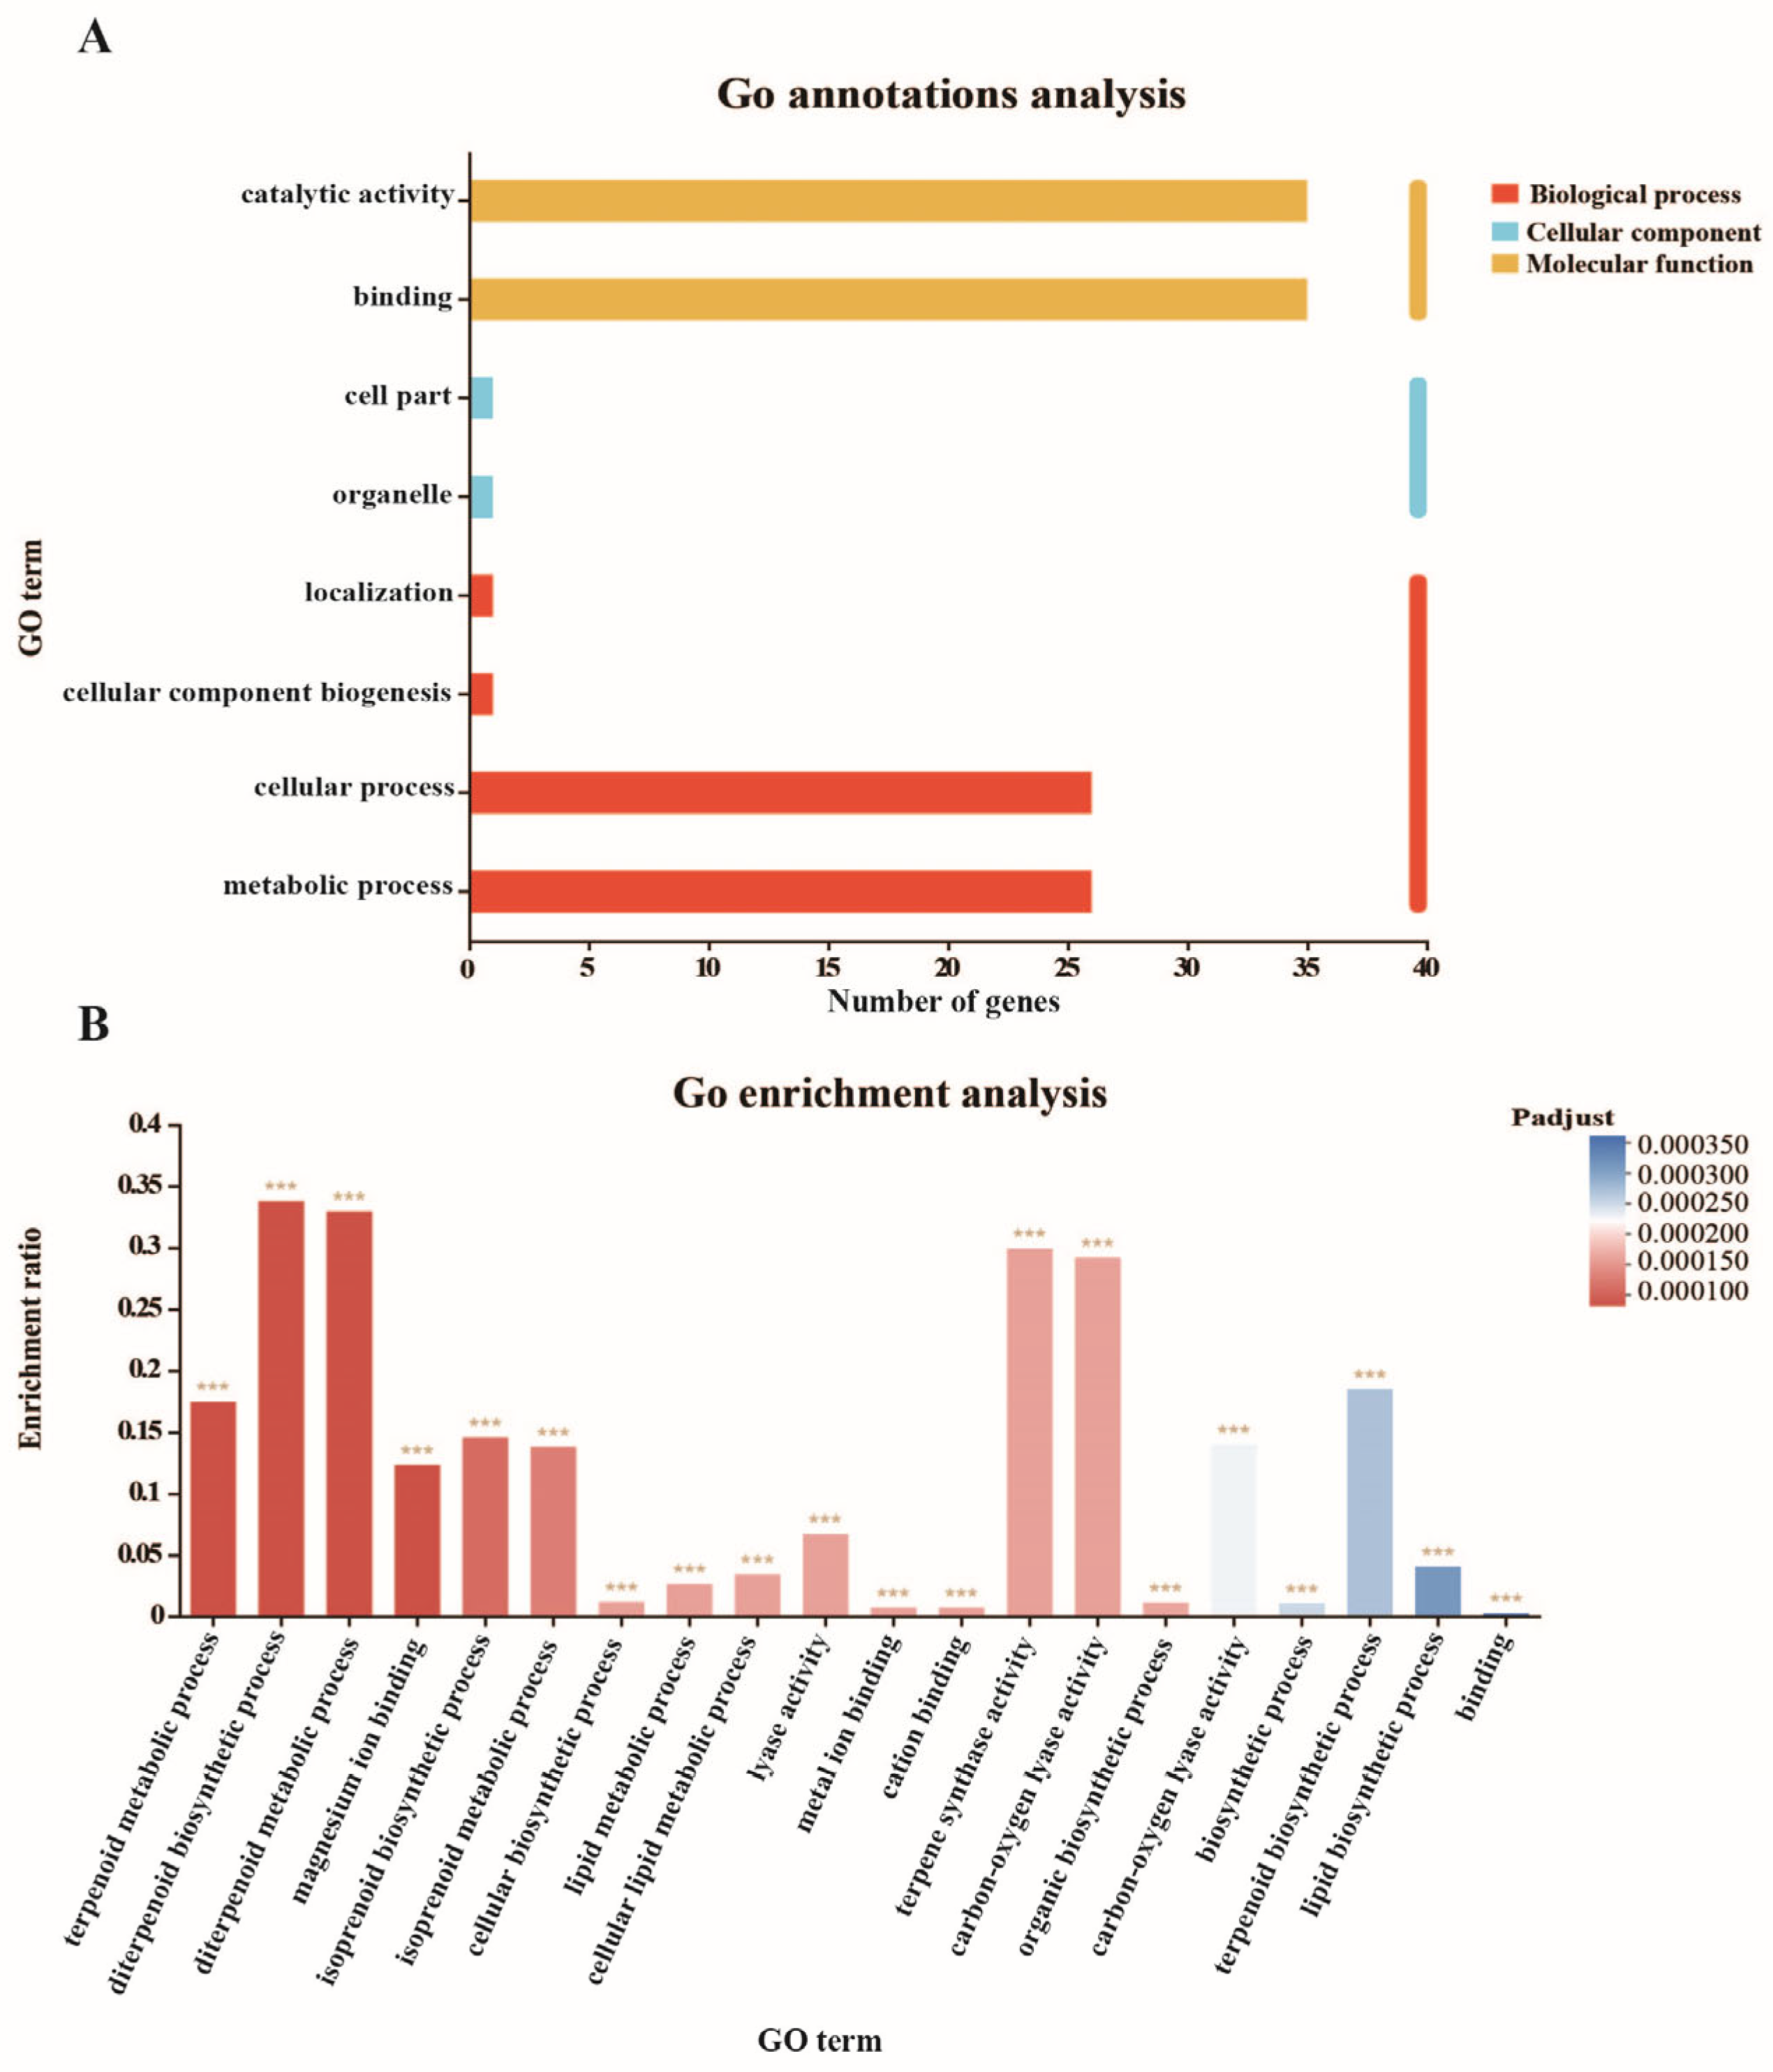
3.6. GO Classification and Enrichment of DcTPS Genes

To further reveal the functions of the DcTPSs, gene ontology functional classification analysis was performed (Table S7). According to the classification results (Figure 7A), the molecular function annotation terms contained the majority of DcTPS genes (35/37), which were involved in catalytic activity and binding. GO enrichment analysis was carried out to better understand the preferred functional characteristics of the DcTPS genes, and these genes were mostly enriched in the terpenoid metabolic process, diterpenoid biosynthetic process, and diterpenoid metabolic process (Table S8, Figure 7B).

3.7. Different Tissues Expression Analysis of DcTPS Genes

Abundant evidence has confirmed that TPS genes play an important role in plant growth and development. To understand the physiological function of DcTPS genes better, an RNA sequencing transcriptome database of different tissues including leaves, pseudobulbs, petals, sepals, labellums and gynandrium was established to study the expression patterns. A heat map of the hierarchical clustering was generated to show the expression profiles of the DcTPS genes in different tissues (Figure 8). The expression of four DcTPS genes (DcTPS05, 09, 30, 36) was not detected in any of the tissues analyzed, which may be due to differences in spatio-temporal expression patterns. The expression of DcTPSs revealed a tissue and organ-specific pattern, which showed a relatively high expression level in floral organs (petals, sepals, labellums and gynandrium), but they had a lower expression in leaves and pseudobulbs. Specifically, DcTPS02, DcTPS01, DcTPS10, DcTPS32, DcTPS03 and DcTPS18 were highly detected in floral organs, while DcTPS27, DcTPS20, DcTPS31 and DcTPS12 exhibited a high level of expression in leaves or pseudobulbs. Overall, the expression of TPS genes in flower organs was higher than in other tissues, and the differential expression of these DcTPS genes that were highly articulated in flower organs may have an important function in the flower fragrance of D. chrysotoxum, which needs to be further verified.

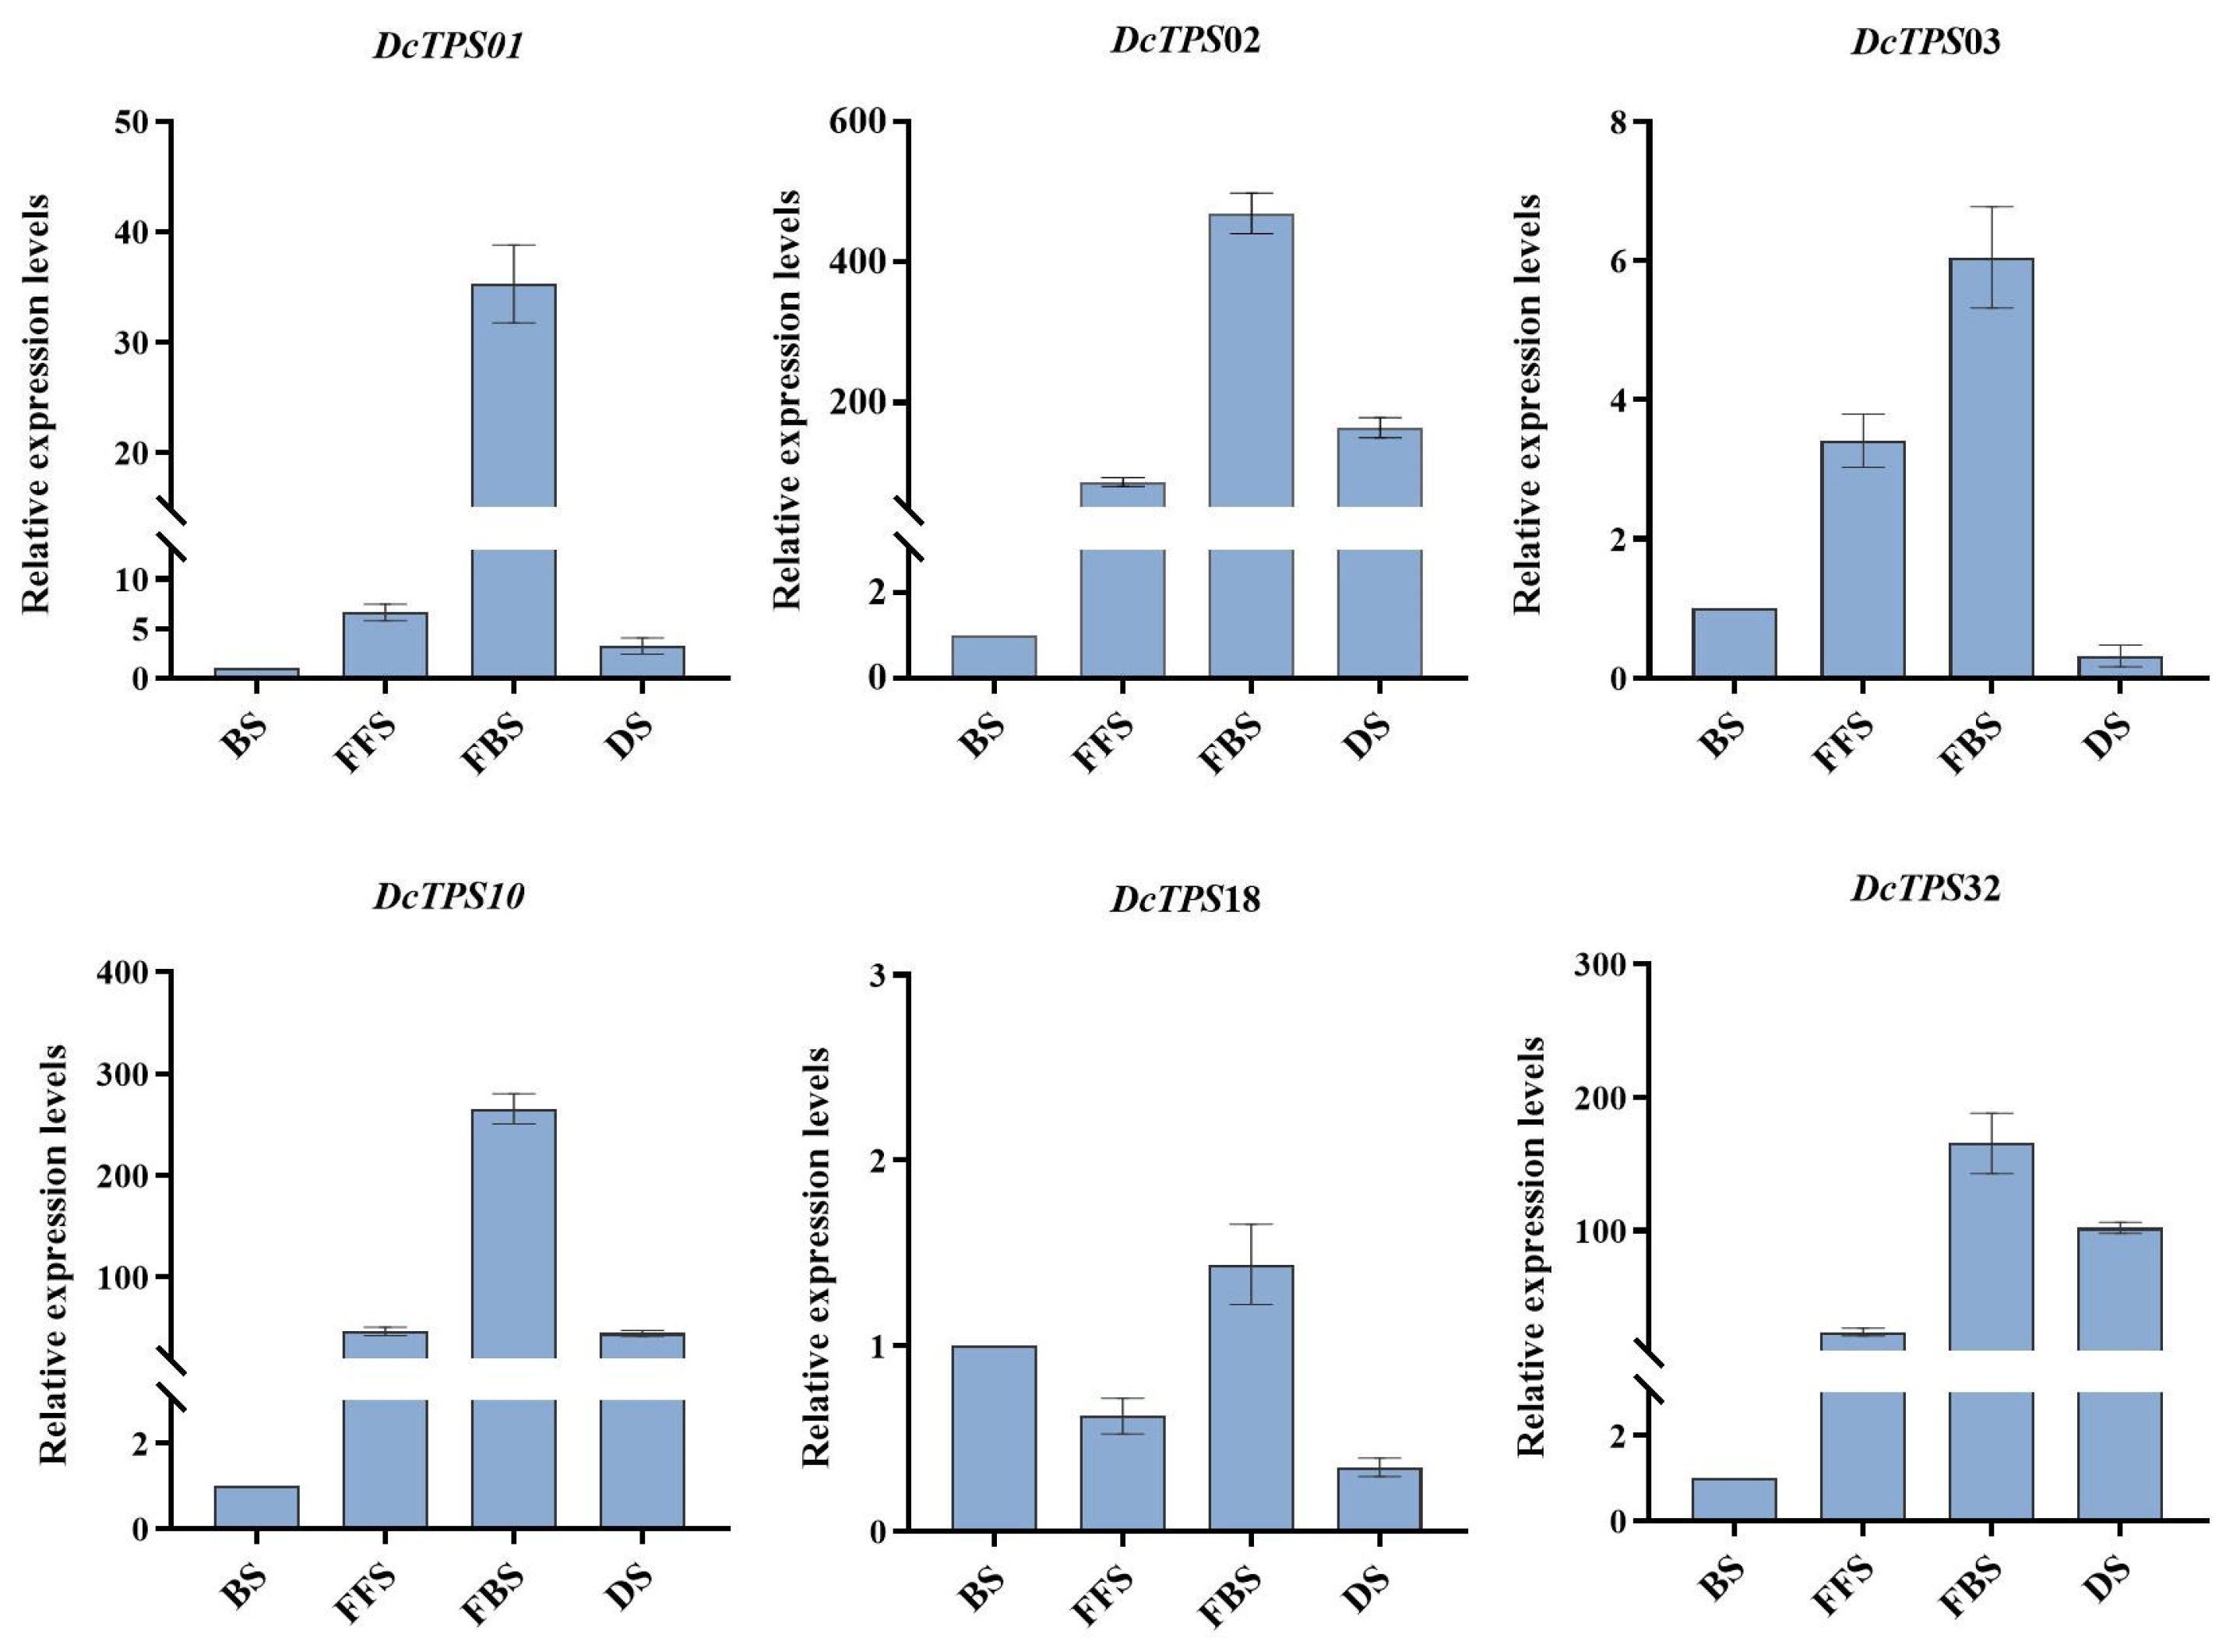
3.8. Different Fluorescence Stages’ Expression Analysis of DcTPS Genes

To further investigate the potential roles of DcTPS in flowers, the real-time reverse transcription quantitative PCR expression was confirmed to investigate DcTPS gene expression patterns at four floral developmental stages, and the sequences of primers used in qRT-PCR were listed in Table S10. Based on the FPKM values of genes highly expressed in flower organs, we selected six candidate genes (DcTPS02, DcTPS01, DcTPS10, DcTPS32, DcTPS03 and DcTPS18). The qRT-PCR results in Figure 9 show that the expression profiles of the six genes were expressed differently among the four fluorescence stages but that all these genes were mainly expressed in the full bloom stage. In particular, DcTPS02 had the highest expression levels during the full bloom stage. Moreover, DcTPS10 and DcTPS32 also had higher gene expression levels, which were similar to the tissue expression patterns displayed in Figure 8. Combined with the results of PPI (Figure 6), DcTPS02, DcTPS10 and DcTPS32 may play a crucial role in floral formation and synthesis.

3.9. Functional Identification of DcTPS Genes in Plants

To explore the dominant roles of DcTPS genes in the terpene biological processes, three full-length CDS sequences of DcTPS02, DcTPS10 and DcTPS32 were cloned into vector pBI121 (primers used in clone were listed in Table S11) and transiently expressed in tobacco leaves (Supplementary Figures S1 and S2). The samples of transgenic tobacco leaves were taken five days after inoculation and the major emitted terpenes were analyzed by GC–MS and verified using the NIST Mass Spectral Library. As shown in Figure 10, the release of linalool in DcTPS10 and DcTPS02 was relatively high, reaching 100% and 93.03%, respectively. DcTPS32 was expressed in D. chrysotoxum at a lower level, and its expression was found to be correlated with the release of three products: α-pinene (15.27%), β-pinene (42.08%) and linalool (42.65%). Therefore, DcTPS02, DcTPS10 and DcTPS32 have been proven to be enzymes involved in monoterpene synthesis, and all are closely related to the synthesis of linalool.

4. Discussion

4.1. Comprehensively Investigated TPS Gene Family in D. chrysotoxum

Dendrobium chrysotoxum is one of the rare orchids in karst areas, with a variety of epiphytic and terrestrial growth forms [44]. It has a long history of cultivation because of its unique floral fragrance and beautiful flower shape, which has high ornamental value. Terpene Synthase (TPS) is a key enzyme and is responsible for producing the immense diversity of terpene derivatives as well as playing vital roles in floral fragrance and pollinators attraction. In recent years, in an attempt to understand TPS genes, some reports by different research groups have independently carried out genome-wide identification of the TPS gene family in A. thaliana (32 members) [20,45], Selaginella moellendorfii (14 members) [46], Glycine max (14 members), Dendrobium officinale (34 members) [34], Cymbidium faberi (32 members) [35] and Freesia (8 members) [16]. Nevertheless, the diversity (across various dimensions) and characterization of the TPS gene family in D. chrysotoxum remain inadequately explored in a comprehensive manner. On the basis of a previous study, we investigated the TPS genes in the D. chrysotoxum genome and a total of 37 TPS genes (DcTPS1-37) were identified. A comprehensive analysis was conducted on their physicochemical properties, covering protein length, molecular weight, theoretical isoelectric point, instability index, aliphatic index, and grand average of hydropathicity. In order to gain a deeper understanding of the DcTPS gene family, we carried out analyses focusing on their phylogenetic classification, conserved motifs, exon–intron organization, cis-elements, protein–protein interaction (PPI) network, and expression patterns in different tissues and fluorescence stages. Finally, we screened out the key floral expression DcTPS genes and identified their functions. This study represents the first thorough analysis of the evolution of the TPS family in D. chrysotoxum, and the resulting information is undoubtedly valuable for providing additional evidence to infer the potential functions of key TPS genes in terpene synthesis.

4.2. TPS-b Was a Dominant Subfamily in D. chrysotoxum

Phylogenetic analysis of the 69 TPS members (comprising 37 from D. chrysotoxum, 32 A. thaliana) were divided into five subgroups according to their sequence homology and classification from A. thaliana. In our study, AtTPSs were classified into five subclasses, while all DcTPSs belong to only three subclasses (TPS-a, TPS-b and TPS-c). Among them, the TPS-b subclass has 17 DcTPS genes, which was the largest subfamily among the DcTPSs. Similar findings were also found in D. officinale (16 of the 34 DoTPS genes were TPS-b genes) [34], Freesia (4/8) [16] and C. faberi (15/32) [35]. However, this was not consistent with A. thaliana [45], Oryza sativa [7], Sorghum bicolor [14], Solanum lycopersicum [21] and Liriodendron chinense [47], which have a dominant subfamily TPS-a. These results further confirmed that orchids contained more TPS genes in TPS-b, and TPS-b was also the most expanded classification in orchids, with a dominant subfamily [34,48].
The genes in the TPS-b subgroup are mainly responsible for the synthesis of monoterpenes. Monoterpene volatiles are the main terpenoids in orchids, which are dominant in the flower scent of orchids. Many studies have confirmed that TPS-b protein with GPP as substrate in orchids can produce large amounts of monoterpenes. For instance, in Freesia, FhTPS1 and FhTPS2 had the ability to convert GPP into linalol and α-terpinol [16]. In Cymbidium faberi, CfTPS18 could convert GPP to β-myrcene, geraniol, and α-pinene in Escherichia coli [35]. The DoTPS10 of D. officinale, uniquely converted GPP to linalool in E. coli BL21 [34].

4.3. TPS-b Subfamily Genes Have Conserved Motifs Encoding Monoterpenes

Thirty-six DcTPSs (except for DcTPS31) contained the DDxxD motif, and thirty-three DcTPSs (except for DcTPS9, 11, 20, and 30) contained the RRX8W motif. In plants, DDxxD was an aspartate-rich motif that could interact with divalent metal ions and participate in positioning the substrate for catalysis [49]. The RRX8W motif was involved in the production of cyclic monoterpenes and was absent in producing acyclic products [14]. In our present study, all the DcTPSs in the TPS-b contained the conserved RRX8W motif, which proved to be critical for floral fragrance release due to its association with encoding monoterpenes.
In general, genes grouped into the same subclasses tend to display comparable evolutionary features and share a consistent motif arrangement structure. Seventeen DcTPS genes were clustered into the TPS-b subclass, and analysis of the conserved motifs of the D. chrysotoxum proteins further corroborates the categorization of the DcTPS family. Except for DcTPS31, at least seven identical conserved motifs have been identified within the TPS-b subclass. These motifs are likely to be crucial for its functional role. It is important to highlight that DcTPS10 and DcTPS02 within the TPS-b subclass exhibited a closer relationship with other family members in the PPI network. These findings indicate that the genes within the TPS-b subfamily warrant additional exploration into their functional roles.
Different elements in promoter areas were found in all 37 DcTPS genes of D. chrysotoxum, and they belonged to three clusters. Most of the cis-elements were in the plant growth and development clusters, among which the number of Box 4, G-box and TCT motifs associated with light-response contained most of this cluster. The results indicated that the expression patterns of DcTPS may be regulated by light treatment and may respond to multiple environmental stresses.
GO annotation analysis indicated that the biological process contained most DcTPS genes, and these genes were mostly enriched in the terpenoid metabolic process. The function of the TPS genes in controlling terpenoid biosynthesis has been well-documented in many plant species. The formation of floral scent is a complex process that is associated with the DcTPS genes. In our study, most of the TPS-b subclass like DcTPS01, DcTPS02, DcTPS03, DcTPS10, DcTPS18 and DcTPS32 had high expression levels in the floral organs, indicating that these genes are closely related to the formation of flower fragrance. The expression through qRT-PCR analysis of the above genes showed that DcTPS02, DcTPS10 and DcTPS03 had the highest expression levels during the full bloom stage. Functional identification of DcTPS genes showed that DcTPS10 was associated with the release of linalool, DcTPS02 was correlated with linalool and α-pinene, and DcTPS32 had a very close link with α-pinene, β-pinene and linalool. According to our categorized information, these three genes were all in the TPS-b subclass, which is annotated as monoterpene synthases. Therefore, by selecting 37 DcTPS genes, we found that DcTPS02, DcTPS10 and DcTPS32 were closely related to the synthesis of linalool, which may play crucial roles in floral scent and attracting pollinators in D. chrysotoxum. The study of TPS family genes showed that these DcTPSs have common features, such as structural similarity, sequence conservation, etc., which makes the transferred DcTPS exhibit similar functions, and these transgenic plants showed improved biosynthesis of terpenes. However, the expression differences among different family members and the internal regulatory mechanisms of different terpenoids between genes still need to be further explored and analyzed.
This comprehensive study provides a molecular basis for further investigation of volatile terpenes in D. chrysotoxum flowers. The characterization of key DcTPS genes could also have genetic potential value for the formation of major terpenes in D. chrysotoxum and other related species.

5. Conclusions

Monoterpene volatiles are the main components of floral fragrance in orchidaceae plants, and TPS is the ultimate enzyme in their biosynthesis. The diversity in the TPS gene family structure specifies their vast range of functions. Until recently, the DcTPS genes’ regulatory system during plant growth and development was poorly understood. In the current study, DcTPS family members were identified through gene family analysis and a comprehensive analysis of members was performed, including the location of conserved motifs, gene structure and promoter cis-acting elements, etc. Gene evolution and selection analysis elucidated the diversity and extension of the family members. In addition, we also investigated the expression of DcTPS genes in different tissues and fluorescence stages, and further selected highly expressed DcTPSs for functional identification in plants. The discovery of three TPS-b genes specifically driving linalool-based scent in D. chrysotoxum provides fundamental insights into the family, which can be utilized in future studies of the TPS-mediated molecular mechanisms underlying plant growth and development. This study may serve as a valuable reference for the functional exploration and molecular breeding of novel aromatic species, paving the way for groundbreaking advancements in this captivating field.

Supplementary Materials

The following supporting information can be downloaded at: https://www.mdpi.com/article/10.3390/horticulturae11060566/s1, Table S1. List of the TPSs sequences in D. chrysotoxum. Table S2. A catalog of DcTPS genes with their HMM profiles. Table S3. TPS genes used in A. thaliana. Table S4. Conserved motifs of DcTPSs. Table S5. Cis-elements in the promoter regions of DcTPS genes. Table S6. Protein–protein interaction (PPI) network analysis of DcTPS genes. Table S7. GO classification analysis of DcTPS genes. Table S8. GO enrichment analysis of DcTPS genes. Table S9. The FPKM values of DcTPS genes in differential tissues. Table S10. Sequences of primers used in qRT-PCR. Table S11. Primer sequence for DcTPS genes clone. Table S12. The release amounts of terpenes were analyzed by GC-MS; Figure S1: pBI121-EGFP plasmid map. Figure S2: Construction of pBI121-DcTPS vectors. Figure S3: Stability analysis of ACT-1 in cultivars of D. chrysotoxum in different fluorescence stages and different tissues.

Author Contributions

Conceptualization, Y.Y.; Methodology, J.G.; Software, Y.Y. and R.N.; Investigation, Q.L. and K.X.; Writing—original draft, Y.Y.; Writing—review and editing, S.Q. and Z.W.; Visualization, Y.Y. and R.N.; Project administration, S.Q.; Funding acquisition, S.Q. and Z.W. All authors have read and agreed to the published version of the manuscript.

Funding

This work was supported by the Natural Science Foundation of Guangxi Zhuang Autonomous Region (2025GXNSFAA069846), the National Natural Science Foundation of China (31560567), the Guangdong Province Modern Agriculture Industry Common Key Technology R&D Innovation Team Construction Project, Facilities and Equipment (Planting Direction) Common Key Technologies (2024CXTD01), the Start-up Fund of Innovation Team of Guangxi Academy of Sciences for Innovation and Utilization of Germplasm in Horticultural Crops (CQZ-E-1919), the Guangxi Light of the Future Visiting Research Program Project (Scientific and Technological Talents Specialized project, 2024), the Fundamental Research Fund of Guangxi Institute of Botany (23011), the Guilin Scientific Research and Technology Development Plan (20220135-1), the Guangxi Key Research and Development Program (Guike AB24010138) and the fund of the Guangxi Key Laboratory of Plant Functional Phytochemicals and Sustainable Utilization (ZRJJ2023-1 and ZRJJ2024-13).

Data Availability Statement

The original contributions presented in the study are included in the article/Supplementary Material, further inquiries can be directed to the corresponding authors.

Conflicts of Interest

The authors declare no conflicts of interest.

Abbreviations

aaamino acid

References

  1. Sun, Z.; Song, Y.; Zeng, R. Advances in studies on intraspecific and interspecific relationships mediated by plant volatiles. J. S. China Agric. Univ. 2019, 40, 166–174. [Google Scholar] [CrossRef]
  2. Wu, J.N.; Liu, Z.Y.; Wu, M.Q. Analysis of Volatile Components in the Flowers of Seven Species of Dendrobium. Mol. Plant Breed. 2023, 3, 1–16. Available online: http://kns.cnki.net/kcms/detail/46.1068.S.20230314.0905.004.html (accessed on 8 January 2022).
  3. Dudareva, N.; Klempien, A.; Muhlemann, J.K.; Kaplan, I. Biosynthesis, function and metabolic engineering of plant3volatile organic compounds. New Phytol. 2013, 198, 16–32. [Google Scholar] [CrossRef]
  4. Abbas, F.; Yu, Y.; Yue, R.; Yue, Y.; Amanullah, S.; Jahangir, M.M.; Fan, Y. Volatile terpenoids: Multiple functions, biosynthesis, modulation and manipulation by genetic engineering. Planta Int. J. Plant Biol. 2017, 246, 115–129. [Google Scholar] [CrossRef]
  5. Yu, F.; Utsumi, R. Diversity, regulation, and genetic manipulation of plant mono- and sesquiterpenoid biosynthesis. Cell. Mol. Life Sci. 2009, 66, 3043–3052. [Google Scholar] [CrossRef] [PubMed]
  6. Baek, Y.S.; Ramya, M.; An, H.R.; Park, P.M.; Lee, S.Y.; Baek, N.I.; Park, P.H. Volatiles Profile of the Floral Organs of a New Hybrid Cymbidium, ‘Sunny Bell’ Using Headspace Solid-Phase Microextraction Gas Chromatography-Mass Spectrometry Analysis. Plants 2019, 8, 251. [Google Scholar] [CrossRef]
  7. Bohlmann, J.; Meyer-Gauen, G.; Croteau, R. Plant terpenoid synthases: Molecular biology and phylogenetic analysis. Proc. Natl. Acad. Sci. USA 1998, 95, 4126–4133. [Google Scholar] [CrossRef]
  8. Huang, L.-M.; Huang, H.; Chuang, Y.-C.; Chen, W.-H.; Wang, C.-N.; Chen, H.-H. Evolution of Terpene Synthases in Orchidaceae. Int. J. Mol. Sci. 2021, 22, 6947. [Google Scholar] [CrossRef]
  9. Flath, R.A.; Ohinata, K. Volatile Components of the Orchid Dendrobium superbum Rchb. f. J. Agric. Food Chem. 1982, 30, 841–842. [Google Scholar] [CrossRef]
  10. Vranová, E.; Coman, D.; Gruissem, W. Network Analysis of the MVA and MEP Pathways for Isoprenoid Synthesis. Annu. Rev. Plant Biol. 2013, 64, 665–700. [Google Scholar] [CrossRef]
  11. Pulido, P.; Perello, C.; Rodriguez-Concepcion, M. New Insights into Plant Isoprenoid Metabolism. Mol. Plant 2012, 5, 964–967. [Google Scholar] [CrossRef] [PubMed]
  12. Simkin, A.J.; Guirimand, G.; Papon, N.; Courdavault, V.; Thabet, I.; Ginis, O.; Bouzid, S.; Giglioli-Guivarc’h, N.; Clastre, M. Peroxisomal localisation of the final steps of the mevalonic acid pathway in planta. Plant Signal. Behav. 2011, 234, 903–914. [Google Scholar] [CrossRef] [PubMed]
  13. Sandra, I.; Krause, S.T.; Grit, K.; Jonathan, G.; Jörg, D.; Köllner, T.G. The organ-specific expression of terpene synthase genes contributes to the terpene hydrocarbon composition of chamomile essential oils. Bmc Plant Biol. 2012, 12, 84–97. [Google Scholar] [CrossRef]
  14. Chen, F.; Tholl, D.; Bohlmann, J.; Pichersky, E. The family of terpene synthases in plants: A mid-size family of genes for specialized metabolism that is highly diversified throughout the kingdom. Plant J. 2011, 66, 212–229. [Google Scholar] [CrossRef]
  15. Degenhardt, J.; Kllner, T.G.; Gershenzon, J. Monoterpene and sesquiterpene synthases and the origin of terpene skeletal diversity in plants. Phytochemistry 2009, 69, 1621–1637. [Google Scholar] [CrossRef]
  16. Gao, F.; Liu, B.; Li, M.; Gao, X.; Fang, Q.; Liu, C.; Ding, H.; Wang, L.; Gao, X. Identification and Characterization of Terpene Synthase Genes Accounting for the Volatile Terpene Emissions in Flowers of Freesia × hybrida. J. Exp. Bot. 2018, 69, 4249–4265. [Google Scholar] [CrossRef] [PubMed]
  17. Bateman, A.; Coin, L.; Durbin, R.; Finn, R.D.; Hollich, V.; Griffiths-Jones, S.; Khanna, A.; Marshall, M.; Moxon, S.; Sonnhammer, E.L.L.; et al. The Pfam Protein Families Database. Nucleic Acids Res. 2004, 32, D138–D141. [Google Scholar] [CrossRef]
  18. Jiang, S.Y.; Jin, J.J.; Sarojam, R.; Ramachandran, S. A Comprehensive Survey on the Terpene Synthase Gene Family Provides New Insight into Its Evolutionary Patterns. Genome Biol. Evol. 2019, 11, 2078–2098. [Google Scholar] [CrossRef]
  19. Trapp, S.C.; Croteau, R.B. Genomic Organization of Plant Terpene Synthases and Molecular Evolutionary Implications. Genetics 2001, 158, 811–832. [Google Scholar] [CrossRef]
  20. Tholl, D.; Lee, S. Terpene Specialized Metabolism in Arabidopsis thaliana. Arab. Book 2011, 9, e0143. [Google Scholar] [CrossRef]
  21. Falara, V.; Akhtar, T.A.; Nguyen, T.T.H.; Spyropoulou, E.A.; Bleeker, P.M. The tomato (Solanum lycopersicum) terpene synthase gene family. Plant Physiol. 2011, 157, 770–789. [Google Scholar] [CrossRef] [PubMed]
  22. Martin, D.M.; Aubourg, S.; Schouwey, M.B.; Daviet, L.; Schalk, M.; Toub, O.; Lund, S.T.; Bohlmann, J. Functional Annotation, Genome Organization and Phylogeny of the Grapevine (Vitis vinifera) Terpene Synthase Gene Family Based on Genome Assembly, FLcDNA Cloning, and Enzyme Assays. BMC Plant Biol. 2010, 10, 226. [Google Scholar] [CrossRef] [PubMed]
  23. Zhang, G.Q.; Liu, K.W.; Li, Z.; Lohaus, R.; Hsiao, Y.Y.; Niu, S.C.; Wang, J.Y.; Lin, Y.C.; Xu, Q.; Chen, L.J.; et al. The Apostasia genome and the evolution of orchids. Nature 2017, 549, 379–383. [Google Scholar] [CrossRef]
  24. Kaundal, R.; Zhao, S.P.X. Combining Machine Learning and Homology-Based Approaches to Accurately Predict Subcellular Localization in Arabidopsis. Plant Physiol. 2010, 154, 36–54. [Google Scholar] [CrossRef]
  25. Chou, K.C.; Shen, H.B. Plant-mPLoc: A Top-Down Strategy to Augment the Power for Predicting Plant Protein Subcellular Localization. PLoS ONE 2010, 5, e11335. [Google Scholar] [CrossRef]
  26. Ojeda, D.I.; Santosguerra, A.; Olivatejera, F.; Valido, A.; Xue, X.; Marrero, A.; Caujapé-Castells, J.; Cronk, Q. Bird-pollinated Macaronesian Lotus (Leguminosae) evolved within a group of entomophilous ancestors with post-anthesis flower color change. Perspect. Plant Ecol. Evol. Syst. 2013, 15, 193–204. [Google Scholar] [CrossRef]
  27. Byers, K.J.R.P.; Vela, J.P.; Peng, F.; Riffell, J.A.; Bradshaw, H.D. Floral volatile alleles can contribute to pollinator-mediated reproductive isolation in monkeyflowers (Mimulus). Plant J. Cell Mol. Biol. 2015, 80, 1031–1042. [Google Scholar] [CrossRef]
  28. Knudsen, J.T.; Eriksson, R.; Gershenzon, J.; Ståhl, B. Diversity and distribution of floral scent. Bot. Rev. 2006, 72, 1. [Google Scholar] [CrossRef]
  29. Ramsey, J.; Bradshaw, H.D.; Schemske, D.W. Components of reproductive isolation between the monkeyflowers mimulus lewisii and m. cardinalis (phrymaceae). Evolution 2003, 57, 1520–1534. [Google Scholar] [CrossRef]
  30. Dudareva, N.; Murfitt, L.M.; Mann, C.J.; Gorenstein, N.; Kolosova, N.; Kish, C.M.; Bonham, C.; Wood, K. Developmental Regulation of Methyl Benzoate Biosynthesis and Emission in Snapdragon Flowers. Plant Cell 2000, 12, 949–961. [Google Scholar] [CrossRef]
  31. Yang, Y.; Xia, K.; Wu, Q.; Lu, X.; Lu, S.; Zhao, Z.; Qiu, S. Combined Analysis of Volatile Compounds and Extraction of Floral Fragrance Genes in Two Dendrobium Species. Horticulturae 2023, 9, 745. [Google Scholar] [CrossRef]
  32. Burkhardt, D.; Mosandl, A. Biogenetic Studies in Syringa vulgaris L.:  Bioconversion of 18O(2H)-Labeled Precursors into Lilac Aldehydes and Lilac Alcohols. J. Agric. Food Chem. 2003, 51, 7391–7395. [Google Scholar] [CrossRef] [PubMed]
  33. Shalit, M.; Guterman, I.; Volpin, H.; Bar, E.; Tamari, T.; Menda, N.; Adam, Z.; Zamir, D.; Vainstein, A.; Weiss, D.; et al. Ester Formation in Roses. Identification of an Acetyl-Coenzyme A. Geraniol/Citronellol Acetyltransferase in Developing Rose Petals. Plant Physiol. 2003, 131, 1868–1876. [Google Scholar] [CrossRef] [PubMed]
  34. Yu, Z.M.; Zhao, C.H.; Zhang, G.H.; Silva, J.A.T.; Duan, J. Genome-Wide Identification and Expression Profile of TPS Gene Family in Dendrobium officinale and the Role of DoTPS10 in Linalool Biosynthesis. Int. J. Mol. Sci. 2020, 21, 5419. [Google Scholar] [CrossRef]
  35. Wang, Q.Q.; Zhu, M.J.; Yu, X.; Bi, Y.Y.; Zhou, Z.; Chen, M.K.; Chen, J.; Zhang, D.; Ai, Y.; Liu, Z.J.; et al. Genome-Wide Identification and Expression Analysis of Terpene Synthase Genes in Cymbidium faberi. Front. Plant Sci. 2021, 12, 751853. [Google Scholar] [CrossRef]
  36. Chuang, Y.C.; Hung, Y.C.; Tsai, W.C.; Chen, H.H. PbbHLH4 regulates floral monoterpene biosynthesis in Phalaenopsis orchids. J. Exp. Bot. 2018, 69, 4363–4377. [Google Scholar] [CrossRef]
  37. Green, S.A.; Chen, X.; Nieuwenhuizen, N.J.; Matich, A.J.; Wang, M.Y.; Bunn, B.J.; Yauk, Y.K.; Atkinson, R.G. Identification, functional characterization, and regulation of the enzyme responsible for floral (E)-nerolidol biosynthesis in kiwifruit (Actinidia chinensis). J. Exp. Bot. 2011, 63, 1951–1967. [Google Scholar] [CrossRef]
  38. Nieuwenhuizen, N.J.; Wang, M.Y.; Matich, A.J.; Green, S.A.; Chen, X.; Yauk, Y.K.; Beuning, L.L.; Nagegowda, D.A.; Dudareva, N.; Atkinson, R.G. Two terpene synthases are responsible for the major sesquiterpenes emitted from the flowers of kiwifruit (Actinidia deliciosa). J. Exp. Bot. 2009, 60, 3203–3219. [Google Scholar] [CrossRef]
  39. Feng, L.G.; Chen, C.; Sheng, L.X.; Liu, P.; Tao, J.; Su, J.L.; Zhao, L.Y. Comparative analysis of headspace volatiles of Chinese Rosa rugosa. Molecules 2010, 15, 8390–8399. [Google Scholar] [CrossRef]
  40. Heller, S.R.; Milne, G.W. EPA/NIH Mass Spectral Data Base; U.S. Governwent Printing Office: Washington, DC, USA, 1980.
  41. Zhang, H.; Chen, M.; Wang, X.; Dai, J.; Zhang, X.; Zhang, Z.; Zhang, X.; Tang, M.; Tang, J.; Gong, J.; et al. Transcriptome Analysis of Rhododendron liliiflorum H. Lév. Flower Colour Differences. Horticulturae 2023, 9, 82. [Google Scholar] [CrossRef]
  42. Lescot, M.; Déhais, P.; Thijs, G.; Marchal, K.; Moreau, Y.; Van de Peer, Y.; Rouzé, P.; Rombauts, S. PlantCARE, a database of plant cis-acting regulatory elements and a portal to tools for in silico analysis of promoter sequences. Nucleic Acids Res. 2002, 30, 325–327. [Google Scholar] [CrossRef]
  43. Chen, C.; Chen, H.; Zhang, Y.; Thomas, H.R.; Frank, M.H.; He, Y.; Xia, R. TBtools, a Toolkit for Biologists integrating various HTS-data handling tools with a user-friendly interface. Cold Spring Harb. Lab. 2020, 13, 1194–1202. [Google Scholar] [CrossRef]
  44. Hsiao, Y.Y.; Pan, Z.J.; Hsu, C.C.; Yang, Y.P.; Hsu, Y.C.; Chuang, Y.C.; Shih, H.H.; Chen, W.H.; Tsai, W.C.; Chen, H.H. Research on Orchid Biology and Biotechnology. Plant Cell Physiol. 2011, 52, 1467–1486. [Google Scholar] [CrossRef] [PubMed]
  45. Aubourg, S.; Lecharny, A.; Bohlmann, J. Genomic analysis of the terpenoid synthase (AtTPS) gene family of Arabidopsis thaliana. Mol. Genet. Genom. 2002, 267, 730–745. [Google Scholar] [CrossRef] [PubMed]
  46. Li, G.L.; Köllner, T.G.; Yin, Y.B.; Jiang, Y.F.; Chen, H.; Xu, Y.; Gershenzon, J.; Pichersky, E.; Chen, F. Nonseed plant Selaginella moellendorfii has both seed plant and microbial types of terpene synthases. Proc. Natl. Acad. Sci. USA 2012, 109, 14711–14715. [Google Scholar] [CrossRef]
  47. Cao, Z.; Ma, Q.; Weng, Y.; Shi, J.; Chen, J.; Hao, Z. Genome-Wide Identification and Expression Analysis of TPS Gene Family in Liriodendron chinense. Genes 2023, 14, 770. [Google Scholar] [CrossRef]
  48. Li, N.; Dong, Y.; Lv, M.; Qian, L.; Sun, X.; Liu, L.; Cai, Y.; Fan, H. Combined Analysis of Volatile Terpenoid Metabolism and Transcriptome Reveals Transcription Factors Related to Terpene Synthase in Two Cultivars of Dendrobium officinale Flowers. Front. Genet. 2021, 12, 661296. [Google Scholar] [CrossRef]
  49. Zeng, X.; Liu, C.; Zheng, R.; Cai, X.; Luo, J.; Zou, J.; Wang, C. Emission and Accumulation of Monoterpene and the Key Terpene Synthase (TPS) Associated with Monoterpene Biosynthesis in Osmanthus fragrans Lour. Front. Plant Sci. 2016, 12, 1232. [Google Scholar] [CrossRef]
Figure 1. Different flowering stages of D. chrysotoxum: (A) bud stage; (B) first flowering stage; (C) full bloom stage; (D) declining stage.
Horticulturae 11 00566 g001
Figure 2. Different flower parts of D. chrysotoxum: (A) plants of D. chrysotoxum; (B) leaves; (C) pseudobulbs; (D) petals, sepals, labellums and gynandrium.
Horticulturae 11 00566 g002
Figure 3. Phylogenetic analysis of AtTPS and DcTPS proteins. Subgroups are indicated by different colors. The phylogenetic tree was constructed using the Maximum Likelihood statistical method, with 1000 bootstrap replications under the Poisson model. The resulting tree was subsequently visualized and annotated using FigTree v1.4.3 software.
Horticulturae 11 00566 g003
Figure 4. Arrangement of conserved motifs and structural features in DcTPS genes: (A) a phylogenetic tree was generated using the neighbor-joining method with the MEGA-7.0 software; (B) distribution of conserved motifs within DcTPS genes. Various motifs (1–10) are indicated by distinct colors; (C) structures of the 37 DcTPS genes. Exons are depicted as yellow boxes, while introns are shown as black lines. The green boxes indicate the untranslated regions (UTRs) within gene sequences. The logo of motif 1 and motif 9 are at the bottom of the image.
Horticulturae 11 00566 g004
Figure 5. Promoter analysis of DcTPS genes: (A) prediction of cis-elements in the promoter regions. The number at the bottom represents the distance to the translation start codon, ATG; (B) the proportion of different cis-elements elements in plant growth and development; (C) the proportion of different cis-elements elements in plant phytohormone responsiveness; (D) the proportion of different cis-elements elements in and stress responsiveness.
Horticulturae 11 00566 g005
Figure 6. Protein–protein interaction (PPI) network analysis of the DcTPS.
Horticulturae 11 00566 g006
Figure 7. GO ontology annotations and enrichment analysis of DcTPSs. (A) GO ontology annotations analysis; (B) GO enrichment analysis. The *** in the figure indicate the statistical significance (adjusted p-value < 0.001).
Horticulturae 11 00566 g007
Figure 8. Differential tissue expression patterns of DcTPS genes. On the left is the tree diagram of sample clustering. The color in the figure represents the expression value of this gene after standardized treatment in each sample. The change from orange to blue within the round-rectangle shape indicated high to low expression levels. The change from red to blue within the circle shape indicated the expression quantity size by area. The numbers in the upper right color represent trends in gene expression levels. The FPKM expression values are listed in supplementary Table S9 and the heatmap was generated in TBtools [43].
Horticulturae 11 00566 g008
Figure 9. Analysis of DcTPS genes relative expression in different fluorescence stages. BS, Bud stage; FFS, First flowering stage; FBS, Full bloom stage; DS, Declining stage. The error bars indicate three biological replicates. Data are presented as means ± SD.
Horticulturae 11 00566 g009
Figure 10. Functional characterization of DcTPSs in tobacco leaves by Agrobacterium-mediated infiltration. The X-axis represents the retention time of the peak outflow, and the Y-axis represents integrated area of the chromatographic peak. Reactions only performed with empty binary vectors were used as the blank control (these data were listed in Supplementary Table S12). New product peaks were observed in contrast to controls and were identified by comparing with the NIST 2005 Mass Spectral Library.
Horticulturae 11 00566 g010
Table 1. Physical and chemical characteristics of DcTPS genes.
DcTPS s NameProteinLength (a.a)Molecular Weight Mw/kDaTheoretical pIInstability IndexAliphatic IndexGrand Average of Hydropathicity
DcTPS 151058.848.1640.9888.14−0.174
DcTPS 242748.795.7143.0093.70−0.085
DcTPS 31286150.385.9945.4492.86−0.242
DcTPS 467077.976.5645.9496.06−0.195
DcTPS 553062.766.9447.1894.38−0.206
DcTPS 651260.525.5846.5396.93−0.215
DcTPS 755364.915.5540.0797.32−0.263
DcTPS 851058.456.0039.7697.18−0.105
DcTPS 943851.355.3045.0797.72−0.205
DcTPS 1059869.485.2147.2692.81−0.236
DcTPS 1176488.927.0739.4293.69−0.280
DcTPS 1245853.886.0744.1593.89−0.191
DcTPS 1360671.036.0845.4688.18−0.314
DcTPS 1464875.925.4841.5593.49−0.249
DcTPS 15940109.395.6940.3793.46−0.160
DcTPS 1662773.155.6146.3397.99−0.134
DcTPS 1765776.625.2342.6697.20−0.157
DcTPS 1839546.255.4936.8397.44−0.137
DcTPS 1961972.616.4141.0393.47−0.262
DcTPS 2083497.327.1247.9086.24−0.359
DcTPS 211305152.198.4643.4086.08−0.349
DcTPS 2260871.107.8841.1885.84−0.375
DcTPS 2356365.795.6849.3084.01−0.334
DcTPS 2484298.765.3740.2294.87−0.113
DcTPS 2550458.975.2939.8393.27−0.221
DcTPS 2648656.695.1942.2297.08−0.163
DcTPS 2755064.785.6549.2695.20−0.216
DcTPS 2844652.785.5446.7194.01−0.238
DcTPS 2949958.935.7044.7698.48−0.156
DcTPS 30923105.176.1345.0493.69−0.084
DcTPS 3136041.829.7957.0483.17−0.480
DcTPS 3277891.895.9844.6789.29−0.355
DcTPS 3359870.245.9142.6091.84−0.270
DcTPS 3461772.145.8651.2893.42−0.243
DcTPS 3553963.335.5146.9099.83−0.194
DcTPS 3654964.365.6938.1292.66−0.397
DcTPS 3750959.575.5439.4186.07−0.300
Disclaimer/Publisher’s Note: The statements, opinions and data contained in all publications are solely those of the individual author(s) and contributor(s) and not of MDPI and/or the editor(s). MDPI and/or the editor(s) disclaim responsibility for any injury to people or property resulting from any ideas, methods, instructions or products referred to in the content.

