Article

Native Grasses Enhance Topsoil Organic Carbon and Nitrogen by Improving Soil Aggregates and Microbial Communities in Navel Orange Orchards in China

1
National Navel Orange Engineering Research Center, Life Sciences College, Gannan Normal University, Ganzhou 341000, China
2
Jiangxi Agricultural Meteorology Center, Nanchang 330096, China
*
Author to whom correspondence should be addressed.
Horticulturae 2025, 11(5), 560; https://doi.org/10.3390/horticulturae11050560
Submission received: 10 April 2025 / Revised: 12 May 2025 / Accepted: 19 May 2025 / Published: 21 May 2025
(This article belongs to the Section Plant Nutrition)

Abstract

:
In Gannan navel orange (Citrus sinensis) orchards—a typical sloped farmland ecosystem—selected native grasses outperform conventional green manure due to their stronger ecological adaptability and lower management requirements. However, few studies have investigated how native grasses enhance soil organic carbon and nitrogen contents at the soil aggregate level. A 5-year field study was carried out to analyze the impacts of the native grasses practice on the accumulation of soil organic carbon and nitrogen and the physicochemical properties and microbial communities of soil aggregates in navel orange orchards. Three treatments were tested: (i) clean tillage (CK); (ii) intercropping Centella asiatica (L.) Urban (CA); (iii) intercropping Stellaria media (L.) Cvr. (SM). Our work found that, compared to CK, the soil physical properties improved under the long-term management of native grasses, and the content of nutrients in the soil increased. The contents of SOC (+118.3–184.2%) and total nitrogen (TN) (+73.3–81.5%) changed significantly. The proportion of soil macro-aggregates and the stability of soil aggregates increased, and the contents of SOC and TN in the soil aggregates increased. In addition, under the long-term management of native grasses, the community diversity of beneficial microbes and the abundance of functional genes related to nitrogen cycling increased significantly in the soil aggregates. Native grasses increased the content of nutrients in the soil aggregates by increasing aggregate stability and the abundance of related microorganisms, altering the microbial community structure, and increasing the abundance of related genes for nutrient cycling, thereby enhancing the sequestration of SOC and TN in topsoil. Our results will provide a theoretical basis for the carbon enhancement and fertilization of native grasses as green manure in navel orange orchards and their popularization and application.

1. Introduction

Navel oranges (Citrus sinensis) are highly favored by consumers owing to their excellent appearance, bright color, crispy and tender flesh, good fruit thinning ability, and rich and aromatic flavor [1]. In 2022, 126,000 ha were planted with navel oranges in southern Jiangxi, with a yield of 1.586 million tons, such that the region ranked first for the number of hectares planted and third for navel orange yield in the world. The navel orange industry had become a characteristic and leading agricultural industry in southern Jiangxi, China [2]. The navel orange orchard in southern Jiangxi, China, that was studied is an area of sloping cultivated land and an equal-height, reverse-slope orchard, which is located in a typical hilly area of red soil that primarily consists of mountains, hills, and basins, with numerous mountain slopes. The red soil in southern Jiangxi, China, is acidic and has a relatively viscous texture. There are extensive and severe areas of erosion in the red soil in the hilly areas of southern Jiangxi, China, owing to severe soil erosion and loose vegetation, which is not conducive to the growth and development of plants [3]. Currently, the biodiversity of red soil in the hilly areas of southern Jiangxi, China, has been seriously degraded, and the yields of crops have decreased [4]. The poor soil quality seriously restricts the yield and quality of navel oranges. Therefore, improving the soil quality is crucial for the sustainable development of the navel orange industry.
Sod culture, including green manure and natural grass, is an effective way to apply light and simplified fertilizer and reduce the degradation of soil in orchards. Current research shows that green manure could enhance the content of organic matter in the soil, with a particularly notable enhancement in SOC. SOC significantly influences soil properties and ecosystem functions. SOC can directly regulate soil nutrient cycling and biological activity [5]. Its content influences soil productivity and degradation processes, thereby affecting both crop yield and quality. Therefore, SOC plays a pivotal role in maintaining soil quality and agricultural ecosystem balance [6,7]. Moreover, green manure can alleviate the degradation of organic matter and enhance its versatility [8]. In addition, it can promote an increase in the abundance of beneficial microorganisms and improve the utilization of soil water and nutrients [9,10]. Thus, green manure, as a high-quality organic fertilizer, can significantly improve the quality of soil [11]. However, it is difficult to apply conventional green manure to the navel orange orchards on the sloping land of southern Jiangxi, China, and it does not improve the soil very effectively owing to the terrain of hilly and mountainous areas and the low ecological adaptability of green manure. In addition, naturally occurring grasses are often accompanied by malignant weeds. Such weeds hinder the growth of crops by competing with them for water, nutrients, and sunlight, which reduces crop yields [12]. Therefore, currently, grass is not frequently cultivated in the navel orange orchards in southern Jiangxi, China, and it is urgent to identify suitable models of soil management to improve the soil quality. Through extensive long-term research, we discovered that Centella asiatica (L.) Urban and Stellaria media (L.) Cvr. were native grasses that had been artificially selected for years in some navel orange orchards in southern Jiangxi, China (Figure S1). They are low-growing grasses that do not affect agricultural operations and can quickly form dominant groups with a large biomass and are effective in controlling other grasses, conserving soil and water, fixing SOC, and cultivating fertilizer. In addition, they are highly adaptable ecologically, and after becoming established as the dominant group of grasses, they can be managed for a long time at a lower cost. Therefore, Centella asiatica (L.) Urban and Stellaria media (L.) Cvr. are very suitable as green manure to cultivate grass in the navel orange orchards in southern Jiangxi, China.
Green manure has been shown to increase the sequestration of SOC in the soil and reduce the loss of TN [13,14]. Therefore, we hypothesized that the long-term management of native grasses would promote the retention of organic carbon and nitrogen in the soil. However, there has been limited research to explain the effects of retaining nutrients in the soil, with even less research on the accumulation of SOC and TN in soil aggregates and their effects on microorganisms. Therefore, we studied the retention of SOC and TN and microbial mechanisms of soil aggregates under the long-term management of native grasses in navel orange orchards in southern Jiangxi, China, with the following goals: (1) to determine the effects of long-term management of the native grasses on soil physicochemical properties and nutrient contents, such as SOC and TN; (2) to determine the effect of long-term management of native grasses on the physical properties, the SOC and TN contents, and the SOC components of soil aggregates; and (3) to clarify the microbial changes in soil aggregates and the driving mechanism of organic carbon and nitrogen sequestration. The results of this study will provide a theoretical basis for the application and promotion of native grasses as green manure in navel orange orchards.

2. Materials and Methods

2.1. Experimental Site

The Gannan navel orange production area is located in a typical red soil hilly area in southern Jiangxi Province, China (Figure S2). The terrain is primarily composed of mountains, hills, and basins, and its altitude is 29 to 1984 m. The climate in this area is a typical subtropical hilly and mountainous humid monsoon climate, which is characterized by a mild climate, four distinct seasons, and short durations of extreme heat and cold. The average annual temperature is 19.4 °C, and the average annual rainfall is 1587.1 mm. The site receives 1610.6 h of sunshine a year. It has a long frost-free period of 288 days. According to the method of Classification and Retrieval of Soil Systems in China (third edition), the soil in this area is dominated by a red soil subclass of red loam, which belongs to moist iron-rich soil, showing moderate desilication and iron-rich aluminization. Red soil (Ferralsols) is usually red or brownish-red and acidic and sticky, and it erodes easily because of long-term humid and hot conditions, especially in hilly orchards [15]. Anxi Town, Xinfeng County, Ganzhou City, Jiangxi Province, China, is the origin and core industrial park of the Gannan Navel Orange Garden. Therefore, we chose the navel orange industrial park with an area of approximately 66.7 ha (25°12′57″ E, 115°4′30″ N) in Anxi Town to conduct the study to monitor native grasses over the long-term.

2.2. Experimental Design and Sampling

This long-term monitoring experiment on native grasses was established in March 2019 in a navel orange orchard. Prior to treatment implementation, the baseline soil conditions were as follows: pH: 5.48, soil organic carbon (SOC): 7.16 g·kg⁻1, total nitrogen (TN): 0.18 g·kg⁻1, available phosphorus (Olsen-P): 12.54 mg·kg⁻1, and available potassium (AK): 137.48 mg·kg⁻1. We adopted three treatments, including clean tillage (CK), intercropping with Centella asiatica (L.) Urban (CA) between the navel oranges, and intercropping with Stellaria media (L.) Cvr. (SM) between the navel oranges. CK was in a state in which there was a lack of natural grass all year round. The navel orange seedlings were transplanted in November 2018, and the variety of navel orange was Newhall. Samples were taken for study in March 2024. By this time, the native grasses in the test area had been cultivated and managed for 5 consecutive years, and during this period, the water and fertilizer management of navel oranges involved the intelligent management of an integrated water and fertilizer management system (Figure S3).
Three replicate plots (20 m × 20 m each) were established per treatment in a randomized block design. Within each plot, five sampling trees were selected in an “S” shape, and soil samples were collected at the crown drip line (avoiding fertilization holes), with a soil moisture content of 25.3–27.5% during sampling. Prior to sampling, the layer of litter was removed from each selected representative sampling point. Then, three independent sampling methods were performed: digging a 30 cm deep soil profile, collecting soil cores with a pipe drill, and obtaining undisturbed samples using a ring knife. Five soil cores were collected simultaneously and mixed as a repetition for each treatment from the top 10 cm of the soil profile of each plot using sterile aluminum containers that were 10 cm high and 15 cm in diameter. After the litter, roots, stones, and debris were removed from the sterile aluminum container, the samples obtained were divided into two subsamples. One was passed through an 8 mm sieve that had been sterilized with ethanol, and the collected soil was kept at a low temperature and immediately sent back to the laboratory to subsequently determine the diversity of the microbial community and functional genes related to nutrient cycling in the soil aggregates, and the other was air-dried for a physicochemical analysis of the soil aggregates [16]. The sample obtained from the pipe-type soil drill was air-dried for a chemical analysis. The samples taken by the ring knife were weighed and dried for a physical analysis. In addition, the aboveground biomass of native grasses was collected from 5 m2 plots, with three replicates. CK had no natural grass growing at this time, so we collected samples of CA and SM. The grass was sampled twice a year to determine its annual production.

2.3. Physicochemical Analysis of the Native Grasses

The plants were incubated in a 105 °C oven for 30 min and dried to a constant weight at 75 °C. They were then weighed on an electronic balance. The contents of total carbon (TC), total nitrogen (TN), total phosphorus (TP), and total potassium (TK) were determined using a continuous flow analyzer (model: San + +; skalar, Breda, The Netherlands).

2.4. Soil Physicochemical Analysis, Nutrient Content, and Enzyme Activity

Soil pH was measured using a pH meter (FE28-Standard; Mettler Toledo, Zurich, Switzerland) in a 1:2.5 soil–water (w/v) mixture. The soil organic carbon (SOC) content was measured by the dichromate oxidation method, as described by Bao [17]. The total nitrogen (TN) content was measured using an automatic Kjeldahl analyzer (Kjeltec 8400; FOSS Corporation, Hilleroed, Denmark). Available phosphorus (Olsen-P) was measured using the molybdenum blue method with an ultraviolet spectrophotometer (UV-3600; Shimadzu Corporation, Kyoto, Japan). Available potassium (AK) was determined by ammonium acetate leaching-flame photometry with a flame photometer (FP6400A; Shanghai precision scientific instrument Co., Ltd., Shanghai, China). The soil bulk density and porosity were measured using a soil ring knife as previously described [18].
The activities of urease, catalase, sucrase, acid phosphatase, and amylase in the soil were assayed as described by Wang et al. [19]. Soil urease activity was measured by indophenol blue colorimetry with urea as the substrate. Soil catalase activity was determined volumetrically by measuring residual hydrogen peroxide through potassium permanganate (KMnO4) titration in the presence of sulfuric acid (H2SO4). Soil sucrase activity was measured by 3,5-dinitro salicylic acid colorimetry with sucrose as the substrate. Soil acid phosphatase activity was determined using the disodium phenyl phosphate colorimetric method with pH 5.0 acetate buffer. Soil α-amylase activity was measured by 3,5-dinitro salicylic acid colorimetry using soluble starch as the substrate.

2.5. Fractionation and Physicochemical Analysis of the Soil Aggregates

Dry and wet sieving were used to determine the number of mechanically stable aggregates and water-stable aggregates of each size of fraction in the air-dried soil [20]. A total of 500 g of air-dried soil was placed on top of a set of sleeve sieves that had 2 mm, 1 mm, and 0.25 mm apertures. They were covered and shaken. Soil was collected from each aperture sieve and weighed for later use. The air-dried sample was divided into 100 g soil samples, and each was placed on a stacked sieve with pore diameters of 2 mm, 1 mm, and 0.25 mm in turn, based on the percentage of the aggregate content of each size of fraction obtained by dry sieving. After soaking for 15 min, a TPF-100 soil aggregate structure analyzer (Zhejiang Topu Yunnong Technology Co., Ltd., Hangzhou, China) was used to test the samples. After it had been used for 15 min, each size of fraction that remained on the sieve was washed into the aluminum box, and the supernatant was discarded after clarification. The remaining aggregates were then oven-dried to a constant weight at 50 °C.
The dried aggregates of different sizes of fractions were weighed before they were analyzed physically. Their stability was determined based on water-stable aggregates using the mean weight diameter (MWD), the geometric mean diameter (GMD), an aggregate content greater than 0.25 mm (R0.25), the aggregate failure rate (PAD), the unstable aggregate index (ELT), and the fractal dimension (D), as shown below:
MWD =   i = 1 n ( x ¯ i w i )
where x ¯ i represents the average diameter of aggregates of each size fraction and w i represents the proportion of aggregates of each size fraction.
GMD =   E x p i = 1 n m i ln x ¯ i i = 1 n m i
where m i represents the aggregate weight of the soil of different size fractions.
R 0.25 = M T > 0.25 M T
where M T represents the total mass of the aggregates and M T > 0.25 represents the weight of the aggregates with a diameter > 0.25 mm.
PAD   ( % ) =   W d r y W w e t W d r y × 100
where W d r y represents >0.25 mm dry-sieve aggregate content and W w e t represents >0.25 mm wet-sieve aggregate content.
E LT   ( % ) = W T W > 0.25 W T × 100
where W T represents the total weight of the soil tested and W > 0.25 represents the water-stable aggregate weight of >0.25 mm.
M ( r < x ¯ i ) M T   = x ¯ i x m a x 3 D
where M ( r < x ¯ i ) represents the aggregate weight of the size fraction less than a certain size and x m a x represents the maximum aggregate size.
The TN and SOC contents of the dried water-stable aggregates were then determined by an automatic Kjeldahl analyzer and the dichromate oxidation method, respectively, as previously described. The components of SOC were then measured [21]. A total of 10 g of each size fraction of the water-stable aggregates was placed in a 50 mL centrifuge tube, and 30 mL of 5 g·L−1 sodium hexametaphosphate (Shanghai Yien Chemical Technology Co., Ltd., Shanghai, China) was added. The tube was shaken well by hand and then on a shaking table at 180 rpm for 18 h. The dispersed solution was washed through a sieve of 0.053 mm and repeatedly washed with pure water until the water was clear. The portion that remained in the sieve was considered to be the particulate organic carbon (>0.053 mm, POC), and the portion under the sieve was the mineral-associated organic carbon (<0.053 mm, MAOC). The upper and lower parts were collected with stainless-steel disks and dried at 60 °C, weighed, and ground. The POC and MAOC contents were measured using the dichromate oxidation method, as described by Bao [17].
The rate of contribution of the soil water-stable aggregates to the contents of SOC and TN for each size fraction was calculated as shown below:
P   ( % ) = W 1 × W S A i W 3
where P represents the rate of contribution of the soil water-stable aggregates to the SOC (TN), W 1 (g·kg−1) represents the content of SOC (TN) in aggregates of this size, W S A i (%) represents the proportion of aggregates of this size, and W 3 (g·kg−1) represents the content of SOC (TN) in the topsoil.
The parameters of correlation between the contents of the SOC component and the composition of SOC in the differently sized fractions are shown below:
POC = SOC POC   ×     M P O C M P O C + M M A O C
MAOC = SOC MAOC   ×     M M A O C M P O C + M M A O C
where MPOC (g) and MMAOC (g) represent the mass of separated granular organic matter > 0.053 mm and mineral-bonded organic matter < 0.053 mm, respectively; SOCPOC (g·kg−1) and SOCMAOC (g·kg−1) represent the measured values of POC and MAOC in the aggregates; and POC (g·kg−1) and MAOC (g·kg−1) represent the actual contents of granular organic carbon and mineral-bound organic carbon in the aggregates, respectively.

2.6. Improved Fractionation of the Soil Aggregates and Their Functional Genes and an Analysis of the Microbial Community Diversity

2.6.1. Improved Fractionation of the Soil Aggregates

“Optimal moist” sieving was used to reduce the damage to the diversity of the microbial community. The fresh soil that was stored in a 4 °C aseptic environment was incubated for approximately 1 week to reach a moisture content of 20%, and the soil aggregates were then fractionated [22]. They were transferred to a set of dry sieves with 2 mm, 1 mm, and 0.25 mm apertures and shaken for 2 min. The roots, stones, and other debris in the soil were removed, and the soil aggregates of >2 mm (large macro-aggregates, LMA), 1–2 mm (medium macro-aggregates, MMA), 0.25–1 mm (small macro-aggregates, SMA), and <0.25 mm (micro-aggregates, MI) were collected [23]. The soil aggregates collected from the four different size fractions were stored at −80 °C for the subsequent extraction and analysis of their DNA.

2.6.2. Real-Time Quantitative Polymerase Chain Reaction (qPCR)

A real-time quantitative polymerase chain reaction (qPCR) was used to determine the copy numbers of functional genes related to carbon and nitrogen cycling in soil aggregates by Shanghai Majorbio Bio-pharm Technology Co., Ltd. (Shanghai, China). The total DNA was extracted from the soil samples using the FastPure Soil DNA Isolation Kit (Shanghai Meiji Yuhua Biomedical Technology Co., Ltd., Shanghai, China). Thereafter, primers were designed, and PCR amplification was performed based on the primers. During the amplification process, sterile water was used as a negative control, and the absence of bands in the control indicated that there was no environmental pollution during the experiment. The copy numbers of five functional genes associated with soil nutrient cycling were determined using corresponding primers [24] (Table S1): the genes for the sequestration of C in the soil included the gene that encodes the ribulose-1,5-bisphosphate carboxylase/oxygenase (Rubisco) large subunit (cbbL), and Rubisco is the key enzyme in the main pathway of CO2 fixation, which is the Calvin–Benson–Bassham cycle (CBB cycle) [25]. The genes for N cycling included amoA-AOB, nirS, nirK, and nifH. amoA-AOB participates in the oxidation of ammonia; nirS and nirK participate in nitrate reduction; and nifH participates in N fixation [26]. Plasmids were constructed, and each plasmid was diluted with a 10-fold gradient using 90 µL dilution solution + 10 µL plasmid, selecting 10−1–10−7 dilution solution of the cbbL standard, 10−1–10−8 dilution solution of the AOB standard, 10−2–10−8 dilution solution of the nirS standard, 10−2–10−8 dilution solution of the nirK standard, and 10−1–10−8 dilution solution of the nirH standard for the preparation of standard curves, repeated three times. Among them, the amplification efficiencies of the cbbL, AOB, nirS, nirK, and nirH standards were 91.03%, 104.60%, 98.81%, 100.29%, and 100.56%, respectively. The R2 values were 0.9963, 0.9994, 0.9999, 0.9979, and 0.9993, respectively. The slopes were −3.5573, −3.2165, −3.3507, −3.3151, and −3.3085, respectively. The Y-inter values were 41.051, 37.557, 38.601, 37.957, and 38.634, respectively. Then, qPCR was used to determine the absolute contents of five genes in the samples by means of a quantitative PCR platform (ABI7300 fluorescent quantitative PCR platform; Applied Biosystems, Waltham, MA, USA).

2.6.3. High-Throughput Sequencing and Sequence Processing

The bacterial 16S rRNA genes and fungal ITS1 were subjected to high-throughput sequencing by Shanghai Majorbio Bio-Pharm Technology Co., Ltd. First, the genomic DNA was extracted using the FastPure Soil DNA Isolation Kit (Shanghai Meiji Yuhua Biomedical Technology Co., Ltd., Shanghai, China), and the extracted genomic DNA was detected by 1% agarose gel electrophoresis. The V3 + V4 region of the bacterial 16S rRNA gene was amplified using primers 338F and 806R [27] (Table S1). The fungal ITS1 region was amplified using primers ITS1F and ITS2R [28]. After PCR amplification, the PCR products were detected and quantified using the QuantiFluor™-ST Blue fluorescence quantification system (Promega, Fitchburg, WI, USA) and then mixed in the corresponding proportions according to the requirements for the sequencing volume of each sample. A library was constructed and then determined on the machine. The original sequencing data were obtained.
The high-throughput gene sequencing analysis of the bacterial 16S rRNA gene and fungal ITS1 was performed using the one-stop scientific research service platform of Shanghai Majorbio Bio-pharm Technology Co., Ltd. (https://www.majorbio.com) (accessed on 12 June 2024). After quality filtering, the chimeric sequences were removed, and the final sequences were used to cluster the operational taxonomic units (OTUs) using VSEARCH (v. 1.9.6) (https://github.com/torognes/vsearch) (accessed on 12 June 2024) with a similarity threshold of 97%. The 16S rRNA reference database used for comparison was Silva 138, and the ITS rRNA reference database used for comparison was the UNITE ITS database (https://unite.ut.ee) (accessed on 12 June 2024). The RDP classifier (Ribosomal Database Program, https://bioconductor.org) (accessed on 12 June 2024) Bayesian algorithm was then used to classify the species on the representative sequences of the OTUs, and the composition of the community in each sample was analyzed at the classification levels of the different species.

2.6.4. Prediction of the Microbial Functional Group

BugBase (https://bugbase.cs.umn.edu) (accessed on 23 July 2024) was used to first normalize the OTUs with the predicted 16S copy numbers and then predict the bacterial phenotypes using the pre-calculated file provided. The phenotypes included seven categories: Gram-Positive, Gram-Negative, Biofilm-Forming, Pathogenic, Mobile Element-Containing, Oxygen-Utilizing, and Oxidative Stress-Tolerant categories [29]. The tool combines genomic data (NCBI RefSeq, https://www.ncbi.nlm.nih.gov) with functional annotations (KEGG/COG/PFAM), but its 16S rRNA reliance limits strain-level phenotypic resolution. The bacterial taxa (e.g., genera or species) and metabolic or other ecologically relevant functions (e.g., nitrification or denitrification) were plotted using FAPROTAX (v. 1.2.1) (https://www.uoregon.edu/) (accessed on 23 July 2024) [30]. The tool annotates prokaryotic functions (>80 categories; C/N/P/S cycling, pathogenesis) across >4600 species, but its 16S rRNA dependency excludes metagenomic data and strain-specific metabolic distinctions. Fungi functional classification was performed using the Fungi Functional Guild (FUNGuild, http://www.funguild.org) (accessed on 23 July 2024) by bioinformatics methods to link the species classification of the fungi with the functional guild classification [31]. It classifies fungal trophic modes (patho-/symbio-/saprotrophic) into ecological guilds but lacks higher-taxon predictions and dynamic functional profiling.

2.7. Statistical Analysis

The values presented in the chart are expressed as the means ± SDs of three biological replicates. Microsoft Office Excel 2019 (Redmond, WA, USA) was used to process the data, and Origin 8.5 (OriginLab, Northampton, MA, USA) was used for plotting. Prior to analysis, the normality of data distributions was verified using Shapiro–Wilk tests, and homoscedasticity was confirmed by Levene’s test. The results were analyzed using two-way ANOVAs. The mean values for each treatment were subjected to multiple comparisons using the least significant difference (LSD) test (p < 0.05). The principal component analysis (PCA) and community bar charts were plotted using R language (v. 3.3.1) (https://www.r-project.org) (accessed on 17 July 2024). Circos-0.67-7 (http://circos.ca/) (accessed on 19 July 2024) was used to plot the composition proportions of the microbial dominant species in each treatment and the distribution proportions of each dominant species in the different treatments. A linear discriminant analysis effect size (LEfSe) (http://galaxy.biobakery.org/) (accessed on 19 July 2024) was used to perform a linear discriminant analysis (LDA) based on the taxonomic classification level from phylum to species for the different sizes of aggregates and identify the microbial communities or species that significantly affected the different treatments [32]. A Mantel test using the “vegan” package was used to reveal the relationship of microbial taxonomic community composition in different aggregates of soil with environmental factors. A redundancy analysis (RDA) in the R language vegan package (v. 2.4.3) was used to reveal the relationship between the microbial community and environmental factors, which was based on linear models [33]. A Mothur (v. 1.30.2 https://mothur.org/wiki/calculators/) (accessed on 19 July 2024) index analysis was used to analyze the microbial alpha-diversity indicators, including the Shannon–Wiener index, Simpson index, Ace richness estimator (ACE), and Chao1 richness estimator, which reflected the richness and diversity of the microbial communities (OTU similarity level was 97%).

3. Results

3.1. Soil Physicochemical Properties and Enzyme Activity

Compared with CK, the soil bulk density of CA and SM decreased significantly by 11.9% and 14.4%, respectively (p < 0.05) (Table 1). Compared with CK, the maximum field capacity, total porosity, and capillary porosity of the CA and SM treatments significantly increased by 15.7–45.1%, 11.5–14.0%, and 11.0–25.5%, respectively.
Compared with CK, the contents of SOC, TN, Olsen-P, and AK of CA and SM increased significantly (p < 0.05) (Table 2). Among them, the content of SOC of CA and SM increased by 118.3% and 184.2%, respectively, and the content of TN of CA and SM increased by 81.5% and 73.3%, respectively. In addition, the increase in the content of SOC of SM was significantly higher than that of CA. Compared with CK, the activities of urease, catalase, and sucrase of CA and SM increased significantly by 42.2–46.2%, 64.1–112.3%, and 74.7–106.7%, respectively (Table 3). The catalytic activity of SM increased more than that of CA.

3.2. Physicochemical Properties of the Soil Aggregates

3.2.1. Composition and Stability of the Soil Aggregates

Whether they were mechanically stable aggregates or water-stable aggregates, compared with CK, both CA and SM increased the proportion of soil aggregates by >2 mm (Table 4). SM significantly increased their proportions by 38.4% and 55.6%, respectively (p < 0.05), while the difference between CA and CK was not significant. Moreover, compared with CK, the proportion of soil aggregates with size fractions of 1–2 mm, 0.25–1 mm, and <0.25 mm in SM was significantly reduced, while the difference between CA and CK was not significant except for mechanically stable aggregates with sizes < 0.25 mm.
Compared with those of CK, the MWD, GDM, and R0.25 of CA and SM all tended to increase; the differences between CK and SM all reached a level of significance (p < 0.05) (Table 5). Compared with CK, the PAD and ELT of CA and SM all tended to decrease. The differences between SM and CK both reached a significant level.

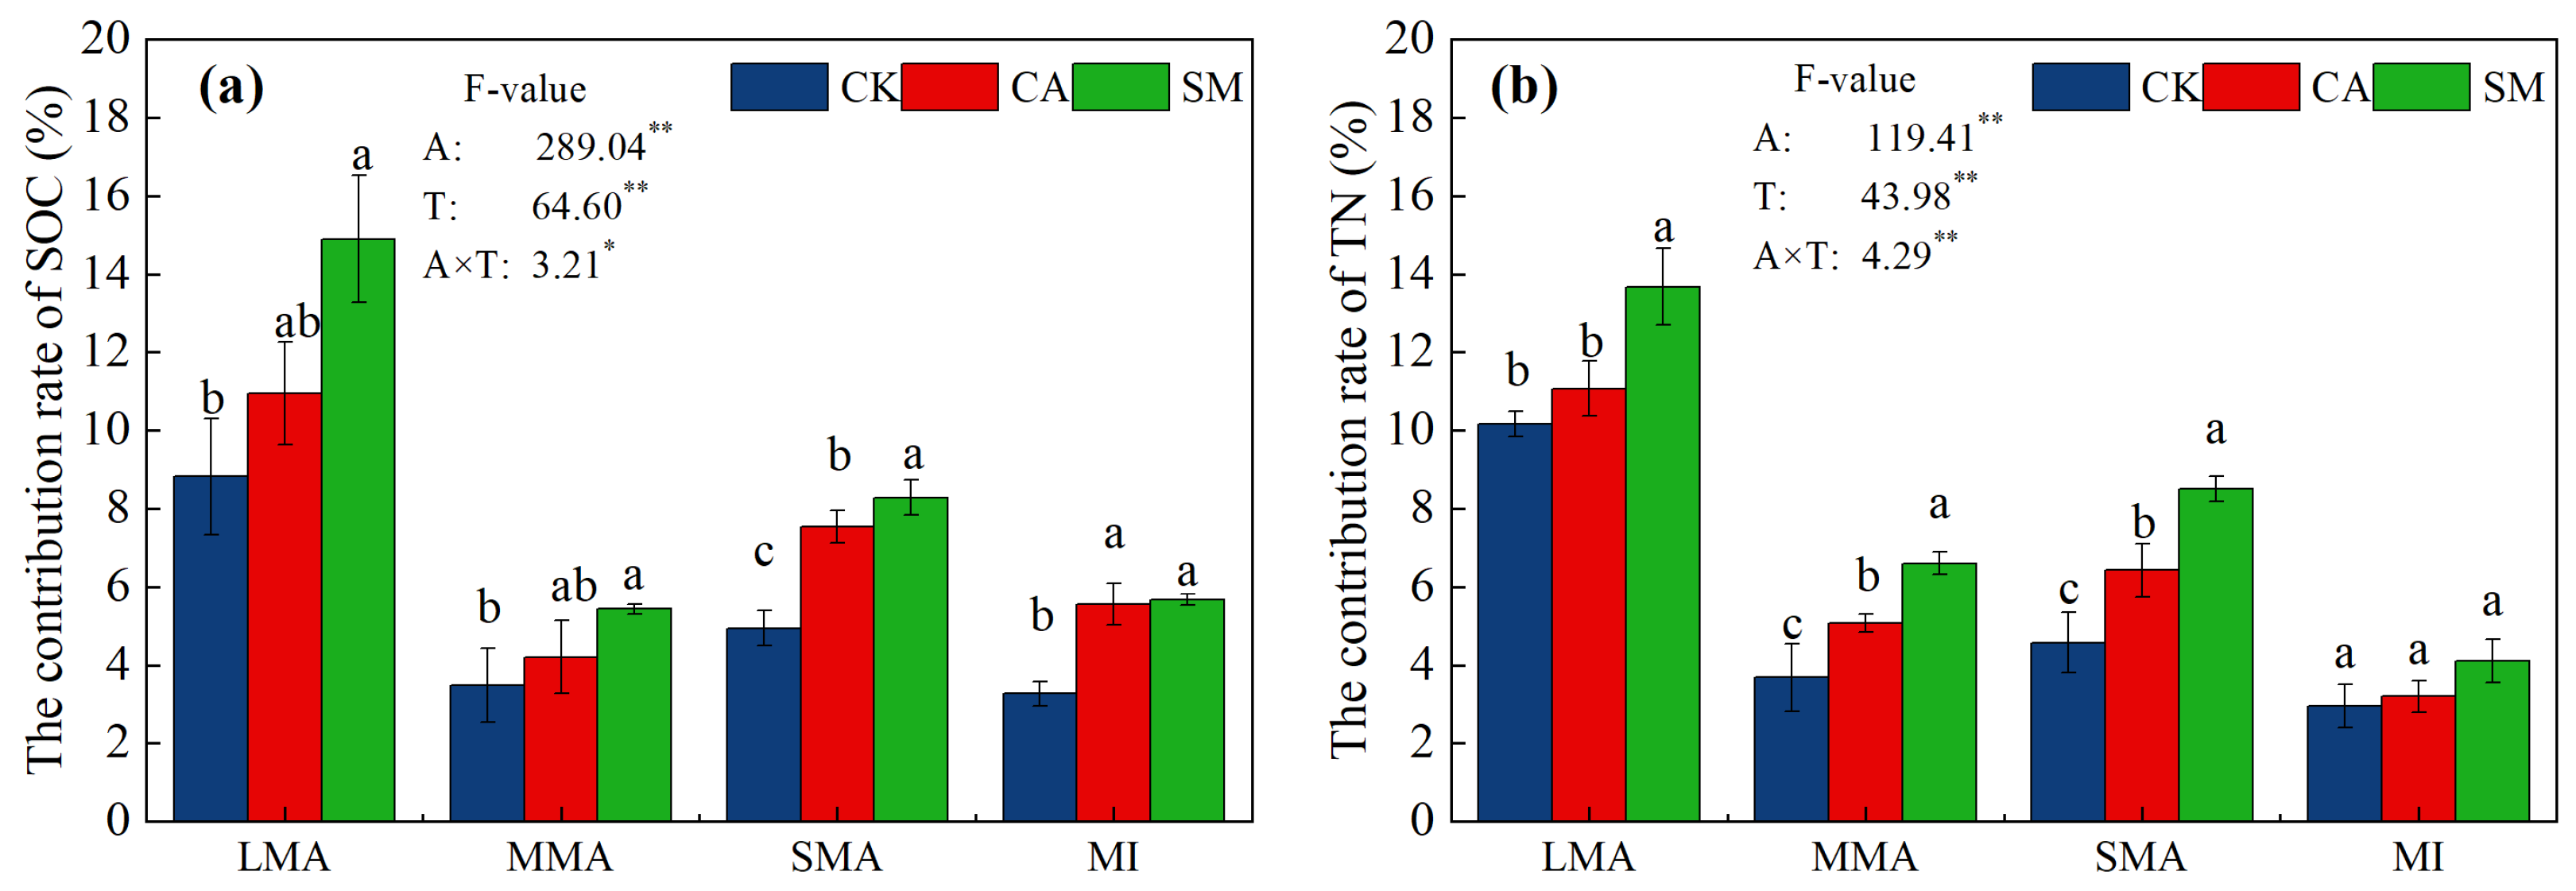
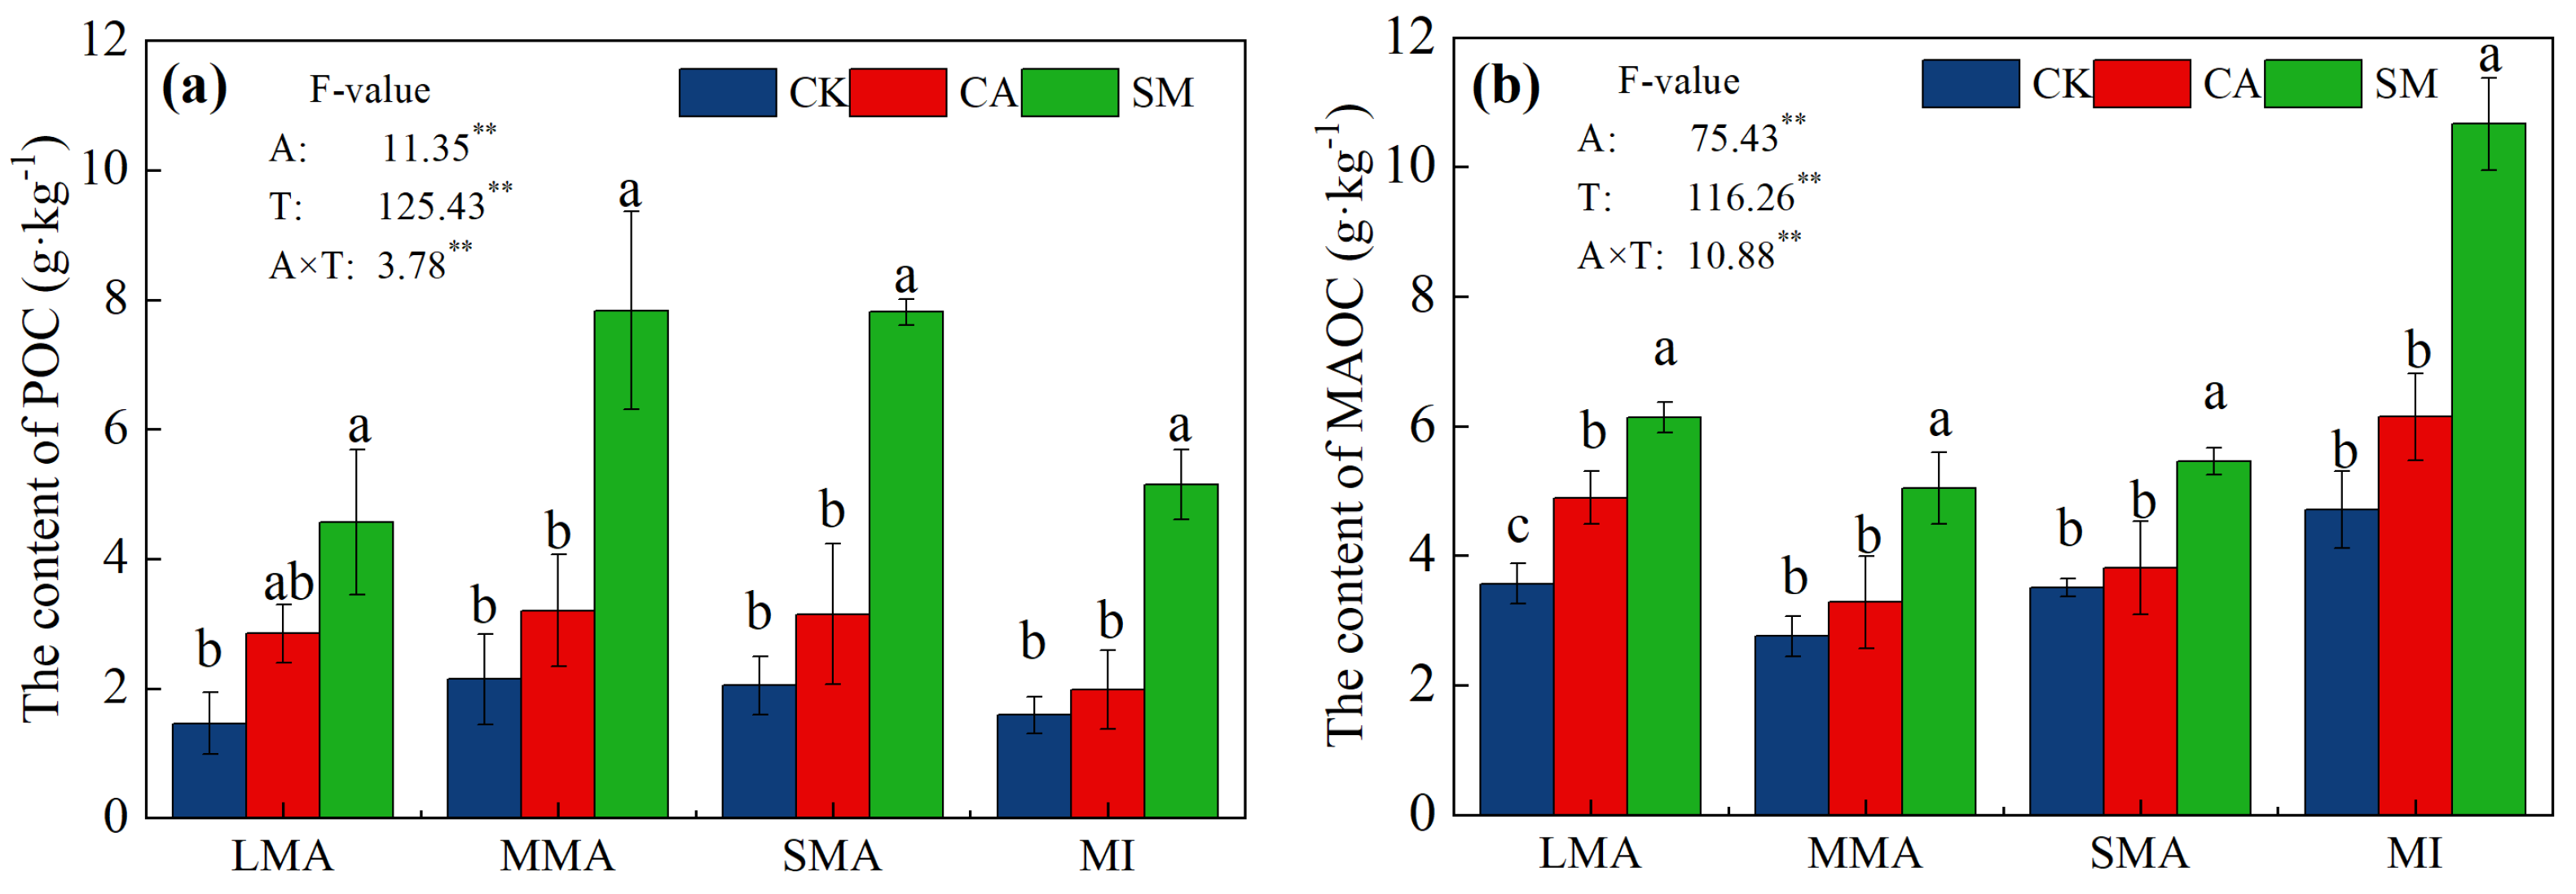
3.2.2. Distribution of Organic Carbon and Nitrogen in the Soil Aggregates

The ANOVA showed that the differences in the contents of SOC and TN in the soil aggregates were highly significant among the different size fractions and treatments. There were highly significant differences in the interaction of SOC between size fractions and treatments. Compared with CK, the contents of SOC and TN of all the soil aggregates of CA and SM all tended to increase in all size fractions (Figure 1). The differences in the contents of SOC and TN of all size fractions between SM and CK were all significant (p < 0.05).
Compared to CK, the rate of contribution of SOC and TN in the soil aggregates of CA and SM all tended to increase in all size fractions (Figure 2). The differences between SM and CK were all significant except for the rate of contribution of the MI to the TN, and the differences between CA and CK were both significant in SMA (p < 0.05). With the decrease in the size of soil aggregates, the rate of contribution of the SOC and TN in all the treatments decreased first, increased, and then decreased. The rates of contribution of the SOC and TN were highest in LMA.
The contents of POC and MAOC in the soil aggregates of CA and SM all increased in all size fractions. The differences between SM and CK were all significant, and the differences in the content of MAOC between CA and CK in LMA were significant (p < 0.05) (Figure 3). An analysis of the contents of the two components of SOC in the same size fractions showed that the increase in POC content was primarily reflected in the MMA and SMA in the SM treatment, while the increase in the content of MAOC was primarily reflected in the MI. As the soil aggregates decreased in size, the content of POC in each treatment increased first and then decreased and reached its maximum in the MMA. The content of MAOC first decreased and then increased and reached its minimum in the MMA.

3.3. Microbial Communities in the Soil Aggregates

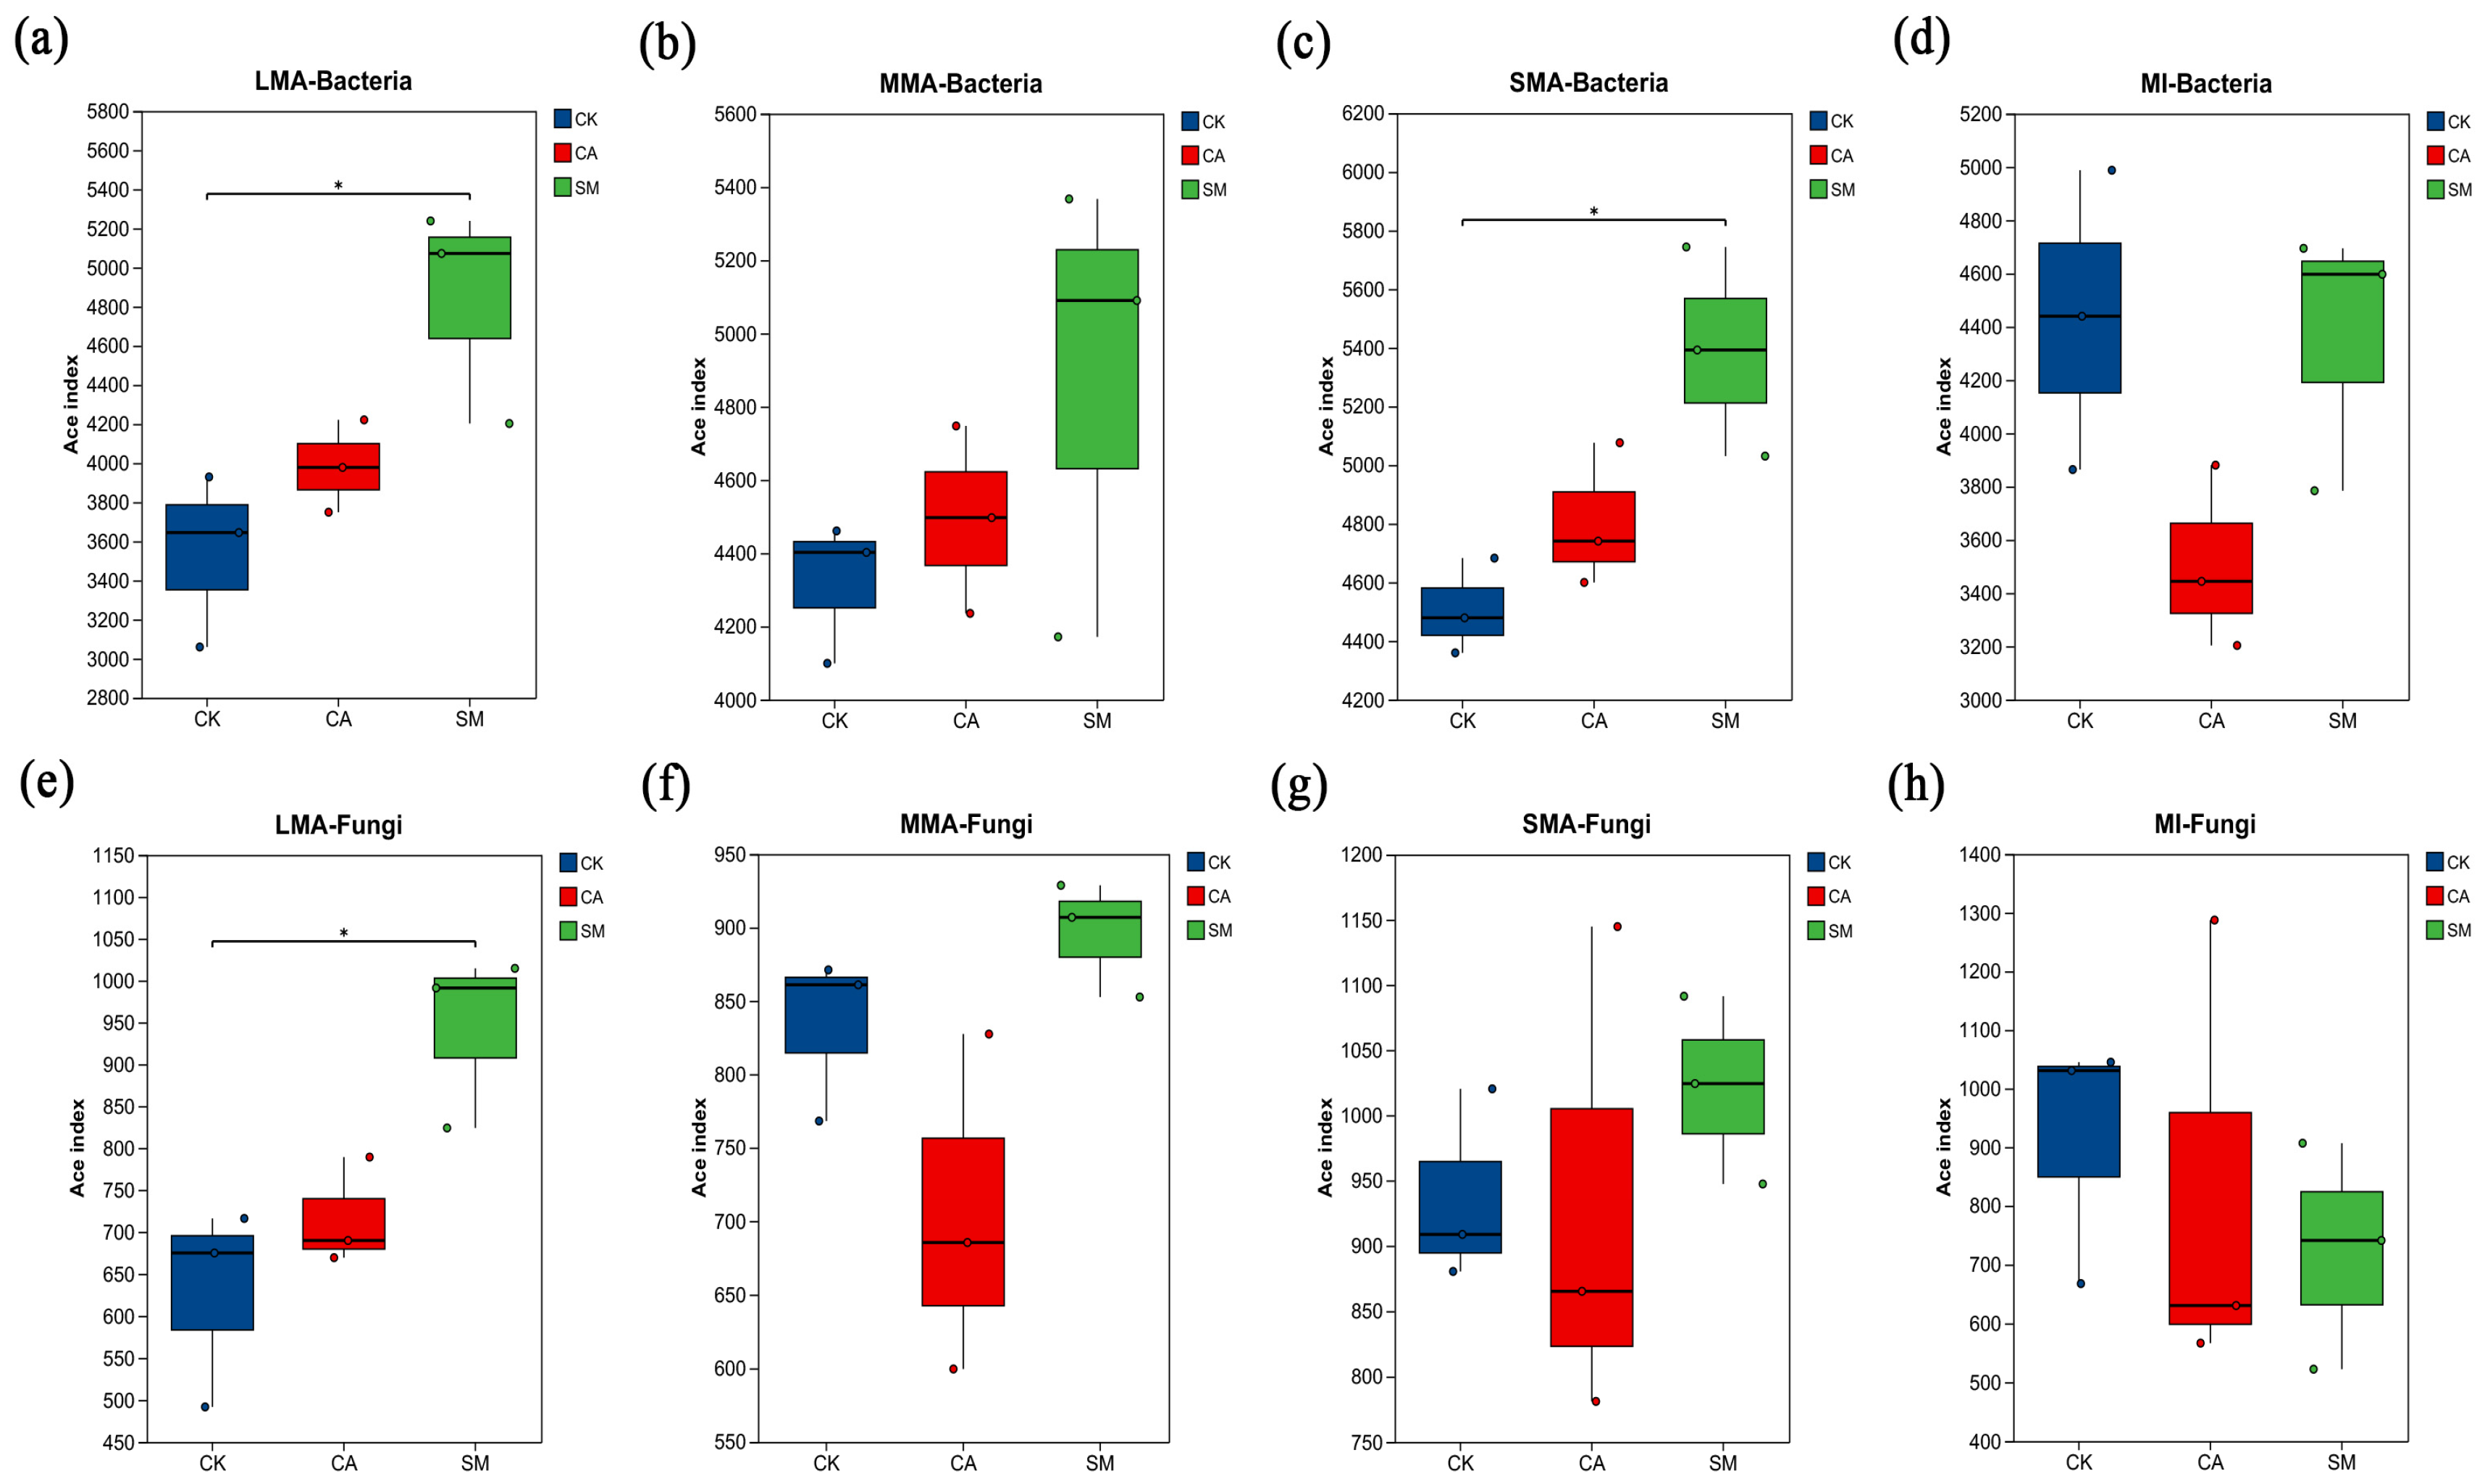
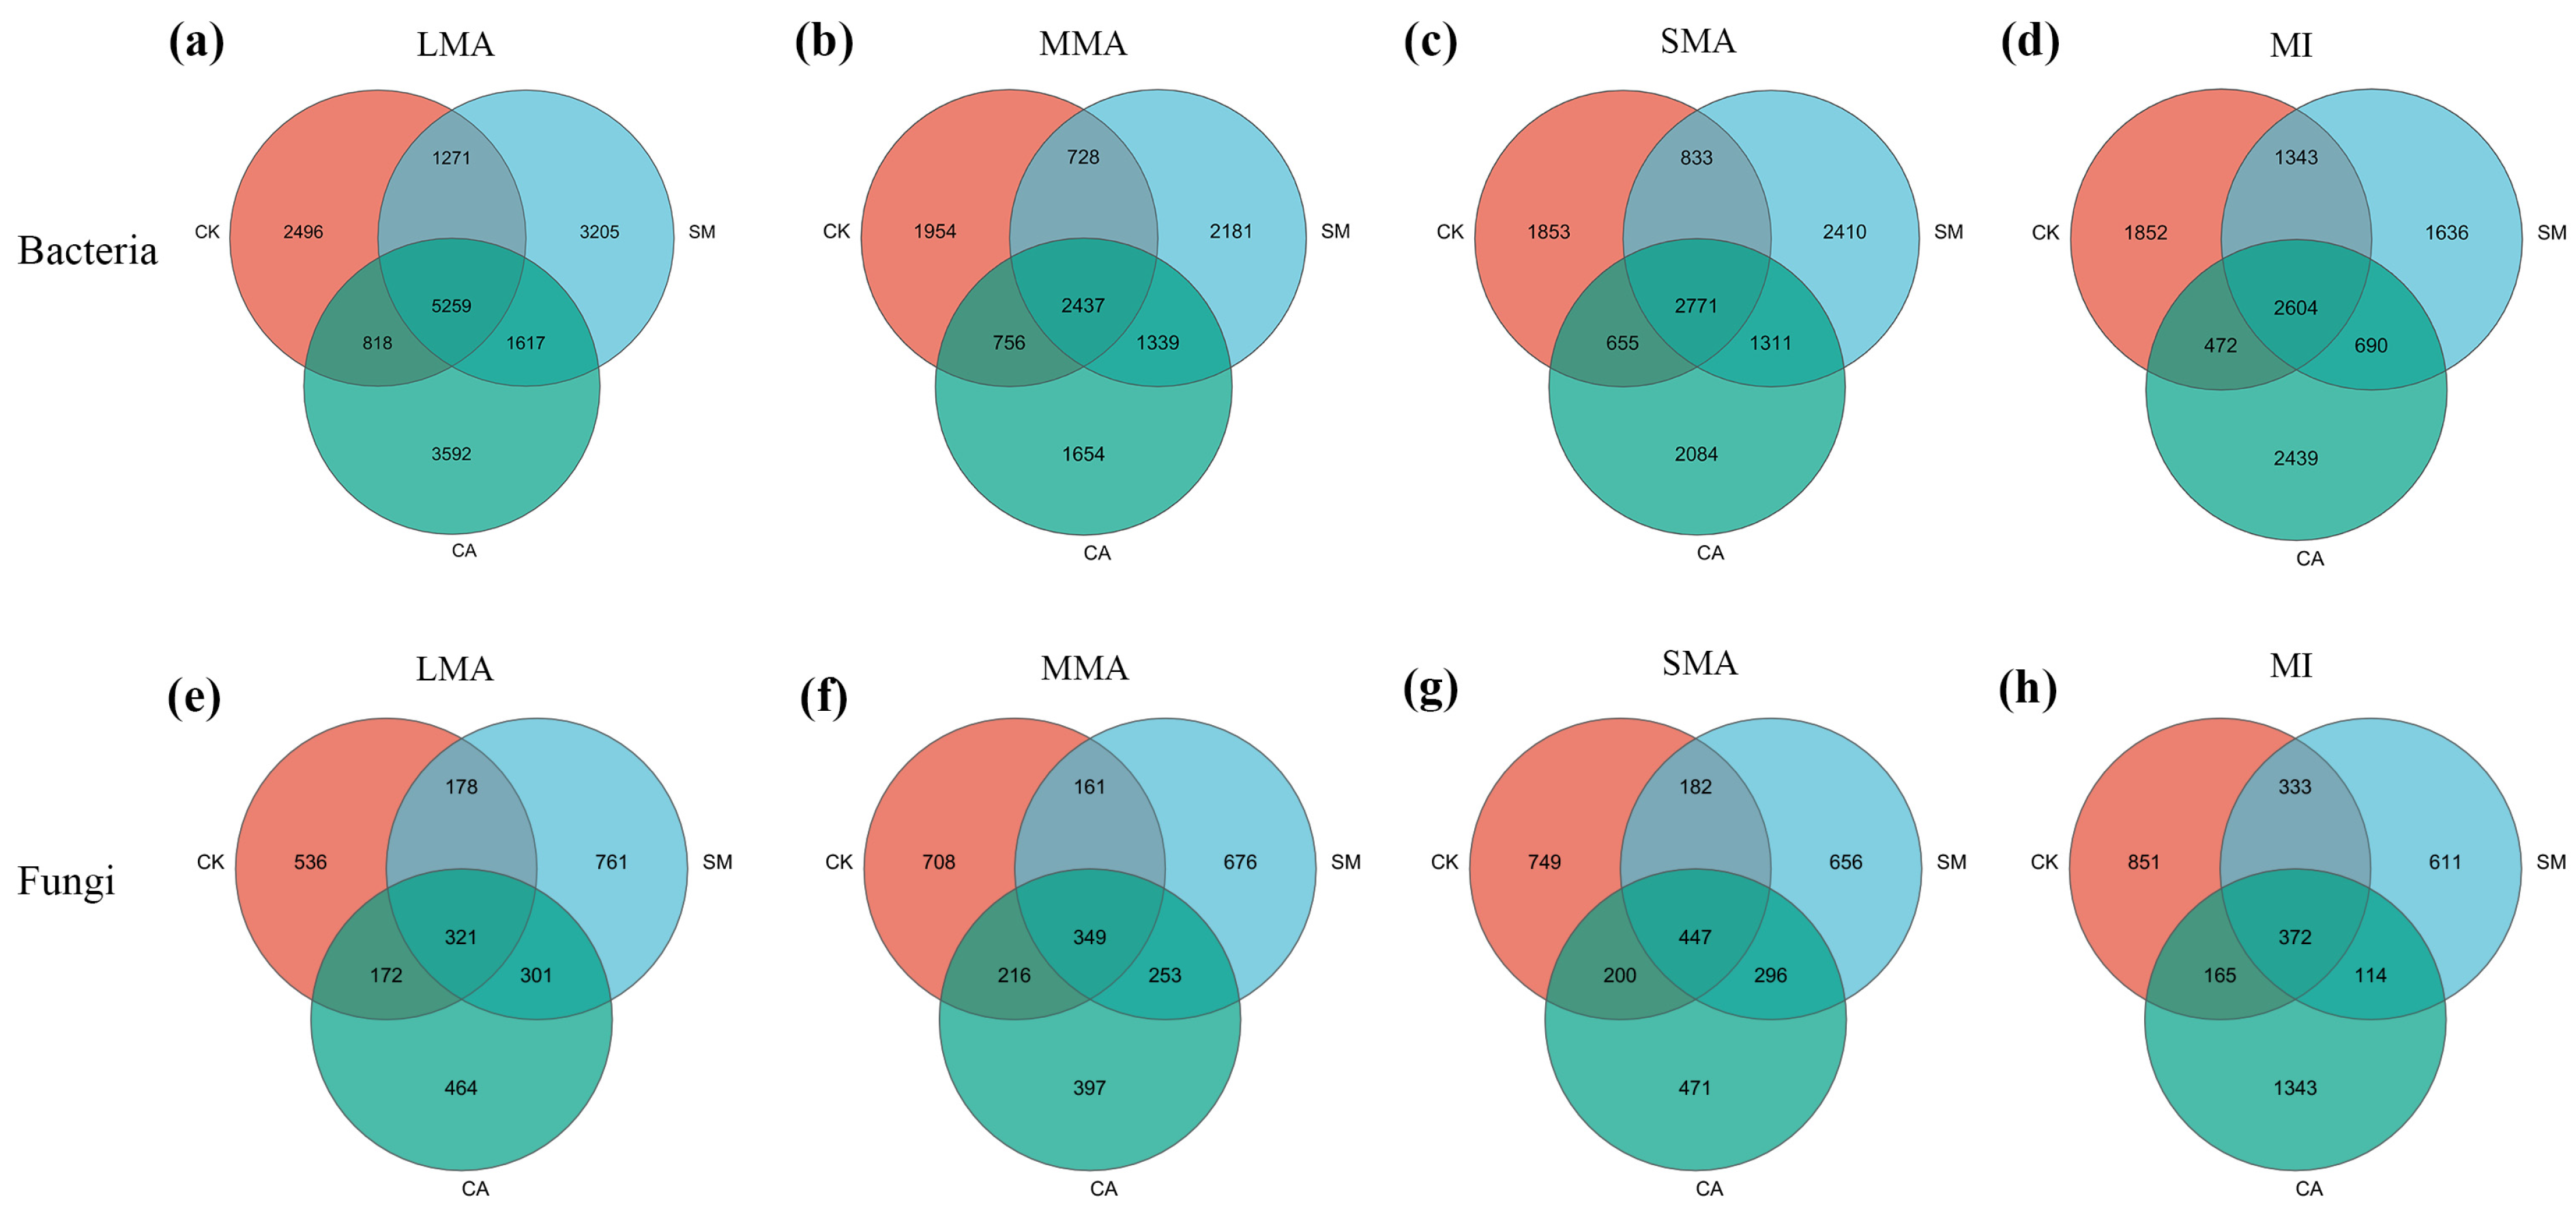
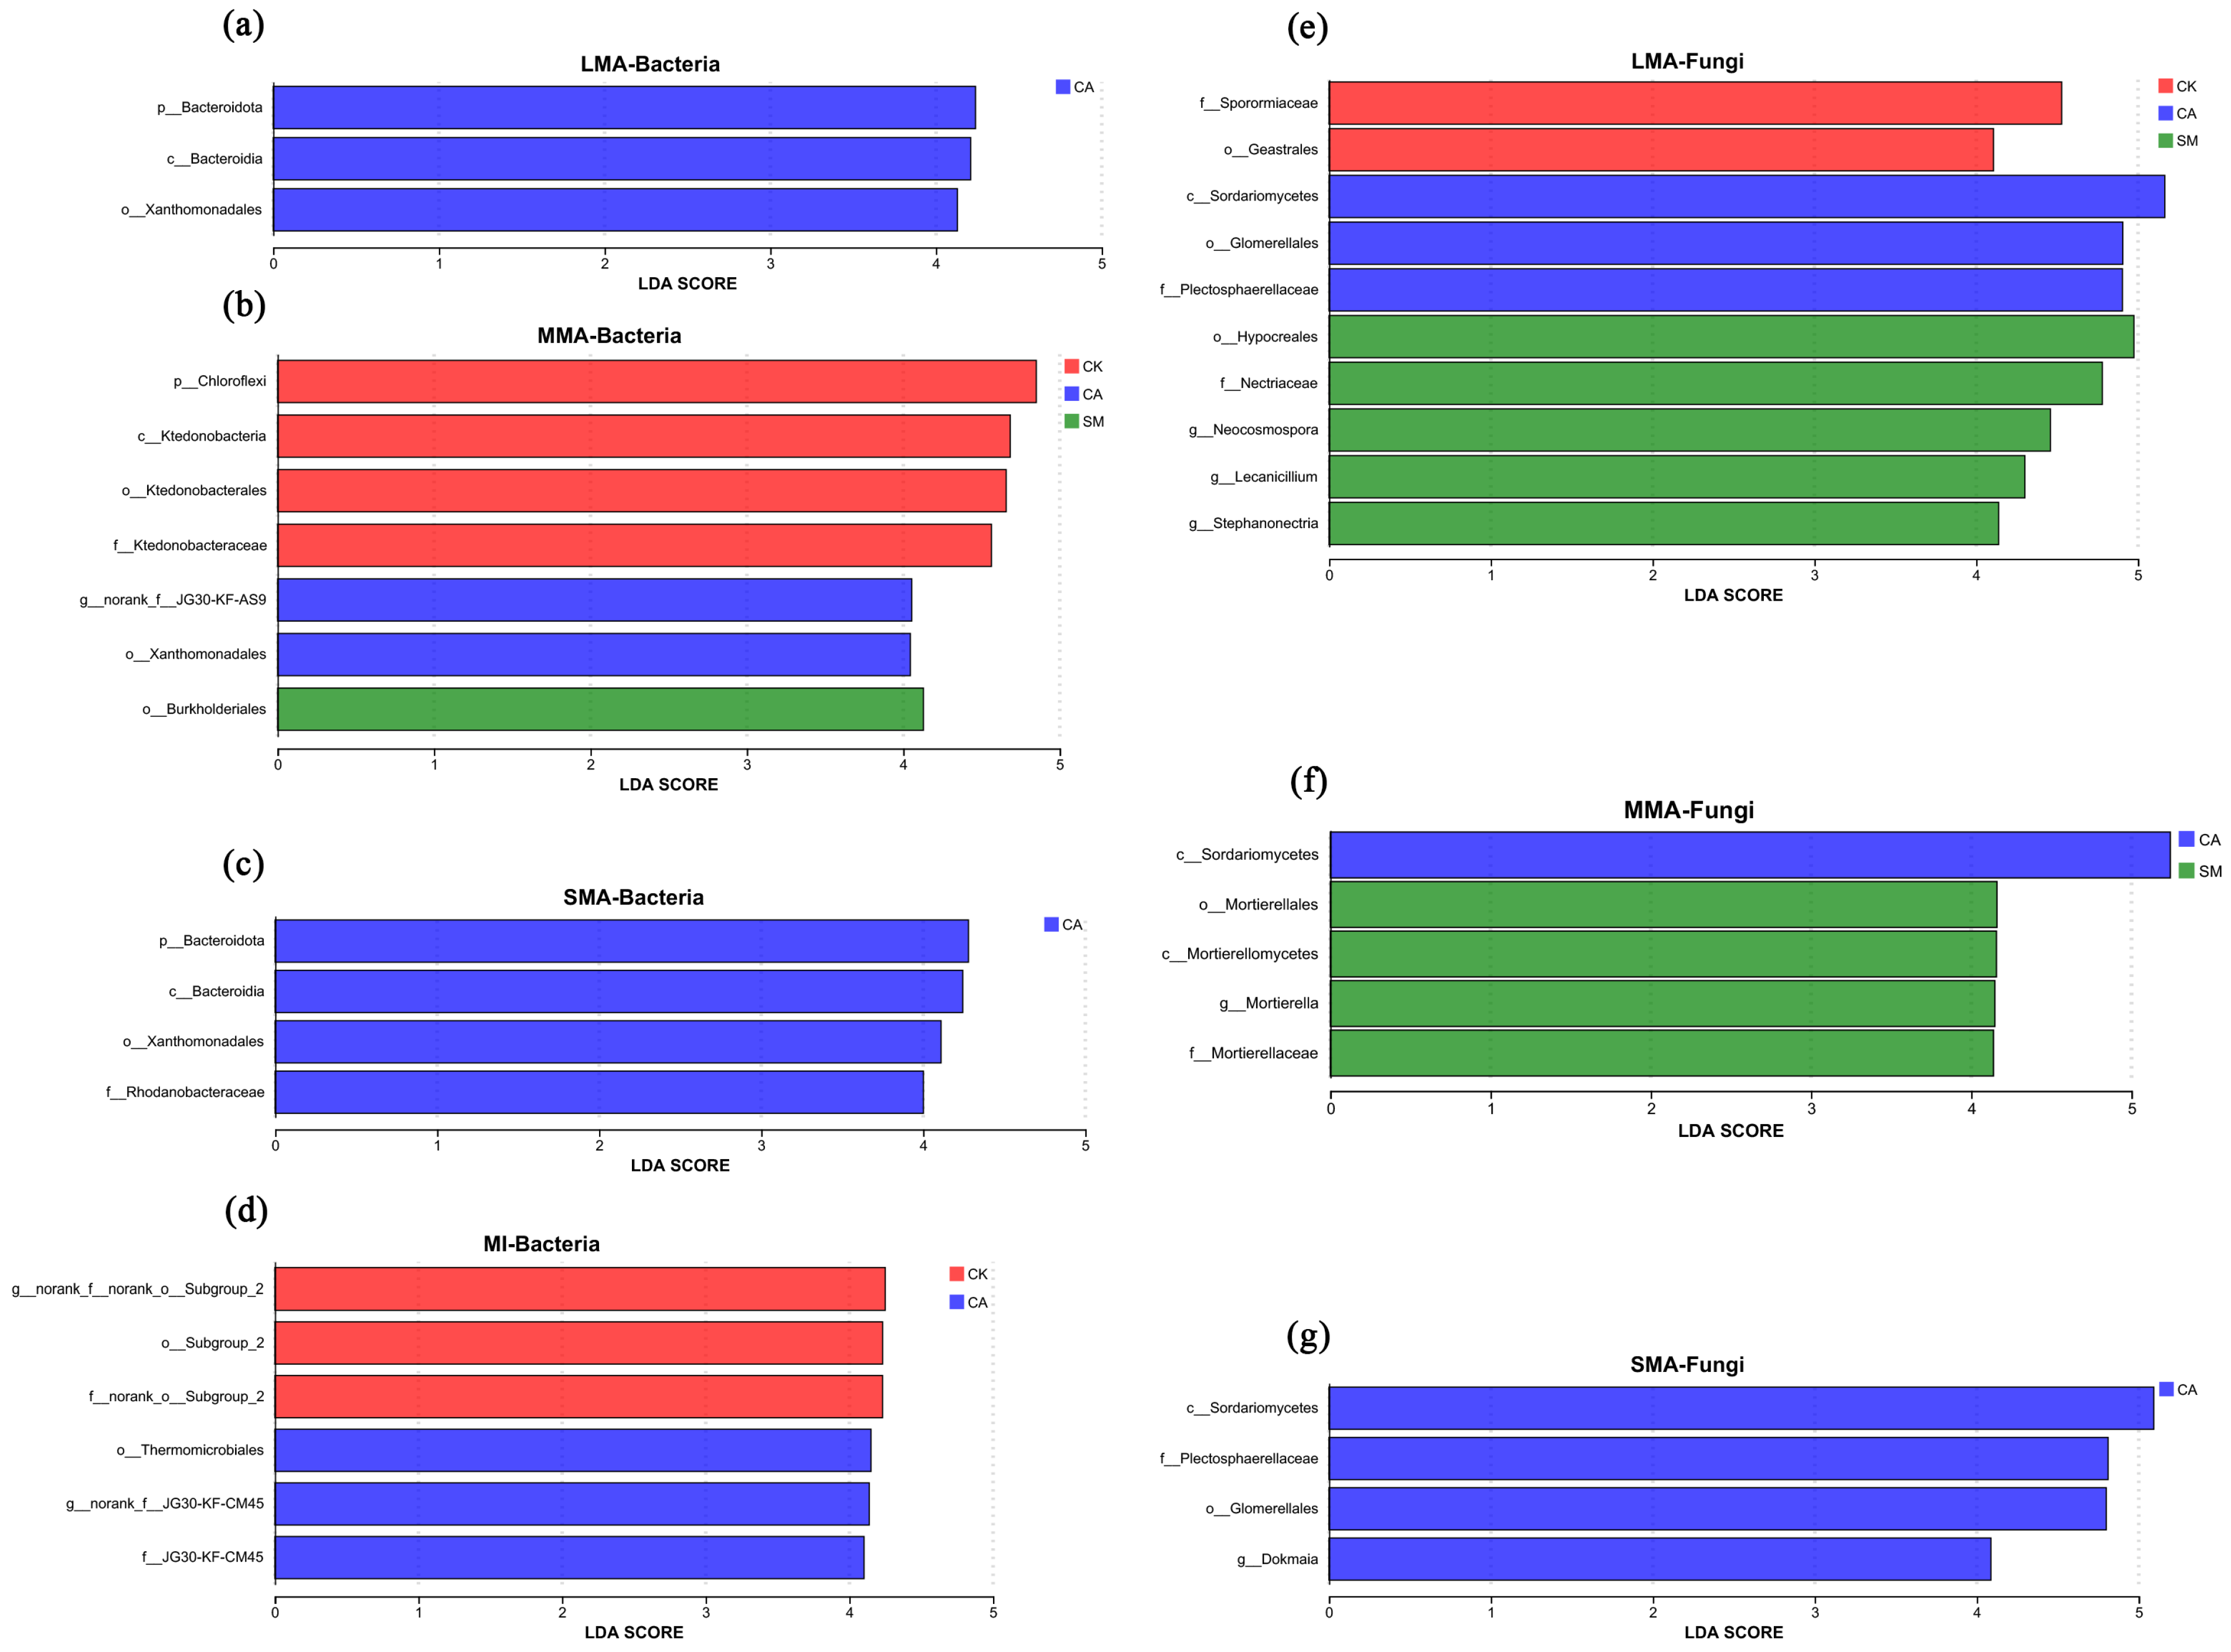
3.3.1. The Characteristics of Microbial Communities

Compared with CK, whether bacterial or fungal, the ACE index of CA and SM increased in the LMA (Figure 4). The differences between SM and CK in the LMA were all significant (p < 0.05). The Chao 1 and Shannon indices of the bacteria and fungi of SM increased significantly in the LMA (Tables S2 and S3). Compared with CK, the numbers of OTUs in the bacteria of CA and SM increased in the LMA and SMA (Figure 5). In addition, the numbers of fungal OTUs of CA primarily increased in the MI, while those of SM primarily increased in the LMA.
In all the treatments, the dominant bacterial phyla in the soil aggregates were Chloroflexi, Proteobacteria, Actinobacteria, and Acidobacteria (Figure 6, Figure 7 and Figure S4). Compared with CK, the percentage of the abundance of the communities of Proteobacteria and Actinobacteria of CA and SM was higher in the aggregates. The dominant fungal phylum in the soil aggregates was Ascomycota, and, compared with CK, its relative abundance in CA and SM increased in the LMA, MMA, and SMA.
The beta-diversity was compared in the overall structure of the community, and there were differences among the different treatments and size fractions (Figure S5). The potential biomarkers of the bacterial taxa differed significantly in their abundance in MMA (Figure 8). In addition, in the MMA compared with CK, g_norank_f_JG30_KF-AS9 and o_Xanthomonadales were significantly enriched in the soil samples of CA, and o_Burkholderiales was significantly enriched in the soil samples of SM. The potential biomarkers of the fungal taxa differed significantly in their abundance in the LMA, and, compared with CK, c_Sordariomycetes, o_Glomerellales, and f_Plectosphaerellaceae were significantly enriched in the soil samples of CA. c_Sordariomycetes had the highest LDA value, and o_Hypocreales, f_Nectriaceae, and g_Neocosmospora were significantly enriched in the soil samples of SM, among which o_Hypocreales had the highest LDA value. In addition, we found an interesting result, namely, that o_Xanthomonadales and c_Sordariomycetes were all enriched in LMA, MMA, and SMA of CA.

3.3.2. Microbial Functional Group

According to the prediction of BugBase, in the bacteria, Gram_Negative and Aerobic occupied the main position in all size fractions of the soil aggregates (Figure 9). In each size fraction, the LMA had significantly more Stress_Tolerant bacteria than the other size fractions. Compared with CK, the abundances of Gram_Negative and Aerobic bacteria in all size fractions of CA and SM decreased. According to the prediction of FUNGuild, in the fungi, undefined saprotrophs, plant pathogens, fungal parasites, and animal pathogens occupied the main positions. The relative abundances of undefined saprotrophs and plant pathogens of CA and SM increased in the MMA and SMA compared to those of CK. The prediction of the FAPROTAX function directly reflects the difference in the advantages of their function in the different treatments (Figure S6).

3.4. Microbial Functional Genes Related to Nutrient Cycling in the Soil Aggregates

Compared with CK, there was a significant reduction in the copy numbers of cbbL (gene related to the sequestration of C) in each size fraction of CA and SM (Table 6), and cbbL was the most abundant in the MI. The copy numbers of amoA-AOB, nirK, and nifH (nitrogen cycling genes) of CA and SM increased in all size fractions. The differences in the copy numbers of amoA-AOB of CA and SM were significant in the LMA and MMA compared to CK; CA had a more significant difference than SM (p < 0.05).

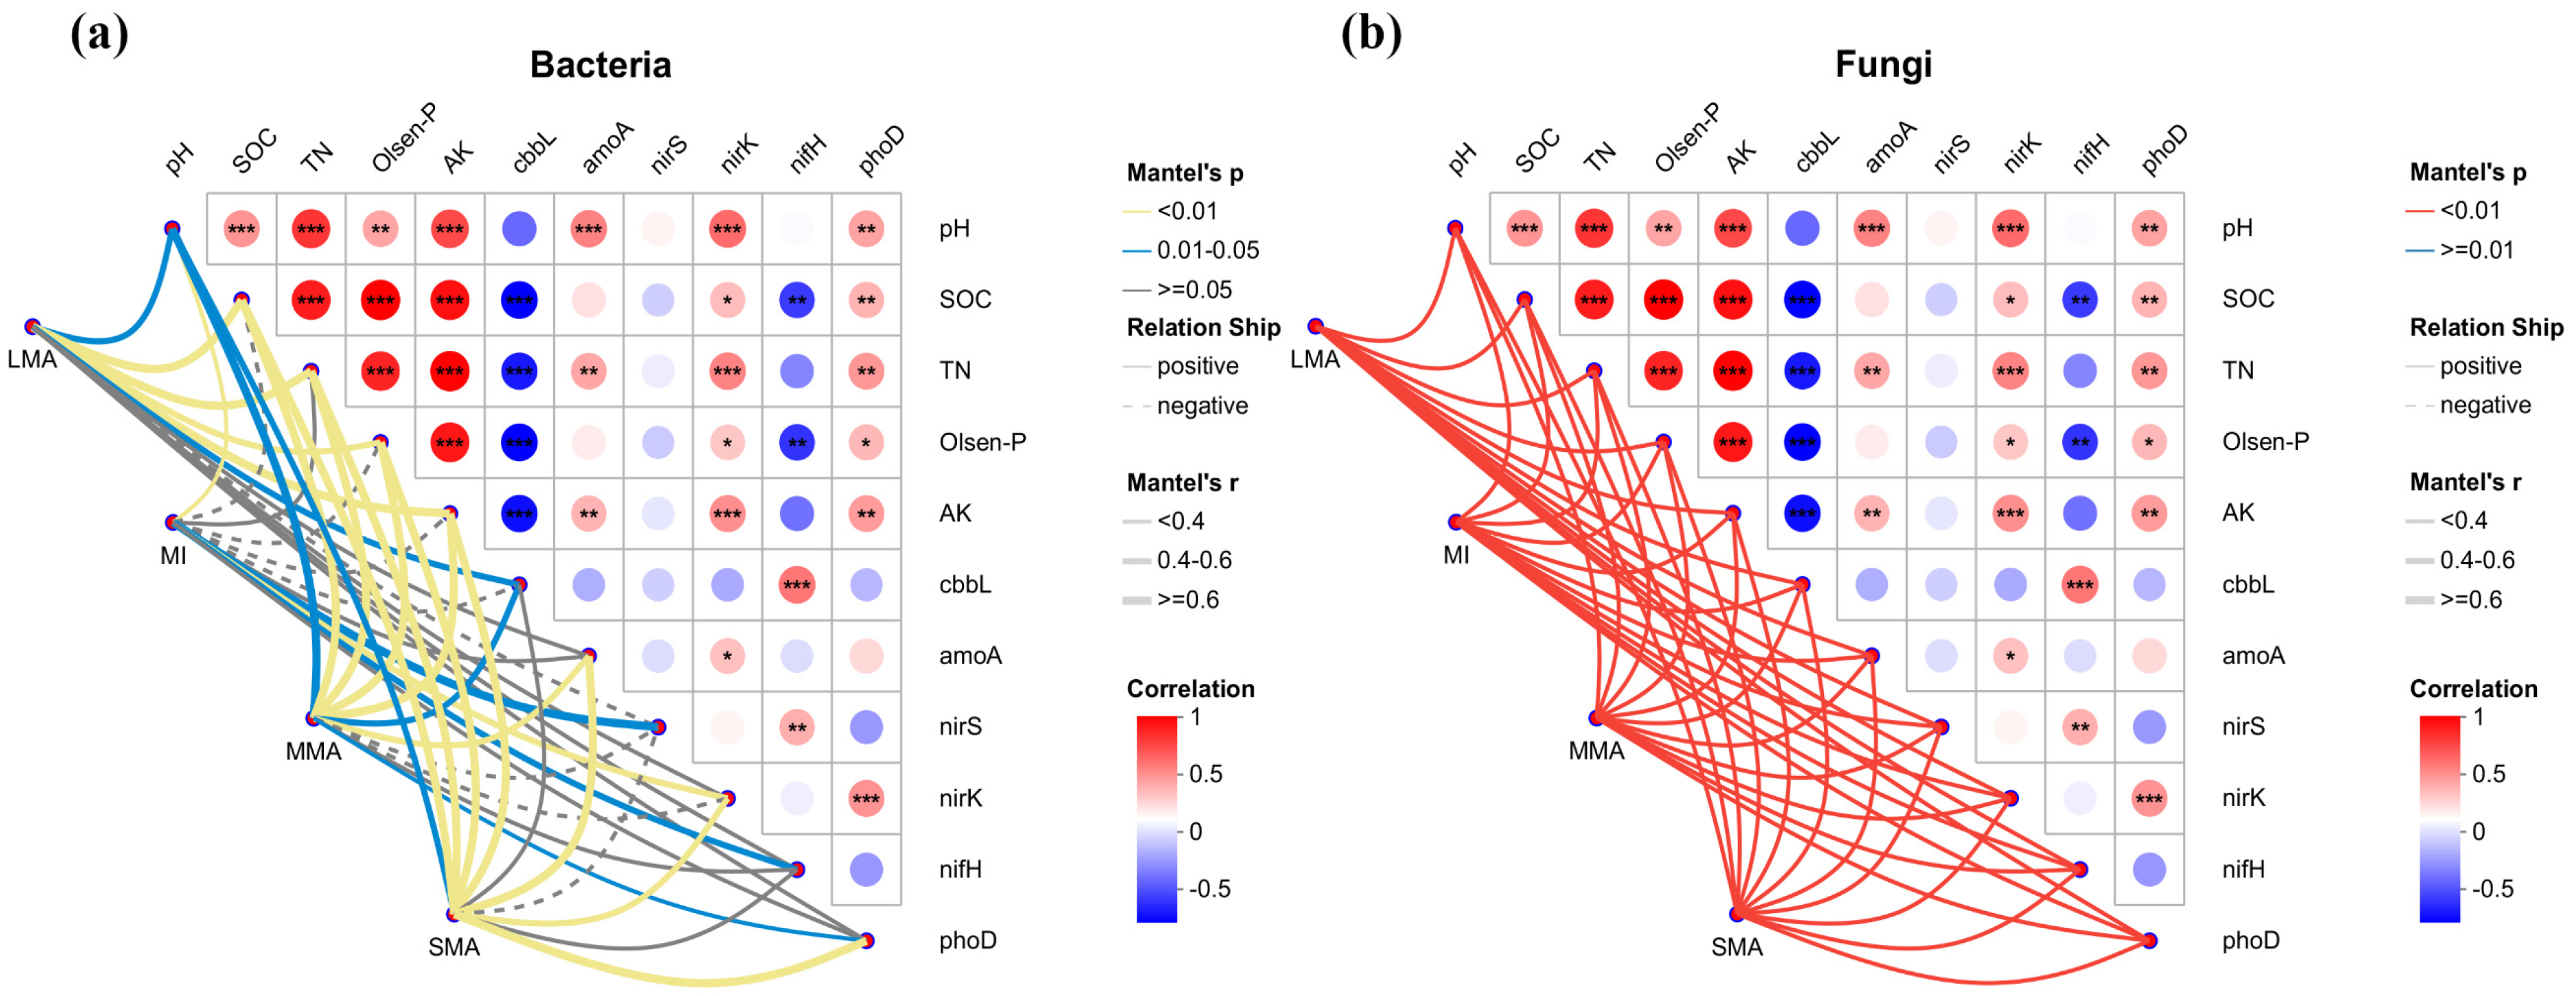
3.5. The Correlation Between Microbial Community and Environmental Factors and Gene Abundance in the Soil Aggregates

The contents of SOC, TN, Olsen-P, and AK were significantly positively correlated with the bacterial communities in all size fractions except for the MI. All these factors, including the gene copy numbers, were significantly positively correlated with the fungal community in all size fractions (p < 0.05) (Figure 10). In both bacteria and fungi, the copy numbers of cbbL negatively correlated with the SOC, TN, pH, Olsen-P, and AK. In addition, the correlation between different species of microorganisms and soil physicochemical properties also varied between the different treatments and size fractions (Figure S7).

4. Discussion

Green manure has been shown to improve the physical properties of soil and increase its contents of nutrients [34,35]. This study found that under the long-term management of native grasses, the soil BD decreased and its water holding capacity and porosity increased, which was consistent with the findings of Li et al. [36]. This may have been due to biological disturbance caused by the growth of local grass roots, resulting in loose soil [37]. Moreover, grass cover can intercept rainwater and promote water infiltration, improving the soil’s water retention capacity. In addition, the study of Li et al. showed that the content of SOC in soil increased under long-term management with native grasses, which was consistent with the findings of Özbolat et al. [38]. We found that the content of SOC of SM increased more significantly than that of CA, which was consistent with the pattern of changes in annual yield and accumulation of nutrients by native grasses. Regarding the native grasses, the dry matter accumulation of SM was significantly higher than that of CA, and the carbon accumulation of SM was significantly higher than that of CA (Table S4). This indicated that SM was significantly more effective at sequestering organic carbon than CA. Moreover, we found that the activity of sucrase in the soil increased, which indicated an enhanced ability of soil to catalyze the hydrolysis of sucrose. This led to an increase in the content of SOC. In addition, the content of TN also increased. On the one hand, this was owing to the increased activity of soil urease, which enhanced the ability of soil to hydrolyze urea [39]. Alternatively, it was owing to the fixation and absorption of native grasses, which reduce the likelihood of the loss of nutrients in the soil [40].
In this study, we found that the proportion of large macro-aggregates and the stability of soil aggregates increased under the long-term management of native grasses, which was consistent with the findings of Zhu et al. and Ren et al. [41,42]. This may have occurred because the organic matter acted as a bonding agent, which promoted the formation of large macro-aggregates and stabilized the soil structure [43]. Alternatively, the interspersed extrusion and entanglement of grass roots played an effective role [44]. We also found that the stability of soil aggregates increased the most when the soil was managed with Stellaria media. This could be related to the significantly higher annual production of dry matter of Stellaria media.
We found that the contents of SOC and TN in the soil aggregates increased under the long-term management of native grasses, which was consistent with the findings of Zheng et al. and Conrad et al. [45,46]. This was because grass cover introduces plant residues and root biomass into the soil, leading to an increase in organic matter content [47]. In addition, MAOC in soil aggregates can stabilize organic carbon in soil through isolation in pores, adsorption, and physical sealing within aggregates [48].
In addition, Conrad et al. showed that the different sizes of aggregates had a relatively uniform content of SOC, while other studies showed that the large aggregates were richer in SOC than the micro-aggregates [49,50,51]. However, this study showed that the content of SOC increased as the size fractions decreased. This could conceivably have occurred because smaller aggregates have a larger specific surface area and will adsorb more organic matter from the soil [52]. Nevertheless, large macro-aggregates were the largest contributors to the content of SOC. This may have been related to the formation of cementing materials inside the aggregates, which were primarily composed of organic matter, which can cement the aggregates with small soil particles into larger aggregates; the mycelia in the large aggregates can also help to increase the contribution of SOC [48].
In this study, the difference in the components of SOC in the aggregates indicated that the contents of POC and MAOC in the soil aggregates of the different size fractions increased under the long-term management of native grasses, which was consistent with the findings of Lu et al. and Liu et al. [53,54]. They showed that the content of each component of SOC in soil aggregates increased in parallel with the increase in the content of SOC. In addition, the increase in the POC was greater than that of the MAOC. This may be because the POC had a low degree of humification and was a transition product of the transformation of animal and plant residues into humus. Thus, it is generally considered to be an unstable POC that decomposes rapidly [55]. Therefore, the POC had a shorter turnaround time and was more affected by the conversion in land use than the MAOC [56,57]. The humus produced by the return of native grasses to the field affects the composition of organic carbon. However, how the soil humus changes in behavior after the management of native grasses still remains unclear. Thus, it is necessary to conduct in-depth research on the content and structural characteristics of each component of humus in various size fractions of the soil aggregates in the latter stage.
Soil microorganisms play an important role in maintaining the health of soil owing to their participation in nutrient cycling and biodegradation and improvement in soil fertility and the formation and stability of aggregates [58,59]. Plants return sequestrated organic matter to the field and reduce the loss of nutrients in soil, which is conducive to the reproduction of microorganisms in the soil [60]. In this study, we found that under the long-term management of native grasses, the bacterial diversity of each size fraction in the soil aggregates increased significantly, which was consistent with the findings of Wang et al. [61]. Perhaps this occurred because the root exudates of native grass species affect the number of soil microbial communities and soil moisture affected the respiration of microorganisms, thereby affecting the number of microbial communities [61].
The LMA and SMA had the most diverse bacteria, which showed that the improvement in the bacterial diversity of the native grasses primarily occurred in the LMA and SMA. The bacterial species clustered toward the LMA under the long-term management of native grasses, which indicated the important role of soil bacteria in the formation of large aggregates. The number of species of fungi varied with the different species of grasses and size fractions.
In this study, the classification of the bacteria in the various size fractions of the soil aggregates showed that the top four dominant bacteria in the soil were Chloroflexi, Proteobacteria, Actinobacteria, and Acidobacteria. Proteobacteria can fix N and thus affect the soil nutrient cycle, and Actinobacteria can degrade organic matter to promote the soil organic matter cycle and improve soil fertility [62,63]. Under the influence of native grasses, there was a higher abundance of Proteobacteria and Actinobacteria in the aggregates, which indicated that the native grasses could affect the C and N cycles by affecting the abundance of related bacteria and finally improve soil fertility. The dominant fungi in the soil were Ascomycota, and the relative abundance in CA and SM increased in the LMA, MMA, and SMA. The Ascomycota usually live in environments that are rich in nutrients [64,65]. Therefore, the results showed that there was a significant enrichment in the content of nutrients in the soil in the LMA, MMA, and SMA under the action of native grasses.
This study found that there were significant differences in the abundance of potential biomarkers of bacterial taxa in the MMA. In addition, when the MMA was under the influence of native grasses, there was a significant enrichment of g_norank_f_JG30_KF-AS9, o_Xanthomonadales, and o_Burkholderiales in the soil. These results suggested that the differences in soil properties caused by the native grasses may have been influenced by these microorganisms with significant differences in soil, and these primarily occurred in the MMA. There were significant differences in the abundance of potential biomarkers of the fungal taxa in the LMA compared with CK, and c_Sordariomycetes had the highest LDA value. This indicated that the abundance of c_Sordariomycetes had the greatest impact on the differential effect of LMA. An analysis of the relationship between the bacterial and fungal communities and soil chemical properties showed that the SOC, TN, Olsen-P, and AK were significantly positively correlated with the bacterial and fungal communities in the LMA, MMA, and SMA, which indicated that they were the key environmental factors that structured both the bacterial and fungal communities in all size fractions except for the MI.
cbbL encodes the large subunit of Ribulose-1,5-bisphosphate carboxylase/oxygenase (Rubisco), and Rubisco is the key enzyme in the main pathway for the fixation of CO2. The abundance of cbbL in the soil positively correlated with the ability of the soil to sequester C [66,67,68]. However, this study showed that the copy numbers of cbbL were negatively correlated with the content of SOC, which was consistent with the findings of Zhou et al. [69]. This may be because the changes in BD and the porosity of the soil affected the contact between the bacteria that harbor cbbL and their substrate, CO2 [70,71]. Under the influence of native grasses, the copy numbers of amoA-AOB, nirK, and nifH (nitrogen cycling genes) increased in each size fraction. We inferred that these native grasses enhanced the nitrification, denitrification, and fixation of N by regulating the expression of N cycling genes. The increase in the abundance of Proteobacteria and Bacteroidetes, which was associated with ammonia oxidation and denitrification, was consistent with this hypothesis [72,73].

5. Conclusions

We concluded that under the long-term management of native grasses, the contents of nutrients in the soil increased significantly, particularly the contents of soil organic carbon and nitrogen. After studying soil aggregate organic carbon and nitrogen, we found that their contents in soil aggregates at all size fractions increased; LMA contributed the most, and the contents of the organic carbon components POC and MAOC also increased in all size fractions. Further research on the microbial communities and the abundance of related genes identified an increase in the abundance of beneficial microorganisms and changes in microbial community structure in the soil aggregates. Thus, related beneficial microorganisms aggregated into large aggregates, and the abundance of genes related to nitrogen cycling increased. Stellaria media was more effective at improving soil nutrients, stability, and the contents of organic carbon and nitrogen in the soil aggregates and the microbial diversity of the soil aggregates. In conclusion, native grasses affected the contents of nutrients in the soil aggregates by influencing the microbial communities and related gene abundances, thereby enhancing the sequestration of soil nutrients. These results provide a new path for the promotion of sod culture, carbon sequestration, and fertilization in navel orange orchards and the green production of navel oranges in southern Jiangxi, China. While this study demonstrates the benefits of native grasses for soil nutrient sequestration and nutrient cycling, the findings are limited to iron–aluminum-enriched soils under specific management conditions. Future research should validate these results across diverse soil types and include economic assessments to facilitate farmer adoption.

Supplementary Materials

The following supporting information can be downloaded at https://www.mdpi.com/article/10.3390/horticulturae11050560/s1, Figure S1: The growth of native grasses in some navel orange orchards in southern Jiangxi, China; Figure S2: The largest navel orange production area and experimental site location in China; Figure S3: The native grasses growth of the experimental sites in 2024; Figure S4: The effect of native grasses on Kruskal–Wallis H test results, which showed the potential biomarkers within microbiomes in soil aggregates in navel orange orchards in southern Jiangxi, China; Figure S5: The effect of native grasses on PCA analysis of microbial community structure in soil aggregates in navel orange orchards in southern Jiangxi, China; Figure S6: The effect of native grasses on FAPROTAX functional prediction of metabolic or other ecologically relevant functions of bacteria in soil aggregates in navel orange orchards in southern Jiangxi, China; Figure S7: The effect of native grasses on correlation analysis of soil physicochemical properties with microbial OUTs in soil aggregates in navel orange orchards in southern Jiangxi, China; Table S1: Gene primers of five functional genes, bacterial 16S rRNA, and fungal ITS1; Table S2: The effect of native grasses on alpha-diversity of bacterial communities in soil aggregates in navel orange orchards in southern Jiangxi, China; Table S3: The effect of native grasses on alpha-diversity of fungal communities in soil aggregates in navel orange orchards in southern Jiangxi, China; Table S4: Annual yield and nutrient accumulation characteristics of native grasses in navel orange orchards in southern Jiangxi, China.

Author Contributions

W.W. designed and implemented the experiments and wrote the manuscript. Z.R., J.W., Y.D. and J.H. collected the data. Y.Y., X.Z., M.Y., Z.Y. and F.Y. analyzed and interpreted the data. C.C. contributed to the conception, design, implementation, and funding acquisition. All authors have read and agreed to the published version of the manuscript.

Funding

This study was funded by the Science and Technology Research Project of the Jiangxi Provincial Department of Education (GJJ2401107), the Jiangxi Province Key R&D Program (20223BBF61008), and the projects CX240091 and CX240093 supported by the Gannan Normal University Training Program of Innovation and Entrepreneurship for Undergraduates.

Data Availability Statement

The experimental data used in this study will be made available from the corresponding author on reasonable request.

Conflicts of Interest

The authors declare no conflicts of interest.

References

  1. Treeby, M.T.; Henriod, R.E.; Bevington, K.B.; Milne, D.J.; Storey, R. Irrigation management and rootstock effects on navel orange [Citrus sinensis (L.) Osbeck] fruit quality. Agric. Water Manag. 2007, 91, 24–32. [Google Scholar] [CrossRef]
  2. Liu, Y.; Sun, X.; Zhou, J.; Zhang, H.; Yang, C. Linear and nonlinear multivariate regressions for determination sugar content of intact Gannan navel orange by Vis–NIR diffuse reflectance spectroscopy. Math. Comput. Model. 2009, 51, 1438–1443. [Google Scholar] [CrossRef]
  3. Li, P.; Li, Y.; Xu, L.; Zhang, H.; Shen, X.; Xu, H.; Hu, F. Crop yield-soil quality balance in double cropping in China’s upland by organic amendments: A meta-analysis. Geoderma 2021, 403, 115197. [Google Scholar] [CrossRef]
  4. Xiao, D.; Huang, Y.; Feng, S.; Ge, Y.; Zhang, W.; He, X.; Wang, K. Soil organic carbon mineralization with fresh organic substrate and inorganic carbon additions in a red soil is controlled by fungal diversity along a pH gradient. Geoderma 2018, 321, 79–89. [Google Scholar] [CrossRef]
  5. Tan, H.; Fang, F.; Lin, Y.; Zhi, J.; Yao, Y.; Liu, Y.; Wang, J. Multidimensional effects of arable soil organic carbon distribution: A comparison among terrains. J. Soil. Sediment. 2025, 25, 207–221. [Google Scholar] [CrossRef]
  6. Ou, Y.; Rousseau, A.N.; Wang, L.X.; Yan, B.X. Spatio-temporal patterns of soil organic carbon and pH in relation to environmental factors—A case study of the black Soil region of Northeastern China. Agric. Ecosyst. Environ. 2017, 245, 22–31. [Google Scholar] [CrossRef]
  7. Teng, M.J.; Zeng, L.X.; Xiao, W.F.; Huang, Z.L.; Zhou, Z.X.; Yan, Z.G.; Wang, P.C. Spatial variability of soil organic carbon in Three Gorges Reservoir area, China. Sci. Total Environ. 2017, 599, 1308–1316. [Google Scholar] [CrossRef]
  8. Feng, Y.; Chen, H.; Fu, L.; Yin, M.; Wang, Z.; Li, Y.; Cao, W. Green manuring enhances soil multifunctionality in tobacco field in southwest China. Microorganisms 2024, 12, 949. [Google Scholar] [CrossRef]
  9. Zhang, F.; Shen, J.; Zhang, J.; Zuo, Y.; Li, L.; Chen, X. Rhizosphere processes and management for improving nutrient use efficiency and crop productivity: Implications for China. Adv. Agron. 2010, 107, 1–22. [Google Scholar]
  10. Liang, H.; Li, S.; Zhou, G.; Fu, L.; Hu, F.; Gao, S.; Cao, W. Targeted regulation of the microbiome by green manuring to promote tobacco growth. Biol. Fert. Soils 2023, 60, 69–85. [Google Scholar] [CrossRef]
  11. Asghar, W.; Kataoka, R. Green manure incorporation accelerates enzyme activity, plant growth, and changes in the fungal community of soil. Arch. Microbiol. 2021, 204, 7. [Google Scholar] [CrossRef] [PubMed]
  12. Monteiro, A.; Santos, S. Sustainable approach to weed management: The role of precision weed management. Agronomy 2022, 12, 118. [Google Scholar] [CrossRef]
  13. Gao, S.; Li, S.; Zhou, G.; Cao, W. The potential of green manure to increase soil carbon sequestration and reduce the yield-scaled carbon footprint of rice production in southern China. J. Integr. Agric. 2023, 22, 2233–2247. [Google Scholar] [CrossRef]
  14. Xu, Q.; Yao, Z.; Chen, Y.; Liu, N.; Teng, Z.; Huang, D.; Gao, Y. Priming and balance of soil organic carbon differ with additive C:N ratios and long-term green manuring. Appl. Soil Ecol. 2024, 201, 105495. [Google Scholar] [CrossRef]
  15. Liao, Q.; Li, T.; Liu, D. Evolutionary patterns and influencing factors of relationships among ecosystem services in the hilly red soil region of Southern China. Environ. Monit. Assess. 2024, 196, 360. [Google Scholar] [CrossRef]
  16. Bach, E.M.; Baer, S.G.; Meyer, C.K.; Six, J. Soil texture affects soil microbial and structural recovery during grassland restoration. Soil Biol. Biochem. 2010, 42, 2182–2191. [Google Scholar] [CrossRef]
  17. Bao, S.D. Soil Agrochemical Analysis, 3rd ed.; China Agriculture Press: Beijing, China, 2000. [Google Scholar]
  18. Al-Shammary, A.A.G.; Kouzani, A.Z.; Kaynak, A.; Khoo, S.Y.; Norton, M.; Gates, W. Soil bulk density estimation methods: A review. Pedosphere 2018, 28, 581–596. [Google Scholar] [CrossRef]
  19. Wang, B.; Xue, S.; Liu, G.B.; Zhang, G.H.; Li, G.; Ren, Z.P. Changes in soil nutrient and enzyme activities under different vegetations in the Loess Plateau area, Northwest China. Catena 2012, 92, 186–195. [Google Scholar] [CrossRef]
  20. Covaleda, S.; Pajares, S.; Gallardo, J.F.; Etchevers, J.D. Short-term changes in C and N distribution in soil particle size fractions induced by agricultural practices in a cultivated volcanic soil from Mexico. Org. Geochem. 2006, 37, 1943–1948. [Google Scholar] [CrossRef]
  21. Panagea, I.S.; Apostolakis, A.; Berti, A.; Bussell, J.; Čermak, P.; Diels, J.; Wyseure, G. Impact of agricultural management on soil aggregates and associated organic carbon fractions: Analysis of long-term experiments in Europ. Soil 2022, 8, 621–644. [Google Scholar] [CrossRef]
  22. Bacha, E.M.; Williams, R.J.; Hargreaves, S.K.; Yang, F.; Hofmockel, K.S. Greatest soil microbial diversity found in micro-habitats. Soil Biol. Biochem. 2018, 118, 217–226. [Google Scholar] [CrossRef]
  23. Dorodnikov, M.; Blagodatskaya, E.; Blagodatsky, S.; Fangmeier, A.; Kuzyakov, Y. Stimulation of r- vs. K-selected microorganisms by elevated atmospheric CO2 depends on soil aggregate size. FEMS Microbiol. Ecol. 2009, 69, 43–52. [Google Scholar] [CrossRef] [PubMed]
  24. Ju, W.; Fang, L.; Shen, G.; Delgado-Baquerizo, M.; Chen, J.; Zhou, G.; Blagodatskaya, E. New perspectives on microbiome and nutrient sequestration in soil aggregates during long-term grazing exclusion. Glob. Change Biol. 2024, 30, e17027. [Google Scholar] [CrossRef]
  25. Selesi, D.; Pattis, I.; Schmid, M.; Kandeler, E.; Hartmann, A. Quantification of bacterial RubisCO genes in soils by cbbL targeted real-time PCR. J. Microbiol. Meth. 2007, 69, 497–503. [Google Scholar] [CrossRef]
  26. Wallenstein, M.D.; Vilgalys, R.J. Quantitative analyses of nitrogen cycling genes in soils. Pedobiologia 2005, 49, 665–672. [Google Scholar] [CrossRef]
  27. Caporaso, J.G.; Lauber, C.L.; Walters, W.A.; Berg-Lyons, D.; Lozupone, C.A.; Turnbaugh, P.J.; Fierer, N.; Knight, R. Global patterns of 16S rRNA diversity at a depth of millions of sequences per sample. Proc. Natl. Acad. Sci. USA 2011, 108, 4516–4522. [Google Scholar] [CrossRef]
  28. Buee, M.; Reich, M.; Murat, C.; Morin, E.; Nilsson, R.H.; Uroz, S.; Martin, F. Pyrosequencing analyses of forest soils reveal an unexpectedly high fungal diversity. New Phytol. 2009, 184, 449–456. [Google Scholar] [CrossRef]
  29. Duan, G.; Li, L. Deciphering the mechanism of jujube vinegar on hyperlipoidemia through gut microbiome based on 16S rRNA, BugBase analysis, and the stamp analysis of KEEG. Front. Nutr. 2023, 10, 1160069. [Google Scholar] [CrossRef]
  30. Louca, S.; Parfrey, L.W.; Doebeli, M. Decoupling function and taxonomy in the global ocean microbiome. Science 2016, 353, 1272–1277. [Google Scholar] [CrossRef]
  31. Nguyen, N.H.; Song, Z.; Bates, S.T.; Branco, S.; Tedersoo, L.; Menke, J.; Kennedy, P.G. FUNGuild: An open annotation tool for parsing fungal community datasets by ecological guild. Fungal Ecol. 2016, 20, 241–248. [Google Scholar] [CrossRef]
  32. Chang, F.; He, S.; Dang, C. Assisted Selection of Biomarkers by Linear Discriminant Analysis Effect Size (LEfSe) in Microbiome Data. Jove-J. Vis. Exp. 2022, 183, e61715. [Google Scholar] [CrossRef]
  33. Kudraszow, N.L.; Fasano, M.V. Robust approaches to redundancy analysis. Commun. Stat-Theor. M. 2024, 53, 607–626. [Google Scholar] [CrossRef]
  34. Mbah, C.N.; Mbah, E.C.; Orji, J.E.; Igberi, C.; Abam, P.; Awere, S.U. Using Gliricidia sepium prunings as green manure in a degraded ultisol; effects on soil physical properties and yield of okra (Abelmuschus esculentus) in Abakaliki, southeast Nigeria. Biol. Agric. Hortic. 2024, 40, 257–266. [Google Scholar] [CrossRef]
  35. Adekiya, A.O.; Agbede, T.M.; Aboyeji, C.M.; Olaniran, A.F.; Aremu, C.; Ejue, W.S.; Adegbite, K. Poultry and green manures effects on soil properties, and sorghum performance, and quality. Commun. Soil Sci. Plan. 2022, 53, 463–477. [Google Scholar] [CrossRef]
  36. Li, P.; Jia, L.; Chen, Q.; Zhang, H.; Deng, J.; Lu, J.; Jiao, J. Adaptive evaluation for agricultural sustainability of different fertilizer management options for a green manure-maize rotation system: Impacts on crop yield, soil biochemical properties and organic carbon fractions. Sci. Total Environ. 2024, 908, 168170. [Google Scholar] [CrossRef]
  37. Yao, Y.; Zhu, R.; Li, X.; Hu, G.; Dong, Y.; Liu, Z. Long-term adoption of plow tillage and green manure improves soil physicochemical properties and optimizes microbial communities under a continuous peanut monoculture system. Front. Microbiol. 2024, 15, 1513528. [Google Scholar] [CrossRef]
  38. Özbolat, O.; Sánchez-Navarro, V.; Zornoza, R.; Egea-Cortines, M.; Cuartero, J.; Ros, M.; Martínez-Mena, M. Long-term adoption of reduced tillage and green manure improves soil physicochemical properties and increases the abundance of beneficial bacteria in a Mediterranean rainfed almond orchard. Geoderma 2023, 429, 116218. [Google Scholar] [CrossRef]
  39. Cantarella, H.; Otto, R.; Soares, J.R.; de Brito Silva, A.G. Agronomic efficiency of NBPT as a urease inhibitor: A review. J. Adv. Res. 2018, 13, 19–27. [Google Scholar] [CrossRef]
  40. Fonseca, A.A.D.; Santos, D.A.; Moura-Junior, C.D.; Passos, R.R.; Rangel, O.J.P. Phosphorus and potassium in aggregates of degraded soils: Changes caused by biochar application. Clean-Soil. Air. Water 2021, 49, 2000366. [Google Scholar] [CrossRef]
  41. Zhu, D.; Yang, Q.; Zhao, Y.; Cao, Z.; Han, Y.; Li, R.; Wu, Z. Afforestation influences soil aggregate stability by regulating aggregate transformation in karst rocky desertification areas. Forests 2023, 14, 1356. [Google Scholar] [CrossRef]
  42. Ren, C.; Liu, K.; Dou, P.; Li, J.; Wang, K. The changes in soil microorganisms and soil chemical properties affect the heterogeneity and stability of soil aggregates before and after grassland conversion. Agriculture 2022, 12, 307. [Google Scholar] [CrossRef]
  43. Qi, J.; Han, S.; Lin, B.; Xiao, X.; Jensen, J.L.; Munkholm, L.J.; Zhang, H. Improved soil structural stability under no-tillage is related to increased soil carbon in rice paddies: Evidence from literature review and field experiment. Environ. Technol. Inno. 2022, 26, 102248. [Google Scholar] [CrossRef]
  44. Zhang, H.; Liu, Z.; Chen, H.; Tang, M. Symbiosis of arbuscular mycorrhizal fungi and Robinia Pseudoacacia L. improves root tensile strength and soil aggregate stability. PLoS ONE 2016, 11, e153378. [Google Scholar] [CrossRef]
  45. Zheng, J.Y.; Zhao, J.S.; Shi, Z.H.; Wang, L. Soil aggregates are key factors that regulate erosion-related carbon loss in citrus orchards of southern China: Bare land vs. grass-covered land. Agric. Ecosyst. Environ. 2021, 309, 107254. [Google Scholar] [CrossRef]
  46. Conrad, K.; Dalal, R.C.; Fujinuma, R.; Menzies, N.W. Soil organic carbon and nitrogen sequestration and turnover in aggregates under subtropical leucaena–grass pastures. Soil Res. 2018, 56, 632–647. [Google Scholar] [CrossRef]
  47. LiuSui, Y.; Zhu, X.; Li, D.; Yan, C.; Sun, T.; Jia, H.; Zhao, X. Soil aggregate and intra-aggregate carbon fractions associated with vegetation succession in an alpine wetland of Northwest China. Catena 2019, 181, 104107. [Google Scholar] [CrossRef]
  48. Kang, L.; Wu, J.; Zhang, C.; Zhu, B.; Chu, G. Alterations of soil aggregates and intra-aggregate organic carbon fractions after soil conversion from paddy soils to upland soils: Distribution, mineralization and driving mechanism. Pedosphere 2024, 34, 121–135. [Google Scholar] [CrossRef]
  49. Tisdall, J.M.; Oades, J.M. The Effect of Crop Rotation on Aggregation in a Red-brown Earth. Aust. J. Soil Res. 1980, 18, 423–433. [Google Scholar] [CrossRef]
  50. Oades, J.M.; Waters, A.C. Aggregate Hierarchy in Soils. Aust. J. Soil Res. 1991, 29, 815–828. [Google Scholar] [CrossRef]
  51. Feller, C.; Beare, M.H. Physical control of soil organic matter dynamics in the tropics. Geoderma 1997, 79, 69–116. [Google Scholar] [CrossRef]
  52. Zhang, Q.; Zhou, W.; Liang, G.; Sun, J.; Wang, X.; He, P. Distribution of soil nutrients, extracellular enzyme activities and microbial communities across particle-size fractions in a long-term fertilizer experiment. Appl. Soil Ecol. 2015, 94, 59–71. [Google Scholar] [CrossRef]
  53. Lu, J.; Zhang, W.; Li, Y.; Liu, S.; Khan, A.; Yan, S.; Xiong, Y. Effects of reduced tillage with stubble remaining and nitrogen application on soil aggregation, soil organic carbon and grain yield in maize-wheat rotation system. Eur. J. Agron. 2023, 149, 126920. [Google Scholar] [CrossRef]
  54. Liu, L.; Liu, D.; Ding, X.; Chen, M.; Zhang, S. Straw incorporation and nitrogen fertilization enhance soil carbon sequestration by altering soil aggregate and microbial community composition in saline-alkali soil. Plant Soil 2023, 498, 341–356. [Google Scholar] [CrossRef]
  55. Zimmermann, M.; Leifeld, J.; Abiven, S.; Schmidt, M.W.I.; Fuhrer, J. Sodium hypochlorite separates an older soil organic matter fraction than acid hydrolysis. Geoderma 2007, 139, 171–179. [Google Scholar] [CrossRef]
  56. Leifeld, J.; Koegel-Knabner, I. Soil organic matter fractions as early indicators for carbon stock changes under different land-use? Geoderma 2005, 124, 143–155. [Google Scholar] [CrossRef]
  57. Schrumpf, M.; Kaiser, K. Large differences in estimates of soil organic carbon turnover in density fractions by using single and repeated radiocarbon inventories. Geoderma 2015, 239–240, 168–178. [Google Scholar] [CrossRef]
  58. Blaud, A.; Lerch, T.Z.; Chevallier, T.; Nunan, N.; Chenu, C.; Brauman, A. Dynamics of bacterial communities in relation to soil aggregate formation during the decomposition of 13C-labelled rice straw. Appl. Soil Ecol. 2012, 53, 1–9. [Google Scholar] [CrossRef]
  59. Lupwayi, N.Z.; Soon, Y.K. Carbon and nitrogen release from legume crop residues for three subsequent crops. Soil Sci. Soc. Am. J. 2015, 79, 1650–1659. [Google Scholar] [CrossRef]
  60. Jiang, Y.; Liang, Y.; Li, C.; Wang, F.; Sui, Y.; Suvannang, N.; Sun, B. Crop rotations alter bacterial and fungal diversity in paddy soils across East Asia. Soil Biol. Biochem. 2016, 95, 250–261. [Google Scholar] [CrossRef]
  61. Wang, L.; Wang, X.; Wang, T. Effects of increasing drip irrigation at different maize growth stages on soil microorganisms. Front. Microbiol. 2024, 15, 1343302. [Google Scholar] [CrossRef]
  62. Zumsteg, A.; Schmutz, S.; Frey, B. Identification of biomass utilizing bacteria in a carbon-depleted glacier forefield soil by the use of 13C DNA stable isotope probing. Environ. Microbiol. Rep. 2013, 5, 424–437. [Google Scholar] [CrossRef] [PubMed]
  63. Boubekri, K.; Soumare, A.; Mardad, I.; Lyamlouli, K.; Ouhdouch, Y.; Hafidi, M.; Kouisni, L. Multifunctional role of Actinobacteria in agricultural production sustainability: A revie. Microbiol. Res. 2022, 261, 127059. [Google Scholar] [CrossRef] [PubMed]
  64. Chen, R.; Senbayram, M.; Blagodatsky, S.; Myachina, O.; Dittert, K.; Lin, X.; Kuzyakov, Y. Soil C and N availability determine the priming effect: Microbial N mining and stoichiometric decomposition theories. Glob. Change Biol. 2014, 20, 2356–2367. [Google Scholar] [CrossRef] [PubMed]
  65. Trivedi, P.; Rochester, I.J.; Trivedi, C.; Van Nostrand, J.D.; Zhou, J.; Karunaratne, S.; Singh, B.K. Soil aggregate size mediates the impacts of cropping regimes on soil carbon and microbial communities. Soil Biol. Biochem. 2015, 91, 169–181. [Google Scholar] [CrossRef]
  66. Yuan, H.; Ge, T.; Wu, X.; Liu, S.; Tong, C.; Qin, H.; Wu, J. Long-term field fertilization alters the diversity of autotrophic bacteria based on the ribulose-1,5-biphosphate carboxylase/oxygenase (RubisCO) large-subunit genes in paddy soil. Appl. Microbiol. Biot. 2012, 95, 1061–1071. [Google Scholar] [CrossRef]
  67. Wu, X.; Ge, T.; Wang, W.; Yuan, H.; Wegner, C.; Zhu, Z.; Wu, J. Cropping systems modulate the rate and magnitude of soil microbial autotrophic CO2 fixation in soil. Front. Microbiol. 2015, 6, 379. [Google Scholar] [CrossRef]
  68. Lynn, T.M.; Ge, T.; Yuan, H.; Wei, X.; Wu, X.; Xiao, K.; Whiteley, A.S. Soil carbon-fixation rates and associated bacterial diversity and abundance in three natural ecosystems. Microb. Ecol. 2017, 73, 645–657. [Google Scholar] [CrossRef]
  69. Zhou, Z.; Wei, W.; Shi, X.; Liu, Y.; He, X.; Wang, M. Twenty-six years of chemical fertilization decreased soil RubisCO activity and changed the ecological characteristics of soil cbbL-carrying bacteria in an entisol. Appl. Soil Ecol. 2019, 141, 1–9. [Google Scholar] [CrossRef]
  70. Ge, T.; Wu, X.; Liu, Q.; Zhu, Z.; Yuan, H.; Wang, W.; Wu, J. Effect of simulated tillage on microbial autotrophic CO2 fixation in paddy and upland soils. Sci. Rep. 2016, 6, 19784. [Google Scholar] [CrossRef]
  71. Xiao, H.; Li, Z.; Chang, X.; Deng, L.; Nie, X.; Liu, C.; Wang, D. Microbial CO2 assimilation is not limited by the decrease in autotrophic bacterial abundance and diversity in eroded watershed. Biol. Fert. Soils 2018, 54, 595–605. [Google Scholar] [CrossRef]
  72. Daims, H.; Lebedeva, E.V.; Pjevac, P.; Han, P.; Herbold, C.; Albertsen, M.; Wagner, M. Complete nitrification by Nitrospira bacteria. Nature 2015, 528, 504–509. [Google Scholar] [CrossRef] [PubMed]
  73. Frostegard, A.; Vick, S.H.W.; Lim, N.Y.N.; Bakken, L.R.; Shapleigh, J.P. Linking meta-omics to the kinetics of denitrification intermediates reveals pH-dependent causes of N2O emissions and nitrite accumulation in soil. ISME J. 2022, 16, 26–37. [Google Scholar] [CrossRef] [PubMed]
Figure 1. The effect of native grasses on soil organic carbon and total nitrogen content in soil aggregates in navel orange orchards in southern Jiangxi, China. Note: The content of SOC in different soil aggregates (a), the content of TN in different soil aggregates (b). Different lowercase letters indicate significant differences between different treatments of the same size fraction (p < 0.05). Differences between different size fractions and different treatments as well as differences in their interactions are indicated by ** (p < 0.01). A (aggregate), T (treatment), CK (clear tillage), CA (intercropping Centella asiatica (L.) Urban), SM (intercropping Stellaria media (L.) Cvr.), SOC (soil organic carbon), TN (total nitrogen), LMA (large macro-aggregates, >2 mm), MMA (medium macro-aggregates, 1–2 mm), SMA (small macro-aggregates, 0.25–1 mm), MI (micro-aggregates, <0.25 mm).
Horticulturae 11 00560 g001
Figure 2. The effect of native grasses on contribution rates of soil organic carbon and nitrogen in soil aggregates in navel orange orchards in southern Jiangxi, China. Note: The contribution rate of SOC in different soil aggregates (a), the contribution rate of TN in different soil aggregates (b). Different lowercase letters indicate significant differences between different treatments of the same size fraction (p < 0.05). Differences between different size fractions and different treatments as well as differences in their interactions are indicated by * (p < 0.05) and ** (p < 0.01). A (aggregate), T (treatment), CK (clear tillage), CA (intercropping Centella asiatica (L.) Urban), SM (intercropping Stellaria media (L.) Cvr.), SOC (soil organic carbon), TN (total nitrogen), LMA (large macro-aggregates, >2 mm), MMA (medium macro-aggregates, 1–2 mm), SMA (small macro-aggregates, 0.25–1 mm), MI (micro-aggregates, <0.25 mm).
Horticulturae 11 00560 g002
Figure 3. The effect of native grasses on soil carbon component in soil aggregates in navel orange orchards in southern Jiangxi, China. Note: The content of POC in different soil aggregates (a), the content of MAOC in different soil aggregates (b). Different lowercase letters indicate significant differences between different treatments of the same size fraction (p < 0.05). Differences between different size fractions and different treatments as well as differences in their interactions are indicated by ** (p < 0.01). A (aggregate), T (treatment), CK (clear tillage), CA (intercropping Centella asiatica (L.) Urban), SM (intercropping Stellaria media (L.) Cvr.), SOC (soil organic carbon), TN (total nitrogen), LMA (large macro-aggregates, >2 mm), MMA (medium macro-aggregates, 1–2 mm), SMA (small macro-aggregates, 0.25–1 mm), MI (micro-aggregates, <0.25 mm).
Horticulturae 11 00560 g003
Figure 4. The effect of native grasses on ACE indices of microorganisms in soil aggregates in navel orange orchards in southern Jiangxi, China. Note: Box plots display ACE indices of bacterial species in LMA (a), MMA (b), SMA (c), and MI (d) and of fungal species in LMA (e), MMA (f), SMA (g), and MI (h). Significant differences are indicated by * (p < 0.05). CK (clear tillage), CA (intercropping Centella asiatica (L.) Urban), SM (intercropping Stellaria media (L.) Cvr.), LMA (large macro-aggregates, >2 mm), MMA (medium macro-aggregates, 1–2 mm), SMA (small macro-aggregates, 0.25–1 mm), MI (micro-aggregates, <0.25 mm).
Horticulturae 11 00560 g004
Figure 5. The effect of native grasses on OTU numbers of microbial communities in soil aggregates in navel orange orchards in southern Jiangxi, China. Note: Venn plots display the OTU counts of bacterial species in LMA (a), MMA (b), SMA (c), and MI (d) and of fungal species in LMA (e), MMA (f), SMA (g), and MI (h). CK (clear tillage), CA (intercropping Centella asiatica (L.) Urban), SM (intercropping Stellaria media (L.) Cvr.), LMA (large macro-aggregates, >2 mm), MMA (medium macro-aggregates, 1–2 mm), SMA (small macro-aggregates, 0.25–1 mm), MI (micro-aggregates, <0.25 mm).
Horticulturae 11 00560 g005
Figure 6. The effect of native grasses on microbial community structure in soil aggregates in navel orange orchards in southern Jiangxi, China. Note: Circos plots display the composition and relative abundance of bacterial communities in LMA (a), MMA (b), SMA (c), and MI (d) and of fungal communities in LMA (e), MMA (f), SMA (g), and MI (h). CK (clear tillage), CA (intercropping Centella asiatica (L.) Urban), SM (intercropping Stellaria media (L.) Cvr.), LMA (large macro-aggregates, >2 mm), MMA (medium macro-aggregates, 1–2 mm), SMA (small macro-aggregates, 0.25–1 mm), MI (micro-aggregates, <0.25 mm).
Horticulturae 11 00560 g006
Figure 7. The effect of native grasses on microbial community composition and relative abundance in soil aggregates in navel orange orchards in southern Jiangxi, China. Note: The community bar charts display the composition of bacterial species and the proportions of different species in LMA (a), MMA (b), SMA (c), and MI (d) and of fungal species in LMA (e), MMA (f), SMA (g), and MI (h). CK (clear tillage), CA (intercropping Centella asiatica (L.) Urban), SM (intercropping Stellaria media (L.) Cvr.), LMA (large macro-aggregates, >2 mm), MMA (medium macro-aggregates, 1–2 mm), SMA (small macro-aggregates, 0.25–1 mm), MI (micro-aggregates, <0.25 mm).
Horticulturae 11 00560 g007
Figure 8. The effect of native grasses on LEfSe analysis of microbial genera in soil aggregates in navel orange orchards in southern Jiangxi, China. Note: LDA discriminant plots display the LDA values of different bacterial species with distinct differences in LMA (a), MMA (b), SMA (c), and MI (d) and of different fungal species with distinct differences in LMA (e), MMA (f), and SMA (g). The effect size LDA score between treatments is >4. CK (clear tillage), CA (intercropping Centella asiatica), SM (intercropping Stellaria media), LMA (large macro-aggregates, >2 mm), MMA (medium macro-aggregates, 1–2 mm), SMA (small macro-aggregates, 0.25–1 mm), MI (micro-aggregates, <0.25 mm).
Horticulturae 11 00560 g008
Figure 9. The effect of native grasses on prediction of bacterial phenotypic function based on BugBase and prediction of fungal phenotypic function based on FUNGuild in soil aggregates in navel orange orchards in southern Jiangxi, China. Bar charts display bacterial BugBase phenotype predictions in LMA (a), MMA (b), SMA (c), and MI (d), and bar charts of FUNGuild display the functional classification of fungi and the abundance information of each functional classification in LMA (e), MMA (f), SMA (g), and MI (h). Note: CK (clear tillage), CA (intercropping Centella asiatica (L.) Urban), SM (intercropping Stellaria media (L.) Cvr.), LMA (large macro-aggregates, >2 mm), MMA (medium macro-aggregates, 1–2 mm), SMA (small macro-aggregates, 0.25–1 mm), MI (micro-aggregates, <0.25 mm).
Horticulturae 11 00560 g009
Figure 10. The effect of native grasses on Mantel test analysis of microbial communities and environmental factors and functional genes in soil aggregates in navel orange orchards in southern Jiangxi, China. Note: (a) Mantel test network heatmap displayed the correlation between environmental factors and bacterial community structure. (b) Mantel test network heatmap displayed the correlation between environmental factors and fungal community structure. The lines in the figure represent the correlation between communities and environmental factors, while the heatmap represents the correlation between environmental factors. Line thickness: the correlation between the community and environmental factors, plotted using Mantel’s r (absolute value of R). Line color: different Mantel’s p values. In the heatmap, different colors represent positive and negative correlations, and the depth of colors represents the magnitude of positive and negative correlations. The stars in the color blocks represent significance with * (0.01 < p ≤ 0.05), ** (0.001 < p ≤ 0.01), and *** (p ≤ 0.001). CK (clear tillage), CA (intercropping Centella asiatica (L.) Urban), SM (intercropping Stellaria media (L.) Cvr.), LMA (large macro-aggregates, >2 mm), MMA (medium macro-aggregates, 1–2 mm), SMA (small macro-aggregates, 0.25–1 mm), MI (micro-aggregates, <0.25 mm).
Horticulturae 11 00560 g010
Table 1. The effect of native grasses on soil physical properties in navel orange orchards in southern Jiangxi, China.
TreatmentBulk Density (g·cm−3)Maximum Field
Capacity (%)
Total
Porosity (%)
Capillary Porosity (%)Aeration
Porosity (%)
CK1.32 ± 0.05 a29.50 ± 2.33 c50.26 ± 2.01 b38.45 ± 3.56 c11.81 ± 5.24 a
CA1.13 ± 0.07 b42.81 ± 3.76 a57.30 ± 2.50 a48.27 ± 2.43 a9.03 ± 3.08 a
SM1.16 ± 0.07 b34.14 ± 1.33 b56.06 ± 2.77 a42.70 ± 2.05 b13.35 ± 2.43 a
Note: The table data are means of three independent replicates; values are in the form of means ± standard deviations. Different lowercase letters indicate significant differences between different treatments (p < 0.05). CK (clear tillage), CA (intercropping Centella asiatica (L.) Urban), SM (intercropping Stellaria media (L.) Cvr.).
Table 2. The effect of native grasses on soil chemical properties in navel orange orchards in southern Jiangxi, China.
TreatmentpHSOC
(g·kg−1)
TN
(g·kg−1)
Olsen-P
(mg·kg−1)
AK
(mg·kg−1)
CK5.40 ± 0.08 a5.74 ± 0.50 c0.15 ± 0.02 b10.75 ± 1.37 c111.27 ± 0.55 b
CA5.53 ± 0.09 a12.54 ± 0.10 b0.28 ± 0.05 a22.56 ± 1.03 b261.39 ± 6.34 a
SM5.45 ± 0.07 a16.33 ± 0.41 a0.27 ± 0.04 a30.76 ± 1.75 a271.61 ± 12.14 a
Note: The table data are means of three independent replicates; values are in the form of means ± standard deviations. Different lowercase letters indicate significant differences between different treatments (p < 0.05). CK (clear tillage), CA (intercropping Centella asiatica (L.) Urban), SM (intercropping Stellaria media (L.) Cvr.), SOC (soil organic carbon), TN (total nitrogen), Olsen-P (available phosphorus), AK (available potassium).
Table 3. The effect of native grasses on soil enzyme activity in navel orange orchards in southern Jiangxi, China.
TreatmentUrease
(μg·g−1·d−1)
Catalase
(mg·g−1·d−1)
Amylase
(μg·g−1·d−1)
Sucrase
(mg·g−1·d−1)
Acid Phosphatase
(mg·g−1·d−1)
CK46.17 ± 2.26 b120.08 ± 3.20 c25.58 ± 0.92 a15.31 ± 2.13 b0.55 ± 0.05 a
CA65.67 ± 0.08 a197.06 ± 16.50 b25.72 ± 1.23 a26.75 ± 1.31 a0.57 ± 0.04 a
SM67.52 ± 6.67 a254.87 ± 11.81 a25.80 ± 1.08 a31.65 ± 3.85 a0.60 ± 0.00 a
Note: The table data are means of three independent replicates; values are in the form of means ± standard deviations. Different lowercase letters indicate significant differences between different treatments (p < 0.05). CK (clear tillage), CA (intercropping Centella asiatica (L.) Urban), SM (intercropping Stellaria media (L.) Cvr.).
Table 4. The effect of native grasses on proportion of soil aggregates in navel orange orchards in southern Jiangxi, China.
MethodTreatment>2 mm1–2 mm0.25–1 mm<0.25 mm
CK56.05 ± 6.00 b17.98 ± 2.48 a18.23 ± 3.20 a7.74 ± 1.51 a
MSACA62.65 ± 2.48 b15.56 ± 1.76 a17.00 ± 1.18 a4.79 ± 0.18 b
SM77.55 ± 6.43 a8.93 ± 3.36 b9.60 ± 3.01 b3.92 ± 0.19 b
CK46.29 ± 1.82 b17.88 ± 0.65 a23.22 ± 2.44 a12.61 ± 1.62 a
WSACA46.81 ± 4.00 b17.73 ± 1.60 a25.84 ± 4.15 a9.62 ± 1.93 ab
SM72.05 ± 5.62 a8.31 ± 3.81 b12.90 ± 2.37 b6.73 ± 0.44 b
Note: The table data are means of three independent replicates; values are in the form of means ± standard deviations. Different lowercase letters indicate significant differences between different treatments of the same size fraction (p < 0.05). CK (clear tillage), CA (intercropping Centella asiatica (L.) Urban), SM (intercropping Stellaria media (L.) Cvr.), MSA (mechanically stable aggregates), WSA (water-stable aggregates).
Table 5. The effect of native grasses on stability of soil aggregates in navel orange orchards in southern Jiangxi, China.
TreatmentMWD (mm)GDM (mm)DR0.25 (%)PAD (%)ELT (%)
CK1.61 ± 0.01 b0.79 ± 0.04 b2.10 ± 0.05 a88.06 ± 2.26 b5.23 ± 0.26 a15.00 ± 1.60 a
CA1.68 ± 0.02 b0.83 ± 0.03 ab2.01 ± 0.07 a90.38 ± 1.93 ab4.79 ± 0.54 a12.93 ± 0.64 b
SM2.03 ± 0.07 a0.88 ± 0.01 a2.01 ± 0.05 a93.27 ± 0.44 a2.93 ± 0.53 b9.78 ± 0.37 c
Note: The table data are means of three independent replicates; values are in the form of means ± standard deviations. Different lowercase letters indicate significant differences between different treatments (p < 0.05). CK (clear tillage), CA (intercropping Centella asiatica (L.) Urban), SM (intercropping Stellaria media (L.) Cvr.), MSA (mechanically stable aggregates), MWD (mean weight diameter), GMD (geometric mean diameter), D (fractal dimension), R0.25 (aggregate content greater than 0.25 mm), PAD (aggregate failure rate), ELT (unstable aggregate index).
Table 6. The effect of native grasses on abundance of nutrient cycling-related functional genes in soil aggregates in navel orange orchards in southern Jiangxi, China.
AggregatesTreatmentcbbL (105 Copies·g−1 DNA)amoA (103 Copies·g−1 DNA)nirS (104 Copies·g−1 DNA)nirK (104 Copies·g−1 DNA)nifH (104 Copies·g−1 DNA)
LMACK11.70 ± 0.58 a0.37 ± 0.36 c0.79 ± 0.17 a4.46 ± 0.78 a4.80 ± 0.40 a
CA7.95 ± 0.78 b27.45 ± 1.99 a1.11 ± 0.33 a8.40 ± 2.31 a8.40 ± 2.31 a
SM8.64 ± 0.37 b17.49 ± 2.31 b1.00 ± 0.42 a5.91 ± 1.13 a5.91 ± 1.13 a
MMACK11.49 ± 0.18 a0.47 ± 0.16 c1.02 ± 0.15 a4.77 ± 1.06 b4.77 ± 1.06 b
CA9.23 ± 1.40 b34.84 ± 5.14 a1.34 ± 0.25 a10.05 ± 0.38 a10.71 ± 1.53 a
SM7.71 ± 0.25 b17.18 ± 2.68 b1.06 ± 0.32 a5.56 ± 1.62 b6.23 ± 2.77 ab
SMACK12.80 ± 0.55 a0.43 ± 0.07 b1.43 ± 0.09 a4.40 ± 0.38 c4.40 ± 0.38 c
CA10.90 ± 1.41 a27.11 ± 9.30 a1.48 ± 0.40 a9.91 ± 1.34 a9.91 ± 1.34 a
SM7.83 ± 1.08 b17.20 ± 3.02 a1.46 ± 0.28 a6.50 ± 0.99 b6.50 ± 0.99 b
MICK16.65 ± 1.01 a12.83 ± 3.03 b1.58 ± 0.18 a5.19 ± 1.48 b5.19 ± 1.48 b
CA10.45 ± 1.29 b40.18 ± 6.82 a1.50 ± 0.21 a10.19 ± 1.06 a10.19 ± 1.06 a
SM8.56 ± 0.47 b14.85 ± 2.32 b1.33 ± 0.10 a6.35 ± 0.67 b6.35 ± 0.67 b
Aggregates (3)13.86 **6.67 **7.86 **1.040.76
Treatment (2)91.04 **144.20 **1.2752.70 **39.92 **
Aggregates × Treatment (6)6.51 **3.54 *0.640.510.49
Note: The table data are means of three independent replicates; values are in the form of means ± standard deviations. Different lowercase letters indicate significant differences between different treatments of the same size fraction (p < 0.05). Differences between different size fractions and different treatments, as well as differences in their interactions, are indicated by * (p < 0.05) and ** (p < 0.01). CK (clear tillage), CA (intercropping Centella asiatica (L.) Urban), SM (intercropping Stellaria media (L.) Cvr.), LMA (large macro-aggregates, >2 mm), MMA (medium macro-aggregates, 1–2 mm), SMA (small macro-aggregates, 0.25–1 mm), MI (micro-aggregates, <0.25 mm).
Disclaimer/Publisher’s Note: The statements, opinions and data contained in all publications are solely those of the individual author(s) and contributor(s) and not of MDPI and/or the editor(s). MDPI and/or the editor(s) disclaim responsibility for any injury to people or property resulting from any ideas, methods, instructions or products referred to in the content.

