1. Introduction
The tree peony (
Paeonia suffruticosa Andr.) is a species unique to China. Praised as the “king of flowers” by the Chinese people, the tree peony is revered for its ornamental value and cultural symbolism [
1]. The native tree peony species distributed in China include
P. ostii,
P. ludlowii, and
P. delavayi, among others. In 2011,
P. ostii and
P. rockii were selected by the Chinese Ministry of Health as resources of edible oils. The tree peony thus has both medicinal and ornamental value.
P. ostii prefers a soil environment rich in nutrients, but most of the soil conditions in the current domestic oil tree peony production areas do not meet these standards. Therefore, additional nutrient supplementation is generally required when planting
P. ostii. In field production, nutrient supplementation is primarily carried out during the bud sprouting, post-flowering, and dormancy periods of tree peony growth [
2,
3].
Nitrogen, phosphorus, and potassium are essential macronutrients for the growth and development of plants. Nitrogen participates in most physiological and biochemical reactions. Studies have shown that nitrogen is the element with the highest annual absorption in the perennial growth of
P. ostii [
4,
5], up to 1.01 g per plant [
6]. Nitrogen has a significant impact on the photosynthesis of
P. ostii, with net photosynthetic rates and photosynthetic capacity increasing with the amount of nitrogen applied [
7]. Some studies have indicated that nitrogen is the primary factor for increasing the yield of
P. ostii, and a higher application of nitrogen can increase yield. Phosphorus is a necessary element for plant growth, as it is involved in photosynthesis, respiration, and the growth and development of plants, affecting the storage and transfer of plant energy. Previous research has demonstrated that the impact of phosphorus on the yield of
P. ostii is second only to that of nitrogen [
8]. Potassium acts as a catalyst for many enzymes, including those involved in photosynthesis, protein synthesis, sugar and fat metabolism, and the stress resistance of plants. Studies have shown that during fruit development and seed maturation, the absorption of potassium by
P. ostii is higher than that of nitrogen and phosphorus, and the annual absorption is much higher than that of phosphorus while being similar to that of nitrogen [
9]. The absorption of phosphorus and potassium by the tree peony reaches a peak during the ripening period, with the absorption of potassium also reaching the highest annual level [
10].
The market for products produced by the peony industry is rapidly expanding. However, there exists a lag in cultivation and maintenance management, particularly in research on enhancing the yield of
P. ostii and optimizing nutrient supplementation, where significant knowledge gaps remain [
11,
12,
13]. Prior studies have predominantly focused on the effects of individual nutrients, often overlooking the interactive effects of nutrient ratios and total dosages across different growth stages. Given the distinct physiological needs of
P. ostii at various phenological phases—from vegetative growth to reproductive development and eventual dormancy—a temporally segmented fertilization strategy may be more effective.
This study aimed to evaluate how varying combinations of nitrogen, phosphorus, and potassium, applied at different phenological stages, influence critical developmental traits of P. ostii, including flowering performance and seed yield.
2. Materials and Methods
The P. ostii specimens used in the study were all seven-year-old plants from the Peony Garden area of Shanghai Chenshan Botanical Garden (31°4′52″ N, 121°10′14″ E). The plants were potted at the end of November 2022.
The soil used for the trial had a pH of 7.2, an alkali-hydrolyzable nitrogen content of 144.19 mg/kg, an available phosphorus concentration of 59.33 mg/kg, and a readily available potassium level of 278.54 mg/kg. Urea (CO(NH2)2), superphosphate (Ca(H2PO4)2), and potassium sulfate (K2SO4) were employed as nitrogen, phosphorus, and potassium fertilizers, respectively. The cultivation substrate was a homogeneous mixture of 70% soil and 30% crushed volcanic rock. The plants were grown in pots with an inner diameter of 40 cm and a height of 30 cm.
In November 2022, healthy plants with consistent morphology were selected and transplanted into the potted substrate, and the ground diameter of each plant was measured and recorded. Then, nutrient supplements were applied to each plant during the bud sprouting period, the post-flowering period, and the dormancy period. The dates for nutrient supplementation were 18 February, 30 April, and 15 October. Three different nutrient ratios were designed:
A (high P ratio): N–P–K = 20%–35%–20%;
B (high nitrogen and potassium (N&K) ratio): N–P–K = 35%–20%–35%;
C (all-high ratio): N–P–K = 45%–45%–45%.
Each ratio was applied only once and at a specific growth stage, without repetition across periods. For example, Ratio A was applied during the bud sprouting stage, B during the post-flowering stage, and C during the dormancy period.
In practical horticultural and agricultural production, growers often apply fertilizers at or above the recommended levels to maximize yield and flowering performance. Therefore, this study compared the standard fertilization amount (urea, 30 g/plant; superphosphate, 40 g/plant; potassium sulfate, 14 g/plant) with an increased amount of 1.5 × the standard amount to simulate common cultivation scenarios and explore the potential effects of excessive fertilization (
Table 1). A reduced fertilizer level (e.g., 0.5 × amount) was not included, as it is less reflective of typical production practices. Whole-plant sampling was conducted at the end of each nutrient supplementation period. At the end of each nutrient supplementation stage, samples were collected from each treatment group. Three plants with similar growth status were selected as biological replicates. After thoroughly washing the entire plants, they were oven-dried to a constant weight for biomass determination. Subsequently, dried leaves, roots, and rhizosphere soil samples were collected for elemental analysis.
The utilization of P. ostii at the same application rate varied across different periods, establishing a year-round research system for nutrient supplementation to investigate the effects of varying nutrient amounts and ratios on its characteristics during different time intervals.
2.1. Measurement of Ornamental Traits During the Flowering Period
Flowering time: Daily observations were conducted from 2 April onwards to determine the duration between the emergence of the first flower and the withering of the last flower for each tree peony.
The photosynthetic rate (Pn) of leaves was measured on clear mornings between 2 and 12 April, from 9:00 to 11:00 a.m., using a portable photosynthesis system (LI-6400XT; LI-COR Biosciences, Lincoln, NE, USA) equipped with a standard leaf chamber and operated in open-path mode. The measurements were taken on the 4th to 5th functional leaves downward from the top of the main branch, avoiding the leaf veins. For each treatment group, six plants with similar growth were selected, with three leaves measured per plant. The measurements were repeated three times, and the average values were used in the analysis. All measurements were conducted under ambient environmental conditions within the greenhouse, without artificial manipulation of light, temperature, humidity, or CO2 concentration. Given that the study aimed to evaluate the physiological responses of P. ostii under typical horticultural management practices, these environmental parameters were not controlled or stabilized. Furthermore, under such natural conditions, environmental factors exhibit dynamic fluctuations and are inherently uncontrollable during measurement, reinforcing the rationale for excluding these parameters from data analysis.
2.2. Post-Flowering and Fruit Ripening Period Indicator Measurement
The leaf relative water content (RWC) was measured after the second round of fertilization. Six plants with similar growth were selected from each treatment group, and three leaves were collected from each plant for subsequent laboratory analysis. The fresh weight (G1) of the leaves was measured initially, followed by drying in a 60° oven for 48 h to obtain the dry weight (G2). The relative water content was then calculated using the formula RWC = (G1 − G2)/G1.
During the fruit ripening period, the number of follicles, the average seed weight, and the seed count per tree peony were quantified. All measurements were conducted using an electronic balance with a precision of 0.01 kg.
2.3. Dormancy Period Traits and Nutrient Content
Diameter increment: the stem diameter was measured at 20 cm above the soil surface. Six plants with similar growth were selected from each treatment group, and the ground diameter was measured three times using a Vernier caliper (Model DL91150B; Deli Co., Ltd., Ningbo, China) (0.01 mm) to obtain an average value. The ground diameter measured after potting in November 2022 was denoted as D1, while the measurement taken in December 2023 was denoted as D2. The diameter increment was calculated as the difference between D2 and D1.
During the bud sprouting period and after the completion of fruit ripening, the nutrient contents of the leaves, root system, and substrate were measured. The determination of nutrients in plant tissues and soil was conducted according to the method of Guo [
14]. For each treatment combination, three plants with a similar growth status were selected and carefully uprooted with their roots intact. The roots, leaves, and rhizosphere soil were oven-dried at 60 °C for 48 h, and the air-dried samples were used for subsequent analysis. The nitrogen content in plant tissues was determined using the Kjeldahl method after digestion with sulfuric acid and hydrogen peroxide. The phosphorus content was measured using the molybdenum–antimony anti-spectrophotometric method following the same digestion. The potassium content was analyzed using a flame photometer (BWB Technologies Ltd., Newbury, Berkshire, UK). In the soil, alkali-hydrolyzable nitrogen was determined by the alkali diffusion method, available phosphorus by the molybdenum–antimony anti-spectrophotometric method, and available potassium by flame photometry.
2.4. Measurement of Unsaturated Fatty Acid Accumulation
As
P.
ostii is cultivated primarily as an oil crop, the composition and content of seed fatty acids—particularly unsaturated fatty acids—are crucial traits determining its oil quality. To protect unsaturated fatty acids from oxidative degradation during sample processing and ensure accurate quantification of total unsaturated fatty acid content, fatty acids in
P. ostii seeds were methylated prior to analysis, following the method of Yu et al. [
15]. We used 50 mg/mL of nonadecanoic acid in hexane as the internal standard. The FA methyl esters were measured using a GC-MS (GC7890/MS5975, Agilent Technologies, Santa Clara, CA, USA) on a HP-88 capillary column (30 m long × 0.25 mm internal diameter; 0.2 μm; Agilent). This derivatization process converts labile unsaturated fatty acids (such as oleic acid, linoleic acid, and α-linolenic acid) into their more stable methyl ester forms, effectively preventing oxidative losses while simultaneously improving the analytes’ volatility and chromatographic detectability.
2.5. Data Analysis and Processing
The statistical analysis was performed using SPSS 26.0 software, employing two-factor analysis of variance, single-factor analysis of variance, and independent sample t tests. Duncan’s method was applied to determine significant differences. Charts were created using Excel 2019 and GraphPad Prism 9.
3. Results
3.1. Effects of Application Amounts and Ratios on the Flowering Period of P. ostii
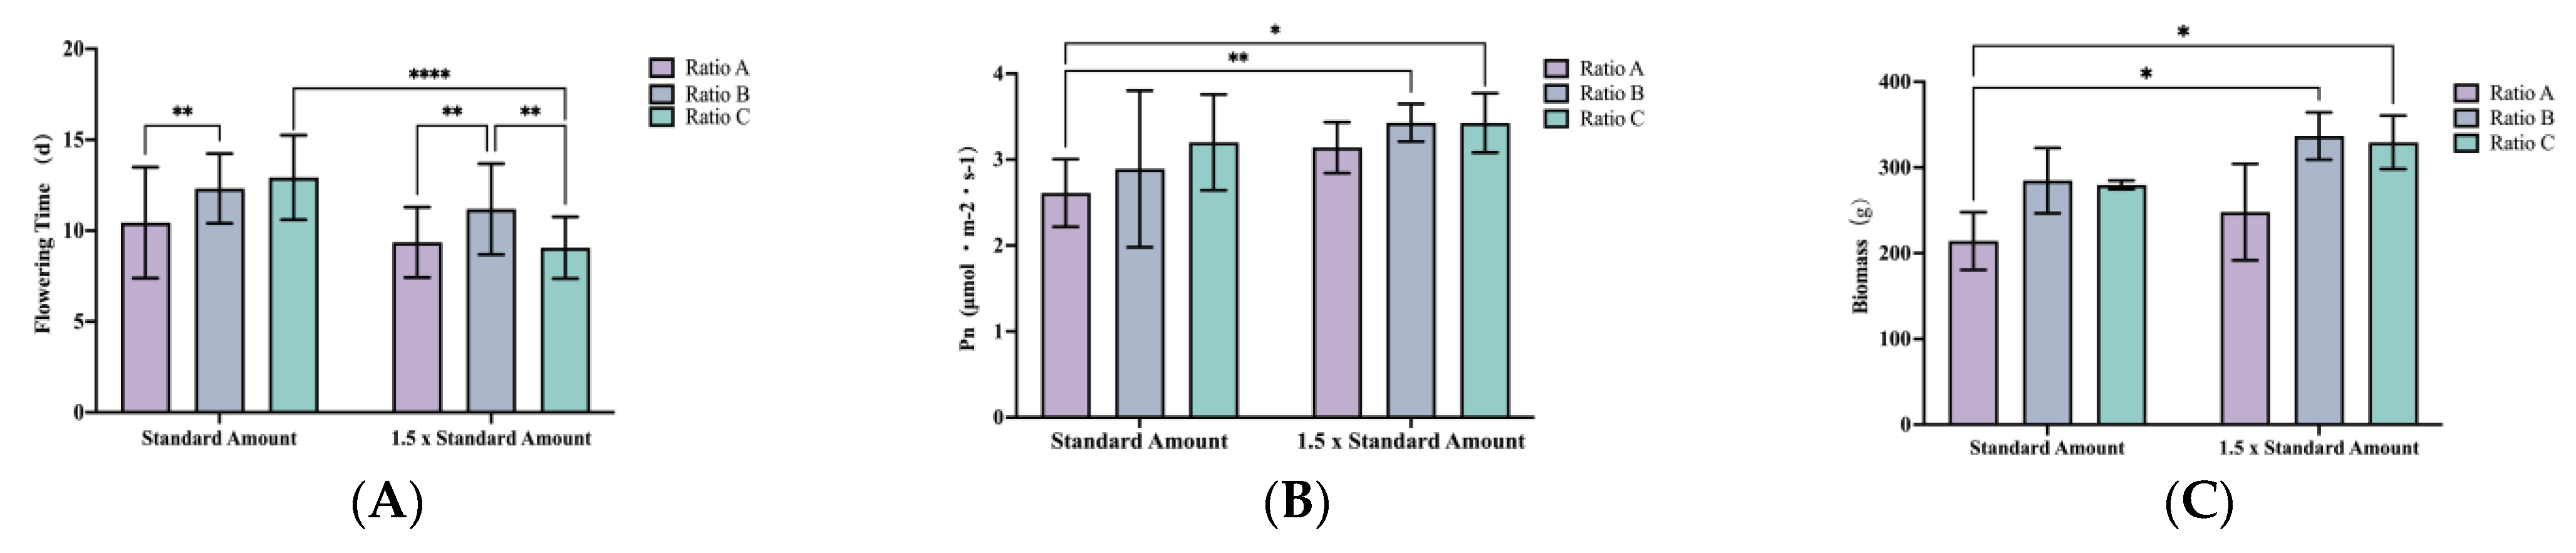
The application of the standard amount yielded the most favorable results in terms of the flowering period. Under the same application amount, both the high nitrogen and potassium (N&K) ratio and the all-high ratio significantly prolonged flowering time. Under both fertilizer application rates, the flowering time under the influence of the high N&K ratio increased by 18.2% (
p = 0.0054) and 19.4% (
p = 0.0098), respectively, compared with the high phosphorus (P) ratio. Under the standard amount, the flowering period under the influence of the all-high ratio was significantly longer than that under the 1.5 × standard amount, increasing by 42.6% (
p < 0.0001) For this parameter, both the application amount and nutrient ratio had significant main effects on the flowering period (
p < 0.0001), and their interaction effect was highly significant (
p = 0.0003), as shown in
Figure 1A.
For the photosynthetic rate (Pn), there was no significant difference between the standard application amount and 1.5 × standard amount. Similarly, no significant difference in Pn was seen between the high N&K ratio and the all-high ratio under the same application amount. However, under the 1.5× application rate, the high N&K and all-high ratios led to increases in Pn of 31.3% (
p = 0.0037) and 31.0% (
p = 0.0136), respectively, when compared with the high P ratio under the standard application. Both the application amount and nutrient ratio had significant main effects on Pn (
p = 0.0011 and
p = 0.0218, respectively), while their interaction effect was not significant (
p = 0.5467), indicating that the influence of each factor on Pn was largely independent (
Figure 1B).
The performance of plant biomass consistently aligned with the results of related indicators during the same period. Biomass exhibited an increasing trend in response to the increments in the application rates. Among equivalent application rates, both the high N&K ratio and the all-high ratios demonstrated significantly greater biomass compared with the high phosphorus ratio, but there was no significant difference between the high N&K ratio and the all-high ratio. Notably, under the 1.5× application rate, the high N&K and all-high ratios resulted in a 57.2% (
p = 0.0112) and 53.8% (
p = 0.0172) increase in biomass, respectively, compared with the high phosphorus ratio under the standard application rate. Both the application amount and nutrient ratio had significant main effects on biomass (
p = 0.0189 and
p = 0.0035, respectively), while their interaction effect was not significant (
p = 0.8889), indicating that the influence of each factor on biomass was largely independent (
Figure 1C).
3.2. Influence of Varying Application Rates and Ratios on the Nutrient Content in Both Plant Tissues and Soil for P. ostii During the Flowering Period
For the nitrogen content measurement, no significant differences were observed in the nitrogen content of leaves among the treatment groups. However, the variation trend in the roots was more pronounced compared with the leaves. Under the same application amount, the nitrogen content in roots under the influence of the all-high ratio (C) was significantly higher than that under the high P ratio (A), with increases of 28.4% (p = 0.0223) and 30.0% (p = 0.0121), respectively. Regarding the soil nitrogen content, at the 1.5 × standard amount, the high N&K ratio (B) resulted in a significantly higher nitrogen content in the soil compared with the high P ratio (A), with an increase of 22.4% (p = 0.0301).
For phosphorus content in the leaves, under the same application amount, the phosphorus content under the influence of the all-high ratio (C) was significantly higher than that under the high N&K ratio (B), with increases of 60.5% (p = 0.0324) and 57.4% (p = 0.0226) at the standard and 1.5 × standard amounts, respectively. However, no significant differences in phosphorus content were observed in the roots among treatment groups. In soil, at the 1.5 × standard amount, the phosphorus content under the high P ratio (A) was significantly higher than that under the high N&K ratio (B), with an increase of 30.4% (p = 0.0032).
Regarding potassium content in the leaves, under the standard amount, the potassium content under the influence of the all-high ratio (C) was significantly higher than that under the high P ratio (A), with an increase of 22.6% (
p = 0.0456). In roots, under the standard amount, both the high N&K ratio (B) and the all-high ratio (C) resulted in significantly higher potassium content compared with the high P ratio (A), with increases of 66.7% (
p = 0.0473) and 70.4% (
p = 0.0348), respectively (
Table 2).
Across all three sample types, the results indicated a general trend of increasing element content with higher application amounts. No significant differences were observed within the same ratio across different application amounts, suggesting that the standard amount was sufficient to achieve optimal growth at this stage. However, no significant interaction effects between the application amount and ratio were detected, and this issue will be further discussed in the discussion section.
3.3. Influence of Different Application Amounts and Ratios on the Growth and Development of P. ostii from the Post-Flowering Period to the Seed Ripening Period
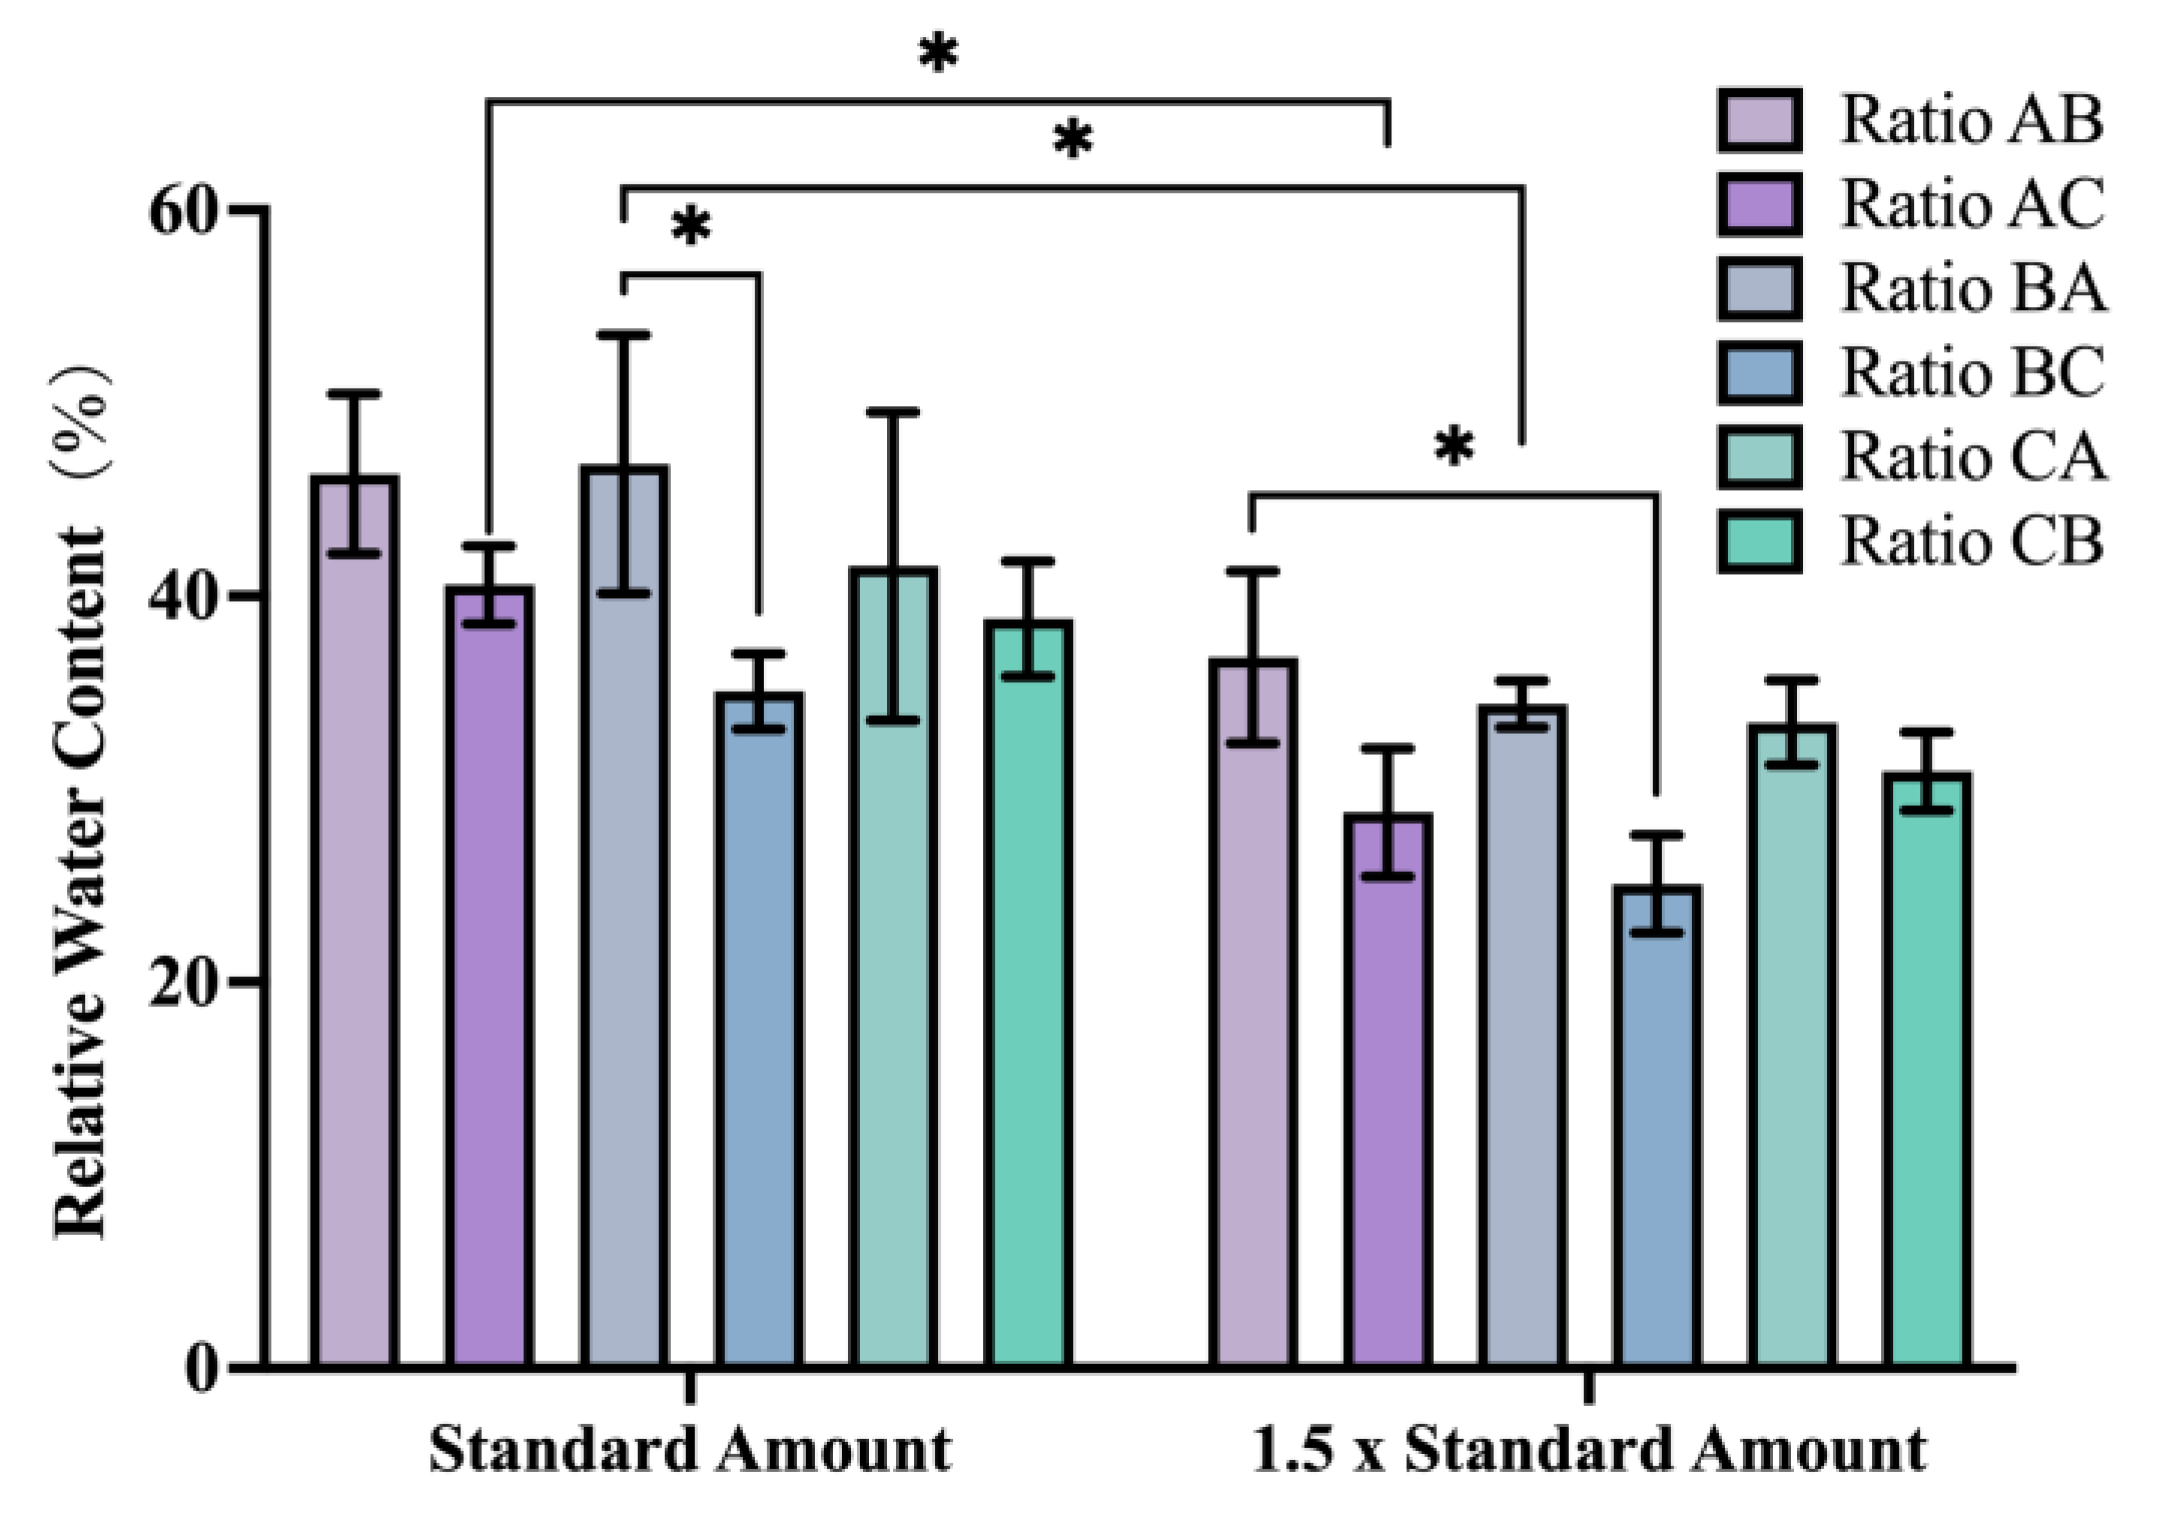
After the flowering period, a second nutrient supplement was administered to
P. ostii employing a distinct nutrient ratio different from the initial application within the same experimental treatment group. Subsequent measurements of the leaf relative water content (RWC) revealed a decline in RWC with increasing application rates. Notably, at the 1.5 × standard amount, the RWC reached its lowest level at 31.5%. Among the treatments receiving the 1.5 × standard amount, those with the all-high ratio application (i.e., the Ratio AC and BC treatment groups) displayed significantly lower RWC values of 28.7 and 25.1%, respectively (
Figure 2). During subsequent growth, plants in the 1.5 × application amount group experienced complete seedling burn, ultimately resulting in total plant mortality.
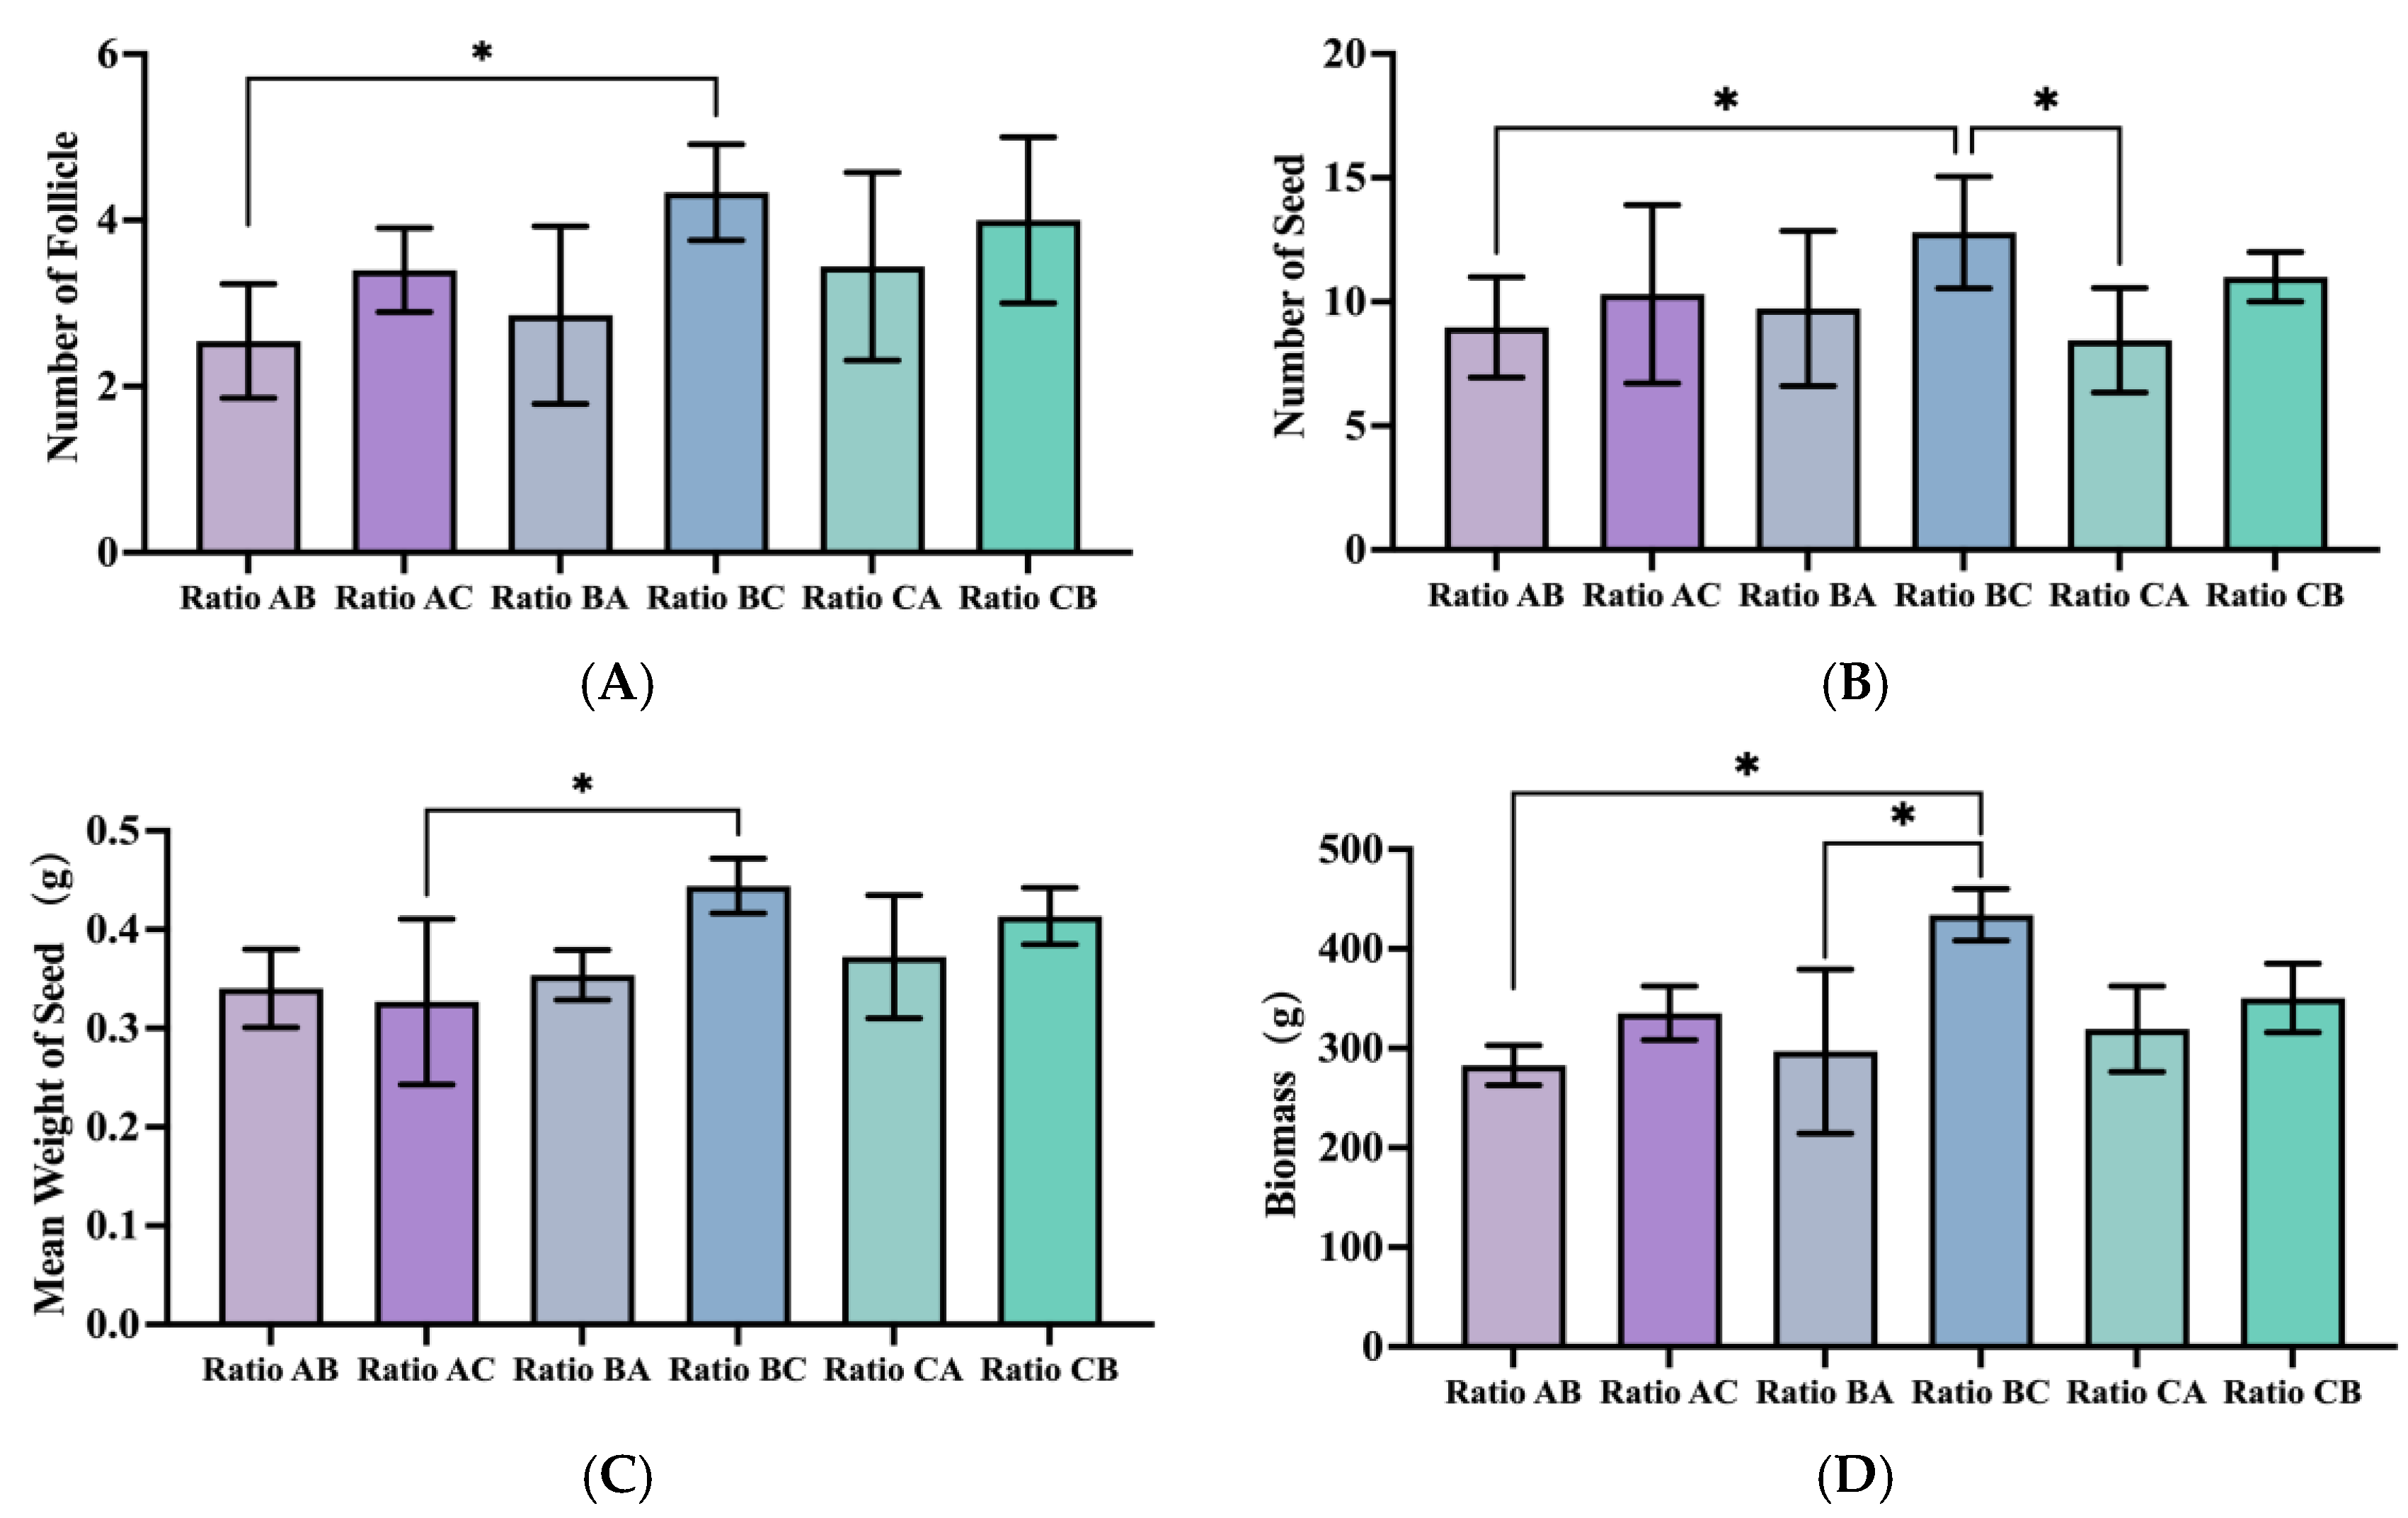
During this period, the treatment groups administered the C ratio (all-high ratio) generally yielded a higher number of follicles. Notably, the combination of applying the B ratio (high N&K ratio) during the germination period and the C ratio during this period (i.e., the BC treatment) resulted in a significantly greater quantity of follicles compared with the combination of applying the A ratio (high P ratio) during the germination period and the B ratio during this period, with an increase of up to 70.4% (
p = 0.0195) (
Figure 3A).
For indicators such as the average seed number, seed weight, and biomass, the results were consistent with those of the previous indices. Treatment groups that applied the C ratio during this period again demonstrated superior performance. Among these, the combination of applying the high N&K ratio (B ratio) during the germination period and the C ratio during this period (i.e., the BC treatment) achieved the best performance across all the aforementioned indicators. Gas chromatography–mass spectrometry (GC-MS) was employed to determine the fatty acid (FA) composition of seeds subjected to varying application amounts and ratios. To specifically characterize the nutritional quality of seeds, gas chromatography–mass spectrometry (GC-MS) was also employed to quantify unsaturated fatty acid (UFA) profiles of seeds subjected to varying application amounts and ratios. The quantitative analysis showed no significant differences in the total UFA content across treatments (
Figure S1), with all groups maintaining stable levels averaging 51.85 mg/g.
3.4. Influence of Different Ratios on the Nutrient Composition of P. ostii Tissues and Soil from the Post-Flowering Period to the Seed Ripening Period
During this growth stage, the nitrogen and potassium content measurements across various samples exhibited comparable patterns. Notably, treatment groups that received either the high N&K ratio or all-high ratio during the bud sprouting period exhibited enhanced elemental accumulation, particularly in combinations such as BC, CA, and CB.
For phosphorus content, the trend of phosphorus content in each sample was more pronounced. The better-performing treatment groups were those that applied the all-high ratio (C ratio) or high P ratio (A ratio) during this period, specifically the BC, CA, and AC combinations (
Table 3).
3.5. Effects of Different Ratios on P. ostii During Its Dormancy Period
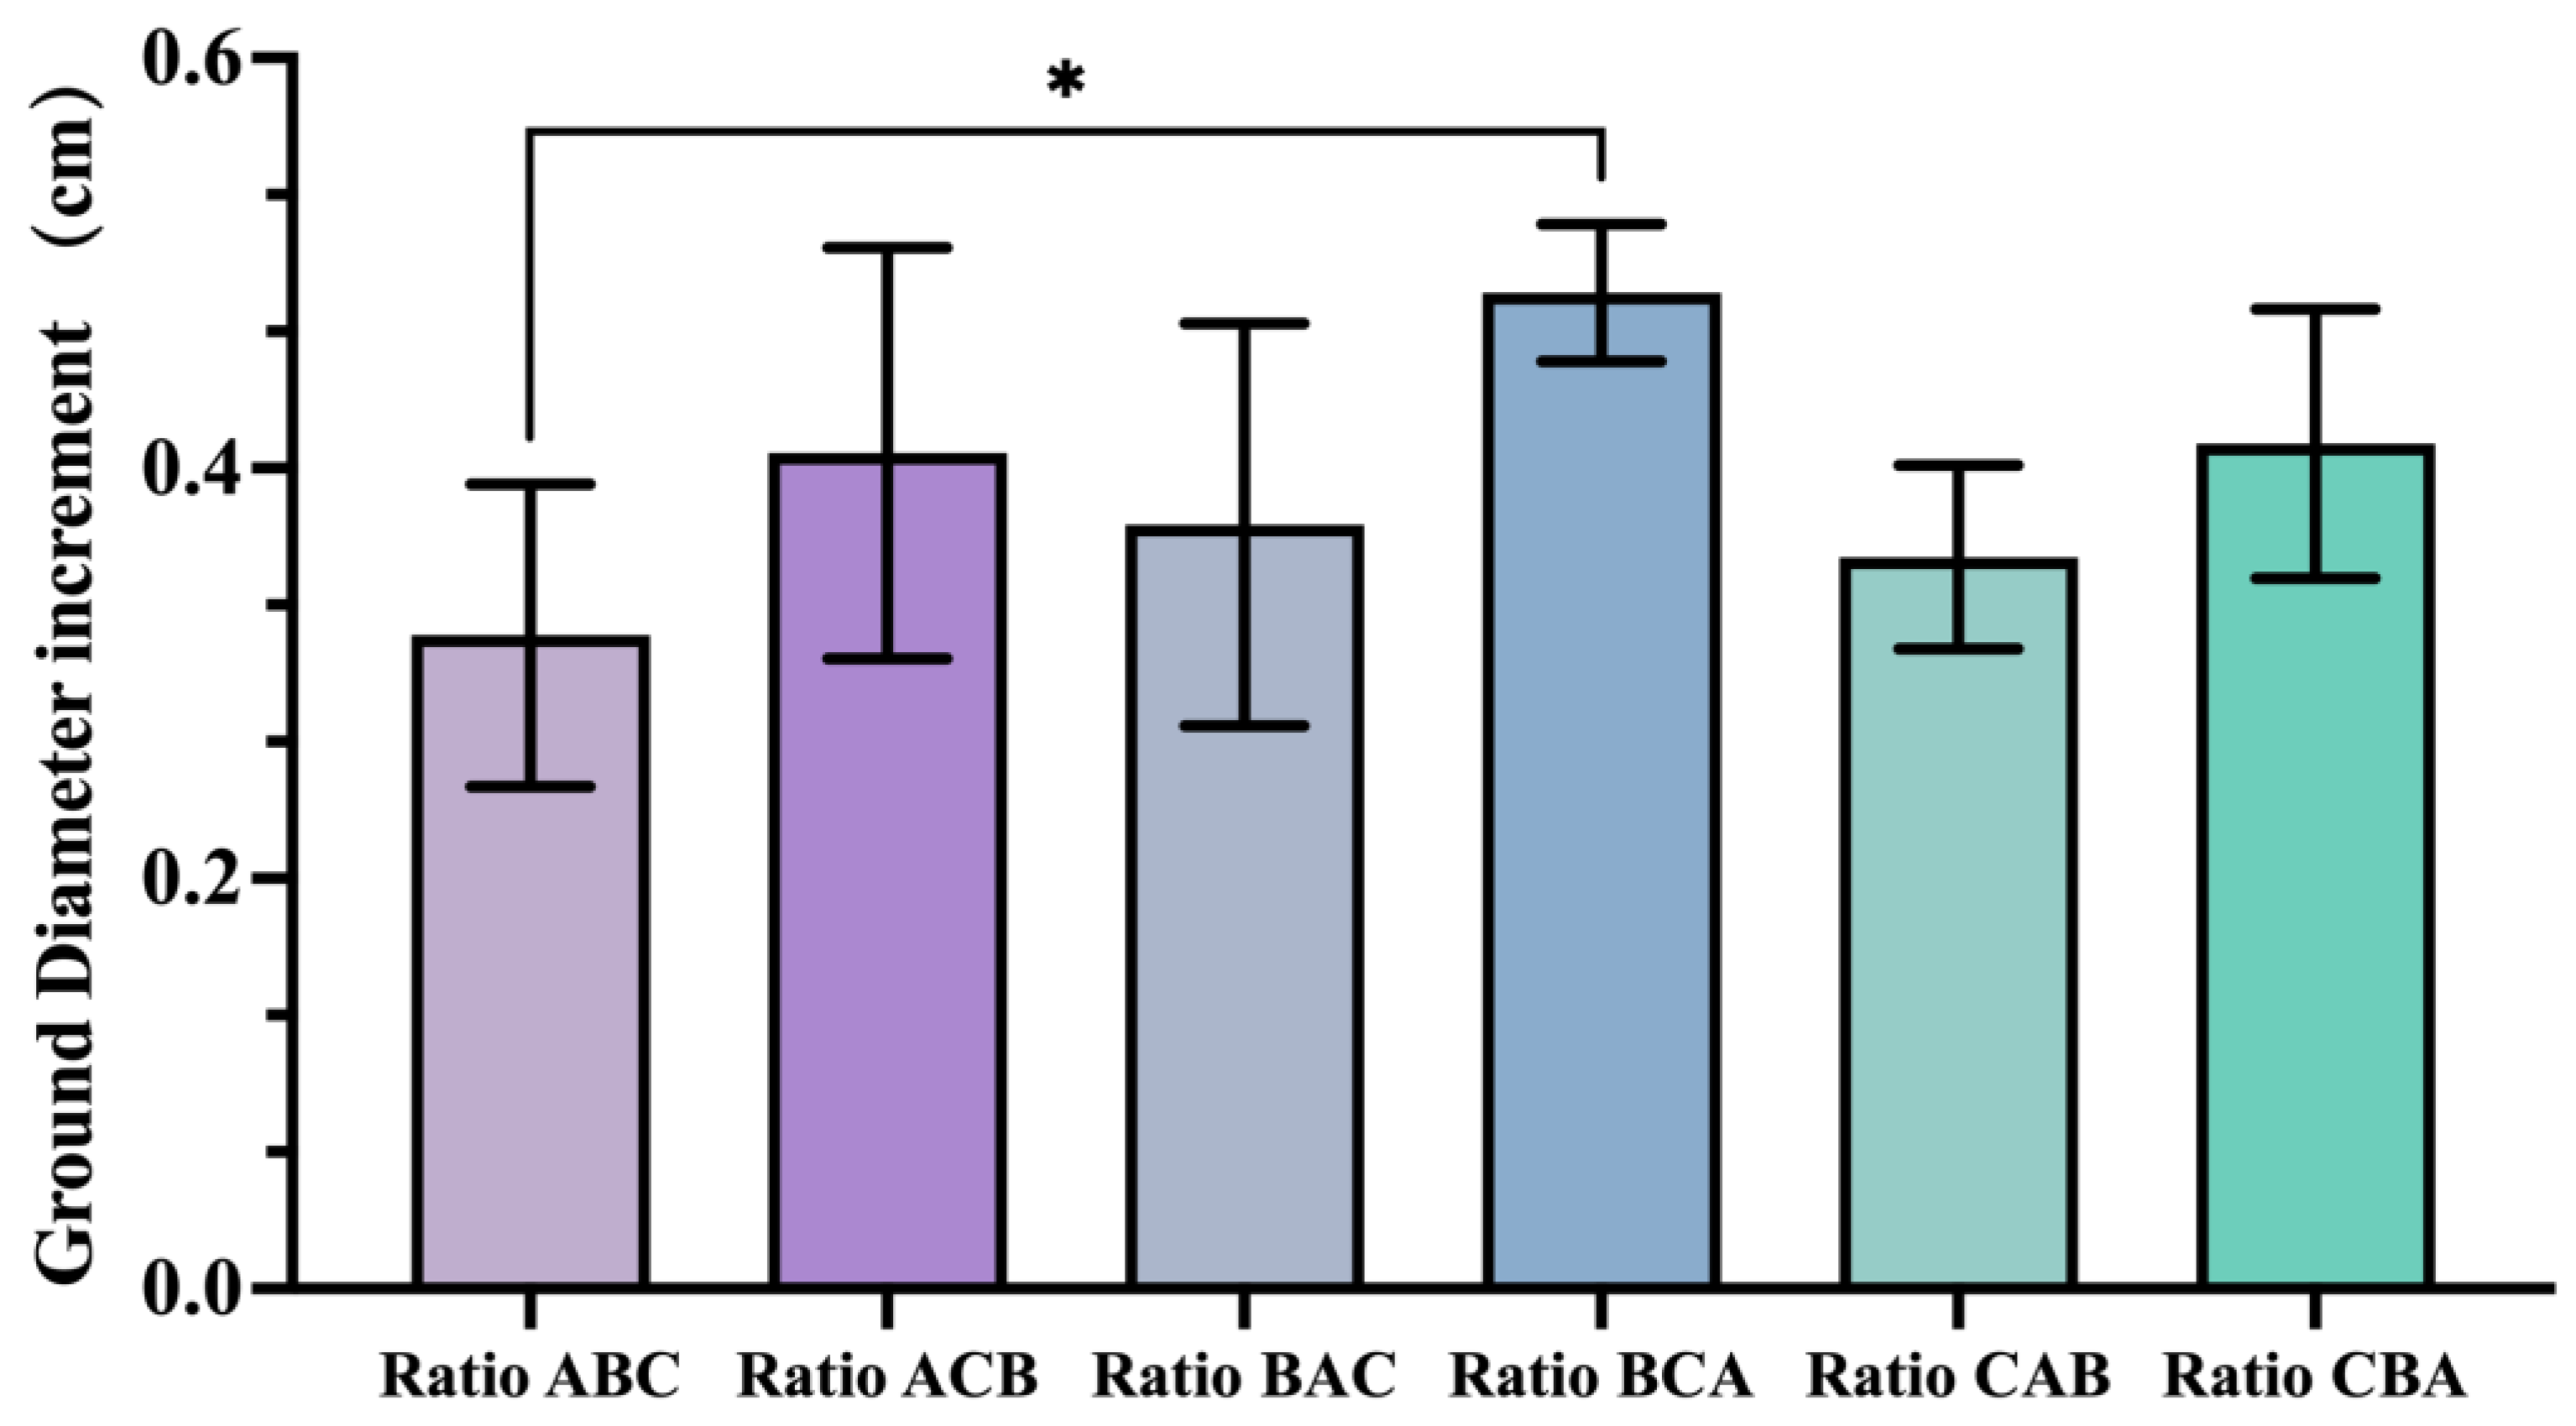
After completing the seed harvest, a third nutrient supplementation for
P. ostii was conducted, specifically targeting the dormancy period. A distinct nutrient ratio was applied to the same experimental treatment groups compared with the previous two occasions. The increase in the ground diameter of tree peonies during the dormant phase was measured by subtracting the initial ground diameter from that after one year of growth. The ground diameter showed significant variations among different treatment groups. The largest increase in ground diameter (0.48 cm) was observed in the treatment group that applied the high N&K ratio (B ratio) during the bud sprouting period, followed by the all-high ratio (C ratio) during the post-flowering period, and finally the high P ratio (A ratio) during the dormancy phase (i.e., the BCA ratio combination). This increase was significantly higher (by 52.5%,
p = 0.0431) compared with the treatment group that applied the A ratio, B ratio, and C ratio sequentially during the three respective periods (i.e., the ABC ratio combination) (
Figure 4).
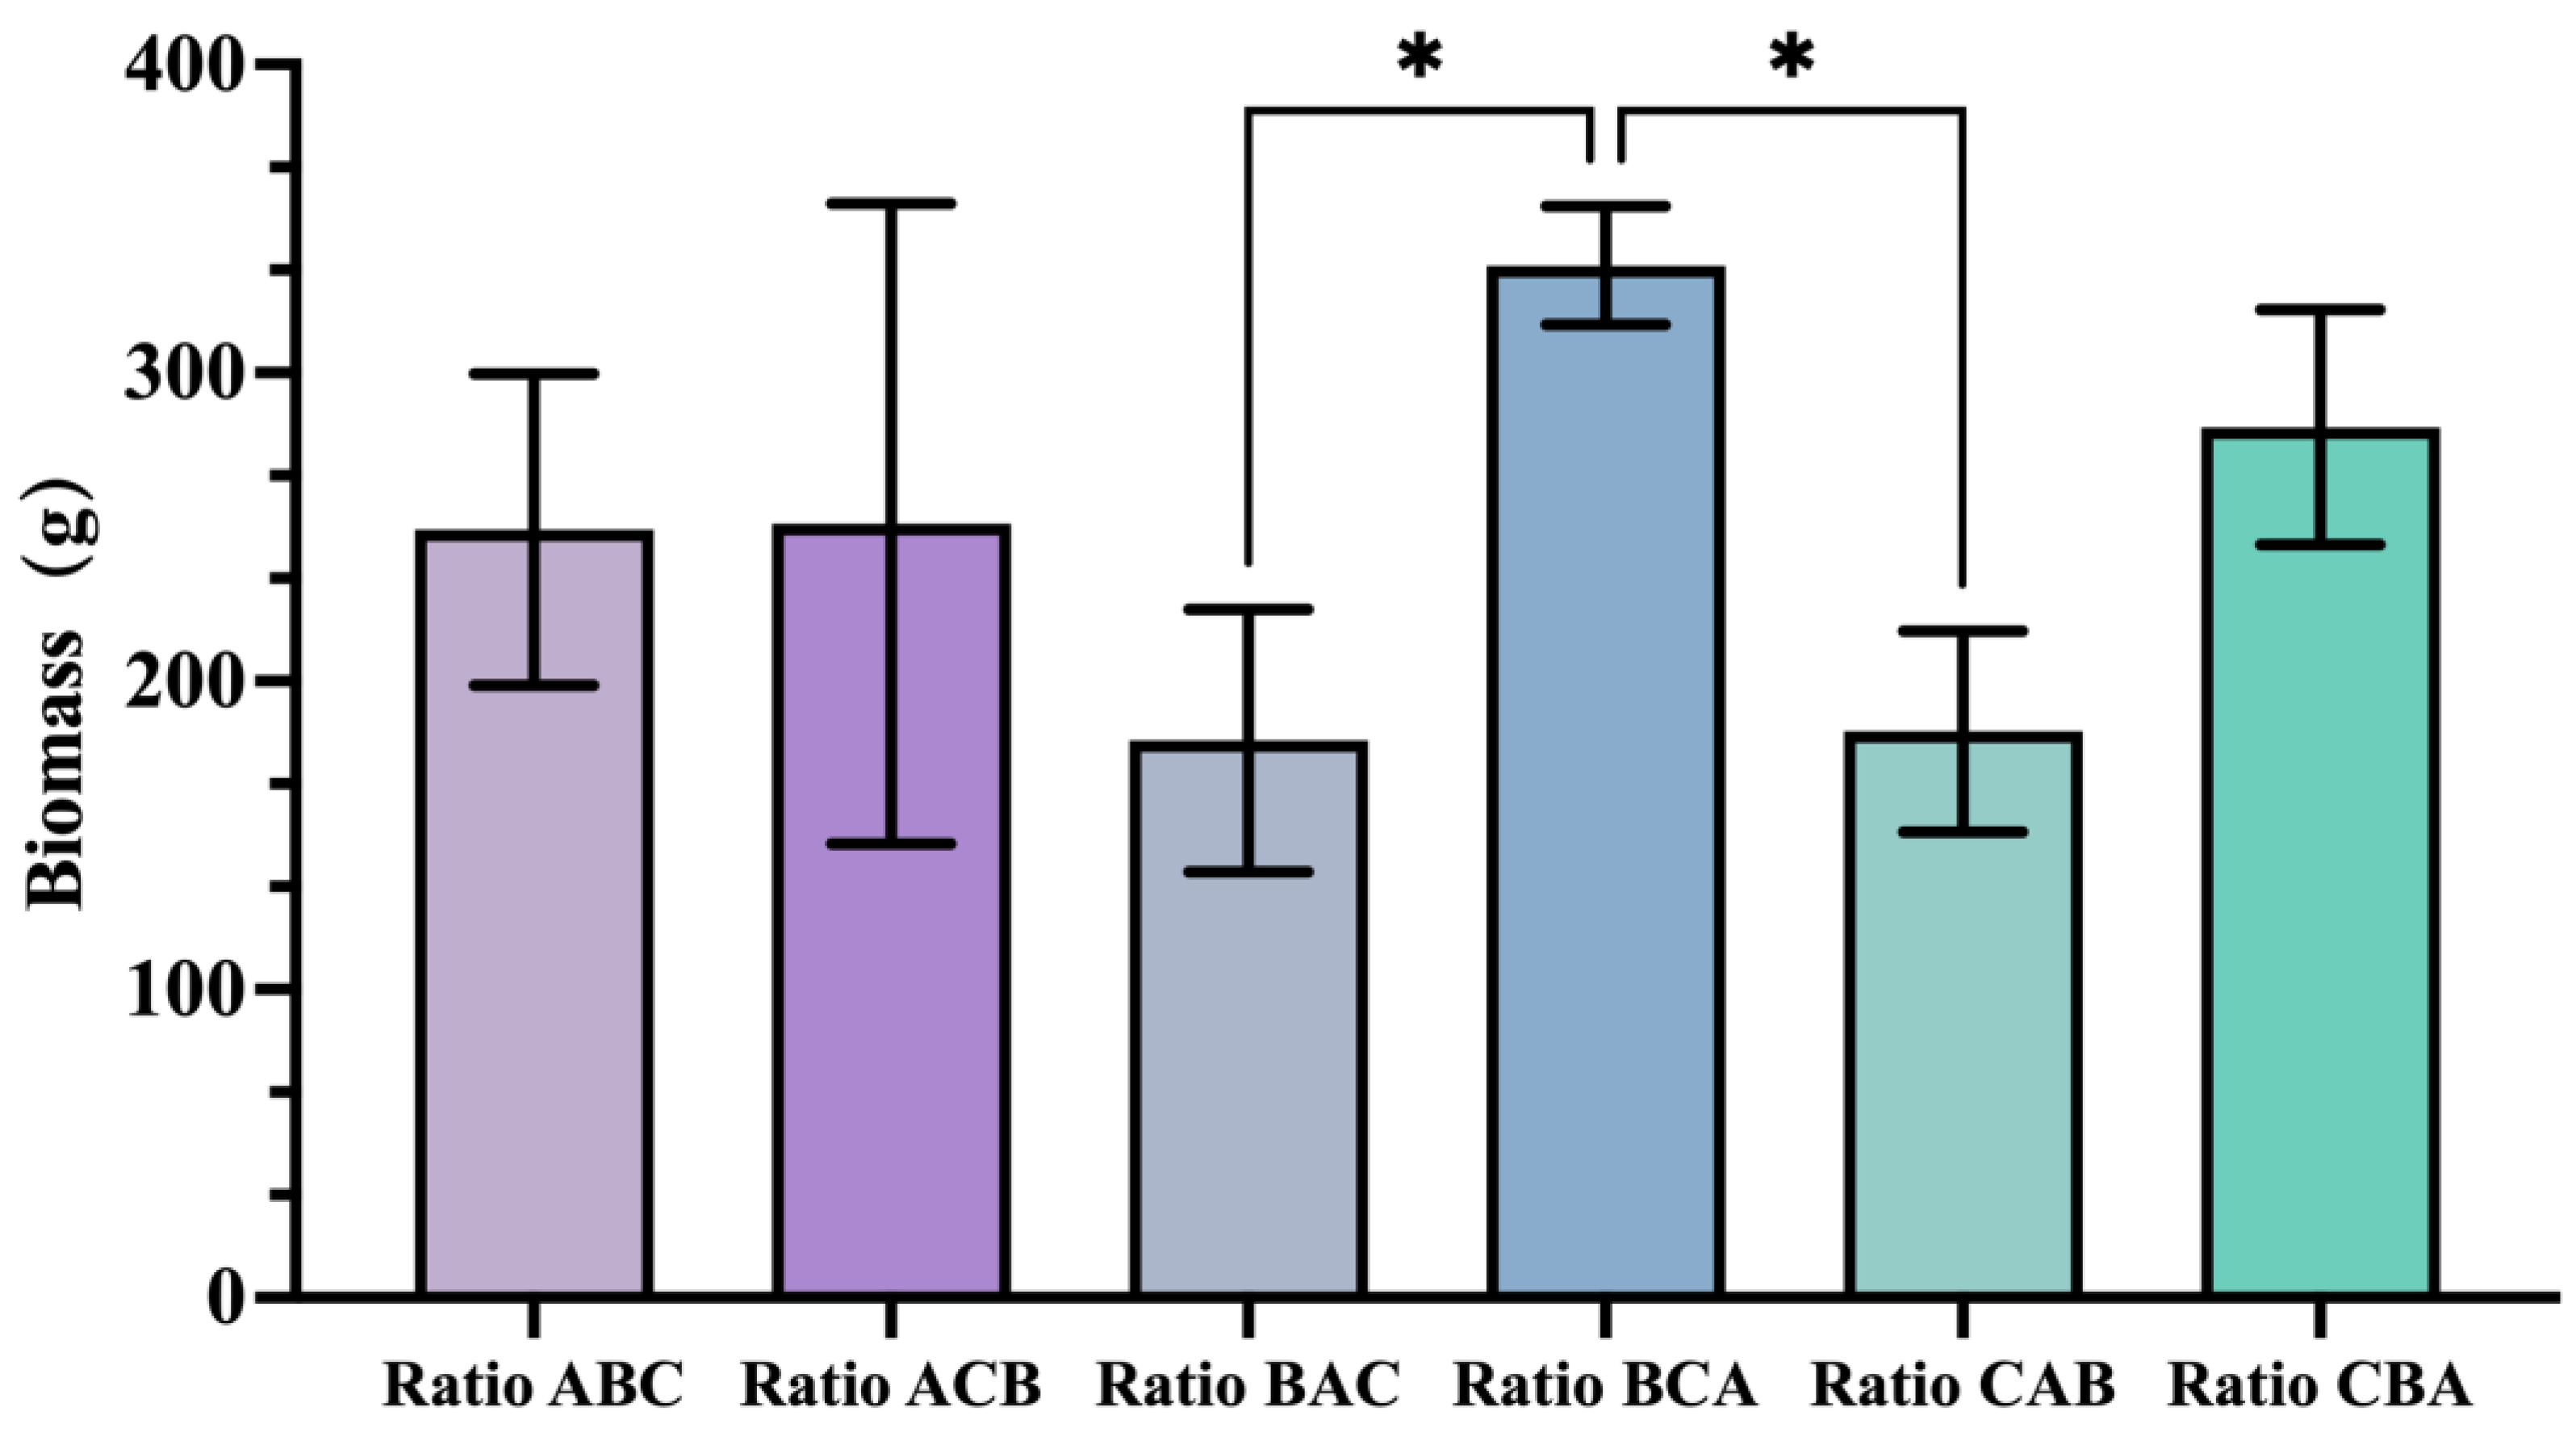
In the biomass indicators measured during the dormancy period, the results were similar to those of the ground diameter indicators. The treatment group that applied the high N&K ratio (B ratio) during the bud sprouting period, followed by the all-high ratio (C ratio) during the post-flowering period and finally the high P ratio (A ratio) during the dormancy period (i.e., the BCA ratio combination) produced the highest biomass, reaching 334.8 g. (
Figure 5).
4. Discussion
P. ostii has varying nutrient requirements during different growth stages, and the quantity of fertilizer and the element ratio play crucial roles in influencing its growth and development [
16,
17,
18].
Throughout the growth cycle, increasing fertilizer amounts generally enhanced various growth traits. During the flowering period, both standard and higher levels of fertilizer application promoted various traits of
P. ostii, without significant differences between the two quantities. However, from the post-flowering to the fruit ripening period, applying 1.5 times the standard amount of fertilizer resulted in root burning, indicating a threshold beyond which additional nutrients become detrimental; this suggests that excessive nutrient input may have exceeded the physiological tolerance threshold of the species, leading to irreversible stress responses. One plausible explanation is osmotic stress resulting from elevated salt concentrations in the rhizosphere, which may have hindered water uptake and disrupted cellular homeostasis. Additionally, high nitrogen or potassium inputs might have induced metabolic imbalances, particularly affecting root integrity and function. Furthermore, over-application of fertilizers may have altered soil physicochemical properties such as pH and electrical conductivity, compounding the adverse effects on root health. These findings emphasize the importance of precision nutrient management, especially for Paeonia species known for their sensitivity to environmental changes. Future research should investigate the specific physiological and soil-mediated mechanisms underlying such acute responses, potentially through detailed root histology, ion accumulation profiling, and soil salinity analyses. This outcome clearly underscores that more is not always better in fertilization practices [
19,
20].
By focusing on different ratios using the same application amount, we observed that the high N&K ratio or the all-high ratio during the flowering period yielded significant effects. These two ratios provide ample nutrients, facilitating the transition of tree peonies from vegetative growth to reproductive growth. However, the photosynthetic rate of all plants in our experiment was considerably lower than values previously reported for field-grown
P. ostii, where net photosynthetic rates (Pn) typically range from 10 to 15 μmol·m
−2·s
−1. In contrast, the maximum Pn observed in this pot experiment was only 3.42 μmol·m
−2·s
−1 [
21]. It is well-established that nitrogen, phosphorus, and potassium each play distinct yet interconnected roles in regulating photosynthetic performance. Nitrogen is a key constituent of chlorophyll and enzymes such as Rubisco, directly influencing the carbon assimilation rate [
22,
23]. Phosphorus is involved in ATP and NADPH formation, which are critical for energy transfer in the Calvin cycle, while potassium contributes to stomatal regulation, osmotic adjustment, and the activation of photosynthetic enzymes. Studies in crops such as rice (
Oryza sativa), maize (
Zea mays), and wheat (
Triticum aestivum) have consistently demonstrated that balanced N–P–K fertilization significantly enhances photosynthetic capacity and biomass accumulation [
24]. Thus, it is plausible that the suboptimal photosynthetic rate observed in the current pot trial may also result from non-ideal nutrient uptake and assimilation under confined root environments, in addition to the physical constraints imposed by the containers’ size.
Furthermore, we also observed that there was no significant interaction effect between the fertilization amount and element ratio for most of the indicators. This discrepancy may also be attributed to root domain limitations, which lead to an overall reduction in the photosynthetic rate. Container-grown plants often suffer from limited root expansion, restricting water and nutrient uptake, subsequently constraining photosynthetic activity [
25,
26]. In contrast, field-grown plants benefit from a deeper and more continuous soil profile, which buffers environmental stresses and facilitates higher root-to-shoot ratios, potentially resulting in higher Pn values. The decrease in photosynthetic efficiency and the lack of significant interaction effects between the fertilization amount and element ratio highlight the limitations of pot experiments in fully capturing the photosynthetic potential of
P. ostii, and future work should incorporate field trials to better validate fertilization effects under practical conditions.
Applying the all-high ratio during the post-flowering period resulted in higher seed production due to the elevated phosphorus and potassium contents that promote fruit expansion. This outcome aligns with nutrient preferences observed in crops such as corn during the ripening period [
27]. This study found no significant differences in unsaturated fatty acid (UFA) content among treatments with different fertilization ratios and dosages. This contrasts with previous studies, which reported both significant changes and overall higher total UFA contents, typically in the range of 80–90 mg/g. In the present experiment, the mean UFA content across all groups was only 51.58 mg/g. One possible explanation for this discrepancy is the cultivation method: while prior studies were based on field-grown
P. ostii plants, our experiment was conducted in pots, thereby subjecting the plants to restricted root zones. Such root confinement may limit nutrient uptake and metabolism, ultimately affecting lipid biosynthesis in the seeds. These findings suggest that future studies on nutrient management in oil-use
P. ostii should preferably be carried out under field conditions to better reflect the true agricultural potential of the crop [
28]. During dormancy periods, there is substantial nutrient transfer to the roots and stems for accumulation before subsequent growth cycles [
29]. Simultaneously, dormancy periods are active phases for the development of the tree peony’s root system [
30]. Supplementing phosphorus by applying a high P ratio during this dormant phase significantly enhanced the increment in stem diameter.
While previous studies have primarily focused on determining the appropriate amount of chemical fertilizer to achieve high yields throughout the year [
31,
32], less attention has been given to identifying the optimal nutrient ratio and application quantities for each specific growth and development stage. This study aimed to investigate the entire growth cycle of oil tree peonies, thereby deepening our understanding of the nutrient ratios and quantities that are suitable for promoting oil tree peony’s growth during different periods.
In summary, by sequentially applying standard amounts of the high N&K ratio during the bud development period, the all-high ratio during the post-flowering period, and the high P ratio during the dormancy period of the tree peony’s annual growth cycle, favorable annual effects can be achieved while significantly promoting different stages of growth and development. In daily production, it is essential to reasonably control both the amount and ratio of fertilizer at each nutrient supplementation stage to achieve reduced costs and enhance efficiency, ultimately improving cultivation quality.


 ,
, 
