Article

Comprehensive Genome-Wide Characterization of the GRAS Gene Family and Their Role in Salt Stress Tolerance in Punica granatum L.

1
Co-Innovation Center for Sustainable Forestry in Southern China, Nanjing Forestry University, Nanjing 210037, China
2
College of Forestry and Grassland, Nanjing Forestry University, Nanjing 210037, China
*
Authors to whom correspondence should be addressed.
Horticulturae 2025, 11(5), 504; https://doi.org/10.3390/horticulturae11050504
Submission received: 7 April 2025 / Revised: 4 May 2025 / Accepted: 5 May 2025 / Published: 7 May 2025

Abstract

:
The GRAS gene family is broadly distributed in plants and plays key regulatory roles in development, signal transduction, and the adaptation to adverse environments. Pomegranate (Punica granatum L.)—a high-value fruit tree with ecological, economic, health, and ornamental importance—exhibits notable salt tolerance. While GRAS genes have been characterized in various species, their functional roles in pomegranate remain underexplored. In this study, 54 GRAS genes (PgGRAS) were identified in the pomegranate genome and were found to be unevenly distributed across eight chromosomes. Phylogenetic analysis grouped these genes into eight subfamilies, revealing highly similar conserved motifs, functional domains, and gene structures within each group. Notably, the DELLA subfamily is distinguished by a unique DELLA domain. Our findings indicate that the expansion of GRAS genes in pomegranate may be linked to fragment duplication events, and many PgGRAS genes contain both phytohormone- and stress-responsive cis-elements. Under 200 mM NaCl treatment, the expression of two DELLA genes was markedly upregulated. Therefore, PgGRAS24 was selected as a candidate gene for stable expression in Arabidopsis to further verify the role of DELLA family members in plant salt tolerance. Overall, this study provides new insights into the molecular functions of the GRAS gene family in pomegranate, gives insights into their role in salt stress tolerance, and lays a theoretical foundation for developing salt-tolerant pomegranate varieties.

1. Introduction

GRAS transcription factors are a group of transcriptional regulators widely found in higher plants, where they play critical roles in plant growth, development, and responses to biotic and abiotic stresses [1,2,3]. The name “GRAS” originates from three proteins first discovered in this family: GAI, RGA, and SCR [4,5]. Typical GRAS proteins range from approximately 400 to 770 amino acids in length and are characterized by highly conserved C-terminal (carboxyl-terminal) regions and variable N-terminal (amino-terminal) regions [6,7]. Within the C-terminal region, five motifs—LHR I (Leucine Heptad Repeat I), VHIID, LHR II (Leucine Heptad Repeat II), PFYRE, and SAW—collectively form the GRAS domain and are key to protein–protein interactions [8]. Among these motifs, VHIID is found in all GRAS proteins and, together with LHR I and LHR II, constitutes the core structure of the GRAS family, playing an essential role in protein interaction networks [9]. In contrast to the conserved C-terminus, the N-terminus varies substantially and can bind different target proteins, enabling diverse signaling functions [10]. Despite this variability, some GRAS proteins retain two conserved N-terminal structures—the DELLA domain and the TVHYNP domain—which are closely tied to gibberellin (GA) signaling and significantly influence plant growth and development [1].
Early investigations identified 33 and 57 GRAS family members in Arabidopsis and rice, respectively, and classified them into nine subfamilies: PAT1, SCL4/7, DELLA, SCR, HAM, SHR, LAS, LISCL, and SCL3 [11]. Among these, DELLA acts as a negative regulator of GA signaling, inhibiting GA function through DELLA accumulation and thereby controlling plant growth and development [12]. PAT1 is a critical intermediate in the phyA signaling pathway, mediating the transfer of light signals from photoreceptors to downstream targets [13]. The SCL3 and DELLA subfamilies function antagonistically to maintain GA homeostasis, regulating the expression of genes tied to root development and thus promoting root differentiation and growth [14,15]. Meanwhile, SCR interacts with SHR to control leaf growth and vascular sheath cell formation, playing a pivotal role in root vascular bundle formation [16].
To date, the GRAS gene family has been extensively analyzed in various plant species, with many studies showing that GRAS transcription factors respond to diverse environmental stresses. For instance, overexpression of AtSCL28 notably affects root growth in Arabidopsis thaliana [17]. In rice, OsGRAS39 is significantly induced under NaCl and ABA treatments [18]. Several GRAS members in oat and cassava respond to salt, drought, and low-temperature stresses [19,20]. DELLA genes in blueberry (Vaccinium spp.) participate in developmental processes, hormonal regulation, and stress responses, displaying differential expression across tissues under stress treatments [21]. Overexpressing PeSCL7 from poplar enhances drought and salt tolerance in Arabidopsis thaliana [22]. BpGRAS34 in Betula alba positively influences salt tolerance by modulating hormonal pathways, stress responses, and antioxidant enzymes [23]. Investigating how GRAS proteins regulate signaling pathways and critical gene expression under stress conditions is therefore essential for understanding the molecular mechanisms plants use to cope with environmental challenges and for facilitating the development of improved cultivars.
Pomegranate (Punica granatum L.) is a deciduous tree or shrub belonging to the genus Punica within the family Lythraceae [24]. This high-value fruit crop offers cultural, ecological, economic, health, and ornamental benefits [25,26]. It also exhibits notable salt tolerance, making it a prevalent choice for cultivation in arid and semi-arid regions [27]. As a typical perennial deciduous fruit tree, elucidating its stress response mechanisms is of significant scientific and practical interest. Based on previous studies on the regulatory roles of GRAS transcription factors in response to salt stress, as well as transcriptome analysis of pomegranate, we hypothesize that the GRAS gene family in pomegranate may be closely associated with salt tolerance and functions through the regulation of signaling pathways. Therefore, this study conducted a comprehensive investigation of the GRAS transcription factor family and analyzed its expression under salt stress, aiming to further explore the molecular mechanisms underlying salt tolerance in pomegranate.
Here, we aim to systematically identify and characterize the PgGRAS gene family in pomegranate, with a particular focus on elucidating their regulatory functions in salt stress responses. Through bioinformatics approaches, we investigated the family’s genomic distribution, physicochemical properties, evolutionary relationships, exon–intron structures, conserved domains, motifs, chromosomal mapping, and promoter cis-acting elements. We also examined the expression profiles of 12 PgGRAS genes, each from different subfamilies, under salt stress using qRT-PCR, and gave insights into the salt tolerance function of PgGRAS24 through stable expression in Arabidopsis. These findings lay a theoretical foundation for a deeper exploration of the evolution and biological functions of the pomegranate GRAS gene family while also advancing our understanding of pomegranate’s molecular response to salt stress.

2. Materials and Methods

2.1. Genome-Wide Identification of GRAS in Pomegranate

The complete pomegranate genome sequence, along with its gene and protein annotations, was obtained from NCBI (http://www.ncbi.nlm.nih.gov/, accessed on 31 May 2024). Arabidopsis GRAS protein sequences were retrieved from TAIR (https://www.Arabidopsis.org/, accessed on 31 May 2024). First, a BLAST 2.13.0 [28] (https://blast.ncbi.nlm.nih.gov, accessed on 1 June 2024) search against the pomegranate proteome was performed using Arabidopsis GRAS sequences as queries, with the E-value threshold set to 1 × 10⁻⁵. Next, the HMM file (PF03514) for GRAS proteins was downloaded from Pfam (http://pfam.xfam.org/family/PF02365/, accessed on 1 June 2024), and HMMER [29] (http://hmmer.org/, accessed on 1 June 2024) was used to identify GRAS domains in the pomegranate genome, with the HMMER threshold set to 1 × 10⁻². Candidate protein members obtained via these two approaches were cross-referenced and de-duplicated, and their protein sequences were extracted. The presence of GRAS domains was then confirmed with NCBI-CDD (http://www.ncbi.nlm.nih.gov/cdd/, accessed on 1 June 2024) and SMART (http://smart.embl-heidelberg.de, accessed on 1 June 2024). Any artificial sequences lacking complete GRAS domains were removed. In total, 54 GRAS genes were identified, and each PgGRAS family member was renamed based on its Gene ID.

2.2. Phylogenetic Analysis of PgGRAS Gene Family Members

Multiple sequence alignment of PgGRAS and AtGRAS proteins was conducted using Clustal W 2.1 [30]. Based on the alignment, a maximum likelihood (ML) phylogenetic tree was constructed in MEGA 11.0 [31] (http://megasoftware.net/, accessed on 2 June 2024), with bootstrap replicates set to 1000. The resulting tree was annotated and visualized with iTOL v3.0 [32] (https://itol.embl.de/, accessed on 2 June 2024).

2.3. Conserved Motifs, Structural Domains, and Gene Structure Analysis of PgGRAS

Conserved motifs of PgGRAS proteins were identified with the MEME online tool 5.4.1 [33] (http://meme-suite.org/tools/meme, accessed on 3 June 2024). Structural domains were predicted through the NCBI Conserved Domain Search (https://www.ncbi.nlm.nih.gov/Structure/bwrpsb/bwrpsb.cgi/, accessed on 3 June 2024). Gene annotation information for the pomegranate genome was extracted using TBtools 2.202 [34], and gene structure was analyzed with GSDS [35] (http://gsds.gao-lab.org/, accessed on 3 June 2024). Multiple sequence alignments of pomegranate and Arabidopsis target sequences were carried out in DNAMAN 9.0. The results of protein motif identification, structural domain analysis, and gene structure visualization were generated in TBtools, and figures were finalized in Photoshop 2020.

2.4. Cis-Regulatory Elements Analysis of the PgGRAS Promoter

Using TBtools, a 2000 bp sequence upstream of each PgGRAS gene (5′ flanking region) was extracted. These sequences were then submitted to PlantCARE [36] (http://bioinformatics.psb.ugent.be/webtools/plantcare/html/, accessed on 5 June 2024) to identify cis-regulatory elements. The results were visualized in TBtools.

2.5. PgGRAS Chromosome Distribution and Collinearity Analysis

Based on the pomegranate genome annotation file, the chromosomal positions of PgGRAS genes were determined and visualized using TBtools. The Vitis vinifera genome and corresponding gene annotation files were obtained from NCBI (http://www.ncbi.nlm.nih.gov/, accessed on 6 June 2024). Gene duplication events in the pomegranate GRAS gene family were identified with MCScanX [37], and further interspecies collinearity analyses were performed with Arabidopsis thaliana and Vitis vinifera. Finally, both intra- and interspecies collinearity maps were generated, and Ka/Ks ratios were calculated to assess gene duplication events.

2.6. Plant Materials and Salt Stress Treatment

One-year-old “Tunisian” pomegranate seedlings (known for their stress resistance and adaptability) were sourced from Xingyang, Henan, and transplanted on 16 March 2024 into pots measuring 30 cm × 24 cm. The potting mix comprised perlite, charcoal, and fine sand in a 1:1:1 ratio. Seedlings were maintained in an artificial climate chamber at Nanjing Forestry University under a 16 h light/8 h dark cycle, 8000 lux illumination, approximately 70% relative humidity, and a constant temperature of 25 °C. They were watered every seven days with half-strength Hoagland’s nutrient solution.
After one month of acclimatization, uniformly growing seedlings were randomly assigned into three groups (15 plants per group, with five plants per biological replicate). Sodium chloride (NaCl) was dissolved in water to prepare a 200 mM NaCl solution for irrigating seedlings, with 500 mL of the salt solution applied to each plant. Root samples were collected at 0 (CK), 3, 6, 12, 24, and 48 h after treatment, immediately frozen in liquid nitrogen, and stored at −80 °C for subsequent analyses.

2.7. Cloning of Target Genes and Construction of Expression Vectors

Total RNA was extracted from pomegranate roots using the RNAprep Pure Plant Plus Kit (Tiangen, Beijing, China). The RNA quality and concentration were verified via 1% agarose gel electrophoresis and UV-Vis spectrophotometry, respectively.
Subsequently, first-strand cDNA was synthesized from total RNA using a cDNA Synthesis Kit (Sparkjade, Qingdao, Shandong, China) via a two-step method. First, the RNA template was denatured at 65 °C for 5 min, then we used the denatured RNA as a template to amplify and synthesize cDNA through PCR. Upon completion of the reaction, it was transferred to ice. Target gene primers were designed in SnapGene 6.0.2 (Table S1) and synthesized by Beijing Tsingke Biotech Company (Beijing, China). Using the synthesized pomegranate cDNA as a template, Add to the PCR tube in the following order: 10 µL of 2× Rapid Taq Master Mix, 1 µL of cDNA, 0.5 µL each of forward and reverse primers, and 8 µL of ddH2O. The PCR protocol consisted of initial denaturation at 95 °C for 5 min; followed by 34 cycles of 95 °C for 15 s, 54 °C for 20 s, 72 °C for 30 s; and a final extension at 72 °C for 5 min. Amplicons were separated by agarose gel electrophoresis, and the corresponding bands were excised and purified using a Gel Recovery Kit (Tsingke, Nanjing, China), store at −20 °C for future use.
We conducted double restriction enzyme digestion of the pBI121-GFP circular plasmid with Xba I and BamH I restriction enzymes. The restriction digestion protocol was as follows: 37 °C for 50 min; 85 °C for 20 min. The purified PCR products were ligated into the pBI121 linearized vector using the Seamless Cloning Kit (Accurate, Changsha, China). The resulting recombinant plasmid pBI121-GFP-PgGRAS24 was transformed into E. coli DH5α cells via heat shock, spread on LB plates containing kanamycin, and incubated at 37 °C for 12–16 h. We pre-prepared the PCR master mix: 10 µL of 2× Rapid Taq Master Mix, 1 µL each of forward and reverse primers (Table S1), and 8 µL of ddH2O. We picked a single colony from the LB plate and added it into the premixed solution. Then, we resuspended the bacterial liquid by repeated pipetting and placed it in PCR machine. The PCR protocol consisted of initial denaturation at 95 °C for 5 min, followed by 34 cycles of 95 °C for 30 s, 55 °C for 30 s, 72 °C for 30 s, and a final extension at 72 °C for 5 min. After the reaction, we analyzed the PCR products by 1% agarose gel electrophoresis to verify whether the bands are correct. Colonies were picked with correct-sized bands and they were inoculated into LB broth for shaking the fungal culture. Subsequently, we used the SteadyPure Plasmid DNA Extraction Kit (Accurate, Changsha) to extract the plasmid and sent it to Beijing Tsingke Biotech Company for sequencing. Sequencing data were analyzed with SnapGene 6.0.2 software. The sequencing results showed that the PgGRAS24 fragment was 1809 bp in length, encoding 603 amino acids, which was completely consistent with the reference sequence. Finally, we obtained the fusion vector pBI121-PgGRAS24.

2.8. qRT-PCR Analysis

Total RNA from pomegranate was reverse-transcribed into cDNA using the Evo M-MLV Reverse Transcription Kit (Accurate, Nanjing, China). Gene-specific primers were designed with Primer 5.0 and synthesized by Beijing Tsingke Biotech Company. Quantitative real-time PCR (qRT-PCR) was carried out on a Bio-Rad CFX Connect Real-Time PCR Detection System. Each 20 µL reaction contained 10 µL of 2× SYBR Green Pro Taq HS Premix (Accurate, Nanjing, China), 0.8 µL of each forward and reverse primer (Table S1), 2 µL of cDNA template, and 6.4 µL of double-distilled water. The cycling protocol was as follows: initial denaturation at 95 °C for 30 s, followed by 40 cycles of 95 °C for 5 s and 60 °C for 30 s. PgActin (Gene ID: OWM65733.1) served as the internal reference genes for pomegranate and tobacco, respectively. Each treatment was conducted using three biological replicates and three technical replicates, and relative gene expression levels were calculated using the 2(−ΔΔCt) method.

2.9. Stable Genetic Transformation in Arabidopsis thaliana

The verified recombinant plasmid was introduced into Agrobacterium tumefaciens strain GV3101 (Tsingke, Nanjing, China) via the freeze–thaw method. Glycerol-preserved Agrobacterium was streaked on LB plates containing 50 μg/mL kanamycin and incubated upside down at 28 °C for two days. A single colony was inoculated into liquid LB medium (containing kanamycin) and cultured at 28 °C until the bacterial suspension reached an OD600 of ~0.8. Cells were harvested by centrifugation at 4000 rpm, and the pellet was resuspended in transformation buffer (10 mL ddH2O, 5 g sucrose, and 50 μL Silwet L-77). Subsequently, the inflorescences of Arabidopsis were immersed in the transformation buffer for approximately one minute, followed by incubation in the dark for 1 day before being transferred to a growth chamber under light conditions. A second round of infection was performed seven days after the first, and the infection process was repeated three times in total. Transgenic lines were selected based on kanamycin resistance screening and semi-quantitative analysis. Seeds from positively identified seedlings were collected and subjected to further screening and cultivation, with the process repeated until T3 generation plants were obtained.

2.10. Physiological Measurements of Transgenic Arabidopsis Under Salt Stress

Seeds of both wild-type and PgGRAS24 overexpressing Arabidopsis were surface-sterilized and sown on 1/2 MS medium supplemented with 0 mM and 200 mM NaCl, and then cultured in a growth chamber under controlled conditions, and then placed them in a growth chamber under controlled conditions of a 16 h light/8 h dark photoperiod and 50–70% relative humidity for cultivation. After ten days of growth, the root lengths of transgenic and wild-type plants grown on MS solid media with different NaCl concentrations were measured and recorded. In addition, transgenic and wild-type Arabidopsis were evenly sown in soil substrate, and seedlings were transplanted at the four-leaf stage. After approximately three weeks of growth, healthy and uniformly growing Arabidopsis seedlings were selected for salt stress treatment. Each treatment included three biological replicates, with five plants per replicate. Plants were irrigated with 0 mM and 200 mM NaCl, and growth phenotype was observed after 21 days of treatment.
Subsequently, physiological parameters related to stress tolerance were measured. Chlorophyll content was measured using a spectrophotometric method [38]. Chlorophyll was extracted with acetone solution, and absorbance values were measured at 663 nm and 645 nm. The chlorophyll content was calculated using the following formula: Total chlorophyll content (mg/g) = (20.29 × OD645 + 8.04 × OD663) × V/W × 1000 (V is the total volume of the sample extract and W is the sample weight). Proline (Pro) content was determined using the ninhydrin colorimetric method [39]. Under acidic conditions, proline reacts with ninhydrin solution to form a red compound, and the absorbance was measured at 520 nm to calculate the Pro content. Malondialdehyde (MDA) content was measured using the thiobarbituric acid (TBA) method [40]. Samples were extracted with trichloroacetic acid, mixed with TBA solution, and heated in a boiling water bath for 15 min. The supernatant was then measured for absorbance at 450 nm and 532 nm. MDA content was calculated using the following formula: MDA content (mol/L) = 6.45 × (OD532 − OD600) − 0.56 × OD450. Superoxide dismutase (SOD) activity was measured using the microplate assay kit for SOD activity (Jining, Shanghai, China).

2.11. Data Analysis

Experimental data were organized and processed in Microsoft Excel, and mean ± standard deviation (SD) values were calculated for each treatment group. The normality test and homogeneity of variance were tested using GraphPad 10.1.2 software. One-way analysis of variance (ANOVA) was performed with SPSS 26.0 to determine significant differences among groups (α = 0.05). All figures were generated using GraphPad Prism 10.1.2.

3. Results

3.1. Identification and Sequence Analysis of Pomegranate GRAS Gene Family

A genome-wide screening combining BLAST and HMM-based searches identified 54 GRAS gene family members in pomegranate, designated as PgGRAS1 to PgGRAS54 according to the Gene ID (Table 1). These PgGRAS proteins showed considerable variability in amino acid length, ranging from 297 residues (PgGRAS15) to 1604 residues (PgGRAS42). Correspondingly, their molecular weights (Mw) varied from 31.57 kDa (PgGRAS15) to 181.47 kDa (PgGRAS42). All 54 proteins had GRAVY values below zero, indicating that they are hydrophilic. The isoelectric points (pI) spanned from 4.67 (PgGRAS15) to 9.54 (PgGRAS40); notably, 49 PgGRAS proteins had pI values below 7.0, suggesting acidic properties, while only five had pI values above 7.0, suggesting basic properties.
The instability indices ranged from 35.78 (PgGRAS37) to 66.95 (PgGRAS54), implying that most PgGRAS proteins are relatively unstable. However, PgGRAS2, PgGRAS15, PgGRAS37, and PgGRAS40 showed instability indices below 40, indicating greater stability. The average aliphatic index was 81.63, which generally supports thermal stability in globular proteins. Subcellular localization analysis predicted that most PgGRAS proteins are localized to the cytoplasm, nucleus, and chloroplasts.

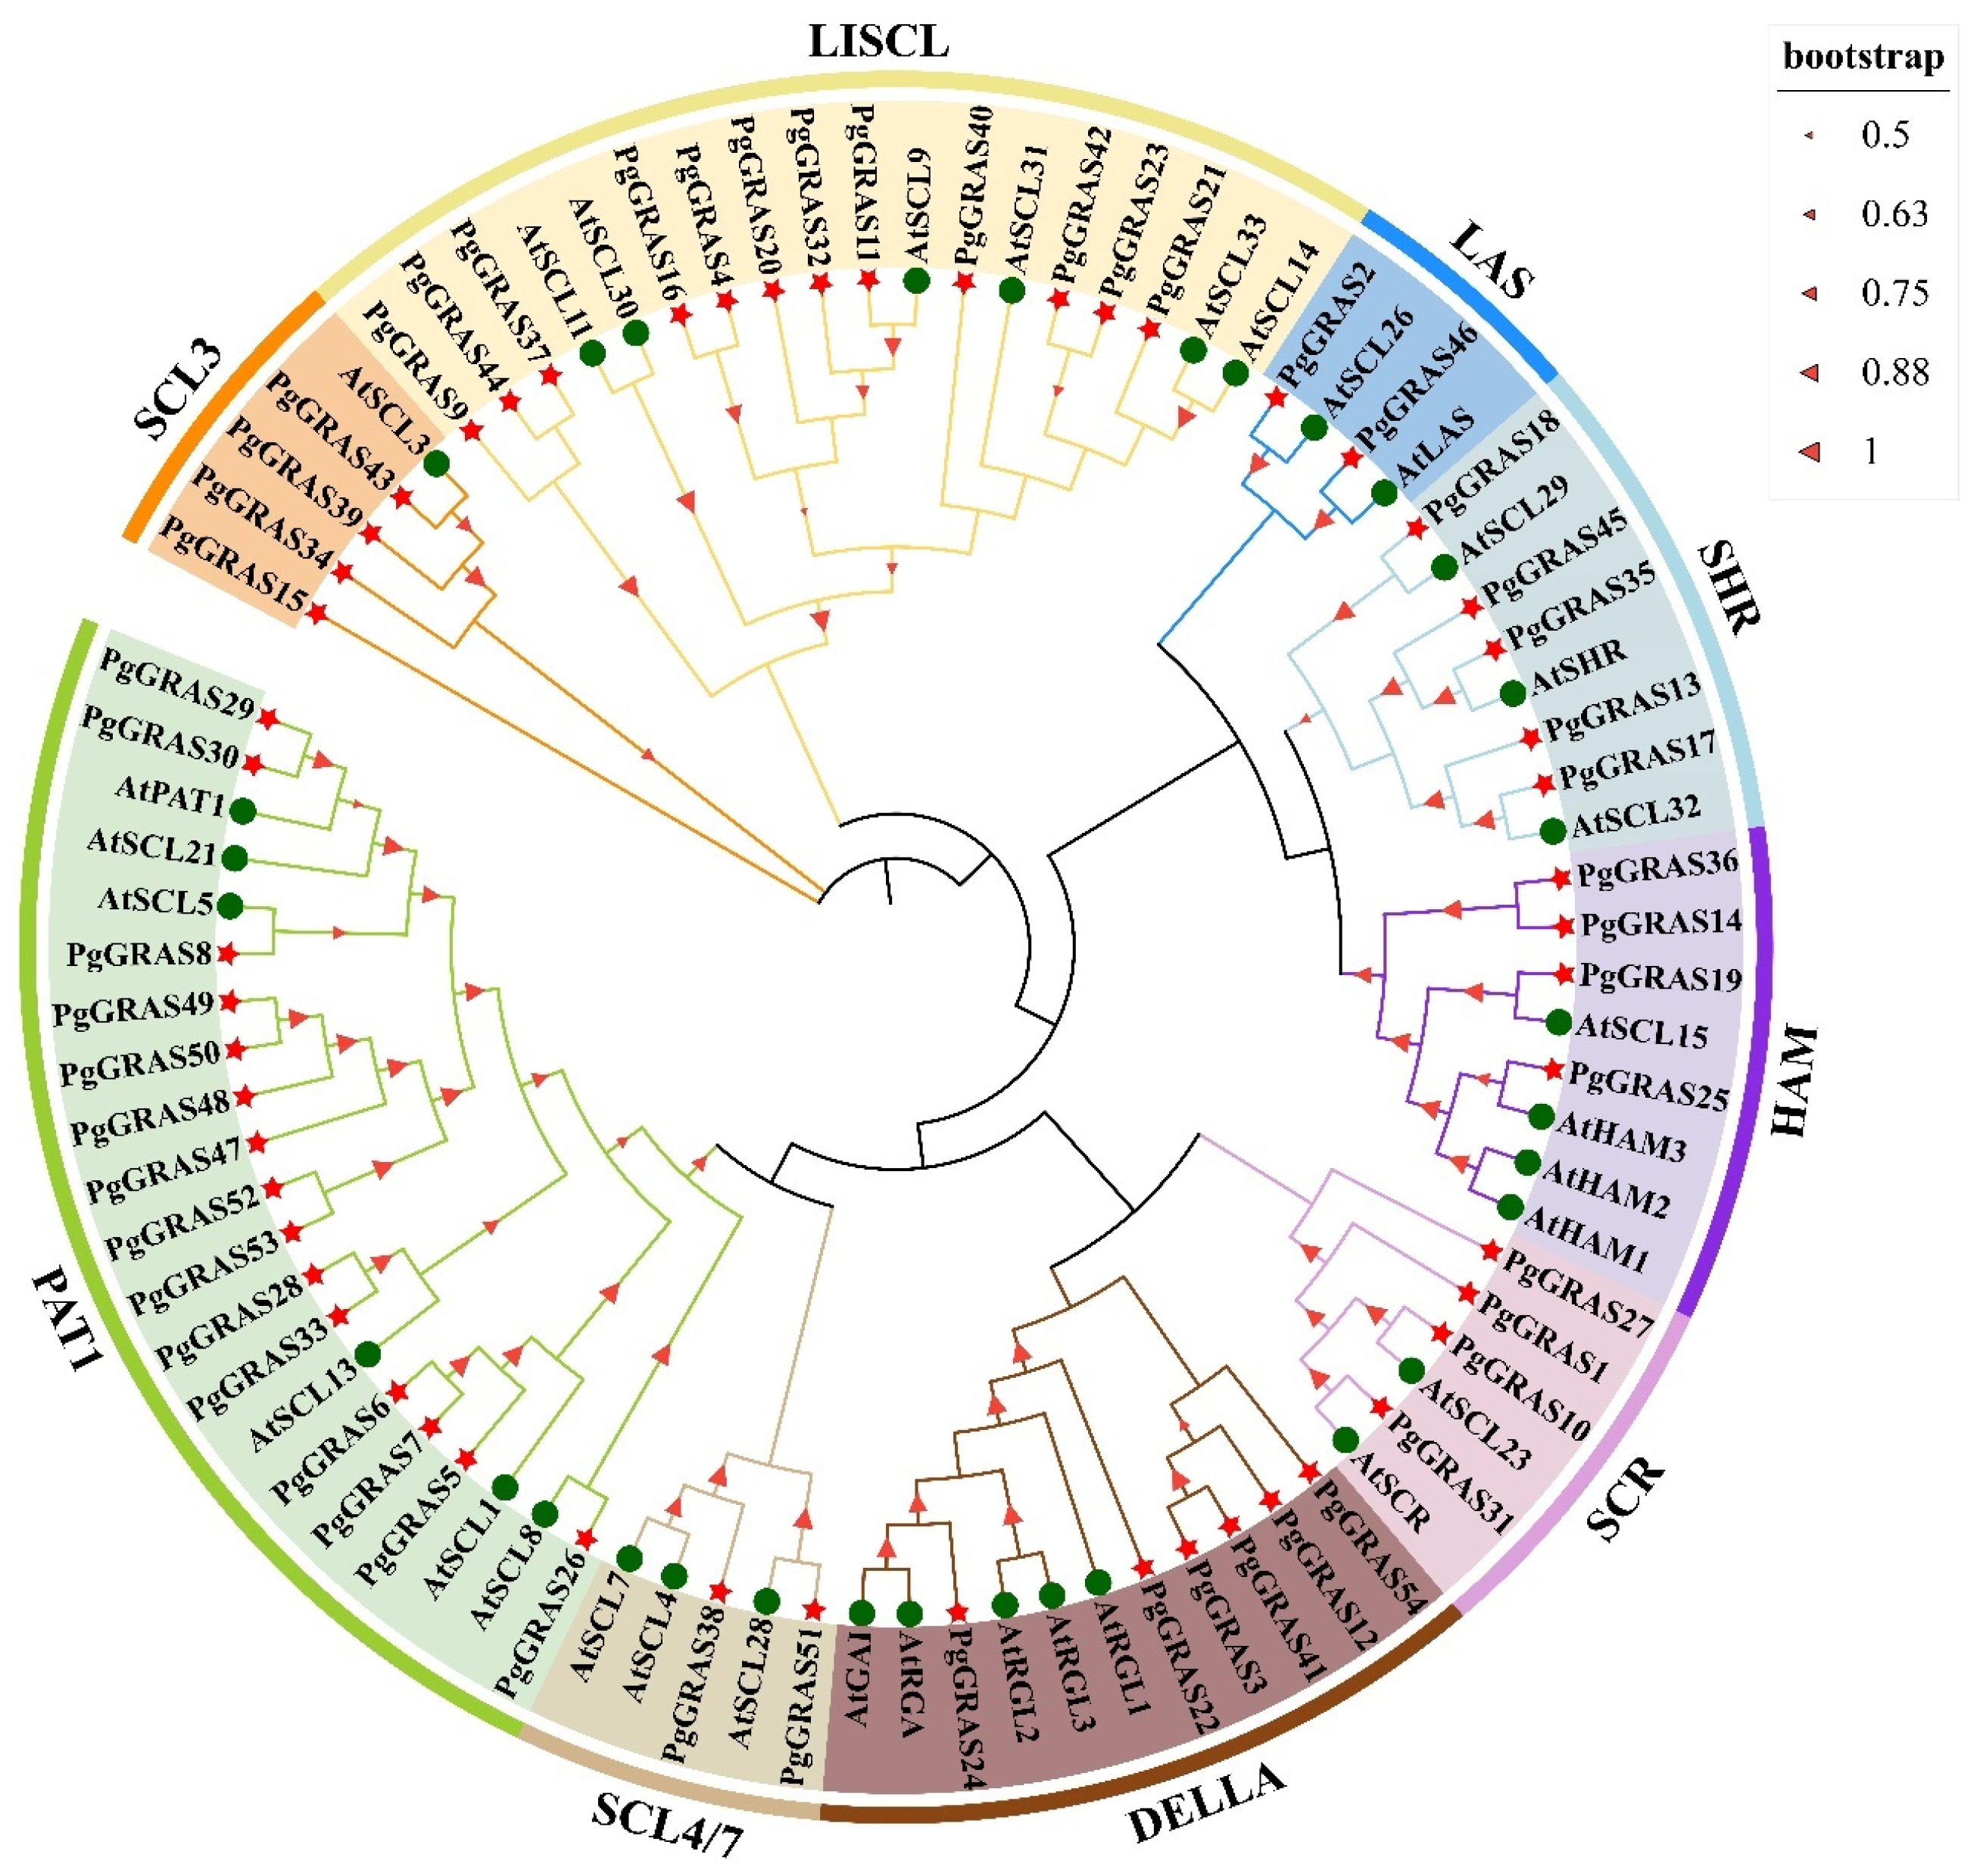
3.2. Phylogenetic Analysis of the Pomegranate GRAS Gene Family

To investigate the evolutionary relationships among GRAS genes in pomegranate, a phylogenetic tree was constructed using GRAS protein sequences from both Arabidopsis thaliana and Punica granatum. Based on the tree topology, all GRAS genes were classified into nine subfamilies: PAT1, SCL4/7, DELLA, SCR, HAM, SHR, LAS, LISCL, and SCL3 (Figure 1). Of these, the PAT1 subfamily had the highest number of PgGRAS members (15), followed by the LISCL subfamily with 12 members. In contrast, the LAS and SCL4/7 subfamilies each contained only two genes. After visualizing the bootstrap values of each branch using triangles of different sizes, it was found that the bootstrap values of the LAS, SHR, HAM, and PAT1 subfamilies were concentrated in the range of 75% to 100%. The overall bootstrap values in this phylogenetic tree were relatively high, indicating that it can accurately reflect the phylogenetic relationships of GRAS members. Several PgGRAS proteins clustered closely with their Arabidopsis counterparts, suggesting that these proteins may share similar biological functions.

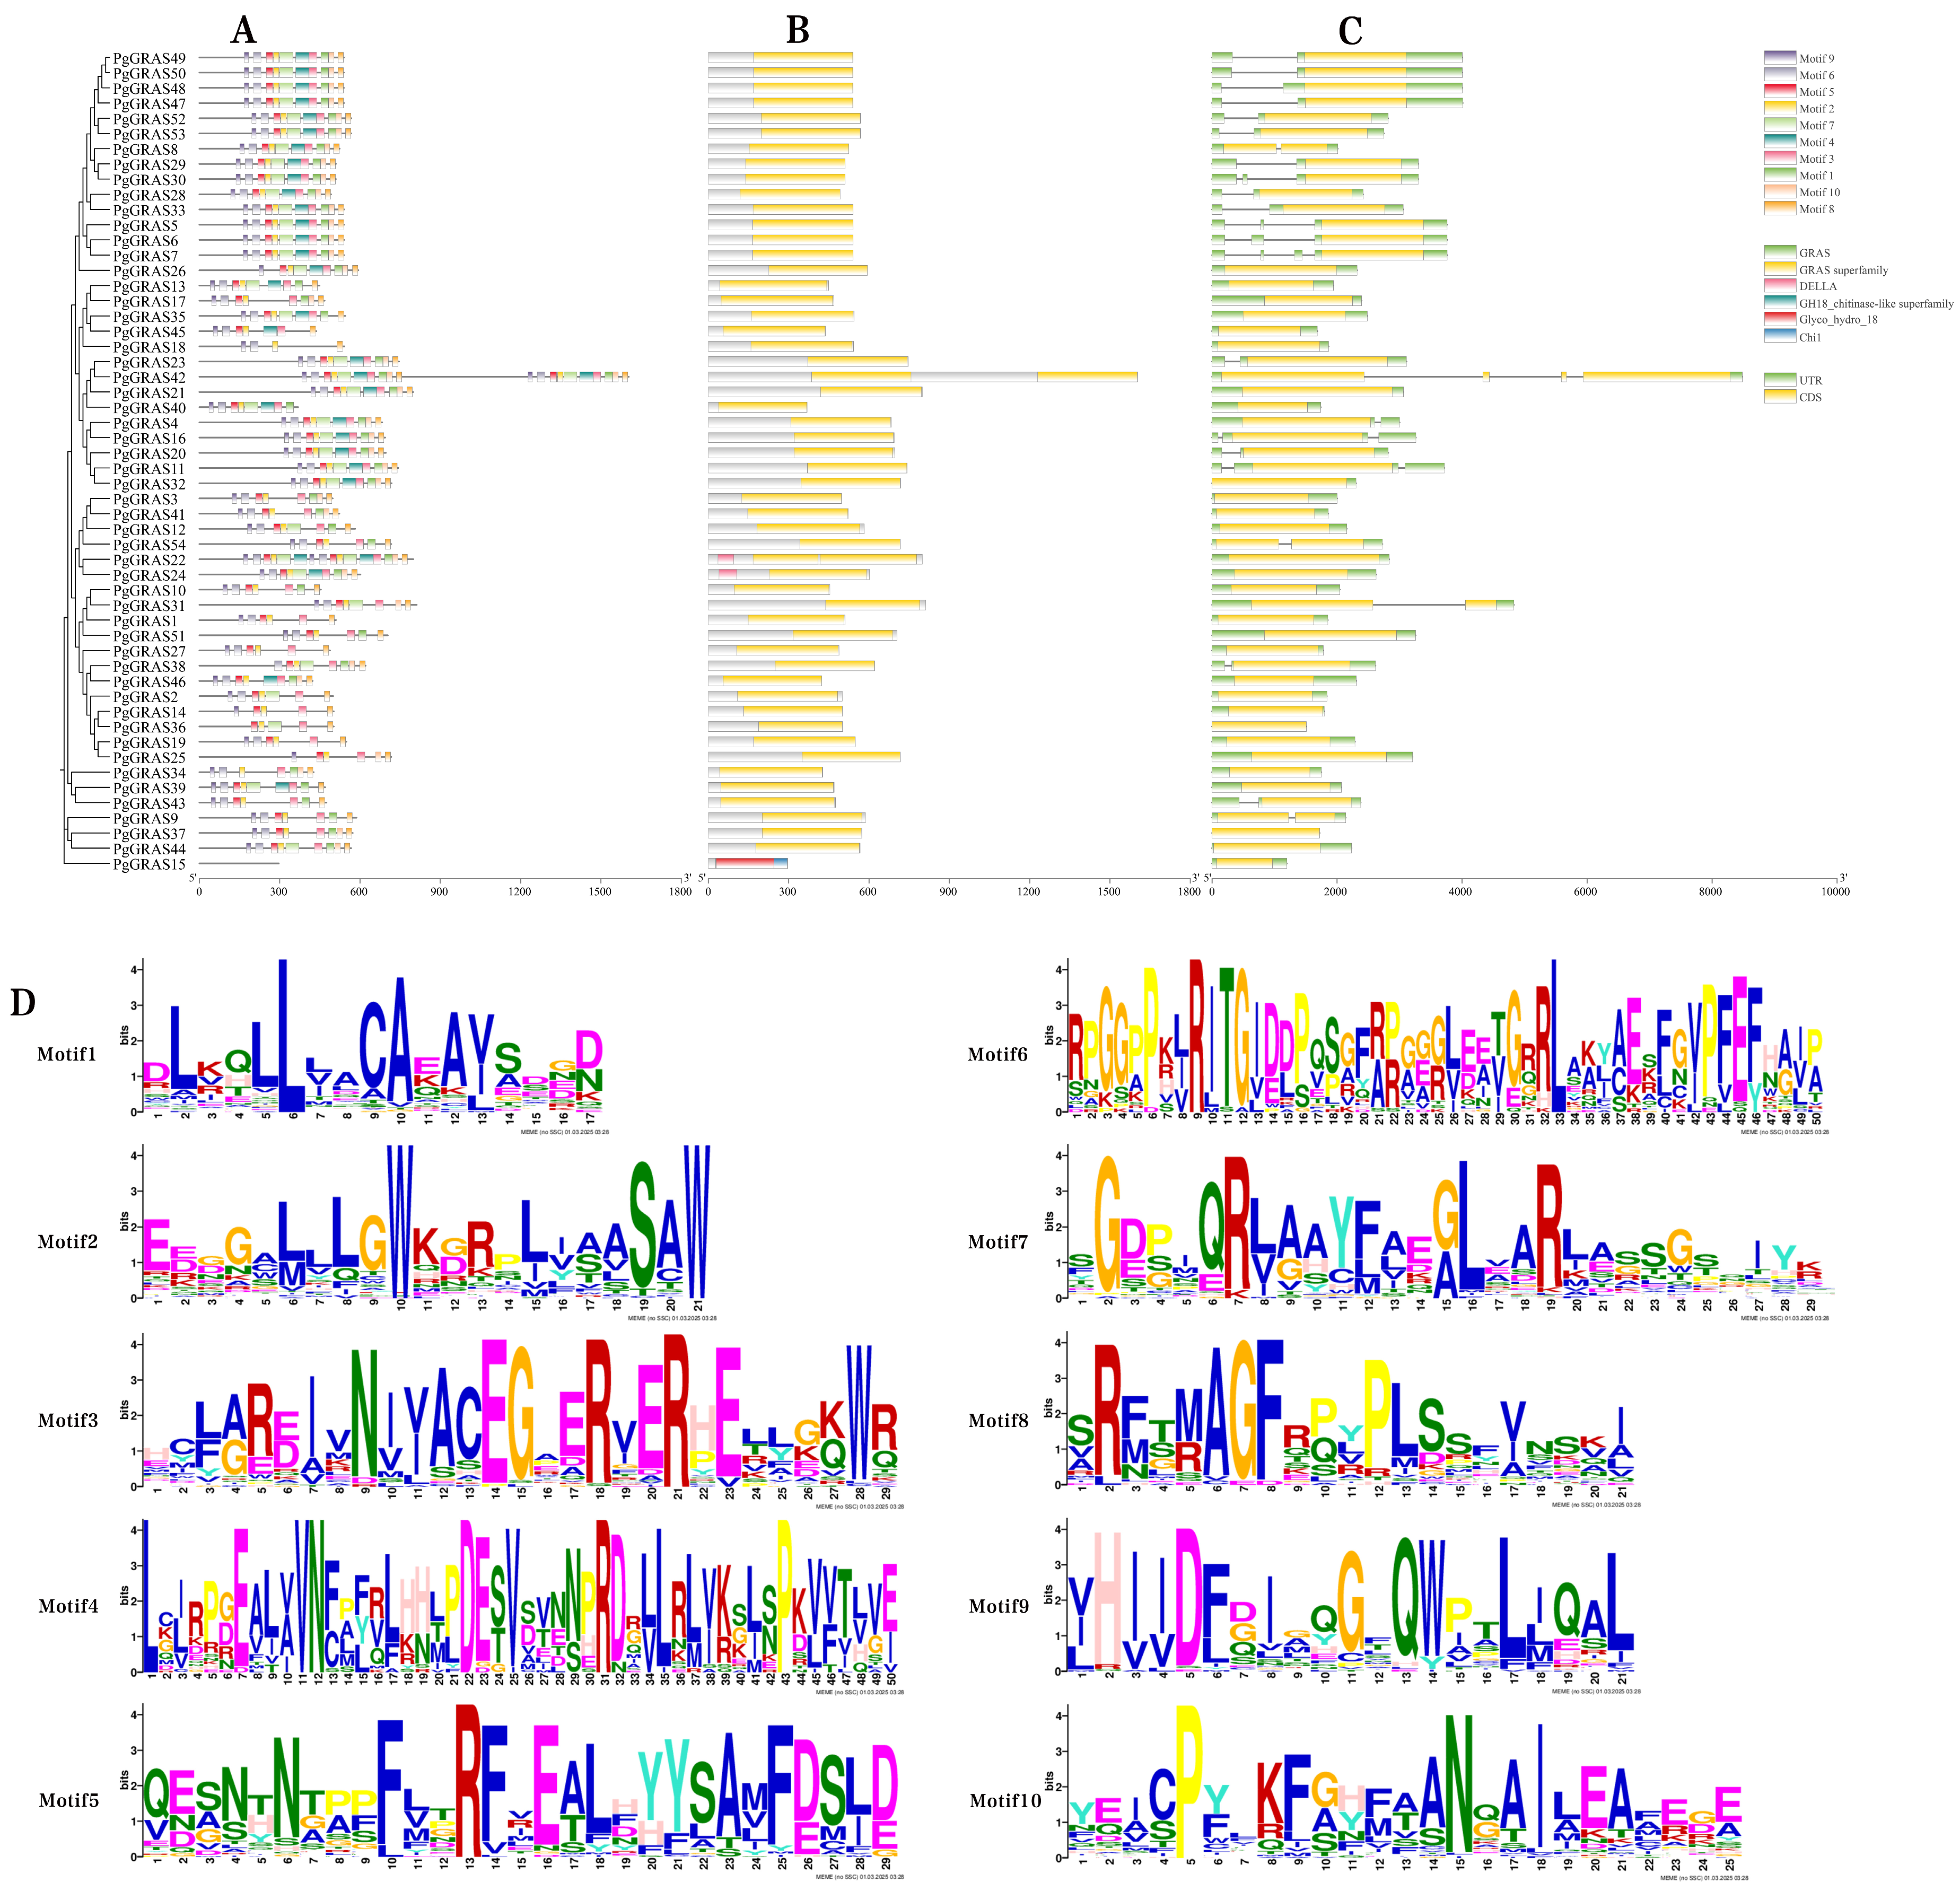
3.3. Conserved Motif and Gene Structure Analysis of PgGRAS Proteins

To elucidate the structural characteristics of pomegranate GRAS proteins, we analyzed their conserved motifs using MEME (Figure 2A). The distribution patterns of these motifs closely mirror the topology of the phylogenetic tree. Out of 10 conserved motifs identified in the GRAS protein sequences, nearly all subfamily members contained motifs 9, 7, 5, 2, 3, and 6, highlighting their high conservation across the GRAS gene family. Notably, every PgGRAS protein harbored motif 6 at the N-terminus, while a higher number of motifs were located in the C-terminal region, underscoring its functional importance. Proteins within the same subfamily exhibited remarkably similar conserved motif types and arrangements. However, some variations in motif distribution were observed within subfamilies, reflecting potential differences in regulatory functions. For example, within the DELLA subfamily, only PgGRAS22 and PgGRAS24 contained motif 4, and motif 9 appeared twice in PgGRAS22, PgGRAS41, and PgGRAS3, but only once in the remaining genes.
Further analysis using NCBI’s Batch-CDD tool revealed that all PgGRAS proteins contain a GRAS or GRAS superfamily domain, with the DELLA structural domain exclusively present in the DELLA subfamily—specifically in PgGRAS22 and PgGRAS24 (Figure 2B). Visualization of exon–intron structures with the GSDS tool showed that 29 PgGRAS genes are intronless, while the remaining 25 genes possess one to three introns (Figure 2C). Overall, members within the same subfamily share similar exon–intron architectures, emphasizing the role of gene structure in the evolution of the pomegranate GRAS gene family.

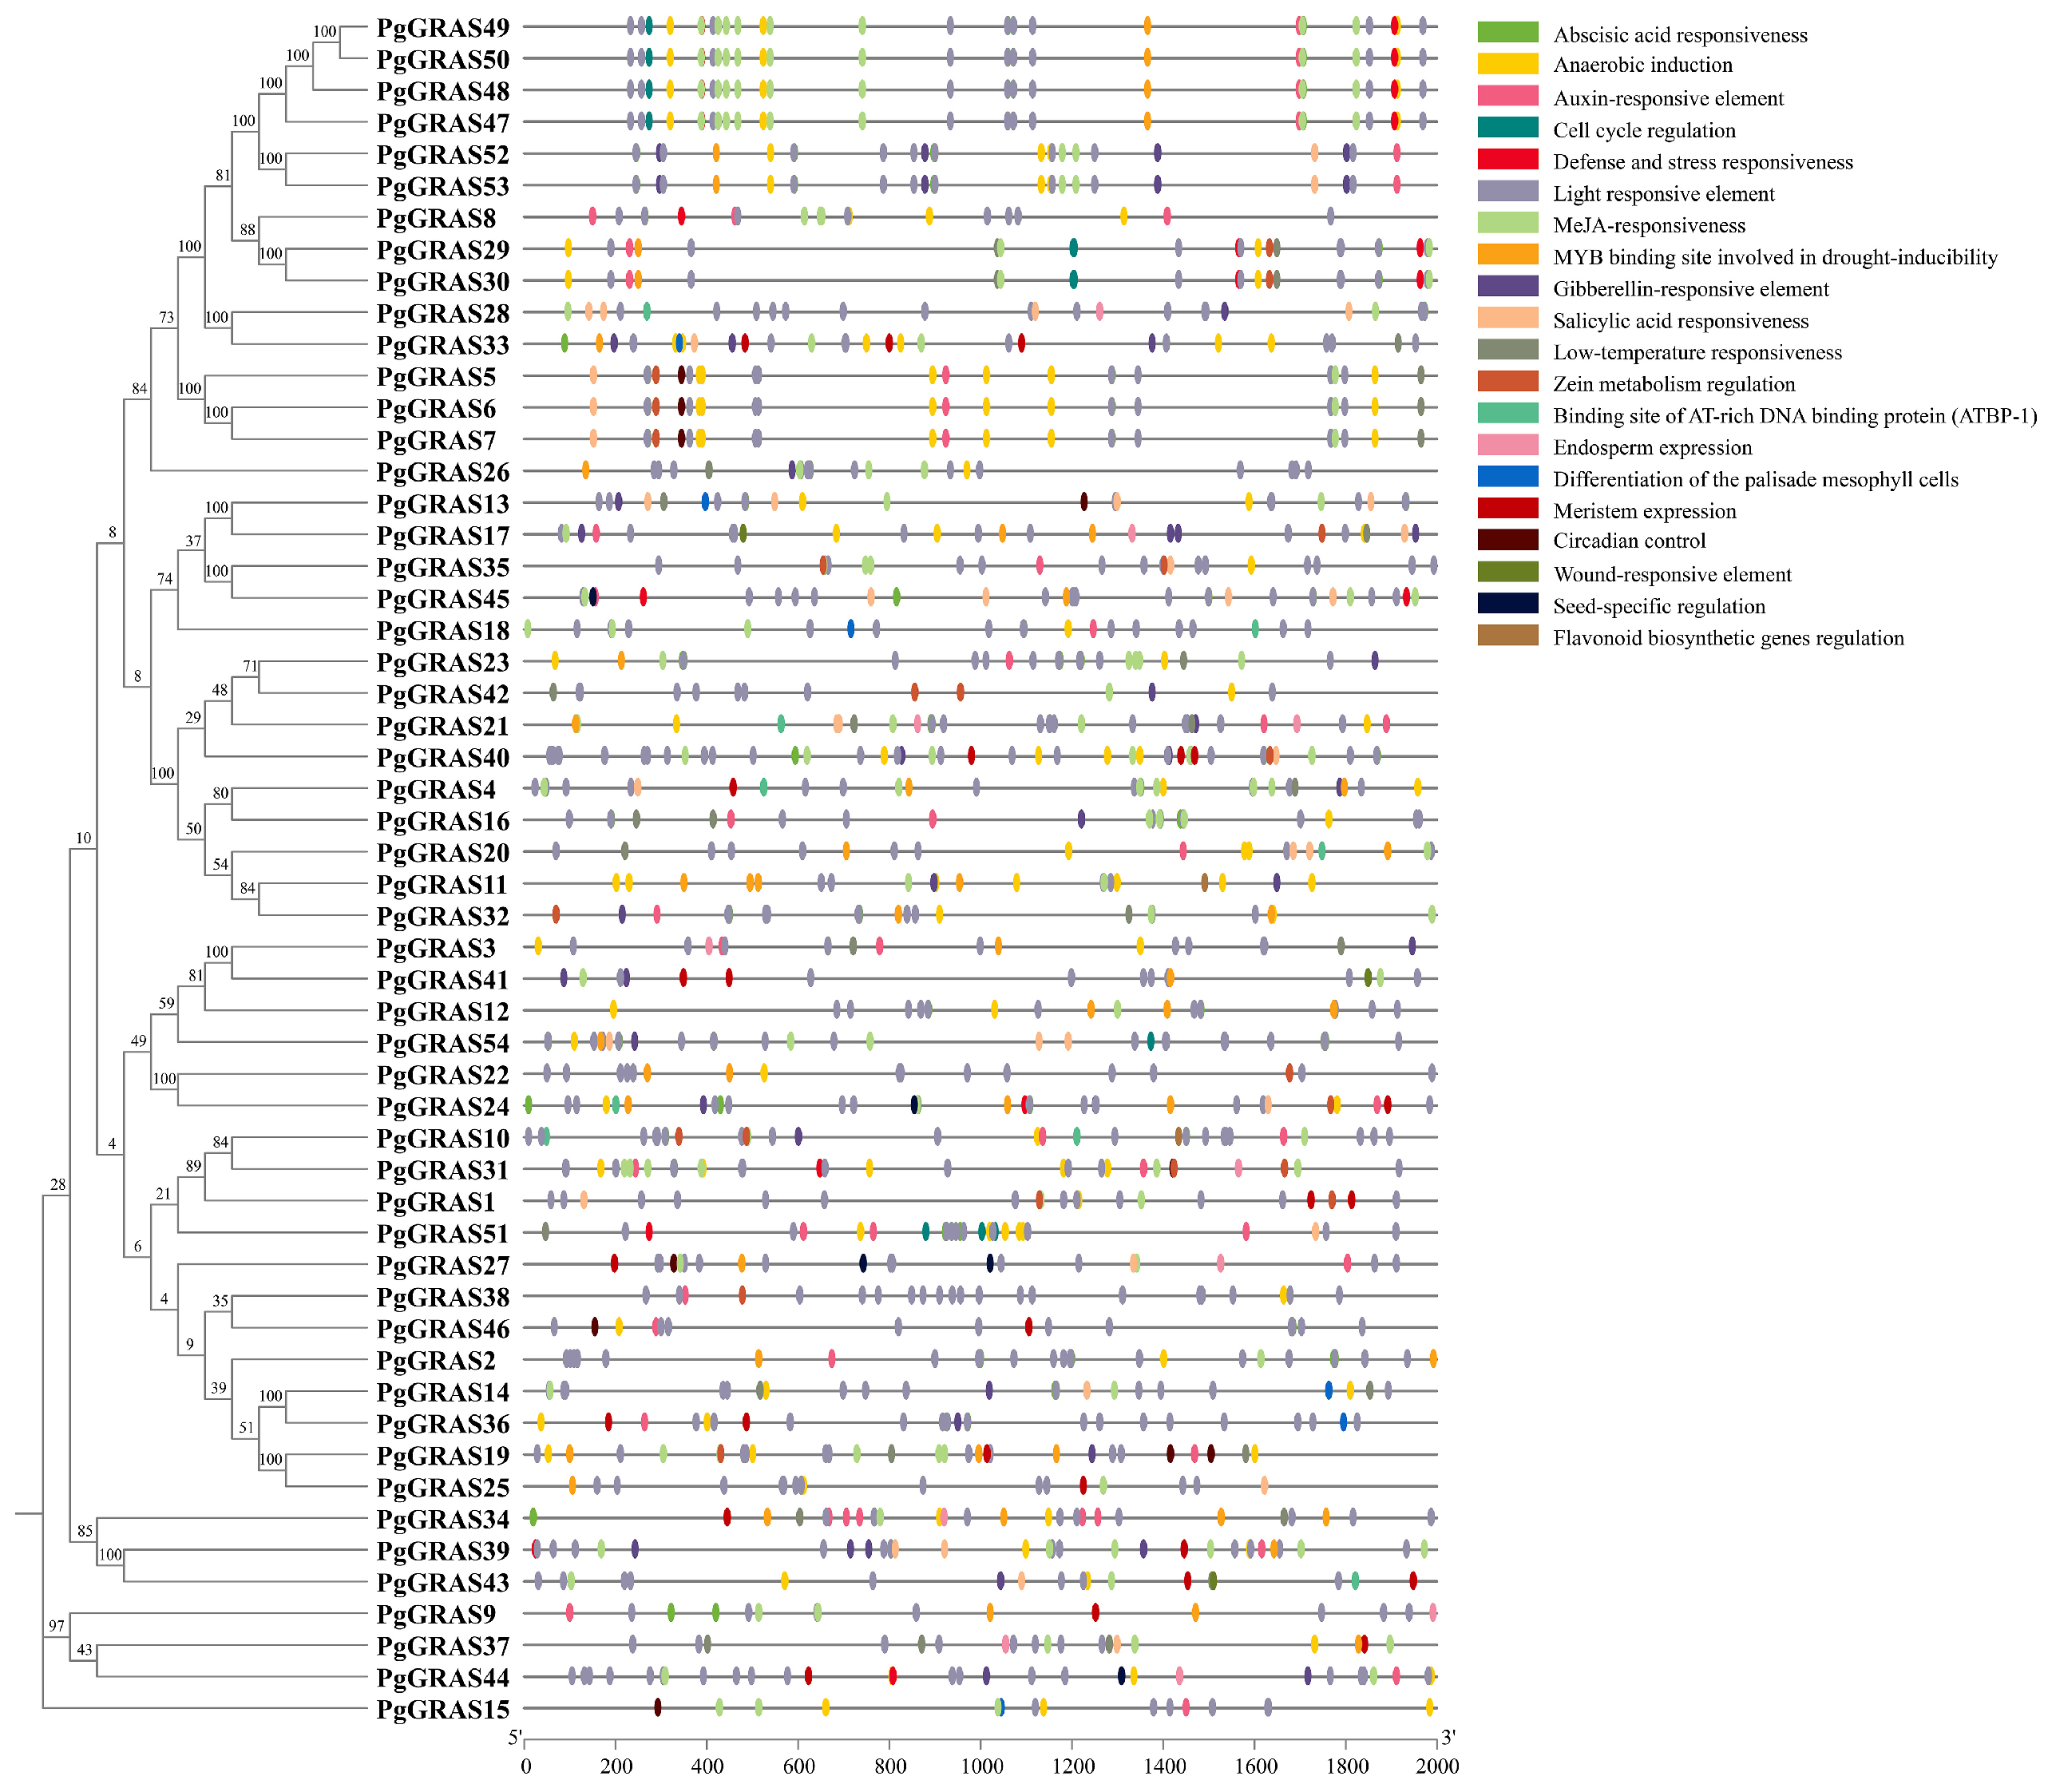
3.4. Analysis of Cis-Acting Elements in PgGRAS Promoters

Cis-acting element predictions were conducted on the 2000 bp upstream regions of the 54 PgGRAS genes using the PlantCARE database. In addition to the essential TATA-box and CAAT-box, the analysis revealed a variety of cis-acting elements associated with plant growth, development, light responsiveness, phytohormone signaling, and stress responses (Figure 3). Notably, light-responsive elements were found in nearly all PgGRAS promoters. Many promoters also harbored multiple phytohormone-responsive elements, including those for MeJA (CGTCA-motif, TGACG-motif), gibberellins (P-box, TATC-box), salicylic acid (TCA-elements), auxin (AuxRR-cores), and abscisic acid (ABRE). Furthermore, stress-related elements, such as the low-temperature responsive element (LTR), anaerobic induction element (ARE), and hypoxia-responsive element (STRE), were detected. The type, number, and distribution of these cis-acting elements varied considerably among the gene members. For example, most members of the DELLA subfamily contain GA-responsive elements (with the exception of PgGRAS12), while LTRs were predominantly found in the PAT1 and LISCL subfamilies. Additionally, MeJA-responsive elements appeared multiple times at different positions in the promoters of the PAT1 subfamily. These findings suggest that PgGRAS genes play a critical role in regulating responses to various plant hormones and environmental stresses.

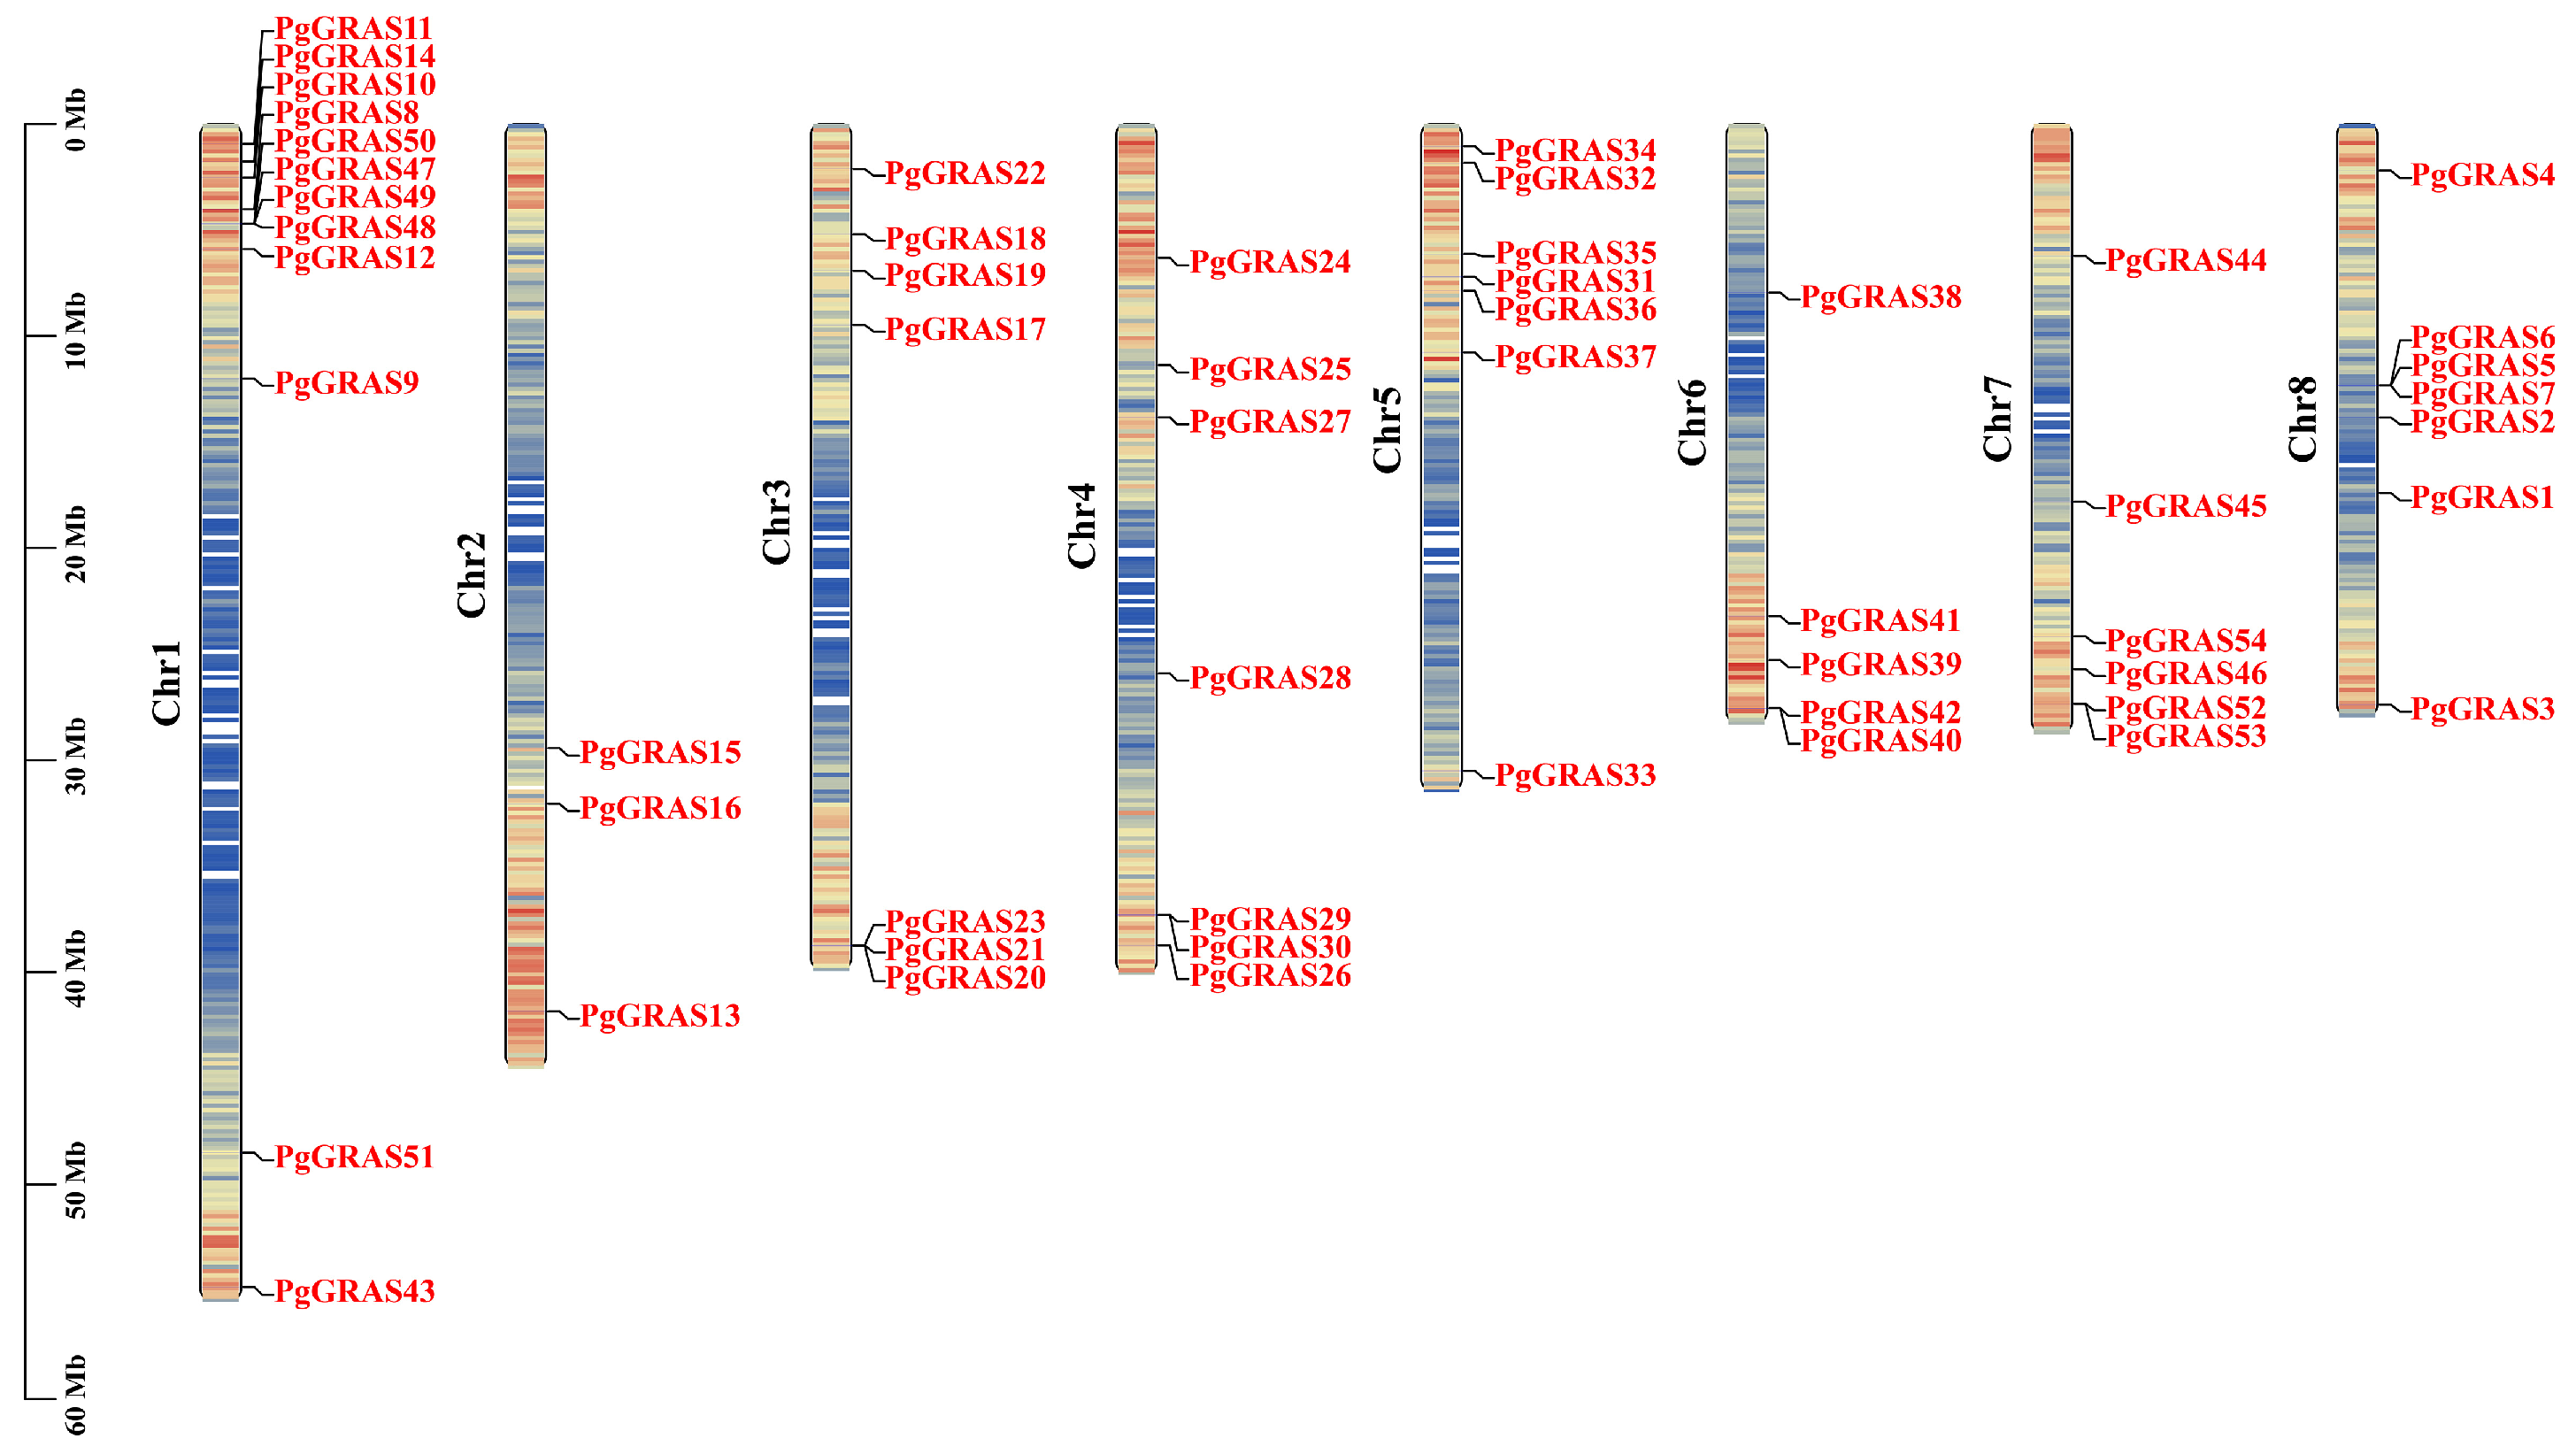
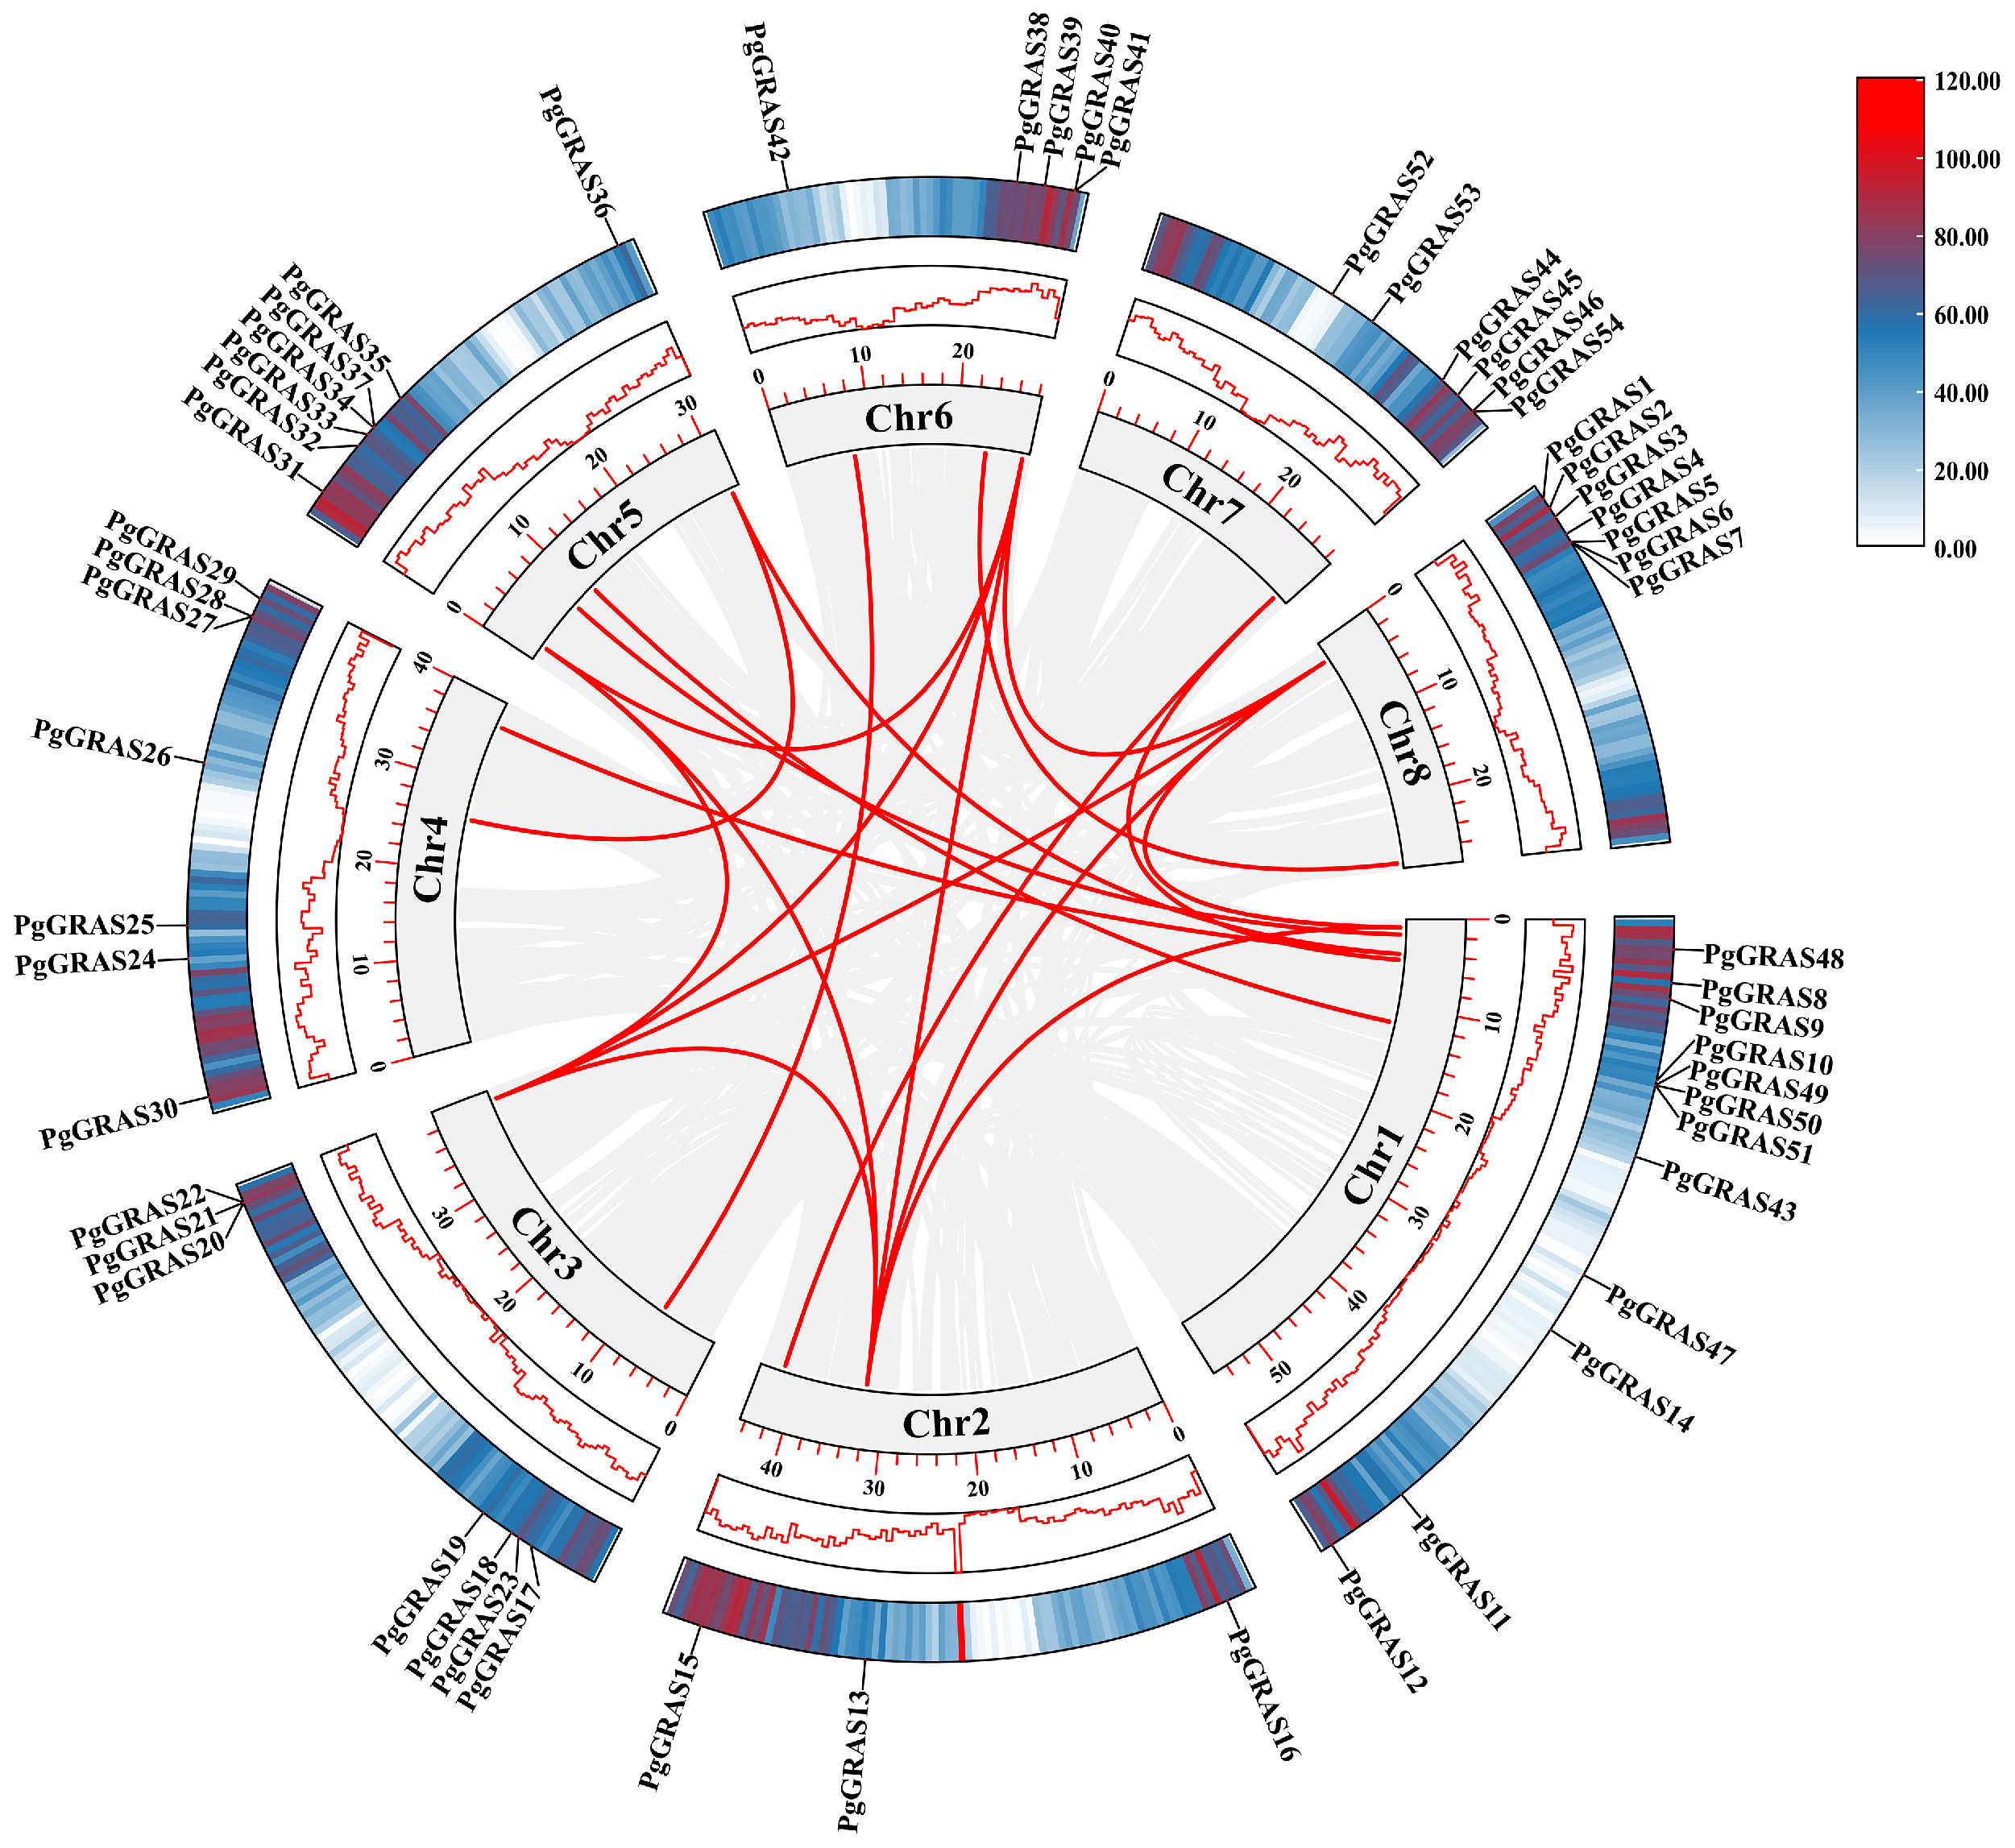
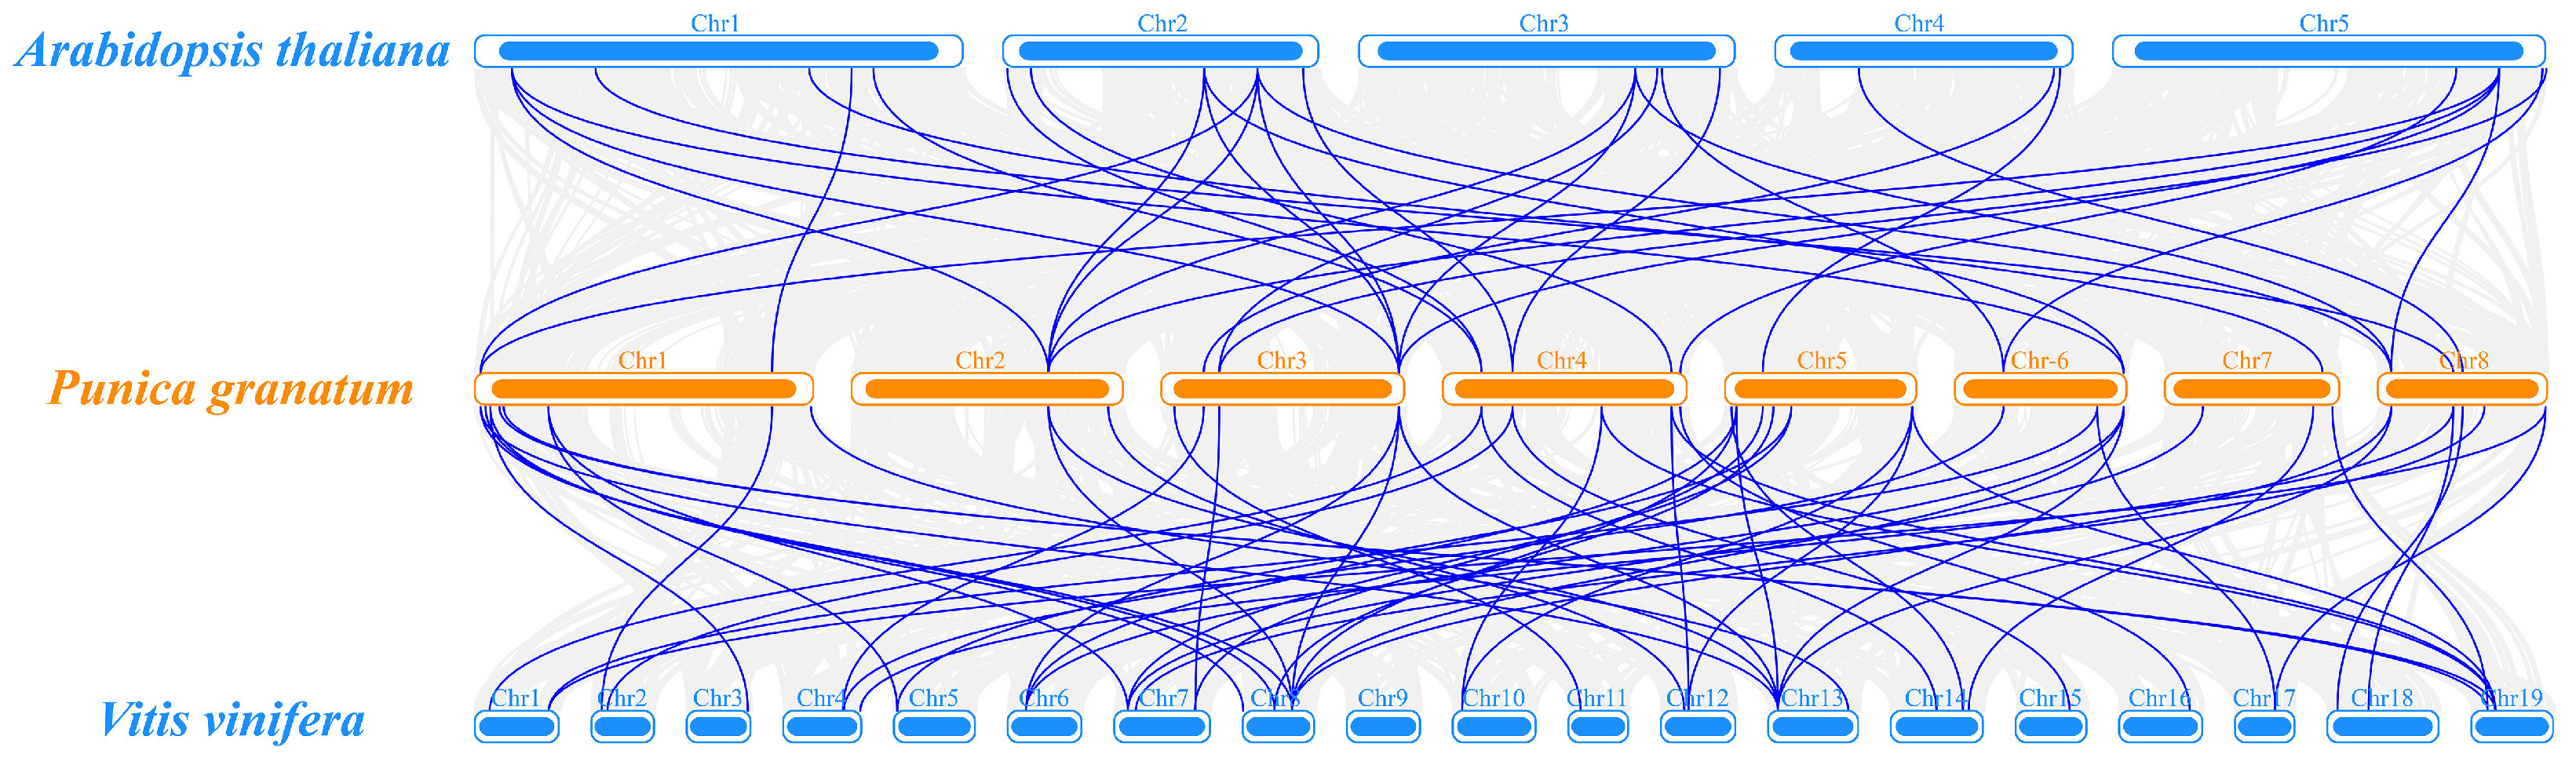
3.5. Chromosomal Localization and Collinearity Analysis of PgGRAS Genes

Using TBtools for chromosomal mapping, all 54 PgGRAS genes were distributed across eight chromosomes, with notable variation in their numbers per chromosome (Figure 4). Chromosome 1 housed the largest number, containing 12 PgGRAS genes, while chromosome 2 had the fewest, with only 3 genes. Chromosomes 3, 4, 5, and 8 each contained 7 genes, and chromosomes 6 and 7 had 5 and 6 genes, respectively.
Collinearity analysis of the pomegranate GRAS gene family using MCScan revealed extensive gene duplication events, with 20 gene pairs undergoing segmental duplication (Figure 5). This suggests that gene duplication has been a major driving force in the expansion of the PgGRAS family.
To further investigate evolutionary relationships, we conducted interspecific collinearity analyses between pomegranate and two other species: Arabidopsis thaliana and Vitis vinifera (Figure 6). The analysis identified 33 syntenic gene pairs between pomegranate and Arabidopsis, and 57 syntenic pairs between pomegranate and grape, indicating a closer evolutionary relationship between PgGRAS and VvGRAS genes.
The Ka/Ks ratio, which compares nonsynonymous to synonymous substitution rates, serves as an important metric for evaluating selective pressure on protein-coding genes. Analysis of paralogous homologous pairs within the PgGRAS family revealed that all gene pairs exhibited Ka/Ks values below 1 (Table 2), indicating that they have undergone purifying selection throughout their evolution.

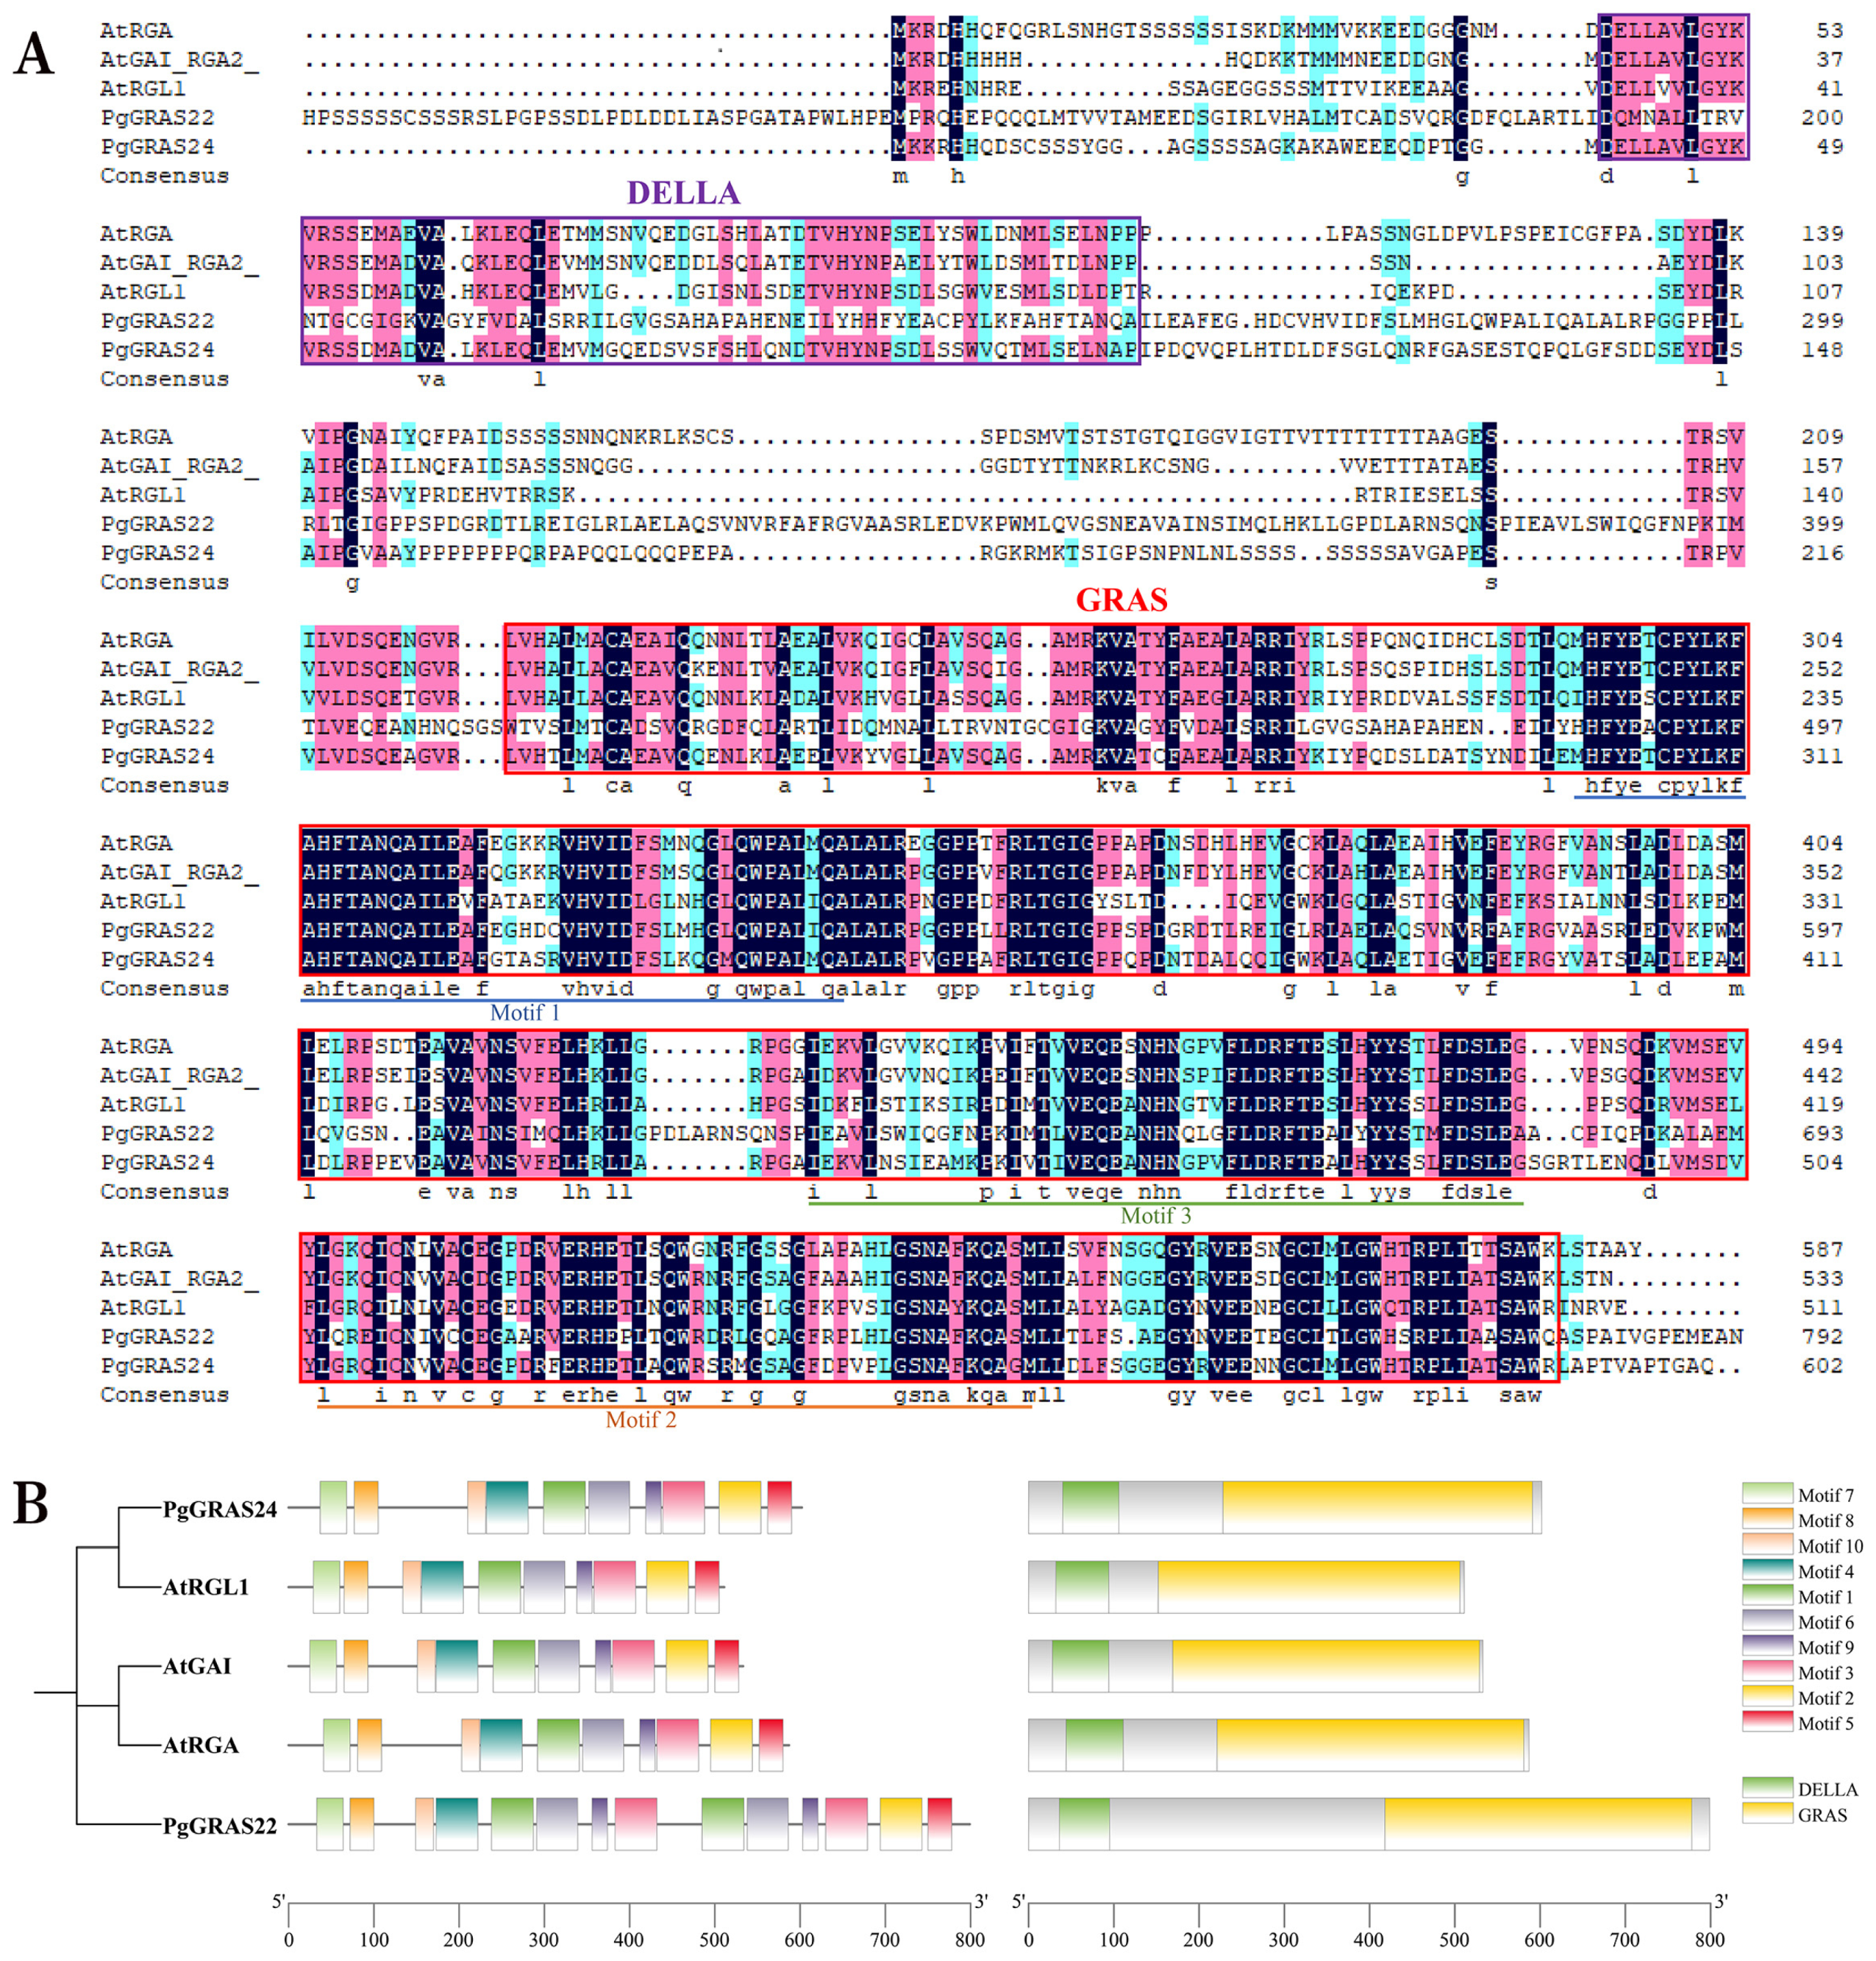
3.6. Sequence Comparison, Conserved Motifs, and Structural Domains of Pomegranate DELLA Proteins

To further investigate the function and salt stress response of the DELLA subfamily, we selected PgGRAS22 and PgGRAS24 as representative genes. Multiple sequence alignments revealed a high degree of similarity between the amino acid sequences of pomegranate and Arabidopsis thaliana DELLA proteins (Figure 7A). Analysis of conserved motifs and structural domains showed that both species’ DELLA proteins possess 10 conserved motifs with similar arrangement and distribution patterns (Figure 7B). Notably, both pomegranate and Arabidopsis DELLA proteins feature a highly conserved GRAS domain at the C-terminus and a characteristic DELLA domain at the N-terminus. Within this N-terminal region, the DELLA and TVHYNP sequences stand out as the core functional elements essential for the activity of DELLA proteins.

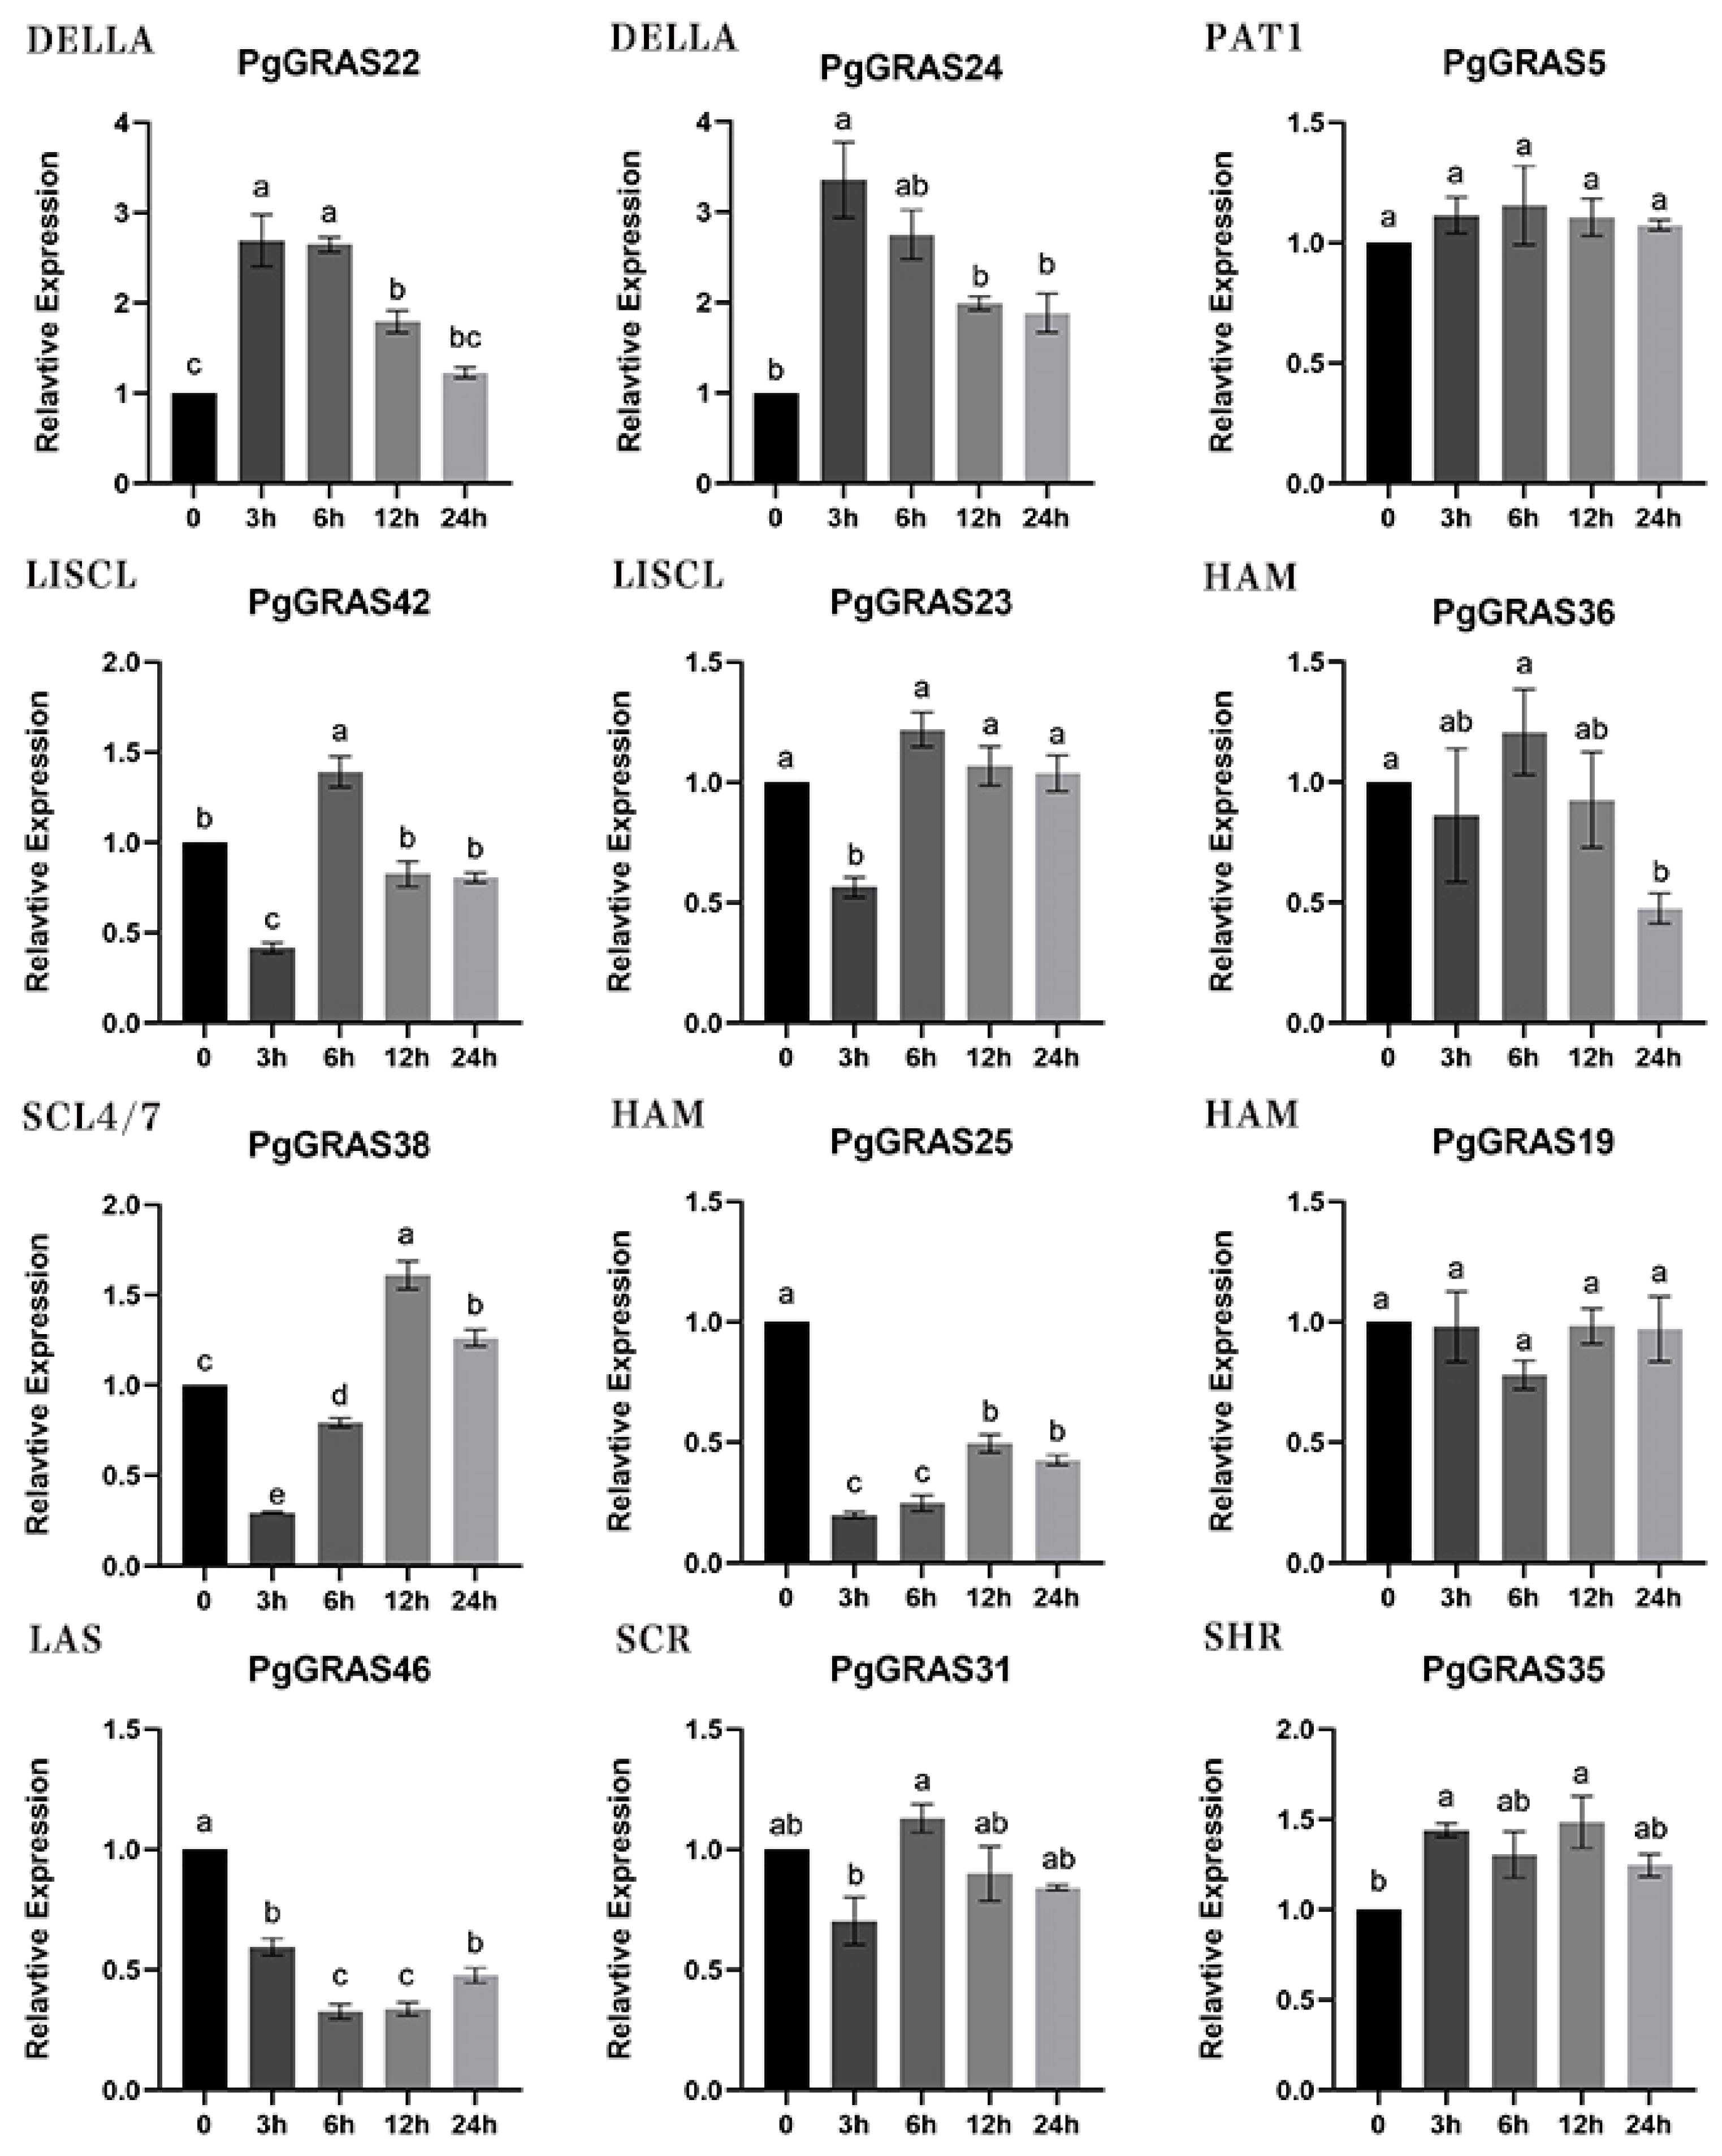
3.7. Expression Pattern Analysis of PgGRAS Under Saline Stress in Pomegranate

Based on the previous analysis of the pomegranate salt stress transcriptomic sequencing data by our research group identified fifteen differentially expressed members of the GRAS gene family. In addition, we utilized homologous sequence alignment based on the prior reported key genes from various subfamilies of the GRAS family in plants under salt stress. Ultimately, we selected twelve genes from different GRAS subfamilies to validate their transcriptional responses under saline conditions using qRT-PCR on root tissues (Figure 8). Under 200 mM NaCl treatment, the two DELLA subfamily genes (PgGRAS22 and PgGRAS24) showed the most pronounced response, peaking at 3 h of stress. In contrast, the expression levels of HAM (PgGRAS25) and LAS (PgGRAS46) were markedly down-regulated. Notably, expression patterns varied even among genes within the same subfamily. For example, genes from the LISCL subfamily (PgGRAS23 and PgGRAS42), as well as HAM (PgGRAS36), SCL4/7 (PgGRAS38), and SCR (PgGRAS31), initially exhibited transient down-regulation, followed by an increase, then a subsequent decline, and finally stabilization. In contrast, HAM (PgGRAS19) and PAT1 (PgGRAS5) maintained relatively stable expression levels under salt stress.

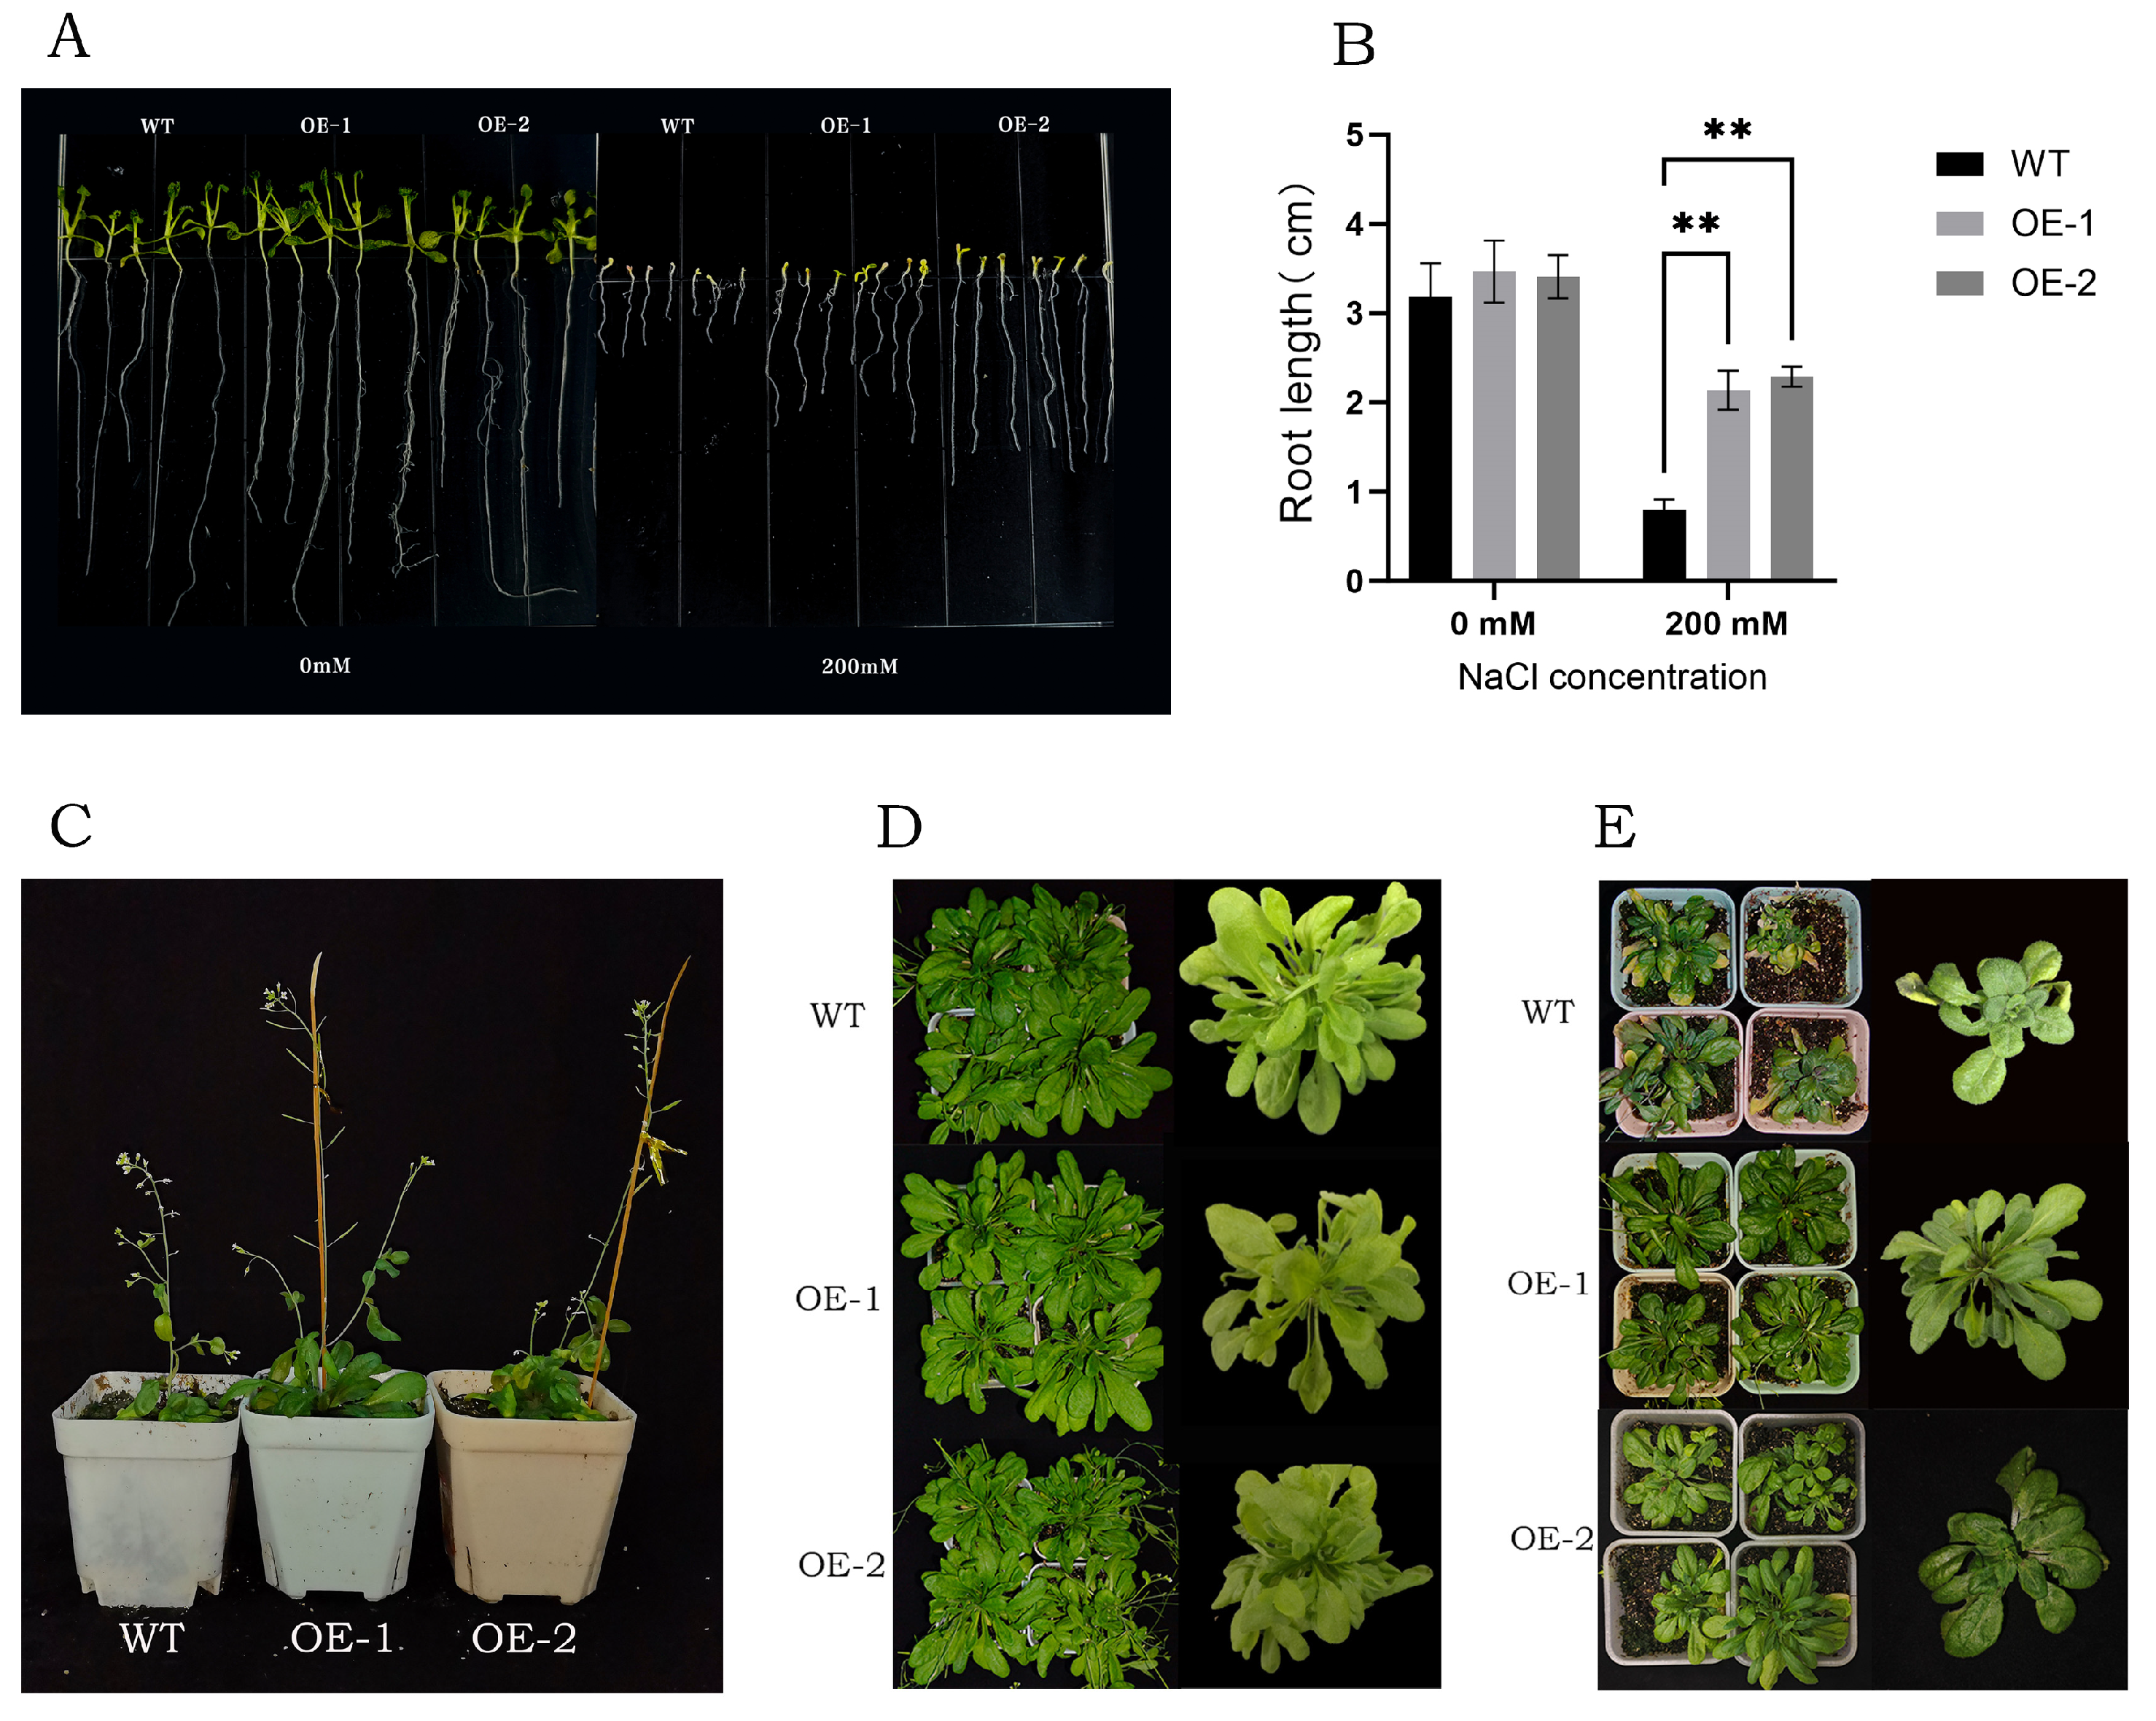
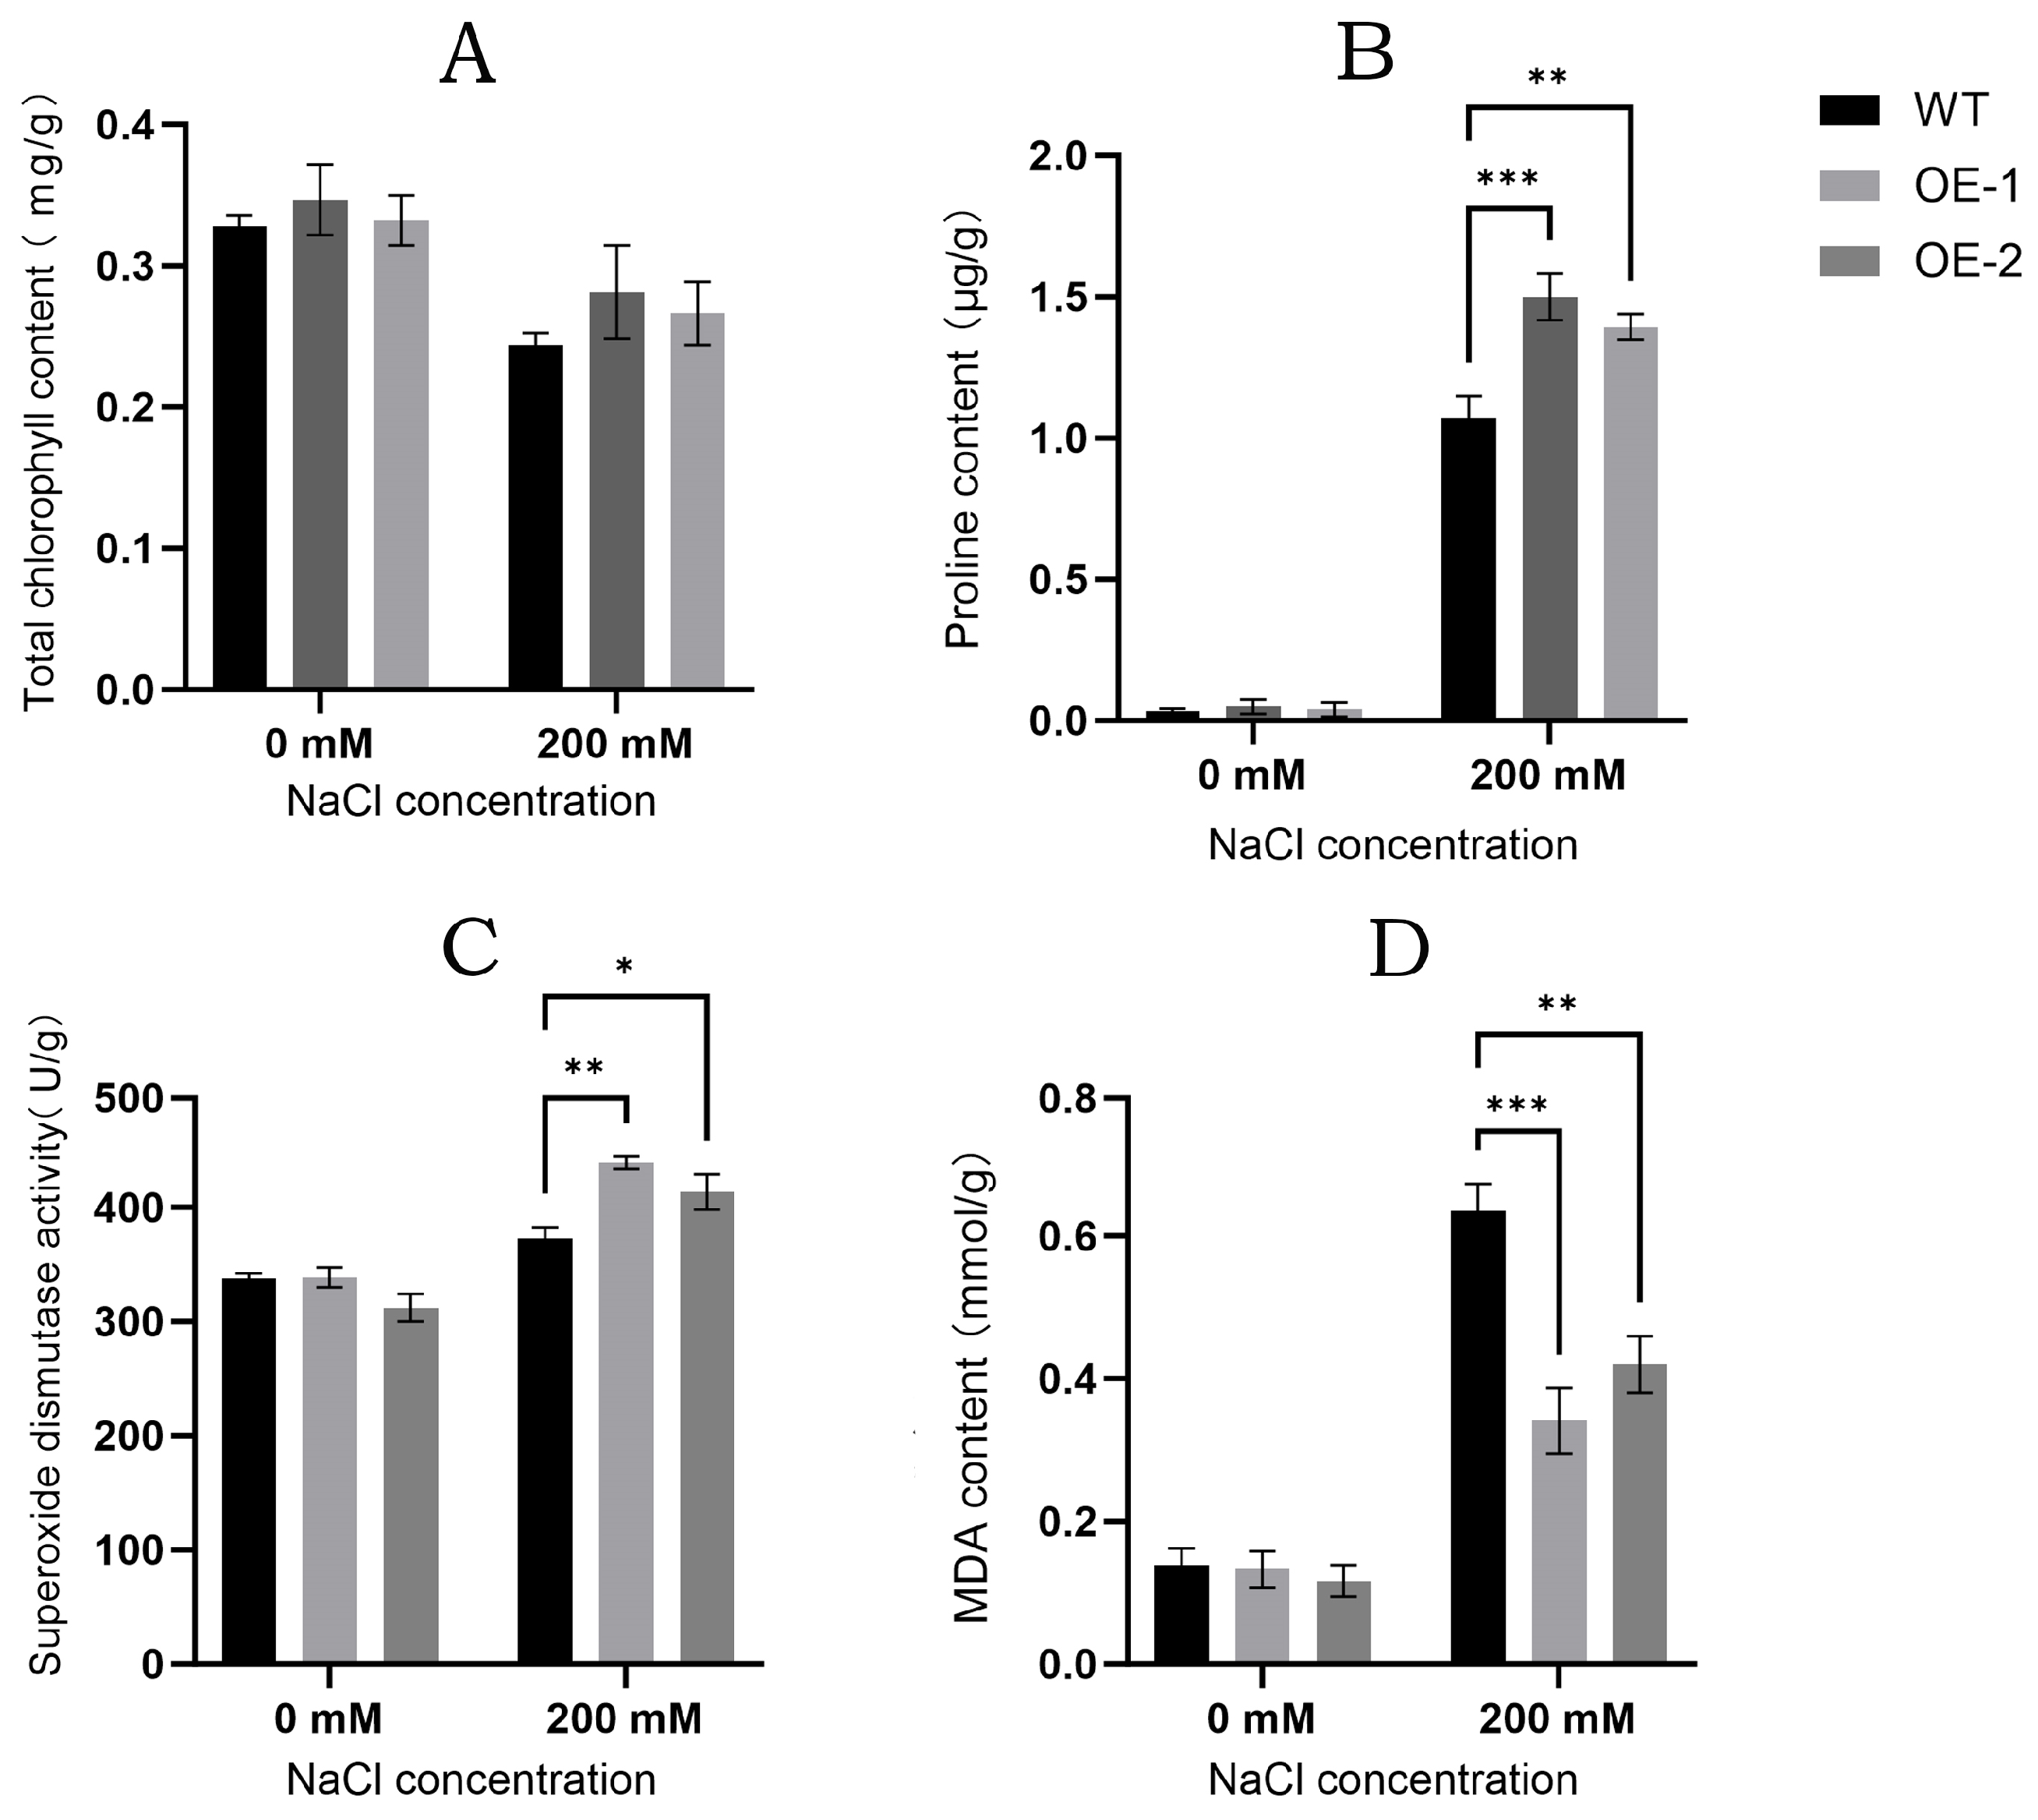
3.8. Salt Tolerance Analysis of Transgenic Arabidopsis

To verify whether PgGRAS24 can enhance salt tolerance in transgenic Arabidopsis, both wild-type and overexpression lines (OE-1, OE-2) were subjected to salt stress treatment. Transgenic Arabidopsis lines and wild-type plants were separately sown on a 0 or 200 mM MS solid medium and placed vertically for cultivation. After 14 days, root length was observed to be significantly different, with the overexpression lines showing markedly longer roots compared to the wild-type plants (Figure 9A,B). Then, the Arabidopsis seedlings that had not yet undergone salt stress treatment were transplanted into soil and irrigated with NaCl solution. After 21 days of treatment, plant phenotypes were observed, and physiological parameters were measured. The results showed that, under 200 mM NaCl treatment, the wild-type Arabidopsis (WT) exhibited significantly weaker growth compared to the transgenic lines, with symptoms including stunted growth, leaf curling and yellowing, and delayed bolting and flowering (Figure 9C–E).
Subsequently, we measured the chlorophyll content in Arabidopsis, and no significant difference was observed between the transgenic lines and wild-type plants (Figure 10A). In addition, we determined the levels of malondialdehyde (MDA), proline (Pro), and superoxide dismutase (SOD) in both transgenic and wild-type Arabidopsis (Figure 10B–D). After salt stress treatment, the MDA content in the transgenic lines was significantly lower than in the wild type, which indicated that the transgenic Arabidopsis had less membrane lipid peroxidation and lower cellular damage. Both proline and SOD levels increased to varying degrees after stress treatment, with the transgenic lines showing significantly higher levels than the wild type. Specifically, the proline content in the transgenic Arabidopsis lines was approximately 1.5 times that of the wild type, and the SOD activity was about 1.2 times as high. These experimental results suggest that the overexpression of PgGRAS24 enhances salt tolerance in Arabidopsis under salt stress conditions.

4. Discussions

GRAS proteins are ubiquitous in plants and play vital roles in regulating growth, reproductive development, hormone signaling, and responses to environmental stresses. Salt stress, which causes osmotic imbalance, ion toxicity, and oxidative damage, can severely reduce plant productivity and survival, particularly in saline and arid regions, where extreme salinity may even lead to plant death. In pomegranate—a fruit tree known for its salt tolerance—transcriptomic data have revealed notable GRAS gene expression in the roots under salt stress conditions. Despite these findings, there remains a lack of systematic studies on the functional roles of GRAS genes in relation to plant growth and stress tolerance. Therefore, understanding the molecular mechanisms of the pomegranate GRAS gene family under salt stress is essential.
Advances in genomics and molecular biology have facilitated detailed explorations of genome structure, function, and evolution in numerous species. In parallel, genome-wide identification and functional analyses of GRAS family members have been conducted in various plants, including model species (Arabidopsis, rice [41]), cash crops (maize [42], soybean [43]), and fruit trees (grapevine [44], kiwi [45]). These studies have significantly advanced our understanding of the multifaceted roles of GRAS transcription factors in stress responses and plant development. In our study, we identified 54 GRAS genes in pomegranate—a number similar to that in tomato (53) [46], higher than in Arabidopsis (34) [41], cucumber (37) [47], and grapevine (43) [44], but lower than in poplar (106) [48] and kiwifruit (88) [45]. Such differences in gene family size likely reflect variations in genome size and the extent of gene duplication events during evolution.
Phylogenetic analysis classified the PgGRAS genes into eight subfamilies (SCR, SCL3, PAT1, HAM, SHR, LISCL, LAS, and DELLA), a categorization consistent with studies in other species such as Chinese cedar [48], kiwifruit [45], and Rubus occidentalis [49]. This conservation across diverse organisms suggests that the GRAS gene family has maintained similar evolutionary trajectories. Chromosomal mapping revealed that PgGRAS genes are unevenly distributed across eight chromosomes, with chromosome 1 hosting the largest number, particularly from the PAT1, LISCL, and HAM subfamilies.
Collinearity analyses indicated that segmental duplication events, rather than tandem duplications, have been a key driver in the expansion of the pomegranate GRAS gene family; 20 gene pairs were identified as products of segmental duplication. Furthermore, all paralogous gene pairs exhibited Ka/Ks ratios below 1, signifying that they have been subject to purifying selection. Interspecies collinearity comparisons with Arabidopsis and grape further revealed a closer evolutionary relationship between pomegranate and grape GRAS genes.
Collectively, these findings underscore the importance of gene duplication and purifying selection in shaping the evolution and diversification of the GRAS gene family in pomegranate, laying a robust foundation for future investigations into their specific roles in plant development and stress tolerance.
The physicochemical analysis revealed that all PgGRAS proteins are hydrophilic, with sequence lengths ranging from 297 to 1604 amino acids and a predominant acidic bias. Predicted subcellular localization indicated that most PgGRAS members are found in the cytoplasm, nucleus, or chloroplasts. Moreover, proteins within the same subfamily exhibited similar conserved motifs, structural domains, and gene architectures, which likely underpin their shared regulatory functions. Our analysis identified 10 conserved motifs in pomegranate, with consistent types, numbers, and arrangements within subfamilies, although notable differences were observed between different subfamilies. Importantly, every GRAS protein contains a GRAS or GRAS superfamily domain, while the DELLA domain is uniquely present in the DELLA subfamily—a pattern also observed in species such as Eucalyptus [50], Liriodendron [51], and kiwifruit [45], suggesting that the functional diversity of DELLA proteins is closely linked to these specific structural features. Additionally, gene structure analysis showed that 29 PgGRAS genes (53.7%) lack introns, while the remaining genes contain one to three introns. This pattern of intron loss, also noted in mangosteen [52], tomato [46], and Hibiscus maritimus [53], may be attributed to the prokaryotic origins of GRAS genes through endosymbiotic gene transfer, followed by extensive duplication events during evolution [48].
It is noteworthy that multiple sequence alignment and gene structure analysis of PgGRAS22 and PgGRAS24 in the DELLA subfamily of pomegranate with Arabidopsis was revealed to be highly homologous. Both of them possess distinct DELLA domain and typical GRAS domain. Previous studies have also identified similar domain features in DELLA proteins of other plants. For example, the ClGAI and ClRGA in Cunninghamia lanceolata contain DELLA domains, and they exhibit differential expression under various stress conditions, suggesting a close association with stress responses [48]. Additionally, the DELLA domain was also observed in the VdDELLA members of blueberry, revealing that VdDELLA 2 serves as a crucial regulatory element in response to salt and cold stress [21].
Transcription factors are vital for regulating plant growth and stress responses by binding to specific cis-acting elements in promoter regions, thereby modulating downstream gene expression [54]. In our study, we analyzed the 2000 bp promoter regions upstream of PgGRAS genes and identified diverse cis-acting elements that can be grouped into four functional categories: those associated with plant growth and development, light responsiveness, phytohormone response, and stress adaptation. Notably, light-responsive elements were detected in almost all PgGRAS promoters, although the types and frequencies of these elements varied markedly between subfamilies. This suggests that light conditions might differentially influence the regulatory roles of PgGRAS genes, which aligns with previous findings in rice [41], oat [19], and Phoebe bournei [55].
We found that the majority of members in the PgGRAS gene promoter region contain gibberellin response elements (GARE), enabling them to respond to GA signals and regulate the expression of downstream genes. Certain studies indicate that GARE can interact with other response elements to regulate plant tolerance under abiotic stress. For example, studies have found that light responses elements within the promoter region of Arabidopsis interact with GARE to regulate the expression of the AtGAI gene, consequently enhancing the salt tolerance of plants [56]. Additionally, abscisic acid response elements (ABRE) were identified in PgGRAS24, linked to osmotic regulation under stress conditions; one or more MYB binding sites (MBS) were found in PgGRAS19, PgGRAS22, and PgGRAS23, potentially regulated by MYB transcription factors and participate in salt stress responses through multiple signaling pathways; antioxidant response elements (ARE) were identified in PgGRAS25 and PgGRAS31, which are essential for the scavenging of reactive oxygen species (ROS) generated under stress. Multiple stress-related cis-acting elements have also been observed in GRAS gene members from other plant species. For example, rice OsGRAS23 contains several stress-responsive elements, ARE, DRE, (ABRE), and the study showed that its overexpression improves growth under salt stress [57]; tomato SlGRAS4 and SlGRAS40 exhibited significantly differential expression under salt stress and their promoters are likely to contain cis-elements such as ABRE and DRE [58]; the Phoebe bournei GRAS gene family contains a large number of functional elements associated with abiotic stress responses or hormone signaling, and it has been confirmed that some family members showed differential upregulation under drought, salt, and heat stress [55]. Based on these observations, we hypothesize that pomegranate GRAS genes enhance stress tolerance by orchestrating the expression of stress-responsive genes through the combined actions of stress- and hormone-responsive cis-elements.
Research suggests that the majority of GRAS gene family members implicated in abiotic stress responses belong to the DELLA, LISCL, HAM, SCR, and PAT1 subfamilies [45,50,52,55]. In our study, we examined the expression profiles of various PgGRAS subfamily genes under 200 mM NaCl treatment using qRT-PCR. Notably, the DELLA subfamily genes PgGRAS22 and PgGRAS24 showed a pronounced response to salt stress, peaking at three hours. Under salt stress conditions, the increase in DELLA content is predominantly associated with the regulatory mechanisms of the GA signaling pathway. Stress induces the expression of GA-degrading enzymes, accelerating GA degradation. The diminished GA content weakens the inhibitory impact on DELLA, resulting in DELLA accumulation, thereby suppressing the expansion of growth-related plant cells by regulating multiple signaling pathways and ultimately improving salt tolerance [59]. However, direct analysis of signaling-related genes under salt stress conditions was not performed in the current study. Similar trends have been observed in other species, such as Phoebe bournei, where the DELLA subfamily member PbGRAS16 reached its highest expression at four hours under 10% NaCl treatment [55], and in sugar beet, where BvPgGRAS-21 was significantly upregulated at three hours after 200 mM NaCl treatment [60]. In addition, DELLA has been observed to participate in the regulation of salt stress responses in fruit trees. Taking blueberries as an example, transcriptomic analysis revealed that VdDELLA1, VdDELLA2, and VdDELLA3 were significantly upregulated under salt stress treatment. Among them, VdDELLA2 demonstrated higher expression levels than other members in all tissues, indicating that this gene may play a significant function in modulating blueberry tolerance to salt stress [21]. These findings indicate that DELLA subfamily genes in pomegranate may be highly sensitive to salt stress and perform similar biological functions.
In contrast, HAM (PgGRAS25) and LAS (PgGRAS46) exhibited marked downregulation. This phenomenon may be related to alterations in metabolic pathways and signaling pathways induced by stress, which modulate the expression of key genes in related genes and pathways. Consequently, specific regulatory mechanisms need to be further analyzed and verified. Interestingly, certain members of the same subfamily showed transient downregulation followed by a rebound in expression under continued salt stress, including LISCL (PgGRAS23, PgGRAS42), HAM (PgGRAS36), SCL4/7 (PgGRAS38), and SCR (PgGRAS31). This dynamic pattern is reminiscent of similar trends noted in sugar beet [60], Eucalyptus grandis [50], and Hibiscus maritima [53]. One possible explanation involves a negative feedback mechanism during the early phase of stress, followed by gene reactivation through regulatory pathways as stress persists, ultimately enhancing plant tolerance. This process likely involves a complex network of signals, necessitating further investigation.
In contrast, HAM (PgGRAS19) and PAT1 (PgGRAS5) displayed no significant change in expression relative to controls, suggesting that these genes may not be actively involved in the salt stress response in pomegranate roots. Further studies are needed to elucidate their roles in other tissues or under different stress conditions.
Under normal conditions, GA20ox and GA3ox function as precursor enzymes for the synthesizing of GA and the regulation of its activity. Upon detecting GA signals, plants specifically attach to the receptor GID1, resulting in a structural alteration that enhances its affinity for DELLA proteins, thus forming a stable GA-GID1-DELLA complex [61]. DELLA proteins interact with the ubiquitin E3 ligase complex SCFSLY1/GID2 through their C-terminal GRAS domain, leading to their degradation by the 26S proteasome, which alleviates the DELLA inhibitory impact and therefore promotes plant development. DELLA proteins act as repressors in the gibberellin (GA) signal transduction pathway, thereby exerting a strong influence on plant development, lifecycle regulation, and stress responses. The stabilization of DELLA proteins typically exerts inhibitory effects on plant growth and development, while reducing plant height, can enhance resistance to environmental stress, increase yield, and mitigate losses [62]. Under salt stress conditions, Arabidopsis exhibits suppressed GA signaling and consequent DELLA protein accumulation, ultimately slowing plant growth [59]. Moreover, DELLA proteins are pivotal in helping plants cope with a range of environmental stresses, such as drought and salinity, by regulating reactive oxygen species (ROS) levels and participating in the jasmonic acid signaling pathway [19]. Their activity is further modulated by various hormones involved in plant growth and defense [63].
In this study, we constructed a pBI121-GFP-PgGRAS24 fusion vector and stably transformed it into Arabidopsis thaliana to generate transgenic overexpression lines. To further investigate the salt-tolerance function of PgGRAS24, the stress-resistant physiological indices were measured in both PgGRAS24 overexpression and wild-type Arabidopsis. The results demonstrated that under salt stress, PgGRAS24 overexpression significantly increased proline content and SOD activity while reducing MDA accumulation in Arabidopsis. This trend aligns with previous observations in salt-tolerant plants and other transgenic plants with overexpression of salt-resistant genes. For instance, a study screening 25 rice cultivars revealed that salt-tolerant varieties exhibited markedly higher SOD activity and proline content compared to salt-sensitive varieties [64]. Similarly, transgenic soybeans overexpressing GmGRAS37 showed significantly elevated SOD activity and chlorophyll content coupled with reduced MDA levels relative to controls [43]. Parallel results were observed in Bergenia purpurascens, where Arabidopsis overexpression with BpGRAS9 displayed enhanced antioxidant enzyme activities and proline content under salt stress [65]. These findings are consistent with our results demonstrating that PgGRAS24 overexpression enhances plant salt tolerance. Therefore, we propose that PgGRAS24 likely enhances plant salt tolerance by participating in osmotic regulation and strengthening the antioxidant defense system. Our study provides novel theoretical foundations for elucidating the molecular mechanisms by which pomegranate GRAS transcription factors regulate salt tolerance. Future studies will focus on identifying downstream target genes regulated by PgGRAS24 and elucidating its associated signaling transduction pathways.

5. Conclusions

In this study, 54 GRAS genes were identified in pomegranate and classified into eight subfamilies based on phylogenetic analysis. Members within the same subfamily shared similar conserved motifs and gene structures, indicating comparable functional roles. Collinearity analysis revealed that fragment duplication is the main driver of PgGRAS gene family expansion. Promoter analysis further showed that PgGRAS genes harbor cis-elements involved in plant development, photosynthesis, hormone responses, and stress regulation. qRT-PCR results under salt stress indicated differential expression patterns among subfamilies, underscoring the role of PgGRAS genes in pomegranate’s salinity tolerance. Under salt stress conditions, Arabidopsis overexpression with PgGRAS24 exhibited significantly enhanced salt tolerance, further confirming its ability to improve plant salt resistance. This study not only provides insights into the regulatory mechanisms of pomegranate GRAS transcription factors under salt stress but also establishes a theoretical foundation for breeding salt-tolerant pomegranate cultivars. Overall, this work provides a comprehensive framework for understanding the molecular regulatory mechanisms of GRAS genes in pomegranate under abiotic stress and lays the foundation for future breeding efforts aimed at developing salt-tolerant pomegranate varieties.

Supplementary Materials

The following supporting information can be downloaded at: https://www.mdpi.com/article/10.3390/horticulturae11050504/s1, Table S1: Primer sequences; Table S2: Information of constructing phylogenetic tree.

Author Contributions

Conceptualization, J.H. and Z.Y.; methodology, J.H.; software, J.H. and F.C.; validation, J.H. and H.R.; formal analysis, J.H. and Y.T.; data curation, J.H.; writing—original draft preparation, J.H.; writing—review and editing, X.Z. and Z.Y.; visualization, J.H.; supervision, Z.Y.; funding acquisition, Z.Y. All authors have read and agreed to the published version of the manuscript.

Funding

This research received no external funding.

Institutional Review Board Statement

Not applicable.

Informed Consent Statement

Not applicable.

Data Availability Statement

The Punica granatum Genome data were obtained from the Sequence Read Archive (SRA) database of the NCBI under accession number ASM765513v2.

Conflicts of Interest

The authors declare no conflicts of interest.

References

  1. Sun, X.; Xue, B.; Jones, W.T.; Rikkerink, E.; Dunker, A.K.; Uversky, V.N. A Functionally Required Unfoldome from the Plant Kingdom: Intrinsically Disordered N-Terminal Domains of GRAS Proteins Are Involved in Molecular Recognition during Plant Development. Plant Mol. Biol. 2011, 77, 205–223. [Google Scholar] [CrossRef] [PubMed]
  2. Wang, Y.-X.; Liu, Z.-W.; Wu, Z.-J.; Li, H.; Wang, W.-L.; Cui, X.; Zhuang, J. Genome-Wide Identification and Expression Analysis of GRAS Family Transcription Factors in Tea Plant (Camellia sinensis). Sci. Rep. 2018, 8, 3949. [Google Scholar] [CrossRef] [PubMed]
  3. Ho-Plágaro, T.; Molinero-Rosales, N.; Fariña Flores, D.; Villena Díaz, M.; García-Garrido, J.M. Identification and Expression Analysis of GRAS Transcription Factor Genes Involved in the Control of Arbuscular Mycorrhizal Development in Tomato. Front. Plant Sci. 2019, 10, 268. [Google Scholar] [CrossRef] [PubMed]
  4. Peng, J.; Carol, P.; Richards, D.E.; King, K.E.; Cowling, R.J.; Murphy, G.P.; Harberd, N.P. The Arabidopsis GAI Gene Defines a Signaling Pathway That Negatively Regulates Gibberellin Responses. Genes Dev. 1997, 11, 3194–3205. [Google Scholar] [CrossRef]
  5. Di Laurenzio, L.; Wysocka-Diller, J.; Malamy, J.E.; Pysh, L.; Helariutta, Y.; Freshour, G.; Hahn, M.G.; Feldmann, K.A.; Benfey, P.N. The SCARECROW Gene Regulates an Asymmetric Cell Division That Is Essential for Generating the Radial Organization of the Arabidopsis Root. Cell 1996, 86, 423–433. [Google Scholar] [CrossRef]
  6. Bolle, C. The Role of GRAS Proteins in Plant Signal Transduction and Development. Planta 2004, 218, 683–692. [Google Scholar] [CrossRef]
  7. Liu, X.; Widmer, A. Genome-Wide Comparative Analysis of the GRAS Gene Family in Populus, Arabidopsis and Rice. Plant Mol. Biol. Rep. 2014, 32, 1129–1145. [Google Scholar] [CrossRef]
  8. Waseem, M.; Nkurikiyimfura, O.; Niyitanga, S.; Jakada, B.H.; Shaheen, I.; Aslam, M.M. GRAS Transcription Factors Emerging Regulator in Plants Growth, Development, and Multiple Stresses. Mol. Biol. Rep. 2022, 49, 9673–9685. [Google Scholar] [CrossRef]
  9. Wang, Y.; Shi, S.; Zhou, Y.; Zhou, Y.; Yang, J.; Tang, X. Genome-Wide Identification and Characterization of GRAS Transcription Factors in Sacred Lotus (Nelumbo nucifera). PeerJ 2016, 4, e2388. [Google Scholar] [CrossRef]
  10. Pysh, L.D.; Wysocka-Diller, J.W.; Camilleri, C.; Bouchez, D.; Benfey, P.N. The GRAS Gene Family in Arabidopsis: Sequence Characterization and Basic Expression Analysis of the SCARECROW-LIKE Genes. Plant J. 1999, 18, 111–119. [Google Scholar] [CrossRef]
  11. Hou, S.; Zhang, Q.; Chen, J.; Meng, J.; Wang, C.; Du, J.; Guo, Y. Genome-Wide Identification and Analysis of the GRAS Transcription Factor Gene Family in Theobroma cacao. Genes 2022, 14, 57. [Google Scholar] [CrossRef] [PubMed]
  12. Zhao, Q.; Anwar, A.; Zhang, H.; Zhang, S.; He, L.; Wang, F.; Gao, J. The Fundamental Role of DELLA Protein and Regulatory Mechanism during Plant Growth and Development. Not. Bot. Horti Agrobot. Cluj-Napoca 2021, 49, 12561. [Google Scholar] [CrossRef]
  13. Torres-Galea, P.; Hirtreiter, B.; Bolle, C. Two GRAS Proteins, SCARECROW-LIKE21 and PHYTOCHROME A SIGNAL TRANSDUCTION1, Function Cooperatively in Phytochrome a Signal Transduction. Plant Physiol. 2012, 161, 291–304. [Google Scholar] [CrossRef]
  14. Yoshida, H.; Ueguchi-Tanaka, M. DELLA and SCL3 Balance Gibberellin Feedback Regulation by Utilizing INDETERMINATE DOMAIN Proteins as Transcriptional Scaffolds. Plant Signal. Behav. 2014, 9, e29726. [Google Scholar] [CrossRef]
  15. Zhang, B.; Liu, J.; Yang, Z.E.; Chen, E.Y.; Zhang, C.J.; Zhang, X.Y.; Li, F.G. Genome-Wide Analysis of GRAS Transcription Factor Gene Family in Gossypium hirsutum L. BMC Genom. 2018, 19, 348. [Google Scholar] [CrossRef]
  16. Clark, N.M.; Hinde, E.; Winter, C.M.; Fisher, A.P.; Crosti, G.; Blilou, I.; Gratton, E.; Benfey, P.N.; Sozzani, R. Tracking Transcription Factor Mobility and Interaction in Arabidopsis Roots with Fluorescence Correlation Spectroscopy. eLife 2016, 5, e14770. [Google Scholar] [CrossRef]
  17. Choe, J.; Kim, B.; Yoon, E.K.; Jang, S.; Kim, G.; Dhar, S.; Lee, S.A.; Lim, J. Characterization of the GRAS Transcription Factor SCARECROW-LIKE 28’s Role in Arabidopsis Root Growth. J. Plant Biol. 2017, 60, 462–471. [Google Scholar] [CrossRef]
  18. Dutta, M.; Saha, A.; Moin, M.; Kirti, P.B. Genome-Wide Identification, Transcript Profiling and Bioinformatic Analyses of GRAS Transcription Factor Genes in Rice. Front. Plant Sci. 2021, 12, 777285. [Google Scholar] [CrossRef]
  19. Pan, J.; Zhou, Q.; Wang, H.; Chen, Y.; Wang, Z.; Zhang, J. Genome-Wide Identification and Characterization of Abiotic Stress Responsive GRAS Family Genes in Oat (Avena sativa). PeerJ 2023, 11, e15370. [Google Scholar] [CrossRef]
  20. Shan, Z.; Luo, X.; Wu, M.; Wei, L.; Fan, Z.; Zhu, Y. Genome-Wide Identification and Expression of GRAS Gene Family Members in Cassava. BMC Plant Biol. 2020, 20, 46. [Google Scholar] [CrossRef]
  21. Zhou, H.; Wang, Y.; Wang, X.; Cheng, R.; Zhang, H.; Yang, L. Genome-Wide Characterization of DELLA Gene Family in Blueberry (Vaccinium darrowii) and Their Expression Profiles in Development and Response to Abiotic Stress. BMC Genom. 2024, 25, 815. [Google Scholar] [CrossRef] [PubMed]
  22. Ma, H.-S.; Liang, D.; Shuai, P.; Xia, X.-L.; Yin, W.-L. The Salt- and Drought-Inducible Poplar GRAS Protein SCL7 Confers Salt and Drought Tolerance in Arabidopsis thaliana. J. Exp. Bot. 2010, 61, 4011–4019. [Google Scholar] [CrossRef] [PubMed]
  23. He, Z.; Tian, Z.; Zhang, Q.; Wang, Z.; Huang, R.; Xu, X.; Wang, Y.; Ji, X. Genome-Wide Identification, Expression and Salt Stress Tolerance Analysis of the GRAS Transcription Factor Family in Betula platyphylla. Front. Plant Sci. 2022, 13, 1022076. [Google Scholar] [CrossRef]
  24. Qin, G.; Xu, C.; Ming, R.; Tang, H.; Guyot, R.; Kramer, E.M.; Hu, Y.; Yi, X.; Qi, Y.; Xu, X.; et al. The Pomegranate (Punica granatum L.) Genome and the Genomics of Punicalagin Biosynthesis. Plant J. 2017, 91, 1108–1128. [Google Scholar] [CrossRef]
  25. Abid, M.; Yaich, H.; Cheikhrouhou, S.; Khemakhem, I.; Bouaziz, M.; Attia, H.; Ayadi, M.A. Antioxidant Properties and Phenolic Profile Characterization by LC–MS/MS of Selected Tunisian Pomegranate Peels. J. Food Sci. Technol. 2017, 54, 2890–2901. [Google Scholar] [CrossRef]
  26. Caruso, A.; Barbarossa, A.; Tassone, A.; Ceramella, J.; Carocci, A.; Catalano, A.; Basile, G.; Fazio, A.; Iacopetta, D.; Franchini, C.; et al. Pomegranate: Nutraceutical with Promising Benefits on Human Health. Appl. Sci. 2020, 10, 6915. [Google Scholar] [CrossRef]
  27. Liu, C.; Zhao, X.; Yan, J.; Yuan, Z.; Gu, M. Effects of Salt Stress on Growth, Photosynthesis, and Mineral Nutrients of 18 Pomegranate (Punica granatum) Cultivars. Agronomy 2020, 10, 27. [Google Scholar] [CrossRef]
  28. Altschul, S.F.; Gish, W.; Miller, W.; Myers, E.W.; Lipman, D.J. Basic Local Alignment Search Tool. J. Mol. Biol. 1990, 215, 403–410. [Google Scholar] [CrossRef]
  29. Finn, R.D.; Clements, J.; Eddy, S.R. HMMER Web Server: Interactive Sequence Similarity Searching. Nucleic Acids Res. 2011, 39, W29–W37. [Google Scholar] [CrossRef]
  30. Larkin, M.A.; Blackshields, G.; Brown, N.P.; Chenna, R.; McGettigan, P.A.; McWilliam, H.; Valentin, F.; Wallace, I.M.; Wilm, A.; Lopez, R.; et al. Clustal W and Clustal X Version 2.0. Bioinformatics 2007, 23, 2947–2948. [Google Scholar] [CrossRef]
  31. Kumar, S.; Nei, M.; Dudley, J.; Tamura, K. MEGA: A Biologist-Centric Software for Evolutionary Analysis of DNA and Protein Sequences. Brief. Bioinform. 2008, 9, 299–306. [Google Scholar] [CrossRef] [PubMed]
  32. Letunic, I.; Bork, P. Interactive Tree of Life (iTOL) v5: An Online Tool for Phylogenetic Tree Display and Annotation. Nucleic Acids Res. 2021, 49, W293–W296. [Google Scholar] [CrossRef] [PubMed]
  33. Bailey, T.L.; Boden, M.; Buske, F.A.; Frith, M.; Grant, C.E.; Clementi, L.; Ren, J.; Li, W.W.; Noble, W.S. MEME Suite: Tools for Motif Discovery and Searching. Nucleic Acids Res. 2009, 37, W202–W208. [Google Scholar] [CrossRef] [PubMed]
  34. Chen, C.; Chen, H.; Zhang, Y.; Thomas, H.R.; Frank, M.H.; He, Y.; Xia, R. TBtools: An Integrative Toolkit Developed for Interactive Analyses of Big Biological Data. Mol. Plant 2020, 13, 1194–1202. [Google Scholar] [CrossRef]
  35. Hu, B.; Jin, J.; Guo, A.-Y.; Zhang, H.; Luo, J.; Gao, G. GSDS 2.0: An Upgraded Gene Feature Visualization Server. Bioinformatics 2015, 31, 1296–1297. [Google Scholar] [CrossRef]
  36. Rombauts, S.; Déhais, P.; Van Montagu, M.; Rouzé, P. PlantCARE, a Plant Cis-Acting Regulatory Element Database. Nucleic Acids Res. 1999, 27, 295–296. [Google Scholar] [CrossRef]
  37. Wang, Y.; Tang, H.; DeBarry, J.D.; Tan, X.; Li, J.; Wang, X.; Lee, T.; Jin, H.; Marler, B.; Guo, H.; et al. MCScanX: A Toolkit for Detection and Evolutionary Analysis of Gene Synteny and Collinearity. Nucleic Acids Res. 2012, 40, e49. [Google Scholar] [CrossRef]
  38. Liang, Y.; Urano, D.; Liao, K.-L.; Hedrick, T.L.; Gao, Y.; Jones, A.M. A Nondestructive Method to Estimate the Chlorophyll Content of Arabidopsis Seedlings. Plant Methods 2017, 13, 26. [Google Scholar] [CrossRef]
  39. Shabnam, N.; Tripathi, I.; Sharmila, P.; Pardha-Saradhi, P. A Rapid, Ideal, and Eco-Friendlier Protocol for Quantifying Proline. Protoplasma 2016, 253, 1577–1582. [Google Scholar] [CrossRef]
  40. De Leon, J.A.D.; Borges, C.R. Evaluation of Oxidative Stress in Biological Samples Using the Thiobarbituric Acid Reactive Substances Assay. J. Vis. Exp. JoVE 2020, 159, e61122. [Google Scholar] [CrossRef]
  41. Tian, C.G.; Wan, P.; Sun, S.H.; Li, J.Y.; Chen, M.S. Genome-Wide Analysis of the GRAS Gene Family in Rice and Arabidopsis. Plant Mol. Biol. 2004, 54, 519–532. [Google Scholar] [CrossRef]
  42. Guo, Y.; Wu, H.; Li, X.; Li, Q.; Zhao, X.; Duan, X.; An, Y.; Lv, W.; An, H. Identification and Expression of GRAS Family Genes in Maize (Zea mays L.). PLoS ONE 2017, 12, e0185418. [Google Scholar] [CrossRef] [PubMed]
  43. Wang, T.-T.; Yu, T.-F.; Fu, J.-D.; Su, H.-G.; Chen, J.; Zhou, Y.-B.; Chen, M.; Guo, J.; Ma, Y.-Z.; Wei, W.-L.; et al. Genome-Wide Analysis of the GRAS Gene Family and Functional Identification of GmGRAS37 in Drought and Salt Tolerance. Front. Plant Sci. 2020, 11, 604690. [Google Scholar] [CrossRef] [PubMed]
  44. Sun, X.; Xie, Z.; Zhang, C.; Mu, Q.; Wu, W.; Wang, B.; Fang, J. A Characterization of Grapevine of GRAS Domain Transcription Factor Gene Family. Funct. Integr. Genom. 2016, 16, 347–363. [Google Scholar] [CrossRef] [PubMed]
  45. Zhu, L.; Yin, T.; Zhang, M.; Yang, X.; Wu, J.; Cai, H.; Yang, N.; Li, X.; Wen, K.; Chen, D.; et al. Genome-Wide Identification and Expression Pattern Analysis of the Kiwifruit GRAS Transcription Factor Family in Response to Salt Stress. BMC Genom. 2024, 25, 12. [Google Scholar] [CrossRef]
  46. Huang, W.; Xian, Z.; Kang, X.; Tang, N.; Li, Z. Genome-Wide Identification, Phylogeny and Expression Analysis of GRAS Gene Family in Tomato. BMC Plant Biol. 2015, 15, 209. [Google Scholar] [CrossRef]
  47. Li, C.; Dong, S.; Liu, X.; Bo, K.; Miao, H.; Beckles, D.M.; Zhang, S.; Gu, X. Genome-Wide Characterization of Cucumber (Cucumis sativus L.) GRAS Genes and Their Response to Various Abiotic Stresses. Horticulturae 2020, 6, 110. [Google Scholar] [CrossRef]
  48. Luo, Y.; Jin, M.; Yang, J.; Yang, Y.; Guo, R.; Luo, H.; Guo, T.; Xu, J. Genome-Wide Identification of GRAS Gene Family in Cunninghamia lanceolata and Expression Pattern Analysis of ClDELLA Protein Under Abiotic Stresses. Int. J. Mol. Sci. 2024, 25, 12262. [Google Scholar] [CrossRef]
  49. Bai, Y.; Liu, H.; Zhu, K.; Cheng, Z.-M. Evolution and Functional Analysis of the GRAS Family Genes in Six Rosaceae Species. BMC Plant Biol. 2022, 22, 569. [Google Scholar] [CrossRef]
  50. Lu, H.; Xu, J.; Li, G.; Zhong, T.; Chen, D.; Lv, J. Genome-Wide Identification and Expression Analysis of GRAS Gene Family in Eucalyptus grandis. BMC Plant Biol. 2024, 24, 573. [Google Scholar] [CrossRef]
  51. Weng, Y.; Chen, X.; Hao, Z.; Lu, L.; Wu, X.; Zhang, J.; Wu, J.; Shi, J.; Chen, J. Genome-Wide Analysis of the GRAS Gene Family in Liriodendron chinense Reveals the Putative Function in Abiotic Stress and Plant Development. Front. Plant Sci. 2023, 14, 1211853. [Google Scholar] [CrossRef] [PubMed]
  52. Zhao, X.; Xu, Y.; He, G.; He, K.; Xiao, L.; Hu, R.; Li, S. Genome-Wide Characterization and Expression Profiling of the GRAS Gene Family in Salt and Alkali Stresses in Miscanthus sinensis. Int. J. Mol. Sci. 2022, 23, 14521. [Google Scholar] [CrossRef] [PubMed]
  53. Ni, L.; Wang, Z.; Liu, X.; Wu, S.; Hua, J.; Liu, L.; Yin, Y.; Li, H.; Gu, C. Genome-Wide Study of the GRAS Gene Family in Hibiscus hamabo Sieb. et Zucc and Analysis of HhGRAS14-Induced Drought and Salt Stress Tolerance in Arabidopsis. Plant Sci. 2022, 319, 111260. [Google Scholar] [CrossRef] [PubMed]
  54. Chen, Y.; Huang, L.; Yan, H.; Zhang, X.; Xu, B.; Ma, X. Cloning and Characterization of an ABA-Independent DREB Transcription Factor Gene, HcDREB2, in Hemarthria compressa. Hereditas 2016, 153, 3. [Google Scholar] [CrossRef]
  55. Chang, J.; Fan, D.; Lan, S.; Cheng, S.; Chen, S.; Lin, Y.; Cao, S. Genome-Wide Identification, Expression and Stress Analysis of the GRAS Gene Family in Phoebe bournei. Plants 2023, 12, 2048. [Google Scholar] [CrossRef]
  56. Arain, S.; Meer, M.; Sajjad, M.; Yasmin, H. Light Contributes to Salt Resistance through GAI Protein Regulation in Arabidopsis Thaliana. Plant Physiol. Biochem. 2021, 159, 1–11. [Google Scholar] [CrossRef]
  57. Xu, K.; Chen, S.; Li, T.; Ma, X.; Liang, X.; Ding, X.; Liu, H.; Luo, L. OsGRAS23, a Rice GRAS Transcription Factor Gene, Is Involved in Drought Stress Response through Regulating Expression of Stress-Responsive Genes. BMC Plant Biol. 2015, 15, 141. [Google Scholar] [CrossRef]
  58. Niu, Y.; Zhao, T.; Xu, X.; Li, J. Genome-Wide Identification and Characterization of GRAS Transcription Factors in Tomato (Solanum lycopersicum). PeerJ 2017, 5, e3955. [Google Scholar] [CrossRef]
  59. Achard, P.; Cheng, H.; Grauwe, L.D.; Decat, J.; Schoutteten, H.; Moritz, T.; Straeten, D.V.D.; Peng, J.; Harberd, N.P. Integration of Plant Responses to Environmentally Activated Phytohormonal Signals. Science 2006, 311, 91–94. [Google Scholar] [CrossRef]
  60. Hao, X.; Gong, Y.; Chen, S.; Ma, C.; Duanmu, H. Genome-Wide Identification of GRAS Transcription Factors and Their Functional Analysis in Salt Stress Response in Sugar Beet. Int. J. Mol. Sci. 2024, 25, 7132. [Google Scholar] [CrossRef]
  61. Sun, T. The Molecular Mechanism and Evolution of the GA–GID1–DELLA Signaling Module in Plants. Curr. Biol. 2011, 21, R338–R345. [Google Scholar] [CrossRef] [PubMed]
  62. Li, Z.; Tu, Q.; Lyu, X.; Cheng, Q.; Ji, R.; Qin, C.; Liu, J.; Liu, B.; Li, H.; Zhao, T. GmSTF Accumulation Mediated by DELLA Protein GmRGAs Contributes to Coordinating Light and Gibberellin Signaling to Reduce Plant Height in Soybean. Crop J. 2024, 12, 432–442. [Google Scholar] [CrossRef]
  63. Sun, X.; Jones, W.T.; Harvey, D.; Edwards, P.J.B.; Pascal, S.M.; Kirk, C.; Considine, T.; Sheerin, D.J.; Rakonjac, J.; Oldfield, C.J.; et al. N-Terminal Domains of DELLA Proteins Are Intrinsically Unstructured in the Absence of Interaction with GID1/Gibberellic Acid Receptors. J. Biol. Chem. 2010, 285, 11557–11571. [Google Scholar] [CrossRef] [PubMed]
  64. Ganie, S.A.; Molla, K.A.; Henry, R.J.; Bhat, K.V.; Mondal, T.K. Advances in Understanding Salt Tolerance in Rice. Theor. Appl. Genet. 2019, 132, 851–870. [Google Scholar] [CrossRef]
  65. Lyu, X.; Xu, N.; Chen, J.; Wang, W.; Yan, F.; Jiang, Z.; Zhu, Q. Identification and Expression Pattern Analysis of BpGRAS Gene Family in Bergenia purpurascens and Functional Characterization of BpGRAS9 in Salt Tolerance. Plant Mol. Biol. 2025, 115, 33. [Google Scholar] [CrossRef]
Figure 1. The phylogenetic tree was constructed using GRAS protein sequences from both Arabidopsis thaliana and Punica granatum. Nine GRAS subfamilies were annotated using different colors, with red stars for PgGRAS, green dots for AtGRAS, and bootstrap represented by red triangles.
Horticulturae 11 00504 g001
Figure 2. Structural characteristics of pomegranate GRAS proteins. (A) Conserved motifs of PgGRAS proteins. On the left is a phylogenetic tree constructed based on the 54 full-length amino acid sequences of PgGRAS. Different colored rectangles on the right side represent different motifs and their positions in the GRAS protein sequences. (B) Structural domain analysis of PgGRAS proteins. (C) Exon–intron structures of PgGRAS genes. The UTR region, exons and intron are represented by green rectangles, yellow rectangles, and black lines. (D) The HMM logo of conserved structural domains in PgGRAS proteins. The horizontal axis denotes the sequence position, the vertical axis indicates the in-formativeness of the bases, and the height of the letter represents the frequency of the amino acid appearing at the position.
Horticulturae 11 00504 g002
Figure 3. Predictions of the cis-acting element on the 2000 bp upstream region of the 54 PgGRAS genes. On the left is a phylogenetic tree of the pomegranate GRAS gene family, with each of the 20 cis-acting elements labeled in different colors.
Horticulturae 11 00504 g003
Figure 4. Chromosomal localization of PgGRAS genes.
Horticulturae 11 00504 g004
Figure 5. Collinearity analysis of the pomegranate GRAS gene family. Gene pairs of PgGRAS that have experienced gene duplication events are represented by red line connections, gray lines indicate covariance blocks within the pomegranate genome, gray boxes in the inner circle illustrate pomegranate chromosomes, and heatmaps along with line plots depict gene densities on different chromosomes.
Horticulturae 11 00504 g005
Figure 6. Interspecific collinearity analysis between pomegranate and two other species: Arabidopsis thaliana and Vitis vinifera. Gray lines indicate blocks of covariance in the interspecific genomes, and blue lines indicate interspecific homologous gene pairs.
Horticulturae 11 00504 g006
Figure 7. (A) Multiple sequence alignments between pomegranate and Arabidopsis DELLA proteins. Purple boxes represent DELLA structural domains and red boxes represent GRAS structural domains. Black, pink, and blue colors are used to indicate amino acid conservation. (B) Conserved motifs and structural domains of pomegranate and Arabidopsis DELLA proteins.
Horticulturae 11 00504 g007
Figure 8. Transcriptional responses under saline conditions on root tissues of pomegranate. The horizontal and vertical axes indicate the treatment time and relative expression level. The expression levels of the 12 PgGRAS were calculated using 2−ΔΔCt. The data show the mean ± SD of three biological replicates, using different letters to indicate significant differences; p < 0.05.
Horticulturae 11 00504 g008
Figure 9. Measurement of root length and phenotype analysis of PgGRAS24 transgenic Arabidopsis lines after salt stress treatment. (A) Root length phenotype of Arabidopsis. (B) Changes in root length of Arabidopsis. (C) Comparative analysis of plant height in Arabidopsis. (D) Phenotype of transgenic Arabidopsis lines and wild-type Arabidopsis under 0 mM NaCl treatment. (E) Phenotype of transgenic Arabidopsis lines and wild-type Arabidopsis under 200 mM NaCl treatment. Notes: **: p < 0.01.
Horticulturae 11 00504 g009
Figure 10. Physiological indices of PgGRAS24 transgenic and wild-type Arabidopsis lines under salt stress treatment. (A) Total Chlorophyll content. (B) Proline content. (C) Superoxide dismutase (SOD) activity. (D) Malondialdehyde (MDA) content. Notes: *: p < 0.05; **: p < 0.01; ***: p < 0.001.
Horticulturae 11 00504 g010
Table 1. Sequence information of pomegranate GRAS gene family.
Gene IDGene NamemRNA Sequence IDProtein Sequence IDLength
(aa)
kDapIInstability IndexAliphatic IndexGRAVYSubcellular Location
116187514PgGRAS1XM_031516257.1XP_031372117.151056.795.9543.0587.82−0.244Cytoplasmic
116187891PgGRAS2XM_031516894.1XP_031372754.150054.615.5336.1281.98−0.159Cytoplasmic
116188025PgGRAS3XM_031517128.1XP_031372988.149855.946.5157.1396.71−0.071Cytoplasmic
116188061PgGRAS4XM_031517177.1XP_031373037.168376.637.5845.5877.82−0.445Nuclear
116188620PgGRAS5XM_031518092.1XP_031373952.154160.944.9950.3582.01−0.389Nuclear
116188711PgGRAS6XM_031518093.1XP_031373953.154160.944.9950.3582.01−0.389Nuclear
116189521PgGRAS7XM_031518094.1XP_031373954.154160.944.9950.3582.01−0.389Nuclear
116190128PgGRAS8XM_031519789.1XP_031375649.152458.395.9347.785.04−0.223Chloroplast
116192510PgGRAS9XM_031521068.1XP_031376928.158767.245.2146.188.82−0.376peroxidase
116192682PgGRAS10XM_031521295.1XP_031377155.145448.875.0754.6588.57−0.147Chloroplast
116192866PgGRAS11XM_031521552.1XP_031377412.174383.756.4842.6478.12−0.445Chloroplast
116193265PgGRAS12XM_031522080.1XP_031377940.158264.525.0646.4582.34−0.304Nuclear
116194169PgGRAS13XM_031522921.1XP_031378781.144950.235.1348.2388.62−0.169Chloroplast
116194523PgGRAS14XM_031523342.1XP_031379202.150256.364.6950.0378.11−0.33Cytoplasmic
116195364PgGRAS15XM_031524504.1XP_031380364.129731.574.6737.8883.2−0.014Chloroplast
116196333PgGRAS16XM_031526002.1XP_031381862.169477.276.0455.2876.9−0.441Nuclear
116198598PgGRAS17XM_031528783.1XP_031384643.146852.545.6144.8887.76−0.177Cytoplasmic
116198662PgGRAS18XM_031528866.1XP_031384726.154259.716.0942.4673.51−0.5peroxidase
116199139PgGRAS19XM_031529433.1XP_031385293.154959.345.9145.4684.08−0.107Nuclear
116199452PgGRAS20XM_031529799.1XP_031385659.169778.265.6654.0470.92−0.483Nuclear
116200022PgGRAS21XM_031530678.1XP_031386538.179988.904.9954.1572.6−0.504Nuclear
116200713PgGRAS22XM_031531571.1XP_031387431.179987.175.7346.1490.66−0.118Cytoplasmic
116201968PgGRAS23XM_031533456.1XP_031389316.174684.23658.1868.4−0.489Nuclear
116203867PgGRAS24XM_031535825.1XP_031391685.160265.635.0351.8981.23−0.263Nuclear
116204084PgGRAS25XM_031536147.1XP_031392007.171777.856.1860.1581.23−0.23Nuclear
116204827PgGRAS26XM_031537145.1XP_031393005.159464.047.6152.1482.19−0.272Nuclear
116204912PgGRAS27XM_031537281.1XP_031393141.148855.685.9846.6879.73−0.455Nuclear
116205051PgGRAS28XM_031537492.1XP_031393352.149255.125.5345.9977.89−0.272Nuclear
116206171PgGRAS29XM_031538964.1XP_031394824.151057.406.0448.2383.96−0.293Nuclear
116206537PgGRAS30XM_031538965.1XP_031394825.151057.406.0448.2383.96−0.293Nuclear
116206862PgGRAS31XM_031539687.1XP_031395547.181286.505.855.4782.57−0.206Nuclear
116207812PgGRAS32XM_031540907.1XP_031396767.171881.266.2449.6578.23−0.506Nuclear
116207917PgGRAS33XM_031541038.1XP_031396898.154160.905.7247.8376.97−0.377Nuclear
116208367PgGRAS34XM_031541757.1XP_031397617.142747.787.6146.5592.9−0.103Nuclear
116208829PgGRAS35XM_031542392.1XP_031398252.154561.095.8152.6663.39−0.526Chloroplast
116208927PgGRAS36XM_031542502.1XP_031398362.150255.954.7644.2870.76−0.359Chloroplast
116208955PgGRAS37XM_031542532.1XP_031398392.157364.615.6635.7888.45−0.213Cytoplasmic
116209919PgGRAS38XM_031543677.1XP_031399537.162168.025.4662.472.8−0.417Nuclear
116209979PgGRAS39XM_031543751.1XP_031399611.147052.355.9949.3890.72−0.183Nuclear
116211438PgGRAS40XM_031545827.1XP_031401687.136942.499.5438.9188.75−0.328Cytoplasmic
116211781PgGRAS41XM_031546293.1XP_031402153.152357.915.8145.3387.09−0.107Chloroplast
116212322PgGRAS42XM_031546873.1XP_031402733.11604181.475.7350.9172.19−0.535Nuclear
116212548PgGRAS43XM_031547221.1XP_031403081.147553.675.8656.1194.91−0.187Nuclear
116213071PgGRAS44XM_031547880.1XP_031403740.156763.855.6642.8879.28−0.345Cytoplasmic
116213118PgGRAS45XM_031547939.1XP_031403799.143749.225.1143.9687.51−0.231Cytoplasmic
116213186PgGRAS46XM_031548035.1XP_031403895.142347.367.0853.1384.68−0.326Nuclear
116213207PgGRAS47XM_031548059.1XP_031403919.154060.605.2951.2781.28−0.396Cytoplasmic
116213387PgGRAS48XM_031548069.1XP_031403929.154060.605.2951.2781.28−0.396Cytoplasmic
116213541PgGRAS49XM_031548074.1XP_031403934.154060.605.2951.2781.28−0.396Cytoplasmic
116213862PgGRAS50XM_031548083.1XP_031403943.154060.605.2951.2781.28−0.396Cytoplasmic
116214098PgGRAS51XM_031549390.1XP_031405250.170477.605.8256.7475.82−0.382Cytoplasmic
116214877PgGRAS52XM_031550360.1XP_031406220.156863.776.3149.5979.52−0.427Cytoplasmic
116214902PgGRAS53XM_031550361.1XP_031406221.156863.776.3149.5979.52−0.427Cytoplasmic
116214918PgGRAS54XM_031550419.1XP_031406279.171778.445.7966.9578.97−0.3Nuclear
Table 2. Ka/Ks values of paralogous homologous gene pairs within the PgGRAS family.
Sequence1Sequence2KaKsKa/Ks
PgGRAS8PgGRAS300.30622.18130.1404
PgGRAS8PgGRAS330.43442.44130.1779
PgGRAS9PgGRAS370.47141.88630.2499
PgGRAS11PgGRAS40.37352.49690.1496
PgGRAS11PgGRAS160.32283.57330.0903
PgGRAS14PgGRAS360.47812.00150.2389
PgGRAS16PgGRAS40.32221.76300.1828
PgGRAS16PgGRAS230.43943.66140.1200
PgGRAS16PgGRAS420.42362.28010.1858
PgGRAS19PgGRAS380.81561.29330.6307
PgGRAS23PgGRAS320.44973.88210.1158
PgGRAS23PgGRAS420.31001.67360.1853
PgGRAS28PgGRAS330.32501.96660.1653
PgGRAS32PgGRAS400.44102.28150.1933
PgGRAS41PgGRAS30.25581.49110.1715
PgGRAS42PgGRAS40.45922.47600.1855
PgGRAS47PgGRAS520.24593.56830.0689
Disclaimer/Publisher’s Note: The statements, opinions and data contained in all publications are solely those of the individual author(s) and contributor(s) and not of MDPI and/or the editor(s). MDPI and/or the editor(s) disclaim responsibility for any injury to people or property resulting from any ideas, methods, instructions or products referred to in the content.

