Abstract
Iron deficiency chlorosis severely limits the productivity of ‘Yali’ pears in alkaline soils. This study systematically investigated the physiological and molecular responses of ‘Yali’ pears to varying degrees of iron deficiency, focusing on the roles of PbFRO2 (Pyrus bretschneideri Ferric Reductase Oxidase 2), PbIRT1 (Pyrus bretschneideri Iron-Regulated Transporter 1), and PbCS2 (Pyrus bretschneideri Citrate Synthase 2) in iron uptake and homeostasis. Based on field observations, pear trees were categorized into normal, moderately chlorotic, and severely chlorotic groups. Results demonstrated that moderate iron deficiency upregulated PbFRO2 (2.86–7.09-fold), enhanced root ferric reductase (FCR) activity, and promoted Fe3+ reduction and Fe2+ transport. In contrast, severe deficiency suppressed the expression of these genes and reduced photosynthetic efficiency. Leaf citrate content significantly increased with chlorosis severity, while root citrate content exhibited seasonal fluctuations, peaking in July. Multivariate analyses (PCA and PLS-DA) revealed distinct physiological clustering: normal and moderately chlorotic groups overlapped, whereas the severely chlorotic group formed a separate cluster, reflecting a transition from compensatory activation to metabolic collapse. PbFRO2 emerged as a central regulator, driving root iron storage in spring and redistribution in summer. These findings elucidate a biphasic adaptation strategy, where moderate deficiency triggers gene-mediated iron mobilization, whereas severe stress disrupts homeostasis. This study provides critical insights into iron metabolism dynamics and proposes PbFRO2 as a molecular target for breeding iron-efficient pear cultivars.
1. Introduction
Iron is a critical micronutrient essential for plant growth and development, playing a crucial role in the function of many enzymes and proteins. It is involved in important physiological processes such as nitrogen fixation, photosynthesis, respiration, and nucleic acid synthesis. Iron deficiency chlorosis is a global limiting factor for plant growth, manifesting as chlorosis, slow growth, and significant reductions in fruit yield and quality, including soybean (Glycine max (L.) Merr.) [1], grapevine (Vitis vinifera L.) [2], and citrus (Citrus spp.) [3]. In previous reports, the optimal soil pH range for plant iron absorption is typically between 4.0 and 6.0, which falls within the slightly acidic to weakly acidic range. Within this pH range, iron exists primarily in the soluble ferrous form (Fe2+) that can be directly absorbed and utilized by plant roots. When soil pH exceeds 7.0 (neutral or alkaline), iron tends to form insoluble ferric hydroxide (Fe3+) or iron oxide precipitates, significantly reducing its availability and potentially inducing iron-deficiency chlorosis in plants [4,5].
The ‘Yali’ pear is a traditional and high-quality pear cultivar from North China, prized for its delicate taste and unique flavor [6,7]. However, due to the alkaline and calcareous nature of soils in North China, where iron is predominantly present in an insoluble Fe3+ form, the bioavailability of iron is severely limited [8]. As a result, ‘Yali’ pear trees are particularly susceptible to iron deficiency chlorosis, which significantly impacts their growth, development, fruit quality, and yield.
In plant iron metabolism, the genes FRO2 (Ferric Reductase Oxidase 2), IRT1 (Iron-Regulated Transporter 1), and CS2 (Citrate Synthase 2) play crucial roles in the absorption, transport, and storage of iron. First, studies on Cydonia oblonga seedlings have revealed that the FRO2 gene encodes a ferric reductase enzyme that reduces ferric iron (Fe3+) to ferrous iron (Fe2+) in the soil, a process essential for iron absorption by plant roots [9]. Following this, research in Arabidopsis has demonstrated that the IRT1 gene encodes an iron transporter protein responsible for transferring the reduced Fe2+ from the soil into root cells, representing a critical step in iron uptake [10,11]. Lastly, investigations on Malus xiaojinensis have shown that the CS2 gene regulates citrate synthesis, which facilitates iron transport and storage. Citrate binds with Fe2+ to form soluble complexes, enabling iron translocation across tissues and ensuring its efficient utilization and storage [12]. These genes collectively function through the classical Strategy I mechanism of enhancing Fe3+ reduction and solubilization to counteract iron deficiency [13]. The coordinated action of these three genes is essential for the plant’s response to iron deficiency, collectively regulating iron metabolism and ensuring that the plant can maintain normal growth and development.
Although agronomic practices such as soil iron application, foliar spraying, and trunk injection can alleviate iron deficiency, these methods typically offer only short-term solutions and fail to fundamentally improve plant iron uptake and utilization efficiency [14]. Therefore, understanding the physiological and molecular mechanisms of plant responses to iron deficiency chlorosis, particularly the processes of iron absorption, transport, and storage, is crucial for addressing iron deficiency issues. This study uses the ‘Yali’ pear as a model to explore the physiological and molecular responses to varying degrees of iron deficiency chlorosis, with a particular focus on the differential expression of FRO2, IRT1, and CS2 genes under iron-deficient conditions. Through a systematic analysis of ‘Yali’ pear’s physiological and molecular responses to different levels of iron deficiency, this research aims to provide a theoretical foundation for studying iron-deficiency mechanisms and for the breeding of iron-deficiency-resistant pear varieties.
2. Materials and Methods
2.1. Plant Materials and Growth Conditions
The field experiment was conducted at the pear orchard of Hebei Agricultural University (38.814° N, 115.422° E). The region has a temperate monsoon climate, with an average temperature of 26 °C and relative humidity of 55% during the experimental period. The soil is classified as calcareous cinnamon soil. The experimental material consisted of seven-year-old ‘Yali’ pear trees with varying degrees of chlorosis. The trees were planted at a row spacing of 3 m and a tree spacing of 1 m, following conventional fertilizer and water management practices. The experimental trees were categorized into three groups based on the degree of chlorosis: Group 1 (Normal) with no chlorosis, Group 2 (Moderate chlorosis) with leaf interveinal chlorosis and green midribs (25–50% chlorosis of the leaves), and Group 3 (Severe chlorosis) with complete loss of green color, resulting in a yellowish-white appearance (over 75% chlorosis of the leaves). Five replicates were set for each group. To assist in the classification, SPAD (Soil Plant Analysis Development) values were measured at the beginning of the experiment in May. Leaves exhibiting dark green coloration were assigned a SPAD value of 1. Moderately chlorotic leaves had SPAD values approximately 50% of normal, and severely chlorotic leaves had SPAD values below 25% of normal. Given that the normal SPAD value for leaves was 35, moderate chlorotic leaves had SPAD values around 20, and those with severe chlorosis had SPAD values below 10 (Figure 1).
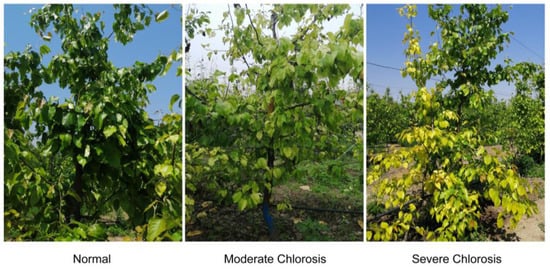
Figure 1.
Morphological characteristics of ‘Yali’ pears under different degrees of iron deficiency.
2.2. SPAD (Soil and Plant Analyzer Development) Measurement
The SPAD meter provides a rapid and non-destructive estimation of relative chlorophyll content, which is used to visually classify the degree of leaf chlorosis. Therefore, in this study, SPAD values were measured using the SPAD-502 PLUS portable chlorophyll meter (Konica Minolta, Osaka, Japan). Measurements were conducted around 10:00 a.m. on clear days. For each tree, six healthy, pest-free leaves from current-year shoots were selected—specifically, the 3rd to 5th fully expanded leaves from the shoot tip—and SPAD measurements were taken at five predetermined positions along each leaf blade. The mean of these five SPAD readings was calculated for each leaf and used as its representative chlorophyll content. The very same leaves used for SPAD determination were employed in all subsequent analyses.
2.3. Chlorophyll Fluorescence Measurement
The leaf chlorophyll fluorescence parameter Fv/Fm was measured using a Handy-PEA fluorimeter Multifunctional Plant Efficiency Analyzer (Hansatech Instruments Ltd., Pentney, Norfolk, UK). Following manufacturer recommendations, leaf samples underwent 20-minute dark adaptation at 25 °C prior to measurement to ensure complete relaxation of all PSII reaction centers. Measurements were performed on the mid-lamina region, an area less susceptible to edge effects and representative of overall photosynthetic performance. Two technical replicates per leaf and three biological replicates per experimental treatment were recorded to ensure data robustness and statistical reliability.
During the Fv/Fm measurement, a 650 nm red LED was used as a saturating pulse light source, with an intensity of 3000 μmol·m−2·s−1 to determine Fm; F0 was measured under weak measuring light (<1 μmol·m−2·s−1). No actinic light was used during the Fv/Fm measurements.
2.4. Soil Property Analysis
Soil pH reflects the acidity or alkalinity of the soil solution, which is a key factor in nutrient uptake and root activity. In this study, rhizosphere soil attached to roots during sampling was used for pH analysis [15]. Air-dried soil (passed through a 2 mm nylon sieve) was weighed (10 g) into a 100 mL Erlenmeyer flask, mixed with 25 mL distilled water, stirred vigorously with a glass rod for 2 min, and allowed to settle for 30 min. pH values were measured using a pH meter (PB-10, Sartorius Scientific Instruments Co., Ltd., Beijing, China), with three replicates per treatment.
Soil organic matter is essential for enhancing soil fertility, structure, and water retention, thereby supporting nutrient cycling and overall ecosystem sustainability. In this study, the potassium dichromate-concentrated sulfuric acid method was used for soil organic matter analysis [16]. Briefly, 0.5 g of rhizosphere soil (passed through a 100-mesh nylon sieve) was placed in a 250 mL Erlenmeyer flask. Then, 10 mL of 1 mol/L K2Cr2O7 (1/6 equivalent concentration, (Shanghai Macklin Reagent Co. Ltd., Shanghai, China, all reagents used herein are designated as Macklin Reagent unless otherwise specified).) and 20 mL concentrated H2SO4 (Sinopharm Chemical Reagent Co. Ltd., Shanghai, China) were added. The mixture was slowly rotated for 1 min, incubated for 30 min, diluted with 220 mL ultrapure water, and titrated with 0.5 mol/L FeSO4 after adding 3–4 drops of phenanthroline indicator until the solution turned brick-red. Calculations were performed according to standard formulae.
Available iron refers to the proportion of iron that can be absorbed by plants. In this study, the DTPA extraction method was used for available iron analysis [17]. Specifically, 10.0 g of air-dried rhizosphere soil (2 mm nylon-sieved) was mixed with 20.0 mL of DTPA extractant (pH 7.30; containing 0.005 mol/L DTPA, 0.01 mol/L CaCl2, and 0.1 mol/L triethanolamine, adjusted to pH 7.30 with 6 mol/L HCl) in a 100 mL Erlenmeyer flask. The suspension was shaken at 180 rpm for 2 h at 25 °C, immediately filtered, and the filtrate was analyzed by ICP-AES (PerkinElmer Optima 8000, Waltham, MA, USA). A standard calibration curve was established using iron reference materials prior to quantification.
2.5. Root Vitality Measurement
Root vitality was determined as an indicator of metabolic activity in root tissues, reflecting the capacity for nutrient uptake and stress adaptation [18]. The assay was performed using the triphenyltetrazolium chloride (TTC) reduction method [19]. Root sampling was performed at four cardinal directions (8 times trunk diameter distance from the tree base) using steel shovels. After removing surface soil, roots from a 20–40 cm depth were carefully excavated through soil sieving. Secondary lateral roots (diameter <5 mm) with adhering rhizosphere soil were collected for physiological analysis. Approximately 0.5 g of root tissue from pear trees was incubated with 0.4% TTC solution and 5 mL sulfuric acid buffer (pH = 7), and the root tips were fully immersed. The samples were incubated at 37 °C in the dark for 2 h, and the reaction was then terminated by adding 2 mL of 1 mol/L H2SO4. The roots were ground with ethyl acetate, washed 3 times, and triphenylformazan (TTF) was extracted. The absorbance at 485 nm was measured using a spectrophotometer (UV-2550, Shimadzu, Kyoto, Japan). Each sample was repeated 3 times.
2.6. Ferric-Chelate Reductase (FCR) Enzyme Activity Measurement
FCR activity was measured according to Zheng et al. [20], utilizing the same root specimens collected for root vitality assessment. Root segments were incubated in a CaSO4 (0.5 mM) solution for 10 min. After washing and wiping, they were placed in 5 mL of enzyme activity detection solution containing 50 mM Tris (pH 7.5), 0.5 mM CaSO4, 0.3 mM BPDS, and 50 mM FeEDTA. The reaction was carried out in the dark at 25 °C for 1 h, with gentle inversion every 10 min to mix. After the reaction, 2 mL of the colored supernatant was transferred to a 1 cm quartz cuvette and measured at 535 nm using a UV-2550 UV-Vis spectrophotometer (Shimadzu, Kyoto, Japan). A standard curve was established before measuring the samples. Each sample was repeated 3 times.
2.7. Total and Active Iron Measurement in Leaves
Total iron and active iron content were measured using an inductively coupled plasma atomic emission spectrometer (ICP-AES, PerkinElmer Optima 8000, Waltham, MA, USA), with slight modifications to the method of Lin et al. [21]. Prior to sample analysis, calibration procedures were carried out; wavelength calibration was performed using the instrument’s built-in software system, and analytical calibration was achieved by constructing a standard calibration curve, ensuring that measurements were conducted within the curve’s linear range. Leaf samples were dried at 105 °C for 40 min and further dried at 75 °C to constant weight. After grinding, 1 g of dried leaf powder was digested with 20 mL HNO3 (Sinopharm Chemical Reagent Co. Ltd., Shanghai, China) and 5 mL HClO4 (Sinopharm Chemical Reagent Co. Ltd., Shanghai, China), and the solution was diluted to 50 mL. The total iron content was then quantified using an ICP-AES.
Active iron content in fresh leaf or root samples (0.25 g) was extracted with 10 mL 1 mol/L HCl on a shaker for 12 h, filtered, diluted to 25 mL, and measured by ICP-AES.
2.8. Measurement of Citrate in New Roots and Leaves
Citrate content was quantified by high-performance liquid chromatography (HPLC) following the protocol of Lucarini et al. [22]. Briefly, approximately 0.2 g of fresh roots or leaves were homogenized in liquid nitrogen, followed by extraction with ddH2O to a final volume of 1.5 mL. The mixture was incubated at 75 °C for 30 min and subsequently centrifuged at 12,000× g for 30 min. After centrifugation, the supernatant was filtered through a 0.22 μm membrane prior to HPLC analysis.
Chromatographic conditions were as follows: An Agilent 1260 HPLC system (Agilent Technologies, Santa Clara, CA, USA) equipped with a UV detector was employed. Separations were achieved using an isocratic method with an Eclipse Plus C18 column (4.6 mm × 250 mm, 5 μm particle size) maintained at 25 °C. The mobile phase consisted of 0.02 mol/L potassium dihydrogen phosphate buffer (pH 2.8), which was delivered isocratically at a flow rate of 0.5 mL/min. Finally, a 10 μL aliquot of the processed sample was injected for each analysis.
2.9. qRT-PCR Analysis
Total RNA Extraction: Total RNA was extracted from pear roots using the Tiangen RNA extraction kit (TIANGEN, Beijing, China) following the manufacturer’s instructions. RNA purity (A260/A280 ratio 1.8–2.0) was confirmed by UV spectrophotometry, and integrity was verified by electrophoresis on 1.2% agarose gels.
Genomic DNA removal and cDNA synthesis: Genomic DNA removal and first-strand cDNA synthesis were performed strictly following the manufacturer’s instructions of the Fast QuantRT Kit (with gDNase) (TIANGEN, Beijing, China). The detailed procedures were as follows: a 10 μL reaction mixture was prepared containing 2.0 μL of 5×gDNA Buffer, 1.0 μg of total RNA, and RNase-free ddH2O to adjust the volume. After brief centrifugation, the mixture was incubated at 42 °C for 3 min and immediately placed on ice. For reverse transcription, 10 μL of RT master mix containing 2.0 μL of 10 × Fast RT Buffer, 1.0 μL of RT Enzyme Mix, 2.0 μL of FQ-RT Primer Mix, and RNase-free ddH2O to a final volume of 20 μL was added to the gDNA-removed reaction solution. After thorough mixing, the reaction was performed at 42 °C for 15 min, followed by heat inactivation at 95 °C for 3 min.
qRT-PCR analysis: qRT-PCR was performed using the Mastercycler ep realplex4 system (Eppendorf, Hamburg, Germany) with TransStart Top Green qPCR SuperMix (AQ131, TransGen Biotech, Beijing, China). The 20 μL PCR reaction mixture contained 10 μL of TransStart SuperMix, 2.0 μL of cDNA template, 0.4 μL each of upstream and downstream primers (10 μM), and 7.2 μL of ddH2O. The thermal cycling conditions were: initial denaturation at 94 °C for 30 s; 42 cycles of denaturation at 94 °C for 5 s, annealing at 55 °C for 15 s, and extension at 72 °C for 10 s; followed by melting curve analysis (95 °C for 15 s, 55 °C for 60 s, and 95 °C for 15 s). All samples were analyzed with three technical replicates. The pear actin gene was used as an internal reference, and relative gene expression levels were calculated using the 2−ΔΔCT method.
Primer Design: Specific primers for pear genes related to iron absorption and transport were designed by querying the NCBI database. The primers were synthesized by GeneScript Biotech (Shanghai) Co., Ltd. (Shanghai, China). The gene names and sequences are listed in Table 1.

Table 1.
Primer sequences used for qPCR analysis.
2.10. Statistical Analysis
All experimental data were organized using Microsoft Excel (Microsoft 365, Redmond, WA, USA) to ensure accuracy and completeness, with each treatment group being repeated three times, and the results are presented as mean ± standard deviation. Statistical significance between treatment groups was analyzed using SPSS (IBM, SPSS Statistics, version 25), with one-way analysis of variance (ANOVA) for group comparisons. When significant differences were found, Tukey’s HSD test was applied for post-hoc multiple comparisons, with a significance level set at p < 0.05. Data visualization was performed using GraphPad Prism (GraphPad Software, version 12.5), including bar charts, line graphs, etc., with significance markers added based on SPSS results. Additionally, correlation analysis, principal component analysis (PCA), and Variable Importance in Projection for Partial Least Squares Discriminant Analysis (PLS-DA VIP) were conducted using the MetaboAnalyst website (https://www.metaboanalyst.ca/ (accessed on 2 February 2025)), revealing the relationships between variables and the distribution characteristics of the samples across different treatments.
3. Results
3.1. Physicochemical Properties of Soil
To investigate the relationship between soil physicochemical properties and the degree of chlorosis in ‘Yali’ pear, we analyzed the pH, available iron content, and organic matter content of the rhizosphere soil in different treatment groups. The results (see Table 2) showed that from May to July, the pH of the rhizosphere soil of moderate chlorosis and severe chlorosis pear trees was significantly higher than that of normal trees. In May, the soil pH was at its lowest, with values of 7.41, 7.76, and 7.86 for the normal, moderate, and severe chlorosis groups, respectively; by July, the pH values peaked at 7.78 for the normal group, 7.92 for the moderate group, and 8.0 for the severe group. In addition, the available iron content in the rhizosphere of chlorotic pear trees was significantly lower than that in the normal group, particularly in the severe chlorotic group, where the minimum value was only 6.94 mg/kg, compared to the normal group’s lowest available iron content of 20.11 mg/kg in June. The organic matter content in May was significantly lower in the moderate and severe chlorosis groups than in the normal group; no significant differences were observed in June; however, in July, the severe chlorosis group was significantly lower than the normal group. In summary, even though the overall soil pH in this study fell outside the optimal range (pH 4–6) for iron availability and solubility, our findings still demonstrated that increased iron-deficiency chlorosis severity correlated with elevated rhizosphere soil pH and reduced available iron content. This suggests these parameters may constitute key drivers of iron deficiency-induced chlorosis in pear trees.
Table 2.
Rhizosphere soil physical and chemical properties of pear trees under different iron deficiency conditions.
3.2. Correlation Between Different Chlorosis Levels and Iron Content
To further explore the relationship between iron deficiency and leaf chlorosis, we measured both the active and total iron content in leaves and roots. The results showed that the total iron content in the leaves did not exhibit a consistent trend over the experimental period (see Figure 2A), whereas active iron content decreased significantly with increasing chlorosis severity (see Figure 2B). In all months, the active iron content in the leaves of the normal group was significantly higher than that of the moderate and severe chlorosis groups. Furthermore, as shown in Figure 2C, the ratio of active iron to total iron in the leaves followed the same trend as the changes in active iron content, consistent with previous studies, which suggest that the ratio of active iron to total iron can reflect the overall iron utilization level of the plant [23]. These results further indicate that active iron content is an important indicator for evaluating the degree of iron deficiency-induced chlorosis. As shown in Figure 2D, the active iron content in the roots generally showed a trend of first increasing and then decreasing, peaking in June. From May to July, the active iron content in the roots of the normal and moderate groups was significantly higher than that of the severe chlorosis group. In May and June, there was no significant difference in the root active iron content between the normal and moderate chlorosis groups, but in July, the normal group had significantly higher active iron content than the moderate chlorosis group. Overall, the total iron content in the leaves did not show a clear correlation with the degree of chlorosis, but the measurement of active iron content in both the leaves and roots showed a decreasing trend as leaf chlorosis intensified, further suggesting that active iron content is an important indicator for assessing the degree of iron chlorosis.
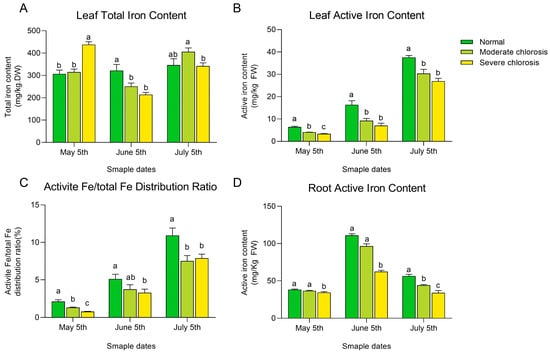
Figure 2.
Iron content in roots and leaves of pear trees under different iron deficiency conditions. (A) Total iron content in leaves. (B) Active iron content in leaves. (C) Active iron content in leaves as a percentage of total iron. (D) Active iron content in roots. Different letters indicate significant differences at the p < 0.05 level.
3.3. Correlation Between Different Chlorosis Levels and Relative Chlorophyll Content and Chlorophyll Fluorescence Parameters
SPAD values, which serve as a relative indicator of chlorophyll content, were used to assess leaf chlorosis [24]. The results (see Figure 3A) indicated that SPAD values decreased significantly with the aggravation of chlorosis. The SPAD values of the normal group were 1.87 and 10.26 times, 1.70 and 8.88 times, and 1.57 and 3.59 times those of the moderate and severe chlorosis groups in each respective month. The maximum photochemical efficiency (Fv/Fm), reflecting the light energy conversion efficiency of PSII reaction centers, showed minor variations under normal conditions but decreased significantly under iron stress [25]. Results demonstrated that Fv/Fm values remained relatively stable in the normal group, with no significant differences observed between moderately chlorotic and normal leaves across months. However, Fv/Fm values in severely chlorotic leaves were significantly lower than those in both normal and moderately chlorotic groups. The Fv/Fm values of severely chlorotic leaves dropped to 0.16 in May and remained around 0.6 from June to July. These findings indicate that both moderate and severe iron deficiency chlorosis can reduce relative chlorophyll content, but only severe chlorosis significantly inhibits photosynthesis. The concurrent decline in SPAD values and Fv/Fm ratio under severe iron deficiency may be attributed to impaired iron mobility within plants, particularly given that our sampling focused on the 3rd to 5th newly emerged leaves at shoot apices—positions subject to lower iron allocation priority [26]. In contrast, the observed recovery of Fv/Fm values in June and July likely correlates with the dynamic accumulation of active iron content in leaves during developmental progression (Figure 3B).
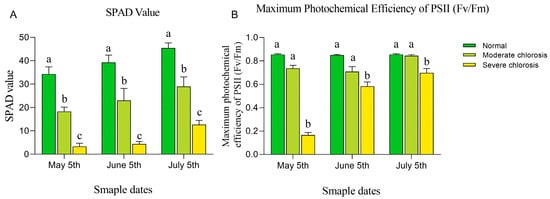
Figure 3.
Chlorophyll content and maximum photochemical efficiency (Fv/Fm) of young leaves in pear trees under different iron deficiency conditions. (A) SPAD value. (B) Maximum photochemical efficiency of PSII (Fv/Fm). Different letters indicate significant differences at the p < 0.05 level.
3.4. Correlation Between Different Chlorosis Levels and Root Iron Uptake Ability
Previous studies have shown that root vitality is an important indicator for evaluating a plant’s capacity to absorb nutrients [27]. In this study, the root vitality of ‘Yali’ pears under different chlorosis levels was measured (see Figure 4A).
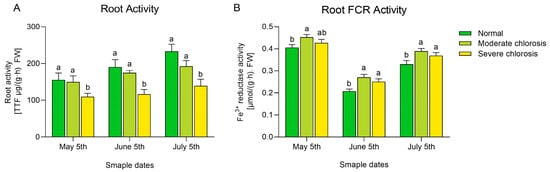
Figure 4.
Root activity and ferric reductase activity of pear trees under different iron deficiency conditions. (A) root activity. (B) Root FCR activity. Different letters indicate significant differences at the p < 0.05 level.
The results indicated that during the experimental period, there was no significant difference in root vitality between the normal and moderate groups, but both were significantly higher than the severe chlorosis group. Pear trees need to reduce Fe3+ to Fe2+ in their roots for effective absorption, so the activity of root FCR can reflect the plant’s iron absorption ability [28]. As shown in Figure 4B, from May to July, the activity of root FCR in all groups exhibited a trend of first decreasing and then increasing.
In each month, the FCR activity of the moderate chlorosis group was significantly higher than that of the normal group, and slightly higher than that of the severe chlorosis group, though there was no significant difference between the two; in May, there was no significant difference between the normal and severe chlorosis groups, but later, the normal group became significantly lower than the severe chlorosis group. Overall, the intensification of chlorosis led to a significant decrease in root vitality; within the experimental period, FCR activity showed a trend of first increasing and then decreasing as the degree of chlorosis deepened.
3.5. Effect of Different Chlorosis Levels and Citrate Content
Citrate, as an organic acid, has been shown to play an important role in plant tolerance to abiotic stress, and the long-distance transport of iron within plants is also related to citrate content [29]. In this study, the citrate content in both leaves and roots was measured. As shown in Figure 5A, within the experimental range, the citrate content in the leaves significantly increased with the intensification of chlorosis. In all months, the severe chlorosis group had significantly higher citrate content than the moderate chlorosis group, and the moderate chlorosis group had significantly higher content than the normal group. The citrate content in the severe chlorosis group was 4.48 times, 1.81 times, and 4.16 times that of the normal group in May, June, and July, respectively. This suggests that low active iron content in the leaves induces an increase in citrate content. In the analysis of citrate content in the roots (Figure 5B), it was found that from May to June, the citrate content in the roots of the normal plants was significantly lower than that of the moderate and severe chlorosis groups. In July, the normal group had the highest citrate content in the roots, followed by the moderate chlorosis group, and the severe chlorosis group had the lowest. These results suggest that the variation in citrate content in the roots may be influenced by seasonal factors, and plants may adopt different strategies to regulate citrate synthesis and accumulation during different growth stages.
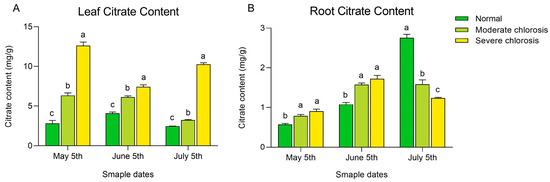
Figure 5.
Citrate content in roots and leaves of pear trees under different iron deficiency conditions. (A) Citrate content in leaves. (B) Citrate content in roots. Different letters indicate significant differences at the p < 0.05 level.
3.6. Correlation Between Different Chlorosis Levels and the Expression of Iron Uptake-Related Genes
To further investigate the impact of different chlorosis levels on the expression of genes involved in iron uptake and transport, we examined the expression levels of PbCS2 (Pyrus bretschneideri Citrate Synthase 2), PbFRO2 (Pyrus bretschneideri Ferric Reductase Oxidase 2), and PbIRT1 (Pyrus bretschneideri Iron-Regulated Transporter 1) in the roots of ‘Yali’ pears (see Figure 6). In this study, root expression of PbCS2 gradually decreased from May to July, while its expression in the moderate chlorosis group was significantly higher than in both the normal and severe chlorosis groups, with fold changes of 8.09 and 3.46, 2.88 and 2.25, and 2.05 and 2.50, respectively. As shown in Figure 6B, from May to July, root PbFRO2 expression in the moderate chlorosis group was significantly higher than in both the normal and severe groups, with fold differences of 2.86 and 7.09, 3.62 and 6.99, and 3.49 and 5.97, respectively; the normal group exhibited slightly higher PbFRO2 expression than the severe group, though the difference was not significant. This indicates that moderate chlorosis may be the critical threshold for inducing high PbFRO2 expression, which helps enhance iron uptake in the roots. As shown in Figure 6C, in May and June, the expression of PbIRT1 in the moderate and severe chlorosis groups was significantly higher than in the normal group, with fold differences of 20.25 and 9.75, and 4.88 and 2.07, respectively, and the moderate group was significantly higher than the severe group; in July, the expression in the moderate group was significantly higher than in both the normal and severe groups. Our findings revealed a significant negative correlation between iron deficiency status and root iron translocation capacity in pear trees, with enhanced root iron transport activity under moderate deficiency but markedly reduced capacity observed during severe leaf chlorosis.
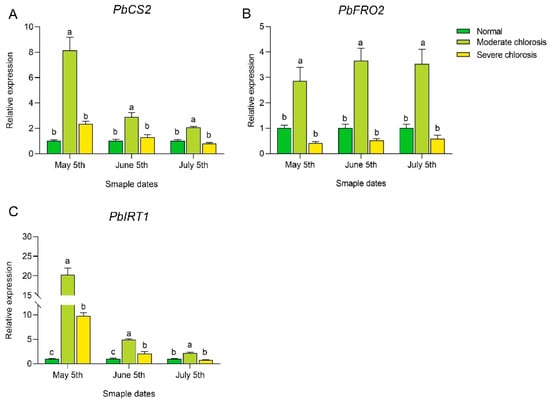
Figure 6.
Expression levels of iron uptake-related genes in roots of pear trees under different iron deficiency conditions. (A) Expression level of PbCS2. (B) Expression level of PbFRO2. (C) Expression level of PbIRT1. Different letters indicate significant differences at the p < 0.05 level.
3.7. Multivariate Analysis of Physiological Traits and Gene Expression
Principal Component Analysis (PCA) is an unsupervised statistical method that transforms high-dimensional data into a smaller number of principal components, thereby revealing overall differences and distribution patterns among samples. Partial Least Squares Discriminant Analysis (PLS-DA) is a supervised multivariate analysis technique used to identify variables that effectively distinguish between different treatment groups, while the Variable Importance in Projection (VIP) score is used to evaluate the importance of each variable in the classification model.
Therefore, to further elucidate the physiological changes and molecular regulatory mechanisms of pear trees under iron deficiency stress, we performed multivariate analysis on the measured physiological parameters and the expression levels of iron metabolism-related genes. We applied PCA and PLS-DA analyses, combined with VIP scoring, to assess the contribution of each variable to group discrimination. Through these methods, we aimed to uncover the effects of chlorosis severity on iron uptake, transport, and utilization in pear trees, with particular emphasis on the roles of the PbCS2, PbIRT1, and PbFRO2 genes.
3.7.1. PCA of Physiological Traits and Gene Expression
As shown in Figure 7A, when PCA was performed based solely on chlorosis severity without distinguishing sampling periods, normal and moderately chlorotic leaves were not well separated, whereas severely chlorotic leaves exhibited clear differentiation from the other two groups. This result suggests that normal and moderately chlorotic leaves share similar physiological and molecular characteristics, while severe chlorosis induces more pronounced physiological alterations.
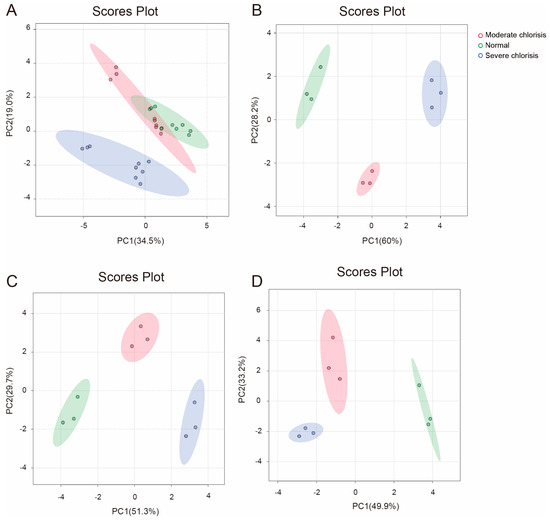
Figure 7.
PCA of ‘Yali’ pears at different sampling times under different degrees of iron deficiency. (A) All samples grouped by chlorosis severity, regardless of sampling time. (B) Data from May. (C) Data from June. (D) Data from July.
Figure 7B–D shows the results of PCA analysis for different chlorosis groups from May to July. The results indicated that the sample distribution patterns for all three sampling months were consistent: along the PC1 axis, the moderate chlorosis samples were always positioned between the normal and severe chlorosis samples, with clear separation among the three groups. This spatial arrangement along the PC1 axis suggests that the physiological transition from normal to severe chlorosis follows a gradient trajectory rather than a phenotypic shift, reflecting the cumulative metabolic disturbances caused by severe iron deficiency. Specifically, as shown in Table 3, the loading values for SPAD, which reflects leaf color and photosynthetic capacity, the citrate content in both the roots and leaves, which reflects iron transport capacity, and the available iron in the soil (soil active iron content) were all greater than 0.25 in the different months.
Table 3.
Identified physiological and molecular indicators with high absolute loadings on PC1 and PC2.
In contrast, along the PC2 axis, the normal and severe chlorosis samples were almost indistinguishable, while the moderate chlorosis samples were clearly separated. This pattern suggests that PC2 captures the nonlinear physiological responses during chlorosis, characterized by an initial increase followed by a decrease. According to Table 3, PC2 was primarily influenced by the activity of iron metabolism-related enzymes, including the expression levels of PbCS2, PbIRT1, and PbFRO2 (Loading value > 0.35). During the early stages of chlorosis, these genes are upregulated to enhance iron acquisition and redistribution. However, as iron deficiency continues, these regulatory mechanisms gradually weaken or become suppressed, potentially exacerbating the severity of chlorosis. These genes are upregulated in the early stages of chlorosis to enhance iron acquisition and redistribution. However, as iron deficiency persists, these regulatory mechanisms gradually weaken or become suppressed.
Overall, these findings demonstrate a dual-phase physiological adaptation strategy in pear trees under iron-deficient conditions: PC1 represents the primary and progressive physiological alterations, whereas PC2 reflects a transient adaptive mechanism that is initially activated and later declines. This distinction underscores the complex metabolic regulatory strategies employed by pear trees under iron deficiency stress.
3.7.2. VIP Analysis of Key Variables Contributing to Chlorosis and Iron Deficiency Responses
The PLS-DA VIP analysis identified PbFRO2 as a consistently significant variable (VIP > 1.5) associated with leaf chlorosis severity across all sampled growth stages (Figure 8). In the overall analysis without distinguishing sampling months (Figure 8A), PbFRO2 exhibited the highest VIP value (2.1331), indicating its significant contribution to iron deficiency-induced chlorosis across all time points. In the month-specific analysis (Figure 8B–D), PbFRO2 had the highest VIP values in May and July (1.544 and 1.531, respectively), while it ranked second in June (1.584), suggesting that PbFRO2 functions as a central regulatory factor in iron deficiency responses, particularly during early and late growth stages. Moreover, in May, leaf total iron content, Fv/Fm, and PbCS2 had high contributions, whereas in June, PbIRT1, leaf Citrate, and PbCS2 became more influential. By July, root active iron, PbFRO2, and soil pH had the highest contributions (Table 4). This dynamic shift suggests that the iron deficiency response in pear trees is not static but undergoes seasonal regulation to adapt to changing environmental conditions.
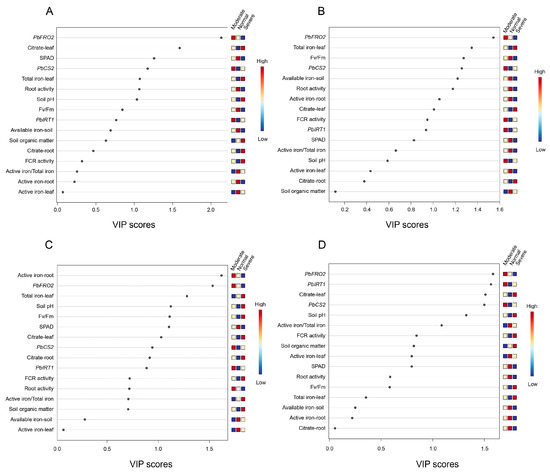
Figure 8.
Partial least squares discriminant analysis (PLS-DA) with variable importance in projection (VIP) analysis of ‘Yali’ pears at different sampling times under different degrees of iron deficiency. (A) All samples grouped by chlorosis severity, regardless of sampling time. (B) Data from May. (C) Data from June. (D) Data from July.
Table 4.
List of response variables with VIP values greater than 1.
Further comparison of the PCA loadings and VIP values revealed some degree of difference in variable selection. This is primarily because PCA identifies the directions of maximum variance in the dataset, while PLS-DA VIP analysis selects the most discriminative variables for classification. Therefore, in PCA, parameters such as SPAD, citrate content, and soil active iron content may exhibit higher loadings, whereas in VIP analysis, PbFRO2 contributes more to classification. This suggests that PCA primarily captures the overall physiological changes under iron deficiency, while VIP analysis highlights the molecular regulators that are crucial for adaptation. Overall, PbFRO2 plays a key role at all time points, and different compensatory mechanisms may be involved in maintaining iron homeostasis during specific growth stages.
3.7.3. Correlation Analysis Between Physiological Traits and Gene Expression
To further clarify the mechanism of PbFRO2 response to iron deficiency, we conducted a correlation analysis on the dataset. Although most of the p-values in these analyses did not reach conventional significance levels (p < 0.1), the effect sizes (r values) and observed trends revealed several biologically meaningful relationships. Therefore, our study primarily focuses on descriptive analysis and trend presentation, emphasizing the magnitude and direction of effects between variables, and further validation will be needed through larger sample sizes or functional experiments.
In the analysis considering only chlorosis severity (without differentiating sampling months, see Figure 9A), the active iron content in leaves was negatively correlated with PbFRO2 (r = −0.127, p = 0.527), PbCS2 (r = −0.503, p < 0.05), and PbIRT1 (r = −0.584, p < 0.05), suggesting that the reduction of active iron in leaves may induce the upregulation of these three genes. Meanwhile, the ferric reductase activity (FCR activity) showed a positive correlation with PbFRO2 (r = 0.018, p = 0.930), PbCS2 (r = 0.207, p < 0.05), and PbIRT1 (r = 0.579, p < 0.05), indicating that the increased expression of these genes might enhance root ferric reductase activity, thereby promoting iron absorption.
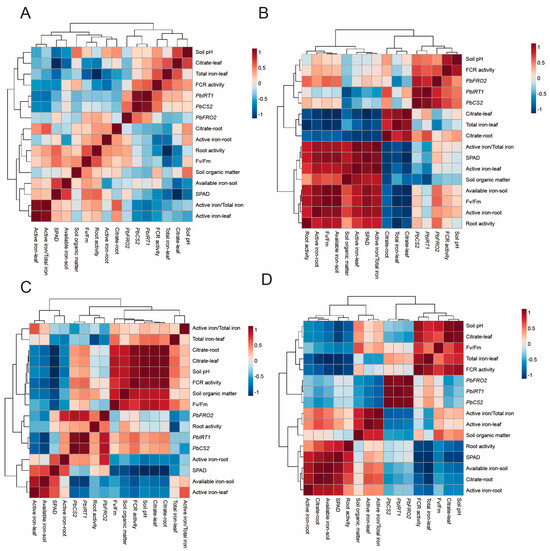
Figure 9.
Correlation analysis of ‘Yali’ pears at different sampling times under different degrees of iron deficiency. (A) Grouped by chlorosis severity regardless of sampling time. (B) Data from May. (C) Data from June. (D) Data from July.
Subsequently, we analyzed the correlations in the dataset from May to July (Figure 9B–D), with a focus on the relationships between PbFRO2 and leaf active iron content, root active iron content, and root FCR enzyme activity (Table 4). The results revealed that temporal changes in the relationship between PbFRO2 and iron homeostasis suggested the existence of a stage-specific regulatory mechanism.
In the early growth stage (May) (Table 5), the strong correlation between PbFRO2 expression and FCR activity (r = 0.619), along with its synergistic relationship with root iron accumulation (r = 0.373), aligns with the “Strategy I” iron acquisition mechanism, supporting the plant’s nutritional growth requirements. However, from May (r = −0.003) to July (r = −0.582), the gradually increasing negative correlation with leaf active iron suggests that the function of this gene extends beyond simple iron absorption promotion. By June, when root iron retention peaked (r = 0.739), the newly emerging negative correlation with leaf iron (r = −0.427) and the reduction in ferric reductase activity (r = 0.071) occurred synchronously, indicating that prioritizing iron storage in the roots may be an adaptive strategy to cope with iron deficiency stress. In July, the reversal of the correlation between PbFRO2 expression and root iron (r = −0.261), along with the exacerbation of leaf iron inhibition (r = −0.582), collectively suggested the redistribution of iron to reproductive organs.
Table 5.
Effect sizes (Pearson’s r) of PbFRO2 expression across indicators.
In conclusion, these seasonal dynamic characteristics indicate that PbFRO2 coordinates iron distribution through a three-phase program: spring root iron storage dependent on reductase activity, summer root iron buffering in response to environmental stress, and reproductive phase iron redistribution accompanied by leaf iron deactivation. This gene may serve as a regulatory hub, dynamically balancing iron distribution strategies across different developmental stages. It is important to note that, although the observed large effect sizes suggest potential biological associations, the lack of statistical significance (p > 0.1) in this section prevents definitive conclusions. These findings should be considered exploratorily, and the research team plans to further validate them through larger sample sizes or functional experiments.
Furthermore, across various comparisons, we observed significant correlations among PbFRO2, PbIRT1, and PbCS2 (p < 0.05), suggesting a synergistic interaction among these genes in regulating iron uptake and utilization. Specifically, as a key gene in ferric reduction, PbFRO2 may enhance the bioavailability of iron by increasing the efficiency of Fe3+ reduction in the roots; PbIRT1 is responsible for transporting the reduced Fe2+ into the plant, thereby ensuring efficient distribution of iron; meanwhile, PbCS2 regulates the synthesis of citrate, which aids in the solubilization and translocation of iron. These significant correlations support the existence of an integrated regulatory network, indicating that pear trees coordinate multiple molecular mechanisms to optimize iron absorption and redistribution, thereby maintaining normal growth and development under iron deficiency stress.
4. Discussion and Conclusions
In this study, the active iron content in leaves of moderately and severely chlorotic groups was significantly reduced compared to the normal group, paralleling the decline in chlorophyll levels, which could be attributed to the critical role of iron in chlorophyll biosynthesis [30,31]. Consistent with the “chlorosis paradox” observed in previous studies [32], total iron content in normal, mildly, and severely chlorotic leaves exhibited irregular fluctuations, indicating that total iron cannot serve as a reliable diagnostic indicator for the iron nutritional status of ‘Yali’ pears.
The molecular regulatory mechanism of iron uptake in ‘Yali’ pears exhibits a stage-specific response to chlorosis severity. Under moderate iron deficiency, root FCR activity and PbFRO2 expression are upregulated, consistent with the classical Strategy I mechanism of enhancing Fe3+ reduction and solubilization to counteract iron deficiency [13]. However, severe iron deficiency suppresses FCR activity, likely due to irreversible enzyme denaturation or cellular redox imbalance, further exacerbating iron limitation. Concurrently, the upregulation of PbIRT1 in moderately chlorotic roots mirrors the activation of Fe2+ transporters observed in Arabidopsis [33], indicating evolutionary conservation of iron uptake mechanisms in dicots. The CS2 gene plays a pivotal role in citrate biosynthesis, exerting dual functions in iron activation and transport through citrate metabolism [34]. In this study, leaf citrate content progressively accumulated with increasing chlorosis severity, while root citrate content (excluding July samples) exhibited a similar trend.
Multivariate analyses revealed a biphasic adaptation strategy. PCA demonstrated progressive physiological divergence, with severely chlorotic leaves forming a distinct cluster separate from normal and moderately chlorotic leaves (Figure 7A), indicating threshold-dependent collapse of metabolic and molecular adjustment mechanisms. PLSDA-VIP identified PbFRO2 as a core regulatory factor (VIP > 1.5, Table 4), whose expression strongly correlated with FCR activity (r = 0.73, p < 0.01) and active iron redistribution. Notably, transcript levels of PbFRO2, PbIRT1, and PbCS2 peaked in moderately chlorotic plants but markedly declined under severe stress (Figure 6). This pattern suggests two potential mechanisms: (1) Plants may maintain a minimal transcriptional threshold of these genes to achieve adaptive iron homeostasis regulation; beyond this threshold, compensatory mechanisms fail, leading to irreversible physiological damage. (2) Transcriptional suppression of PbFRO2, PbIRT1, and PbCS2 could exacerbate iron deficiency chlorosis in pear trees, creating a self-reinforcing vicious cycle.
This study deciphered the molecular regulatory mechanisms underlying iron deficiency chlorosis in ‘Yali’ pears through integrative analyses. Under moderate iron deficiency, the synergistic upregulation of PbFRO2, PbIRT1, and PbCS2 likely triggered a compensatory cascade, alleviating chlorosis via enhanced Fe3+ reduction, Fe2+ transport, and citrate-mediated long-distance iron translocation. Conversely, severe iron deficiency potentially overwhelms the regulatory network capacity, inducing gene expression threshold effects, inactivation of FCR, and photosynthetic dysfunction, ultimately disrupting iron homeostasis (these mechanisms require further validation). Organ-specific citrate dynamics revealed divergent adaptive strategies: leaf citrate prioritized iron reactivation to sustain photosynthetic function, while root citrate modulated seasonal iron allocation through concentration fluctuations. These findings establish a “gene-metabolite-phenotype” tripartite framework elucidating the molecular basis of iron stress in alkaline soils, with PbFRO2 serving as a central hub gene driving adaptive responses and offering potential targets for iron biofortification.
This work systematically characterizes the dynamic physiological and molecular adaptations during iron-deficient chlorosis in ‘Yali’ pear, providing novel insights into iron homeostasis regulation in perennial fruit trees and guiding iron-efficient cultivar breeding and precision fertilization in calcareous soils. However, the etiology of pear chlorosis remains dual-natured: whether it primarily stems from insufficient soil iron availability or compromised plant iron response capacity warrants resolution. To address this, follow-up studies will employ controlled iron supplementation combined with PbFRO2 overexpression and knockout approaches to dissect the causation of chlorosis and delineate the functional network of this pivotal gene.
Author Contributions
Conceptualization, H.S. and Y.Z.; methodology, S.L.; software, M.Z. and C.W.; validation, S.L., H.W. and Y.X.; formal analysis, M.Z. and C.W.; investigation, S.L., H.W. and Y.X.; data curation, S.L.; writing—original draft preparation, S.L.; writing—review and editing, S.L., M.Z., J.Z., Y.Z. and H.S.; visualization, M.Z.; supervision, H.S. and Y.Z.; funding acquisition, H.S. All authors have read and agreed to the published version of the manuscript.
Funding
This work was supported by the National Natural Science Foundation of China (32272654), the Hebei Natural Science Foundation, China (C2023204016), the Hebei Province Introduced Overseas-Scholar Fund, China (C20220361), and the Hebei Province Outstanding Youth Fund, China (2016, 2019).
Data Availability Statement
Data are contained within the article.
Conflicts of Interest
The authors declare no conflicts of interest.
References
- Merry, R.; Dobbels, A.A.; Sadok, W.; Naeve, S.; Stupar, R.M.; Lorenz, A.J. Iron Deficiency in Soybean. Crop Sci. 2022, 62, 36–52. [Google Scholar] [CrossRef]
- Zebec, V.; Lisjak, M.; Jović, J.; Kujundžić, T.; Rastija, D.; Lončarić, Z. Vineyard Fertilization Management for Iron Deficiency and Chlorosis Prevention on Carbonate Soil. Horticulturae 2021, 7, 285. [Google Scholar] [CrossRef]
- Zang, Y.; Huang, Y.; Chang, X.; Chen, J.; Jiang, T.; Wu, Z.; Lu, L.; Tian, S. High Soil pH and Plastic-Shed Lead to Iron Deficiency and Chlorosis of Citrus in Coastal Saline–Alkali Lands: A Field Study in Xiangshan County. Horticulturae 2023, 9, 437. [Google Scholar] [CrossRef]
- Kudirka, G.; Viršilė, A.; Sutulienė, R.; Laužikė, K.; Samuolienė, G. Precise Management of Hydroponic Nutrient Solution pH: The Effects of Minor pH Changes and Mes Buffer Molarity on Lettuce Physiological Properties. Horticulturae 2023, 9, 837. [Google Scholar] [CrossRef]
- Guo, G.; Xiao, J.; Jeong, B.R. Iron Source and Medium pH Affect Nutrient Uptake and Pigment Content in Petunia Hybrida ‘Madness Red’ Cultured in Vitro. Int. J. Mol. Sci. 2022, 23, 8943. [Google Scholar] [CrossRef] [PubMed]
- Zhang, Y.; Liu, W.-J.; Cheng, X.-H.; Du, G.-Q.; Zhang, Y.-X. Effects of Pollinizer Cultivars on the Morphogenesis and Development of Yatu and the Endogenous Hormone Content in the Base of Young Fruit Of’yali’pear (Pyrus Bretschneideri Rehd.). J. Fruit Sci. 2020, 37, 1168–1174. [Google Scholar] [CrossRef]
- Ren, Z.-Y.; Cheng, Y.-D.; Guan, Y.-Q.; Yang, X.-Z.; Guan, J.-F. Detection of Freshness and Damage Degree of Pyrus Bretschneideri Rehd. Based on Electronic Nose. J. Food Saf. Qual. 2022, 13, 2770–2777. [Google Scholar]
- Li, J.; Cao, X.; Jia, X.; Liu, L.; Cao, H.; Qin, W.; Li, M. Iron Deficiency Leads to Chlorosis through Impacting Chlorophyll Synthesis and Nitrogen Metabolism in Areca catechu L. Front. Plant Sci. 2021, 12, 710093. [Google Scholar] [CrossRef] [PubMed]
- Rahimi, S.; Talebi, M.; Baninasab, B.; Gholami, M.; Zarei, M.; Shariatmadari, H. The Role of Plant Growth-Promoting Rhizobacteria (Pgpr) in Improving Iron Acquisition by Altering Physiological and Molecular Responses in Quince Seedlings. Plant Physiol. Biochem. 2020, 155, 406–415. [Google Scholar] [CrossRef]
- Martín-Barranco, A.; Spielmann, J.; Dubeaux, G.; Vert, G.; Zelazny, E. Dynamic Control of the High-Affinity Iron Uptake Complex in Root Epidermal Cells1. Plant Physiol. 2020, 184, 1236–1250. [Google Scholar] [CrossRef]
- Dubeaux, G.; Neveu, J.; Zelazny, E.; Vert, G. Metal Sensing by the Irt1 Transporter-Receptor Orchestrates Its Own Degradation and Plant Metal Nutrition. Mol. Cell 2018, 69, 953–964.e5. [Google Scholar] [CrossRef] [PubMed]
- Han, D.-G.; Shi, Y.; Wang, B.; Liu, W.; Yu, Z.-Y.; Lv, B.-Y.; Yang, G.-H. Isolation and Preliminary Functional Analysis of Mxcs2: A Gene Encoding a Citrate Synthase in Malus Xiaojinensis. Plant Mol. Biol. Report. 2014, 33, 133–142. [Google Scholar] [CrossRef]
- Wang, Y.; Kang, Y.; Zhong, M.; Zhang, L.; Chai, X.; Jiang, X.; Yang, X.J.A. Effects of Iron Deficiency Stress on Plant Growth and Quality in Flowering Chinese Cabbage and Its Adaptive Response. Agronomy 2022, 12, 875. [Google Scholar] [CrossRef]
- Lucena, J.J.; Hernandez-Apaolaza, L. Iron Nutrition in Plants: An Overview. Plant Soil 2017, 418, 1–4. [Google Scholar] [CrossRef]
- Thomas, G.W. Soil pH and soil acidity. In Methods of Soil Analysis: Part 3 Chemical Methods 5; John Wiley & Sons: Hoboken, NJ, USA, 1996; pp. 475–490. [Google Scholar]
- Ma, Y.; Li, J.; Tian, M.; Liu, Y.; Wei, A. Authentication of Chinese Prickly Ash by Its2 Sequencing and the Influence of Environmental Factors on Pericarp Quality Traits. Ind. Crops Prod. 2020, 155, 112770. [Google Scholar] [CrossRef]
- Shidan, B. Soil Agrochemical Analysis, 3rd ed.; Agriculture Press: Beijing, China, 2000. [Google Scholar]
- Lv, X.; Kong, H.; Luo, Y.; Dong, D.; Liu, W.; Wu, D.; Ye, Z.; Ma, J.; Liu, D. The Impact of Magnesium on the Growth, Physiology and Quality of Tea (Camellia sinensis L.) Plants under Acid Stress. Agronomy 2024, 14, 767. [Google Scholar] [CrossRef]
- Zhou, J.; Yuan, W.; Di, B.; Zhang, G.; Zhu, J.; Zhou, P.; Ding, T.; Qian, J. Relationship among Electrical Signals, Chlorophyll Fluorescence, and Root Vitality of Strawberry Seedlings under Drought Stress. Agronomy 2022, 12, 1428. [Google Scholar] [CrossRef]
- Zheng, S.J.; Tang, C.; Arakawa, Y.; Masaoka, Y. The Responses of Red Clover (Trifolium pratense L.) to Iron Deficiency: A Root Fe(Iii) Chelate Reductase. Plant Sci. 2003, 164, 679–687. [Google Scholar] [CrossRef]
- Lin, L.; Li, Z.; Wu, C.; Xu, Y.; Wang, J.; Lv, X.; Xia, H.; Liang, D.; Huang, Z.; Tang, Y. Melatonin Promotes Iron Reactivation and Reutilization in Peach Plants under Iron Deficiency. Int. J. Mol. Sci. 2023, 24, 16133. [Google Scholar] [CrossRef]
- Lucarini, M.; Di Lullo, G.; Cappelloni, M.; Lombardi-Boccia, G. In Vitro Estimation of Iron and Zinc Dialysability from Vegetables and Composite Dishes Commonly Consumed in Italy: Effect of Red Wine. Food Chem. 2000, 70, 39–44. [Google Scholar] [CrossRef]
- Zhang, C.; Wang, Y.; Li, Y. Effect of Iron Deficiency on Contents of Nutrient Elements and Photosynthetic Characteristic of Leaves in Pear Trees. J. Northwest For. Univ. 2002, 17, 9–11. [Google Scholar]
- Zhang, R.; Yang, P.; Liu, S.; Wang, C.; Liu, J. Evaluation of the Methods for Estimating Leaf Chlorophyll Content with Spad Chlorophyll Meters. Remote Sens. 2022, 14, 5144. [Google Scholar] [CrossRef]
- Zhao, J. Photosynthetic Characteristics Research and Fruit Quality Determination of Different Planting Density on Korla Fragrant Pear. Master’s Thesis, Xinjiang Agricultural University, Urumqi, China, 2014. (In Chinese). [Google Scholar]
- Nsiri, K.; Krouma, A. The Key Physiological and Biochemical Traits Underlying Common Bean (Phaseolus vulgaris L.) Response to Iron Deficiency, and Related Interrelationships. Agronomy 2023, 13, 2148. [Google Scholar] [CrossRef]
- Rewald, B.; Meinen, C. Plant Roots and Spectroscopic Methods—Analyzing Species, Biomass and Vitality. Front. Plant Sci. 2013, 4, 393. [Google Scholar] [CrossRef]
- Li, X. The Response Mechanism of Pyrus Betulifolia Root System to Iron Deficiency Stress and the Expression Analysis of Related Resistance Genes. Ph.D. Thesis, Hebei Agricultural University, Baoding, China, 2016. (In Chinese). [Google Scholar]
- Tahjib-Ul-Arif, M.; Zahan, M.I.; Karim, M.M.; Imran, S.; Hunter, C.T.; Islam, M.S.; Mia, M.A.; Hannan, M.A.; Rhaman, M.S.; Hossain, M.A.; et al. Citric Acid-Mediated Abiotic Stress Tolerance in Plants. Int. J. Mol. Sci. 2021, 22, 7235. [Google Scholar] [CrossRef]
- Kong, W.-L.; Wu, X.-Q.; Zhao, Y.-J. Effects of Rahnella Aquatilis Jz-Gx1 on Treat Chlorosis Induced by Iron Deficiency in Cinnamomum Camphora. J. Plant Growth Regul. 2019, 39, 877–887. [Google Scholar] [CrossRef]
- Bityutskii, N.P.; Yakkonen, K.L.; Lukina, K.A.; Semenov, K.N. Fullerenol Increases Effectiveness of Foliar Iron Fertilization in Iron-Deficient Cucumber. PLoS ONE 2020, 15, e0232765. [Google Scholar] [CrossRef] [PubMed]
- Gao, Z.; Zhao, C.; Dong, D.; Liu, S.; Wen, X.; Gu, Y.; Jiao, L. Visualizing Changes of Metabolites During Iron Deficiency Chlorosis in Field-Grown Pear Leaves Using Micro-Raman Spectral Imaging. Front. Plant Sci. 2022, 13, 1079660. [Google Scholar] [CrossRef]
- Gong, Q.; Zhou, M.; Li, X.; Guo, Y. Transcription Factor Myb8 Regulates Iron Deficiency Stress Response in Arabidopsis. Plant Sci. 2024, 340, 111973. [Google Scholar] [CrossRef]
- Zhang, X.; Wei, X.; Ali, M.M.; Rizwan, H.M.; Li, B.; Li, H.; Jia, K.; Yang, X.; Ma, S.; Li, S.; et al. Changes in the Content of Organic Acids and Expression Analysis of Citric Acid Accumulation-Related Genes During Fruit Development of Yellow (Passiflora edulis f. flavicarpa) and Purple (Passiflora edulis f. edulis) Passion Fruits. Int. J. Mol. Sci. 2021, 22, 5765. [Google Scholar] [CrossRef]
Disclaimer/Publisher’s Note: The statements, opinions and data contained in all publications are solely those of the individual author(s) and contributor(s) and not of MDPI and/or the editor(s). MDPI and/or the editor(s) disclaim responsibility for any injury to people or property resulting from any ideas, methods, instructions or products referred to in the content. |
© 2025 by the authors. Licensee MDPI, Basel, Switzerland. This article is an open access article distributed under the terms and conditions of the Creative Commons Attribution (CC BY) license (https://creativecommons.org/licenses/by/4.0/).