Abstract
Sweet basil (Ocimum basilicum) is valued for its culinary and medicinal properties. It thrives in full sunlight and long daylight hours under natural conditions. This study examined the effects of extended photoperiod on sweet basil grown in a hot and humid tropical greenhouse. Some plants received only natural sunlight (SL), while others had SL supplemented with LED light for 6 h (6 h) before sunrise and/or after sunset. Plants grown under only natural SL (L1) had a smaller leaf number, smaller leaf area per plant, lower shoot, and root productivity than those grown under other light conditions. The shoot fresh weight of basil grown under supplemented LED light for 3 h before sunrise and 3 h after sunset (L2), 6 h after sunset (L3), and 6 h before sunrise (L4) was 2.68, 2.33, and 1.94 times higher than L1 conditions, respectively. The maximum quantum efficiency of PSII, electron transport rate, effective quantum yield of PSII, and Chl a/b ratio were also higher in L2, L3, and L4. The total leaf soluble protein, ascorbic acid, total phenolic compounds, and dietary minerals followed the same trend. Among all treatments, L2 consistently showed significantly higher values, making it the optimal lighting strategy for extended photoperiod.
1. Introduction
Singapore relies on imports for 90% of its food due to limited land availability. However, factors such as disease outbreaks, climate change, and a growing global population make food imports increasingly unreliable. In response, the Singapore Food Agency established the “30 by 30” goal, which aims to sustainably produce 30% of the nation’s nutritional needs locally by 2030 [1]. Achieving this requires leveraging technology to “grow more with less”, such as through indoor vertical farming with LED lighting to enhance land productivity [2]. However, this method incurs high energy costs from managing the temperature, light, and humidity. To mitigate this, subtropical and tropical plants can be grown in greenhouses using natural sunlight supplemented with LED lighting [2,3,4]. Supplementing LED light to natural sunlight increases the daily light integral (DLI), which is the product of the photosynthetic photon flux density (PPFD) and photoperiod. The DLI (mol m−2 day−1) describes the number of photosynthetically active photons that are delivered to a specific area over a 24 h period. The DLI has been shown to better relate to growth traits and physical performances than instantaneous PPFD levels at any given time [5].
Ocimum basilicum (sweet basil) is a popular and a wide variety of culinary and medicinal herb [6,7]. Packed with anticancer, antimicrobial, and antidiabetic properties, sweet basil is highly valued [6]. It has been consumed simply because of its very pleasant aromatic flavor profile and its variety of positive health benefits [6,7]. Its rapid growth, high yield, and profitability margin using hydroponic and controlled environment agriculture (CEA) systems under LED lighting make it an attractive plant to grow [8].
Photoperiod affects vegetative yield, physiological and biochemical characteristics, as well as the accumulation of biological active compounds [8,9]. It was found that by increasing light duration which, in turn, increases the DLI, shoot productivity increased by almost 2-fold under extended photoperiod and a higher DLI in Portulaca oleracea [10]. Increasing the DLI from 7.5 to 15 mol m–2 d–1 led to the better yield and morphological characteristics of sweet basil [11]. A study on sweet potato leaves (Ipomoea batatas) found that when grown under supplemental LED light in a natural tropical greenhouse, there was enhanced leaf biomass due to the greater thickness of the leaves. The electron transport rate and photochemical quenching were also higher under supplemental LED lighting [3]. In another study on Cos lettuce, grown in the same hot and humid tropical greenhouse, it was found that supplementing LED lighting to natural SL to increase growth irradiance enhanced leaf growth [4]. The total leaf area, shoot fresh weight (FW), photosynthetic rate, concentrations of photosynthetic pigments, and leaf total soluble protein were higher in plants supplemented with LED lighting of 300 µmol m−2 s−1 than with LED lighting of 150 µmol m−2 s−1 [4].
Sweet basil prefers long daylight when it is cultivated under natural conditions [12]. Using CEA, studies have been conducted using different LED spectral qualities [8,13,14], LED intensities [8,15], as well as photoperiod [8] to investigate the impacts of LED light on the productivity and nutritional values of sweet basil. For sweet basil, the highest yield was obtained under 24 h illumination [8]. Singapore has many cloudy and rainy days; thus, the DLI may not be enough for sweet basil as little is known about its light requirement when grown in a hot and humid tropical greenhouse. Thus, in this study, sweet basil plants were grown in the tropical greenhouse hydroponically under natural sunlight with supplemental LED lighting for a 6 h (6 h) extended photoperiod during different times in a 24 h period. The main objectives of this project were to study the effects of extended photoperiod on growth traits, photosynthetic characteristics, and nutritional quality, including phytonutrients and dietary minerals. It also aimed to determine the suitable period for extending the photoperiod within a 24 h time frame. The findings of this study may help growers to enhance the productivity, quality, and energy use efficiency of sweet basil through the selection of extended photoperiods.
2. Materials and Methods
2.1. Plant Materials and Cultivation Methods
After germination, sweet basil (Ocimum basilicum “Genovese”) seedlings were inserted into polyurethane cubes in plastic trays along the corridor under natural sunlight with an average PPFD of 180 µmol m−2 s−1. All plants were supplied with half-strength nutrient solution (Netherlands Standard Composition) [16]. Seedlings of similar size with 2 pairs of small leaves were selected for transplanting 12 days after germination. Plants were hydroponically grown in the tropical greenhouse and were exposed to fluctuating ambient temperature (26 to 36 °C) and relative humidity (36% to 97%). The plant density was about 80 m−2. There was no self-shading effect among the plants. All plants were supplied with full strength nutrient solution (Netherlands Standard Composition) [16]. Nutrient solution conductivity and pH were maintained at 2.2 ± 0.2 mS cm−1 and 6.5 ± 0.5, respectively, through daily monitoring and adjustment as necessary.
2.2. Light Treatments
In this study, there were four light treatments as shown in Table 1: (1) L1, 12 h SL; (2), L2, 3 h LED → 12 h SL → 3 h LED; (3) L3, 12 h SL → 6 h LED; and (4) L4, 6 h LED → 12 h SL. LED spectral quality with red/blue LED ratios of 2.2 (WR-16W, Beijing Lighting Valley Technology Co., Ltd., Beijing, China) and a light intensity of 180 µmol photon m−2 s−1 was used for all the different light conditions. The additional DLI used for all plants was 3.888 mol·m−2·d−1. Average maximal PPFD and average PPFD inside the greenhouse were about 750 and 250 µmol photon m−2 s−1, respectively, on sunny days. Based on a 12 h photoperiod of SL, the average DLI inside the greenhouse on sunny days was about 10.8 mol·m−2·d−1. Light intensities were measured by holding a PAR quantum sensor with a reading unit (SKP 215 and 200, Skye Instruments Ltd., Llandrindod Wells, UK) beside the leaf until reading stabilized.

Table 1.
Details of light treatment.
2.3. Measurements of Leaf Traits, Shoot, and Root Productivity
Six plants from each treatment were harvested by removing the whole plant from the growth system after transplanting for 16 days when they reached the marketable size with 6 to 8 fully expanded leaves for sweet basil grown under natural SL. Plant height was measured first using a ruler and total leaf number was counted. Then, fresh weight (FW) of different plant organs was measured by separating leaf, stem, and roots and using a weighing balance. Total leaf area was measured using leaf area meter (WinDIAS3 Image Analysis system). To obtain dry weight (DW), leaves, stems, and roots were wrapped separately in aluminum foil and dried in the oven at 80 °C for 4 days to obtain the initial DW. The dry tissues were then reweighed to obtain the constant DW during the next 24 h. Following Hunt et al. [17], specific leaf area (SLA) was calculated as follows:
where LA (leaf area) is expressed as cm2 and LDW (leaf dry weight) is expressed as g.
SLA = LA (cm2)/LDW (g)
2.4. Measurement of Chlorophyll (Chl) and Carotenoids (Car)
The youngest fully expanded leaves from each treatment were harvested from 10:30 to 11:00. Two fresh leaf discs of 1 cm diameter were weighed and soaked in 5 mL of N,N-dimethylformamide (N,N-DMF, sigma chemical co. Darmstadt, Germany) in the dark for 48 h at 4 °C. The absorption of Chl a, Chl b, and Car were measured at 647 nm, 664 nm, and 480 nm, respectively, using a spectrophotometer (UV-2550 Shimadzu, Kyoto, Japan). Total Chl and Car concentrations were calculated according to the method of Welburn [18].
2.5. Measurement of Midday Chl Fluorescence Fv/Fm Ratio
The maximal quantum efficiency of PSII reaction center (Fv/Fm ratio) was measured from dark-adapted leaves (15 min in the darkness) using the Plant Efficiency Analyser (Hansatech Instruments Ltd., King’s Lynn, UK) during midday, from 12:00 to 13:00, in the greenhouses, according to He et al. [19].
2.6. Measurements of Electron Transport Rate (ETR), Effective Photochemical Quantum Yield of PSII [Y(II)], Photochemical Quenching (qP), and Non-Photochemical Quenching (NPQ)
The measurements were carried out using the same detached leaves which were used for Chl and Car determination. Leaf discs were pre-darkened for 15 min and analyzed with IMAGING PAM MAXI (Walz, Effeltrich, Germany), digitized within the camera, and transferred via ethernet interface (GigEVision®) to a personal computer for storage and analysis [20].
2.7. Determination of Nitrate (NO3−)
Dried plant tissue, approximately 0.01 g, was ground with 5 mL deionized water and incubated at 37 °C for two hours. Sample turbidity was removed by filtration through a 0.45 μm-pore-diameter membrane via a vacuum filter. The final volume was made to 50 mL by adding deionized water. NO3− concentration of the plant tissue was determined using the Flow Injection Analyzer (Model Quikchem 8000, Lachat Instruments Inc., Milwaukee, WI, USA) [20].
2.8. Determination of Total Reduced Nitrogen (TRN)
Dried plant tissue, around 0.05 g, was digested with a Kjeldahl tablet and 5 mL of concentrated sulfuric acid at 350 °C until a clear solution was formed. The mixture was cooled for 30 min before TRN concentration was determined using a Kjeltec 2300 analyzer (Foss Tecator AB, Höganäs, Sweden) through titration [20].
2.9. Determination of Total Leaf Soluble Protein
Fresh leaves (1 g) were ground and 6 mL of extraction buffer [100 mM Bicine-KOH] (pH 8.1), 20 mM MgCl2, and 2% PVP buffer modified from Lowry [21] were added. The mixture was centrifuged at 35,000 rpm for 30 min at 4 °C (Beckman ultracentrifuge Optima XL-100 K, Beckman Coulter, Inc., Fullerton, CA, USA). A total of 1 mL supernatant was mixed with 4 mL of 80% cold acetone and centrifuged for 10 min at 4000 rpm, using a bench-top centrifuge. Total leaf soluble protein was calculated from a standard curve assay and absorbance values from a spectrophotometer (Shimadzu Spectrophotometer 2550, Kyoto, Japan) at 740 nm.
2.10. Measurement of Ascorbic Acid
Frozen leaf tissues (0.5 g) were homogenized in liquid nitrogen in the presence of 1 g NaCl and extracted in 5 mL ice-cold 2% (w/v) metaphosphoric acid. The homogenate was centrifuged at 4 °C for 15 min at 13,000 rpm. A total of 0.3 mL of supernatant was mixed with 0.2 mL of 45% (w/v) K2HPO4 and 0.1 mL 0.1% (w/v) homocysteine. The mixture was incubated, and 1 mL of 2 M citrate–phosphate buffer (pH 2.3) and 1 mL 0.003% (w/v) DCPIP were added. The absorbance at 524 nm was immediately measured using a spectrophotometer (UV-2550 Shimadzu, Kyoto, Japan) according to Leipner et al. [22].
2.11. Measurement of Total Phenolic Compounds
Fresh shoot tissues (0.5 g) were ground in liquid nitrogen and 5 mL of 80% methanol was added. The extracts were shaken for 30 min at 200 rpm and centrifuged for 20 min at 3500 rpm. A total of 0.5 mL of supernatant was diluted with 0.5 mL of diluted Folin–Ciocalteau reagent and 1 mL of 7.5% Na2CO3 solution. After 20 min, the absorbances were measured at 765 nm using UV-2550 spectrophotometer (Shimadzu, Kyoto, Japan) [23].
2.12. Measurement of Inorganic Dietary Minerals
About 0.2 g of dried shoot tissue was digested in 4 mL of 65% HNO3 using UltraWAVE single reaction chamber microwave digestion system (Milestone, Inc., Shelton, CT, USA). Mixture was diluted with Milli-Q water to a total volume of 25 mL. Inductively coupled plasma optical emission spectrophotometry (ICP-OES) was performed using Optima 8300 ICP-OES Spectrometer and WinLab 32 (Perkin Elmer, Waltham, MA, USA).
2.13. Statistical Analysis
One-way analysis of variance (ANOVA) was performed to determine if there were any statistically significant differences among the treatment groups. When p-value < 0.05, post hoc Tukey’s test was used to discriminate the means among the levels of the corresponding factor. Statistical analysis was performed using Rstudio version 2023.03.0+386.
3. Results
3.1. Leaf Growth, Root and Shoot Productivity, and Root Morphology
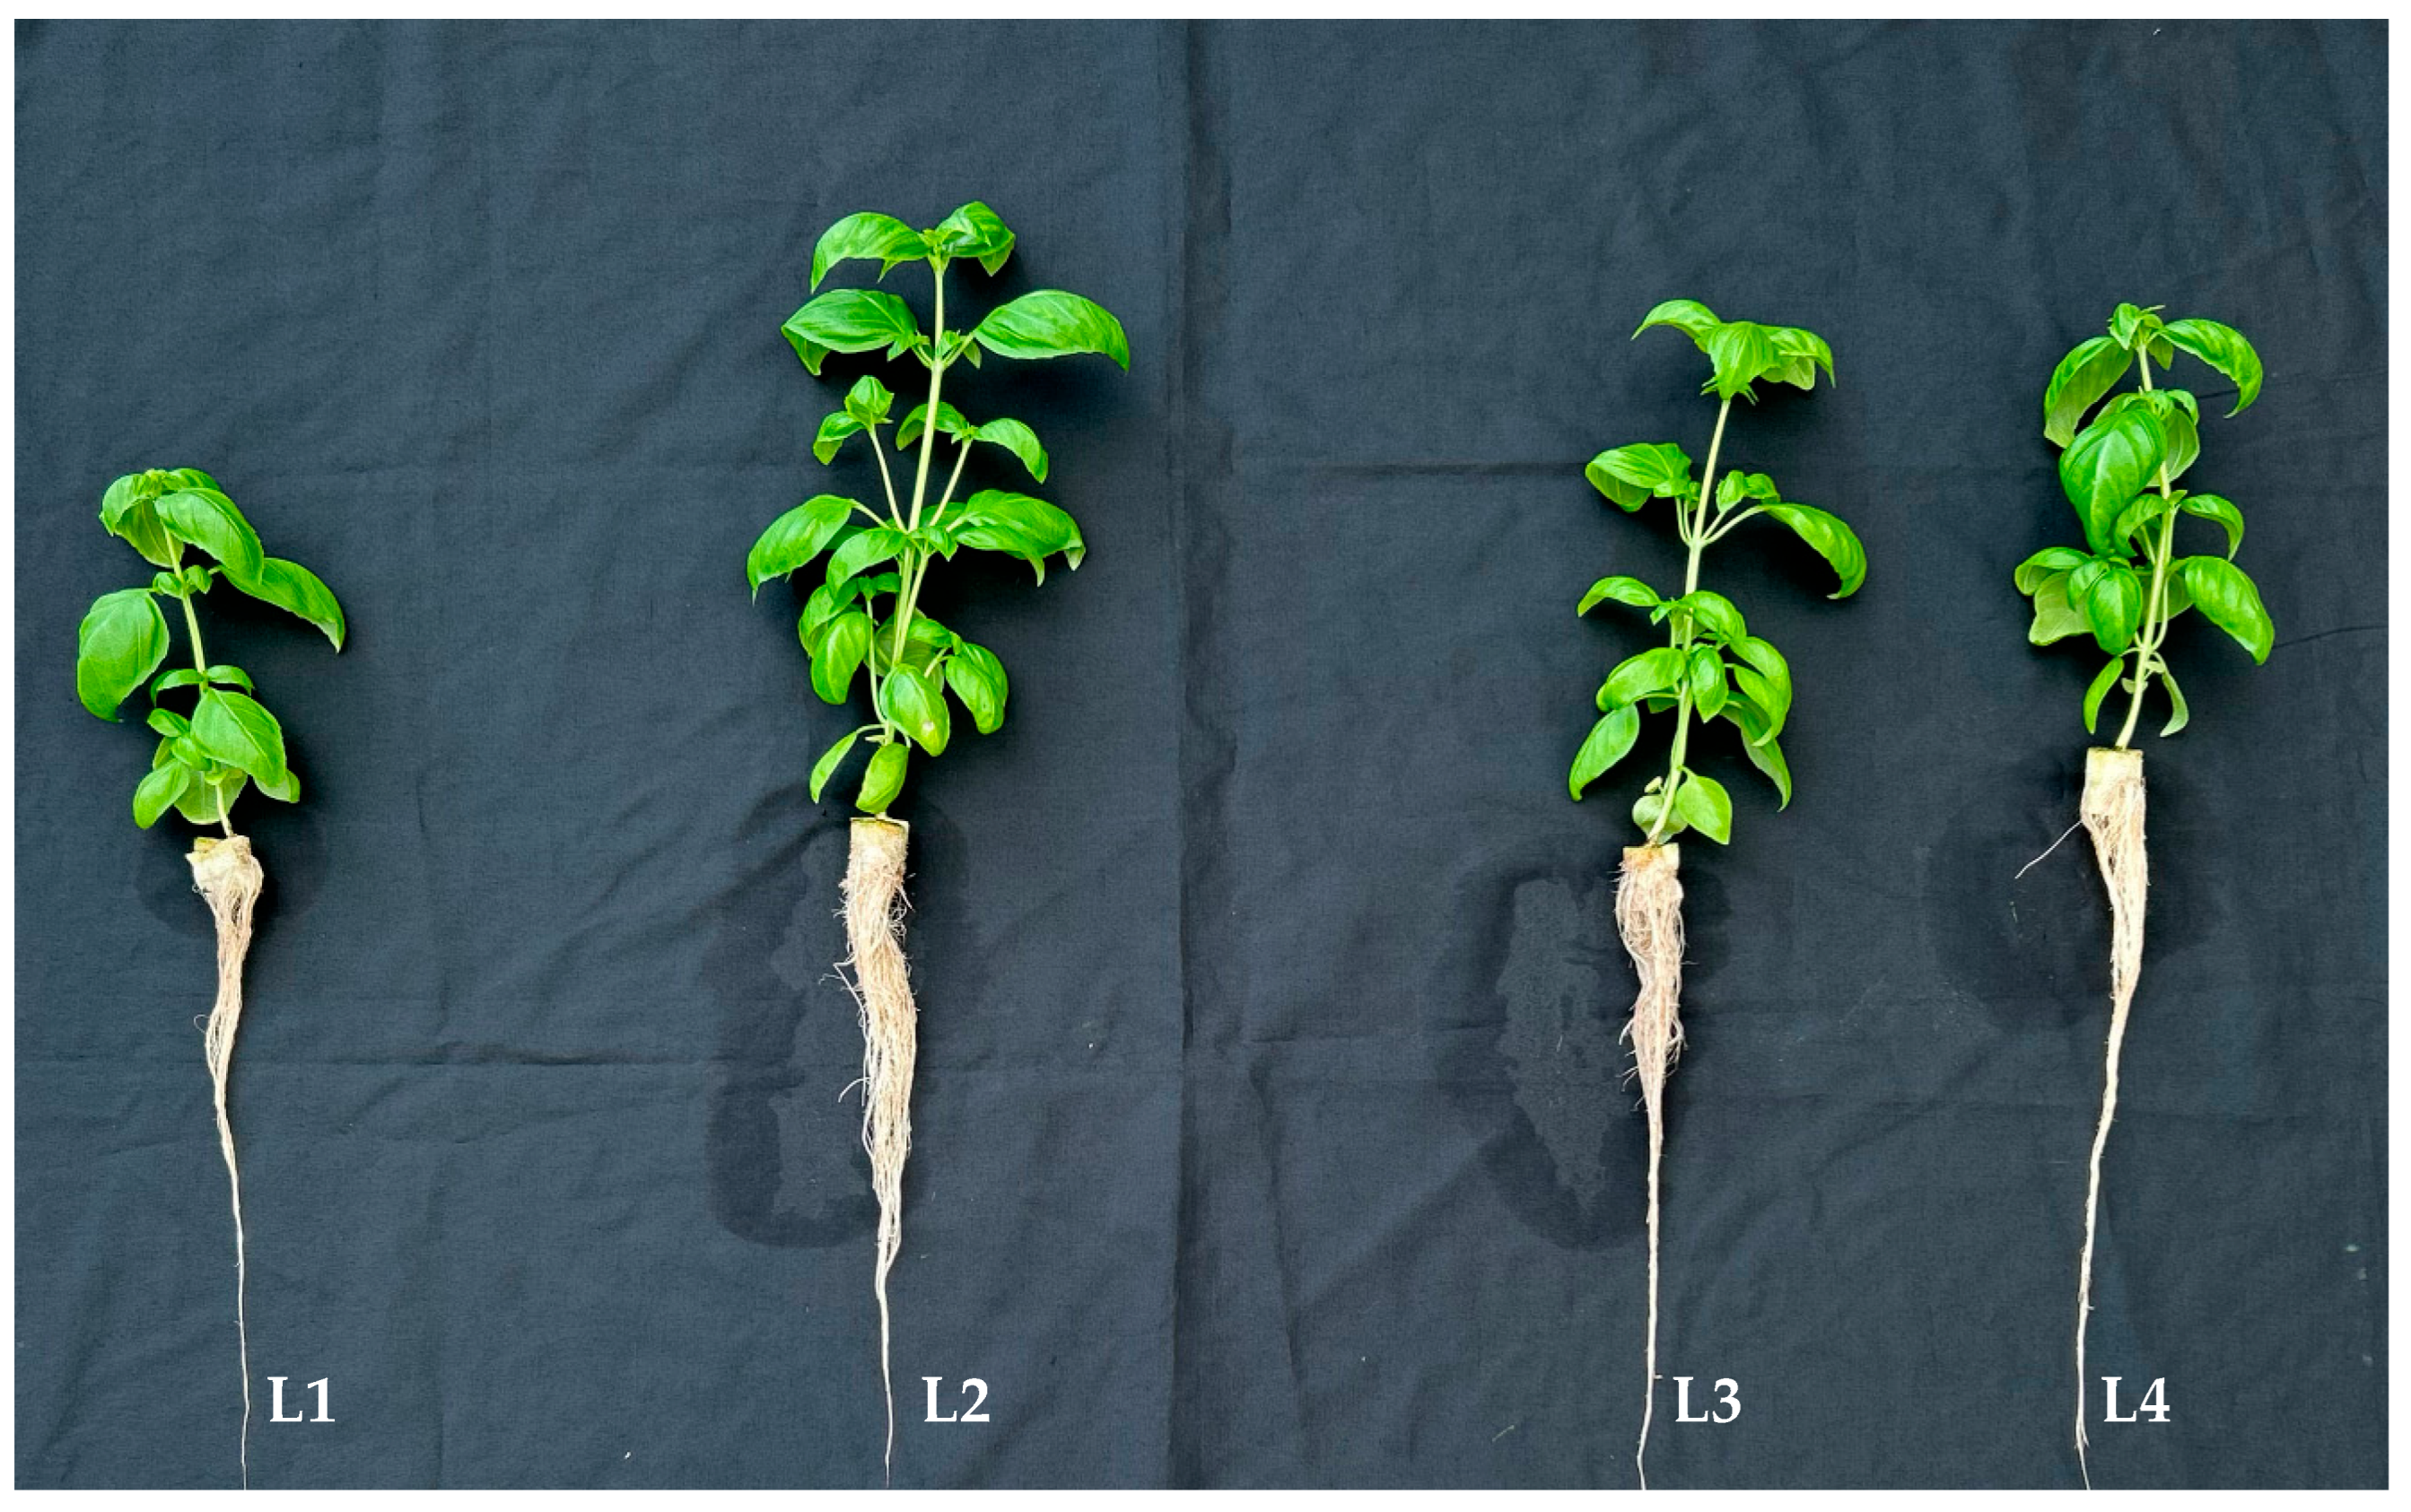
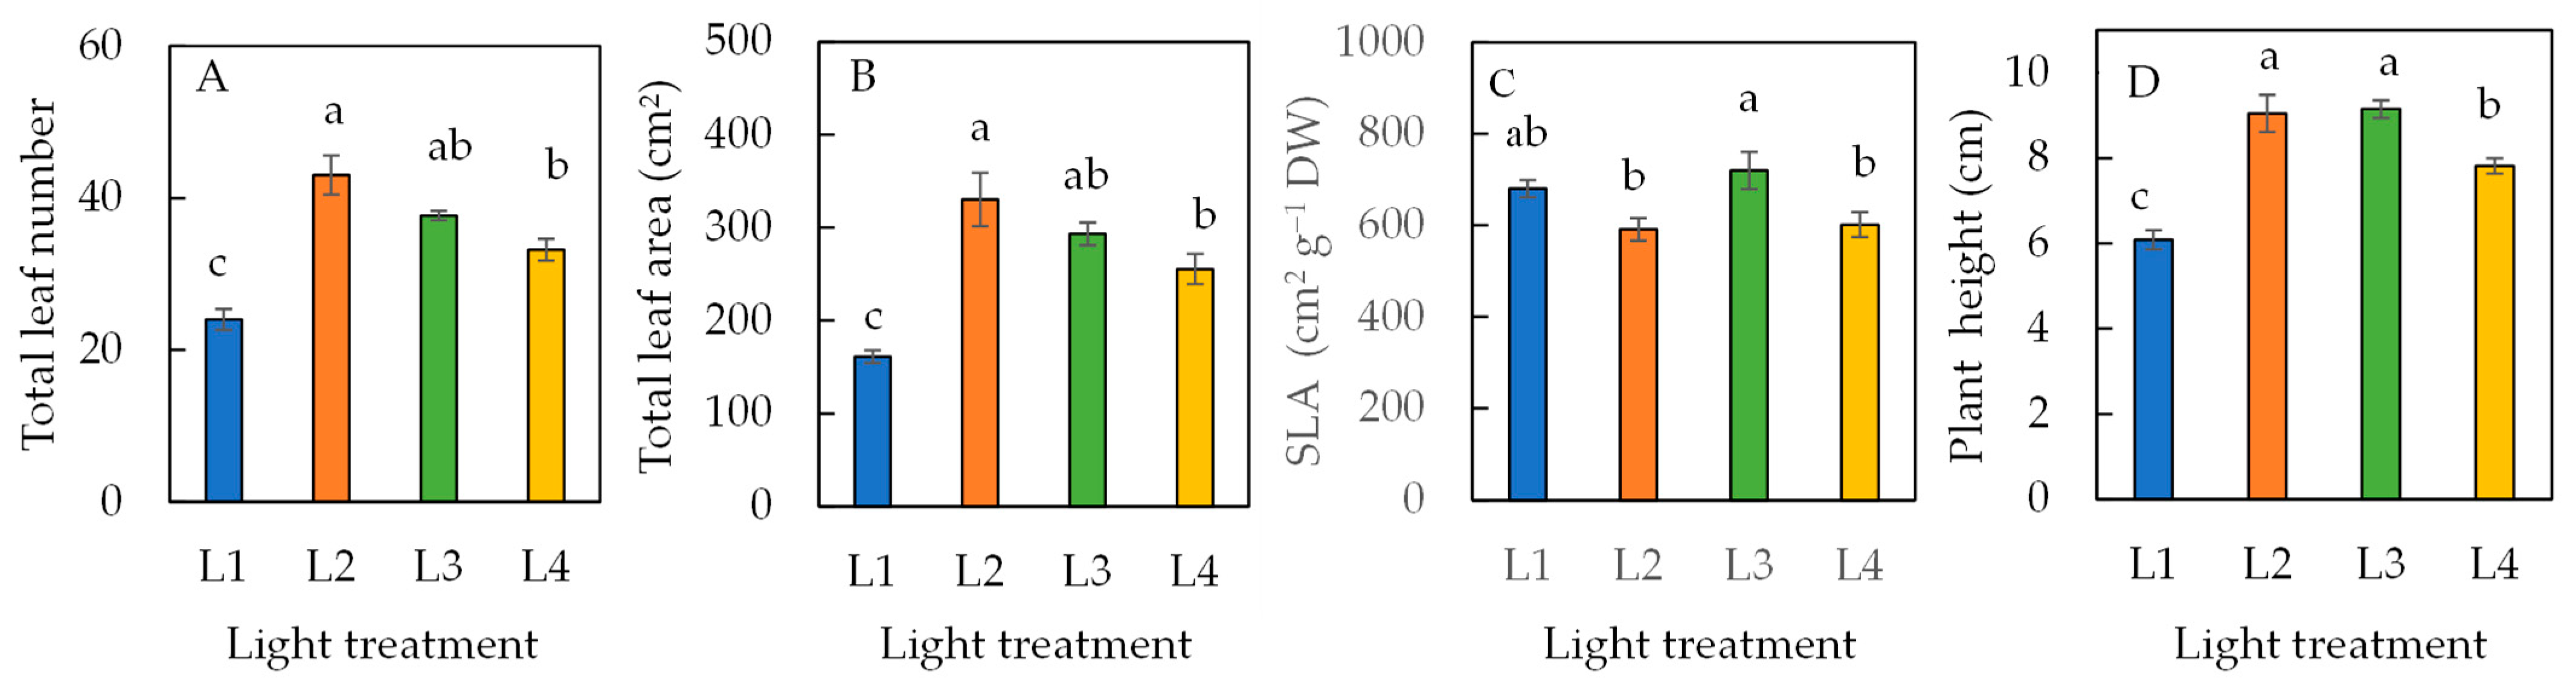
Figure 1 shows sweet basil grown under different light conditions for 16 days. Compared to the L1 plants grown under SL alone, all other plants grown under SL plus 6 h extended photoperiod were much bigger, with the biggest plants grown under L2 conditions. The differences in the growth performances among the different plants were supported by growth traits, such as total leaf number, total leaf area, specific leaf area (SLA), and plant height (Figure 2). Plants grown under 6 h extended photoperiod, such as in L2, L3, and L4 conditions, had a significantly greater total leaf number (Figure 2A), larger total leaf area (Figure 2B), and taller plant height (Figure 2D) compared to the L1 condition without supplementary LED lighting. The specific leaf area, SLA (Figure 2C), was lowest in plants grown under L2 and L4 conditions and highest in plants grown under L3 conditions. Among plants grown under L2, L3, and L4, the total leaf number and total leaf area had similar trends, while plants grown under L2 had higher values than under L4. However, no differences were seen between plants under L3 and L4. For plant height, plants grown under L2 and L3 were significantly higher than plants grown under L1 and L4 conditions.
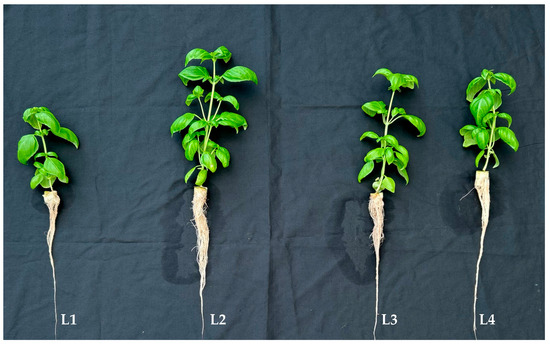
Figure 1.
Hydroponically grown sweet basil plants under different light conditions for 16 days in the tropical greenhouse. Refer to Table 1 for details of L1, L2, L3, and L4 treatments.
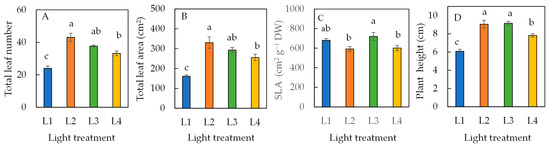
Figure 2.
Total leaf number (A), total leaf area (B), specific leaf area, SLA (C), and plant height (D) of sweet basil grown under different light conditions for 16 days. Values are means ± standard errors. Means with different letters are statistically different (p < 0.05; n = 6) as determined by Tukey’s multiple comparison test. Refer to Table 1 for details of L1, L2, L3, and L4 treatments.
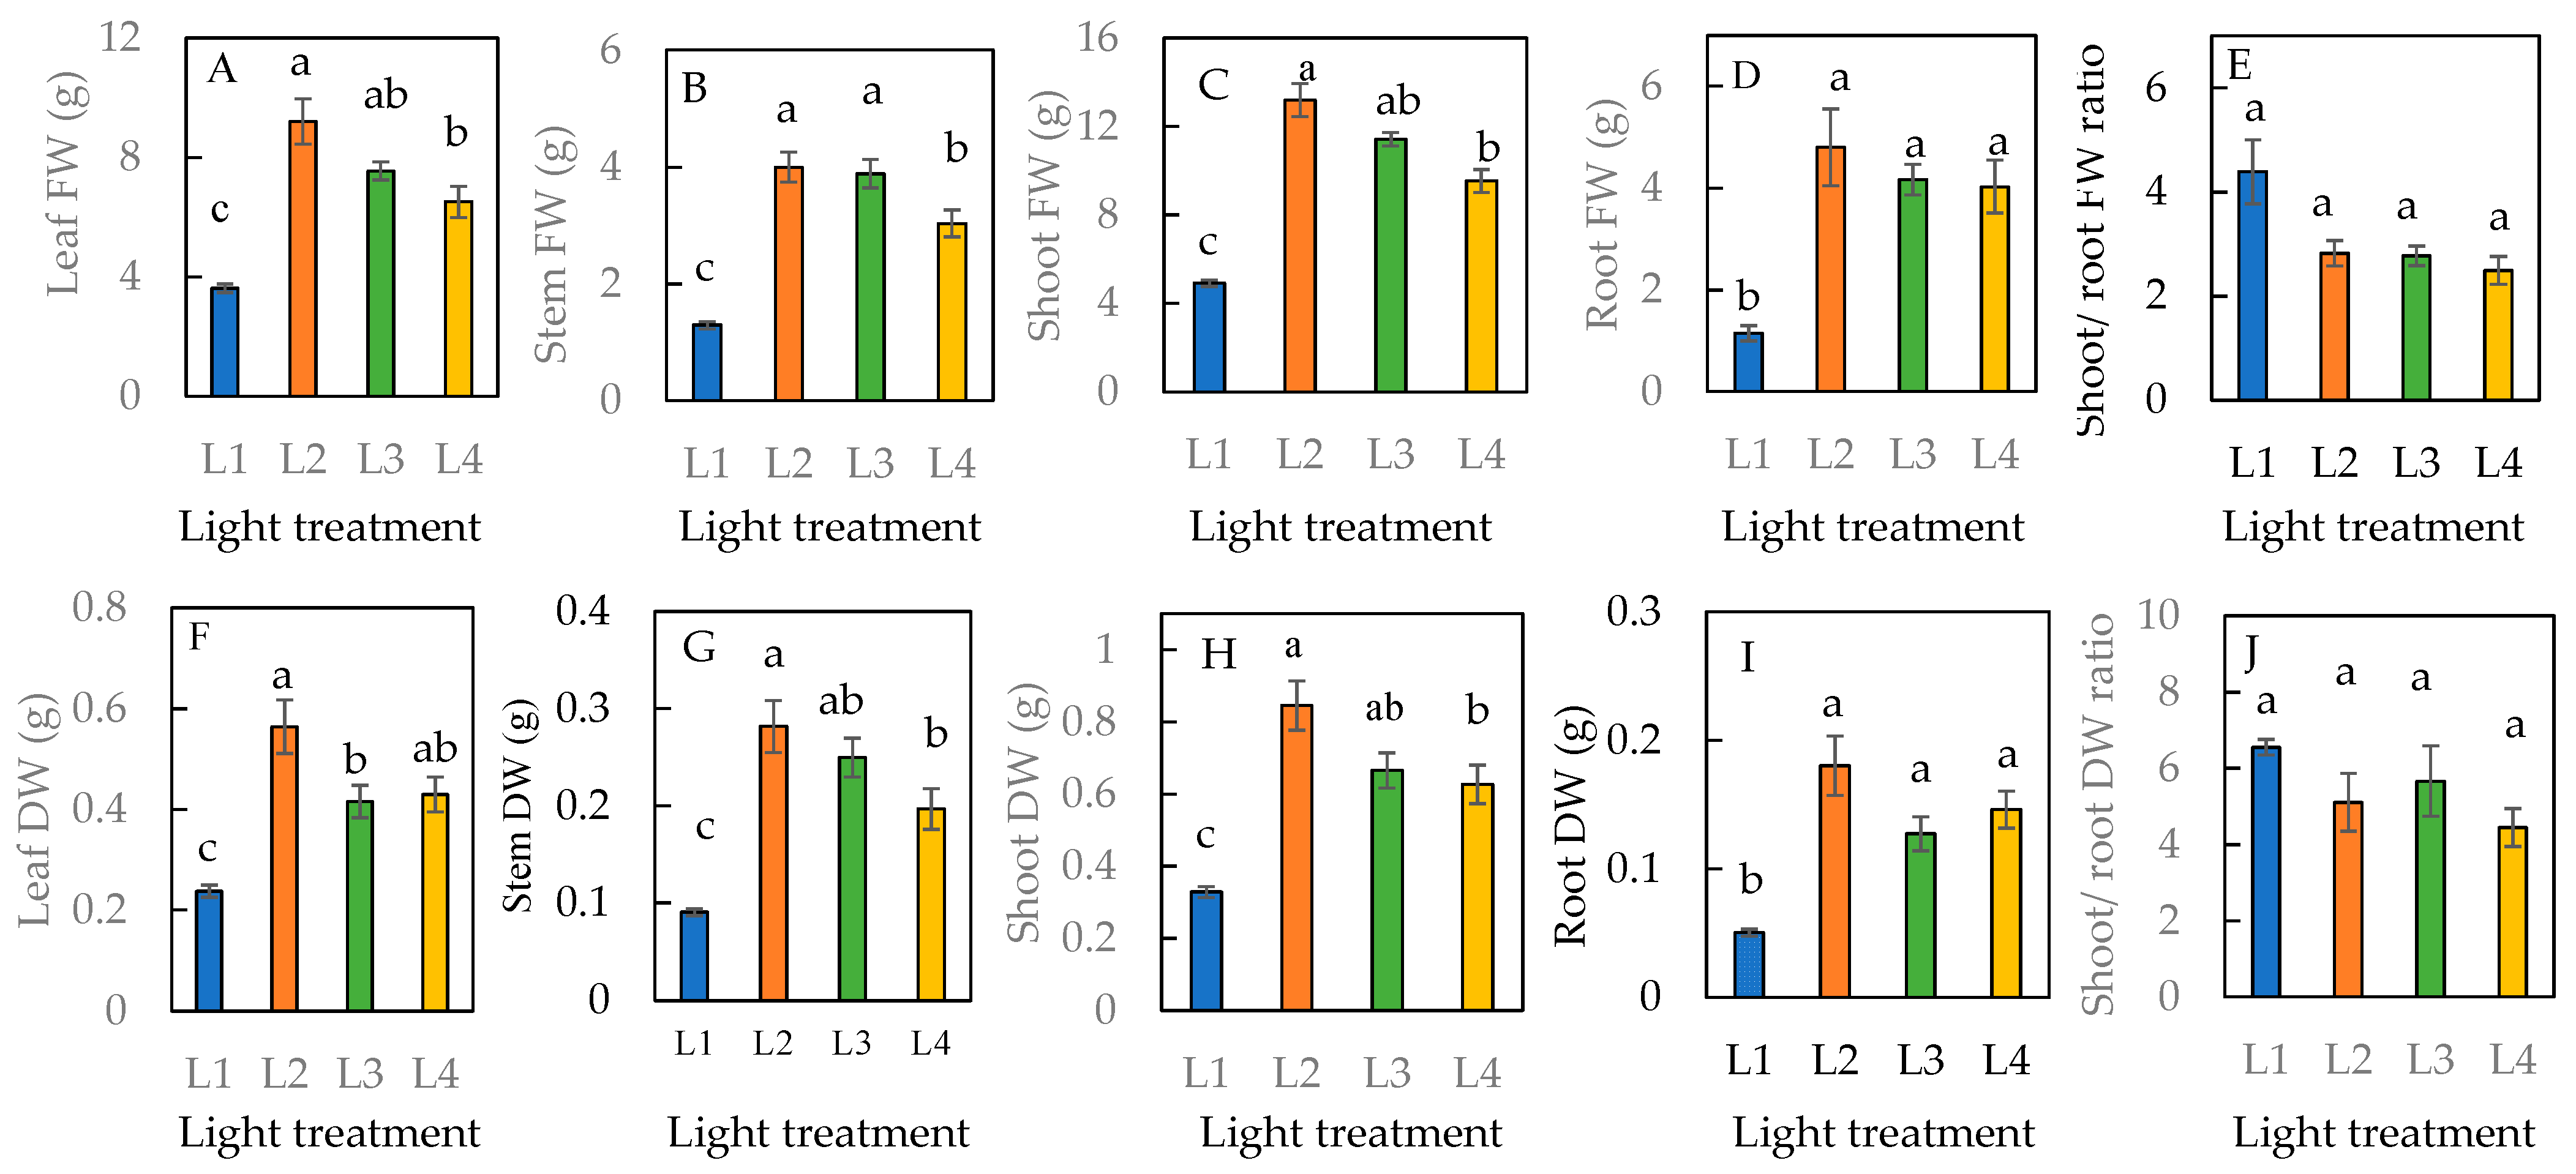
The leaf and stem FW and DW of plants grown under the L1 condition were significantly lower than all the other treatments with an extended photoperiod of 6 h (Figure 3A,B,F,G). Among the L2, L3, and L4 conditions that received supplementary LED light for 6 h, L2 was the optimal condition. The shoot and root FW and DW were significantly higher in plants under L2, L3, and L4 conditions compared to under the L1 condition (Figure 3C,D,H,I). There were no significant differences in the shoot/root FW and DW ratios across all four treatments (Figure 3E,J).
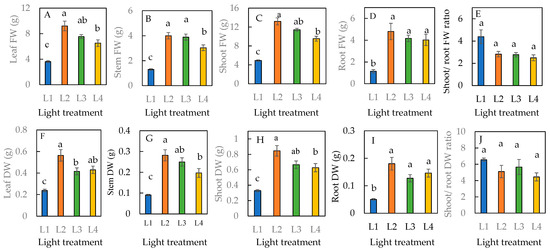
Figure 3.
Leaf fresh weight (FW) (A), stem FW (B), shoot FW (C), root FW (D), shoot/root FW ratio (E), leaf dry weight (DW) (F), stem DW (G), shoot DW (H), root DW (I), and shoot/root DW ratio (J) of sweet basil grown under different light conditions for 16 days. Values are means ± standard errors. Means with different letters are statistically different (p < 0.05; n = 6) as determined by Tukey’s multiple comparison test. Refer to Table 1 for details of L1, L2, L3, and L4 treatments.
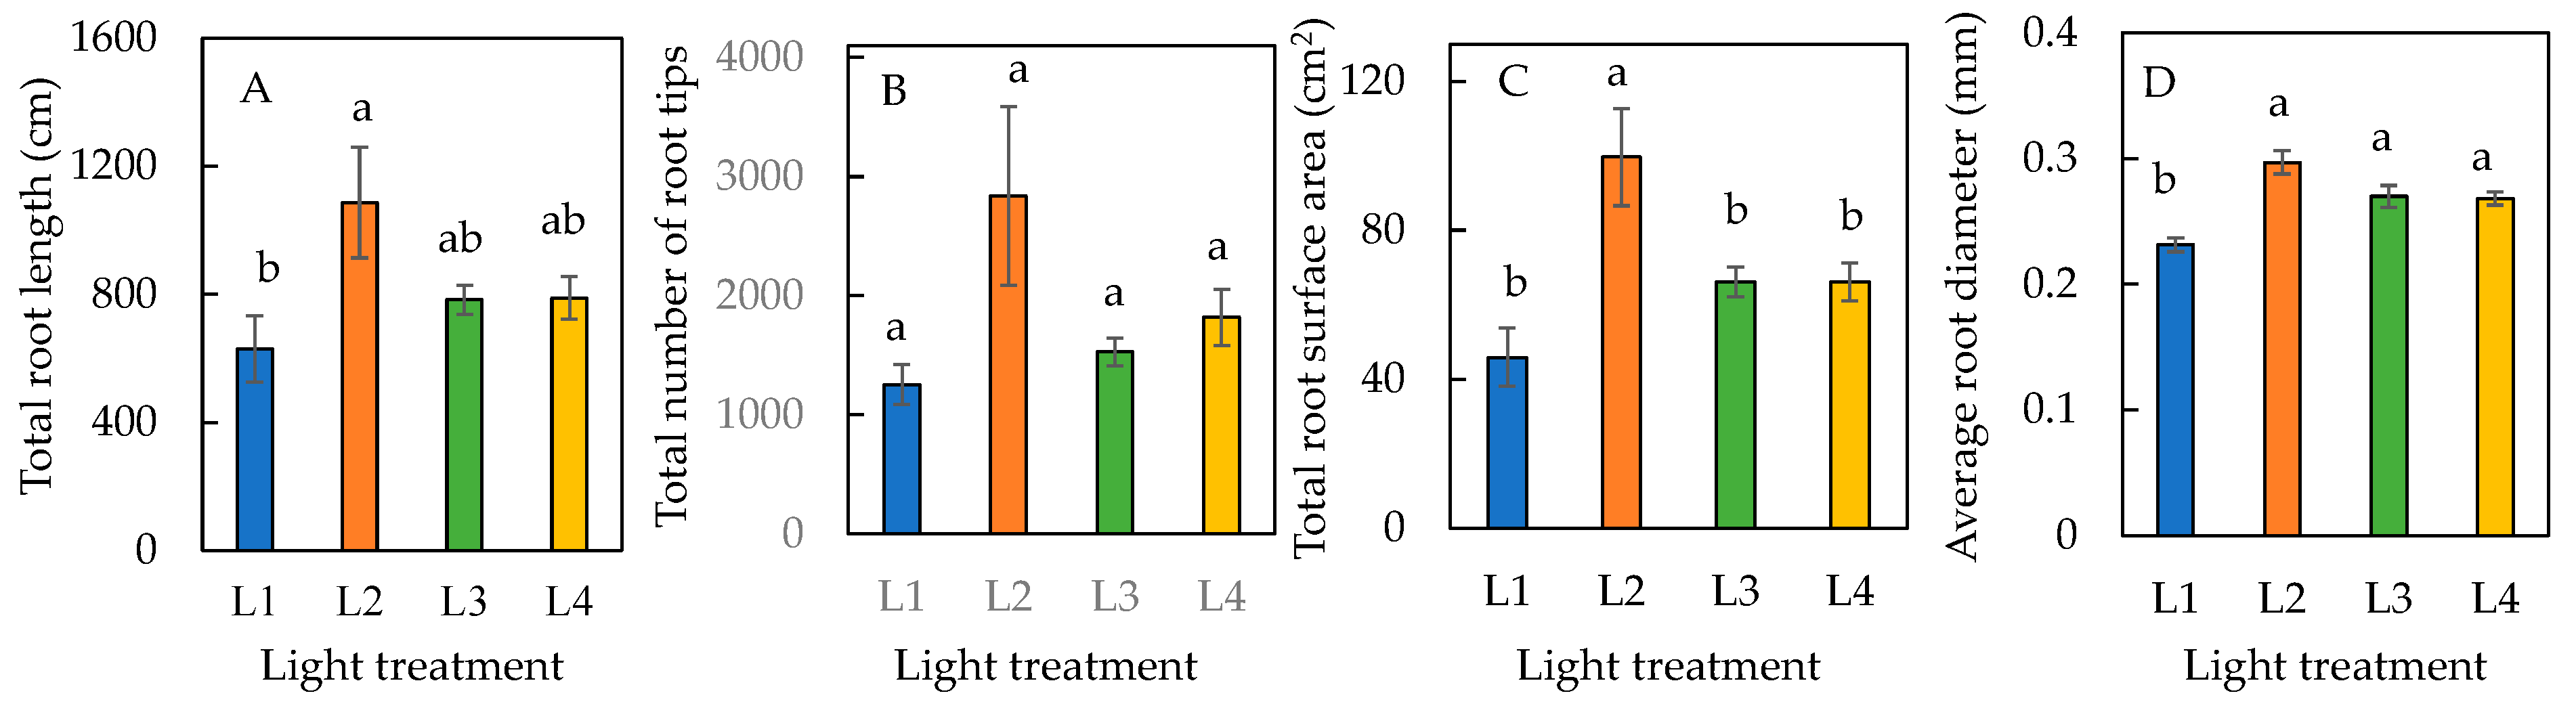
The total root length and total root surface area were greatest in plants under the L2 condition (Figure 4A,C). There was no significant difference in total root surface area among plants under L1, L3, and L4 conditions (Figure 4C). Due to the large standard error of L2 plants, there was no significant difference in the total number of root tips across all four treatments (Figure 4B). The average root diameters of plants were significantly higher in L2, L3, and L4 conditions compared to the L1 condition, but there was no significant difference amongst L2, L3, and L4 conditions (Figure 4D). The total root length, total number of root tips, total root surface area, and average root diameter were all highest in L2, making it the optimal condition for root growth and development.
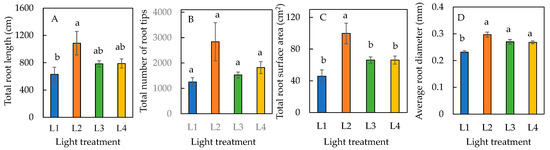
Figure 4.
Total root length (A), total number of root tips (B), total root surface area (C), and average root diameter (D) of sweet basil grown under different light conditions for 12 days. Values are means ± standard errors. Means with different letters are statistically different (p < 0.05; n = 6) as determined by Tukey’s multiple comparison test. Refer to Table 1 for details of L1, L2, L3, and L4 treatments.
3.2. Photosynthetic Pigment and Photosynthetic Light Use Efficiency
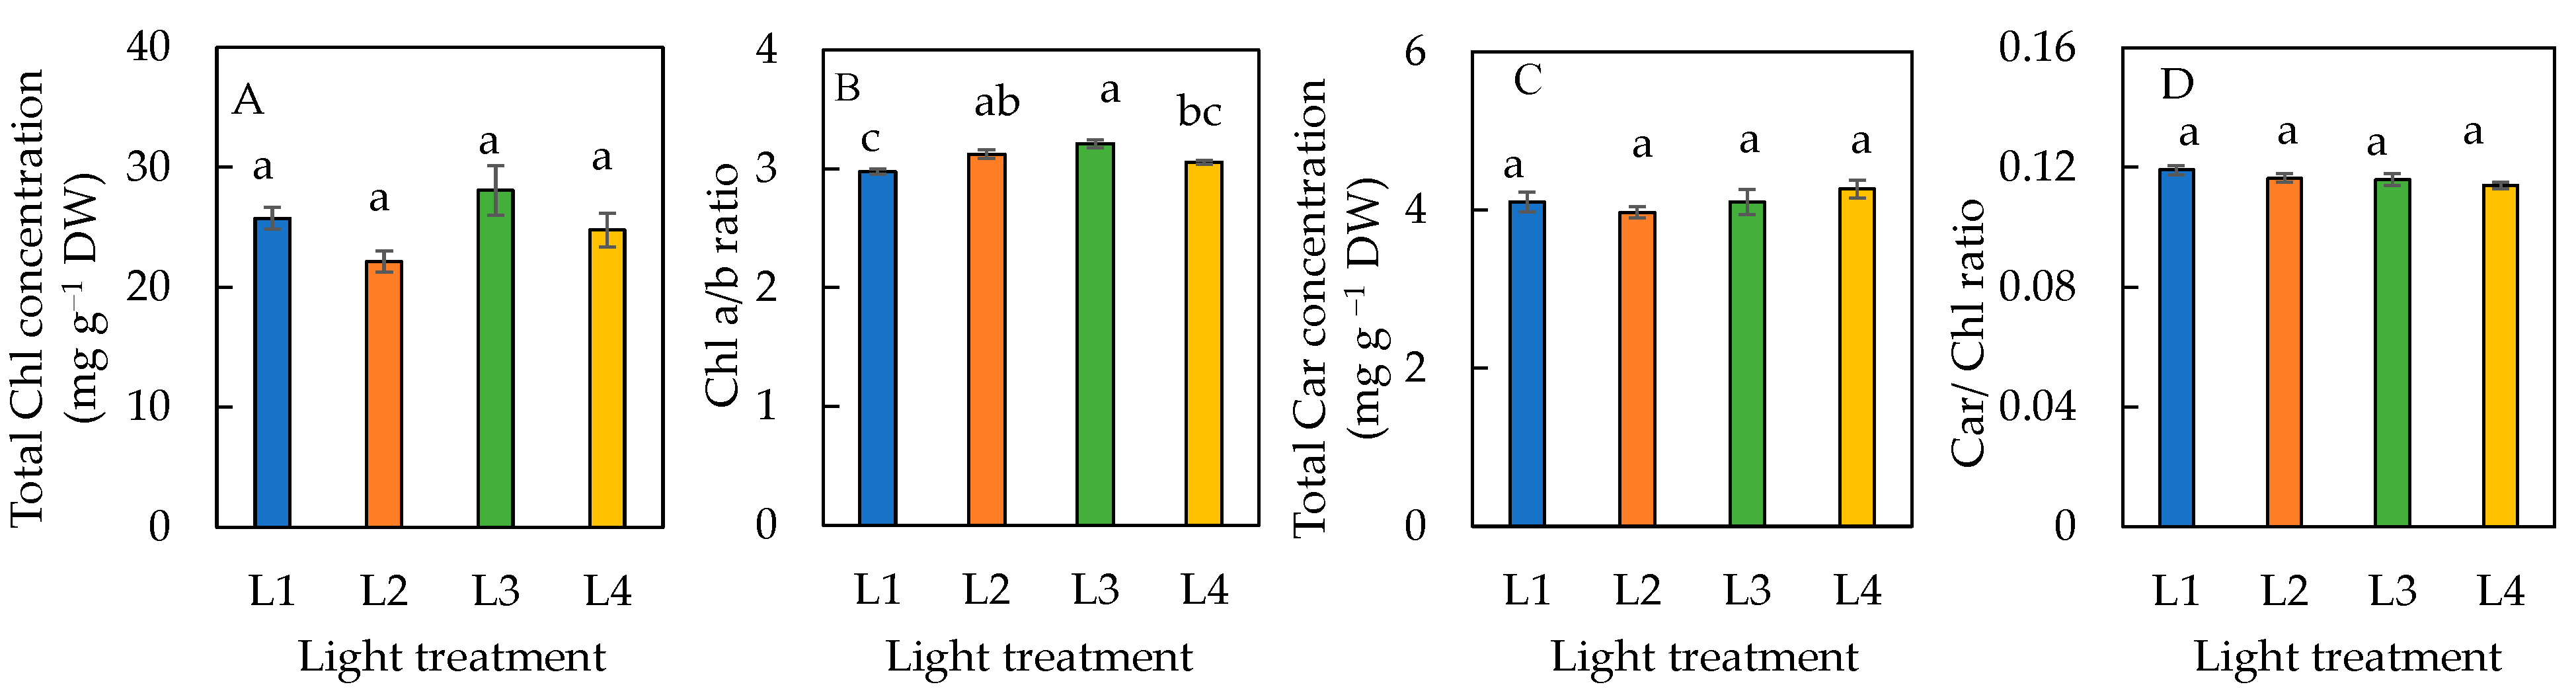
There were no significant differences in the total Chl, total Car concentrations, and Car/Chl ratio amongst plants grown under all four different light conditions (Figure 5A,C,D). The Chl a/b ratio was significantly lower in plants under L1 than L2 and L3 conditions (Figure 5B). There was no significant difference in the Chl a/b ratio between L1 and L4, and L2 and L3 conditions.
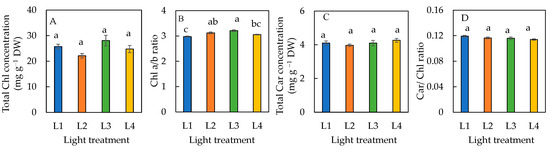
Figure 5.
Total Chl concentration (A), Chl a/b ratio (B), total Car concentration (C), and Car/Chl ratio (D) of sweet basil grown under different light conditions for 12 days. Values are means ± standard errors. Means with different letters are statistically different (p < 0.05; n = 6) as determined by Tukey’s multiple comparison test. Refer to Table 1 for details of L1, L2, L3, and L4 treatments.
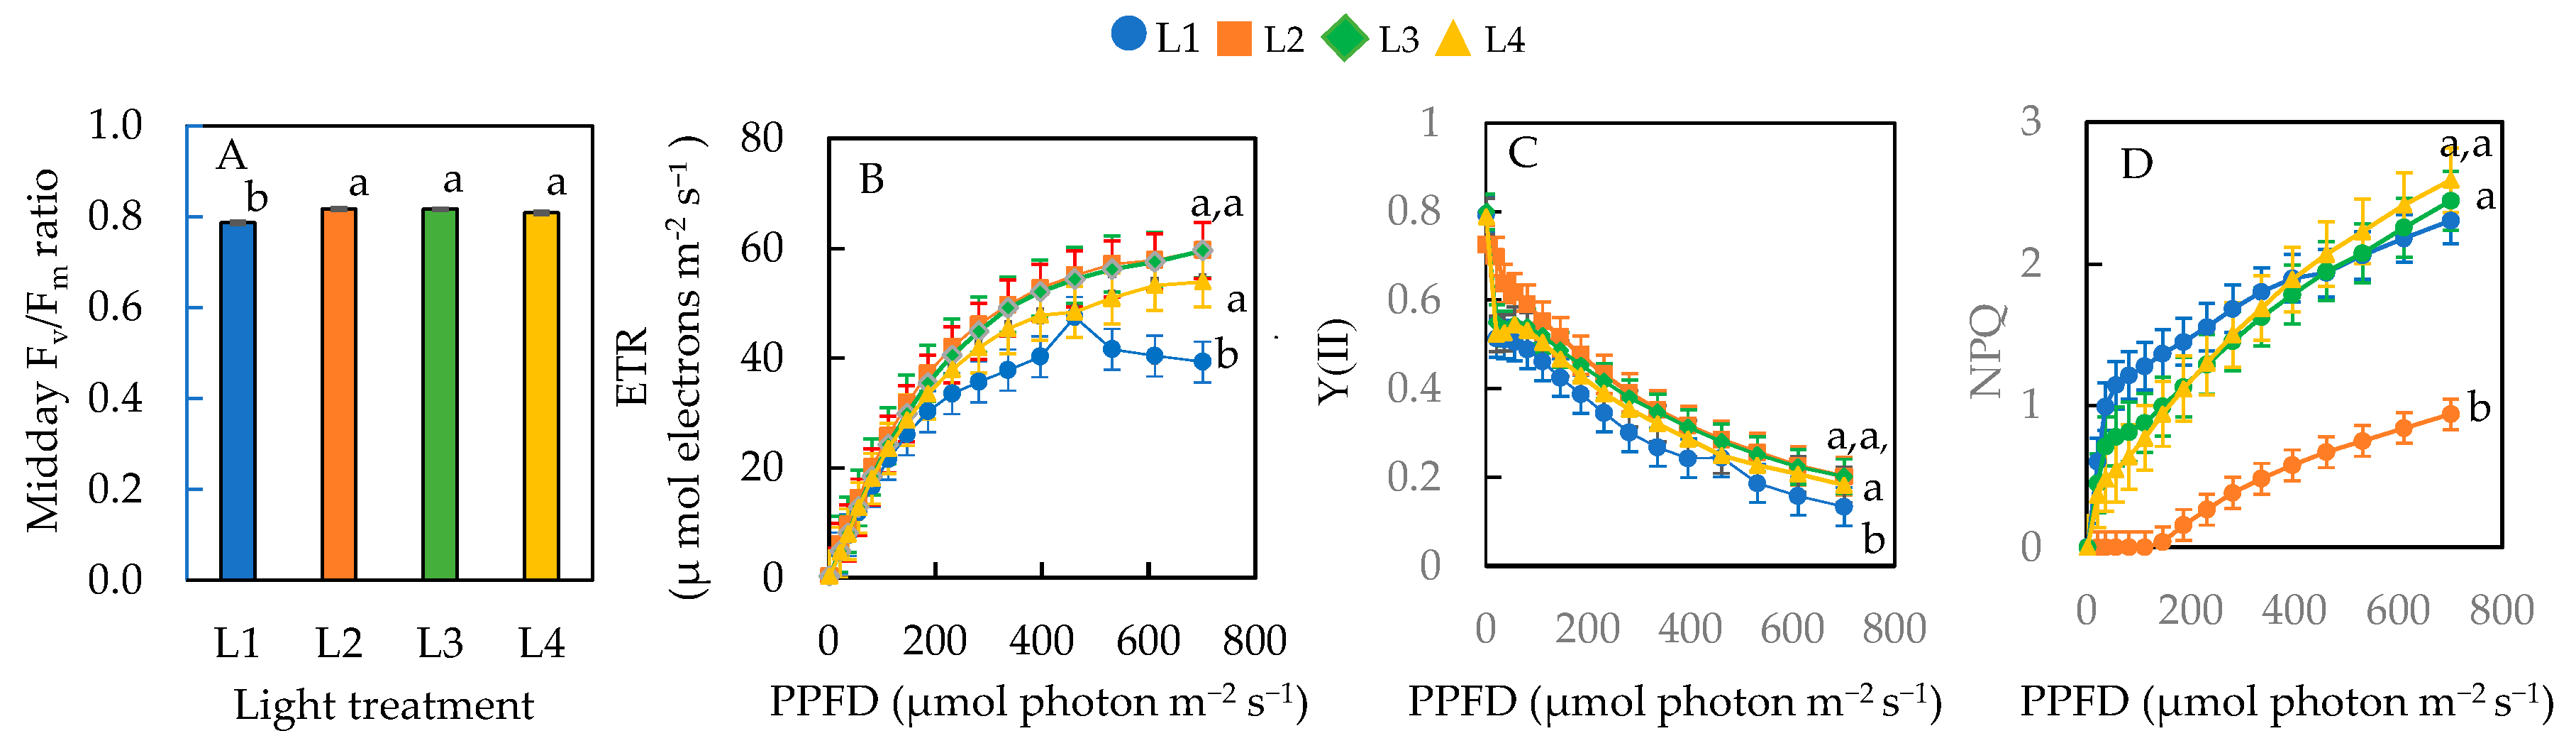
The midday Fv/Fm ratio of plants under L2, L3, and L4 conditions were not significantly different, but they were all significantly higher than L1 (Figure 6A). With increasing actinic light, the ETR (Figure 6B) and NPQ (Figure 6D) increased while Y(II) decreased (Figure 6C) gradually for all plants. Based on the graphs, there were differences in the ETR, Y(II), and NPQ across the different treatments measured under a PPFD of 701 µmol photon m−2 s−1. As mentioned earlier, the average maximal PPFD inside the greenhouse was 750 µmol photon m−2 s−1 on sunny days. Thus, statistical analyses were carried out under the maximal actinic lights at a PPFD of 701 µmol photon m−2 s−1, which was closer to the maximal growth irradiance under natural SL. Sweet basil plants grown under the L1 condition had a significantly lower ETR than L2, L3, and L4 conditions, but there was no significant difference in the ETR among plants under L2, L3, and L4 (Figure 6B). Y(II) was significantly lower for L1 plants than those of L2, L3, and L4 (Figure 6C). There was no significant difference in Y(II) among plants under L2, L3, and L4 conditions. The NPQ was significantly lower in plants under L2 compared to L1, L3, and L4 Conditions. There was no significant difference in NPQ among plants grown under L1, L3, and L4 conditions (Figure 6D).
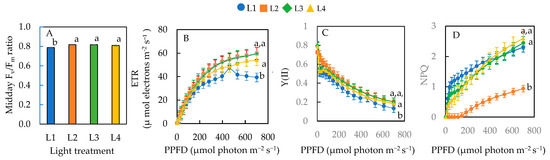
Figure 6.
Midday Fv/Fm ratio (A), ETR (B), effective quantum yield of PSII, Y(II) (C), and NPQ (D) of sweet basil grown under different light conditions for 12 days. Values are means ± standard errors. Means with different letters are statistically different (p < 0.05; n = 6) as determined by Tukey’s multiple comparison test. Refer to Table 1 for details of L1, L2, L3, and L4 treatments.
3.3. NO3−, TRN Concentration, and Total Leaf TSP
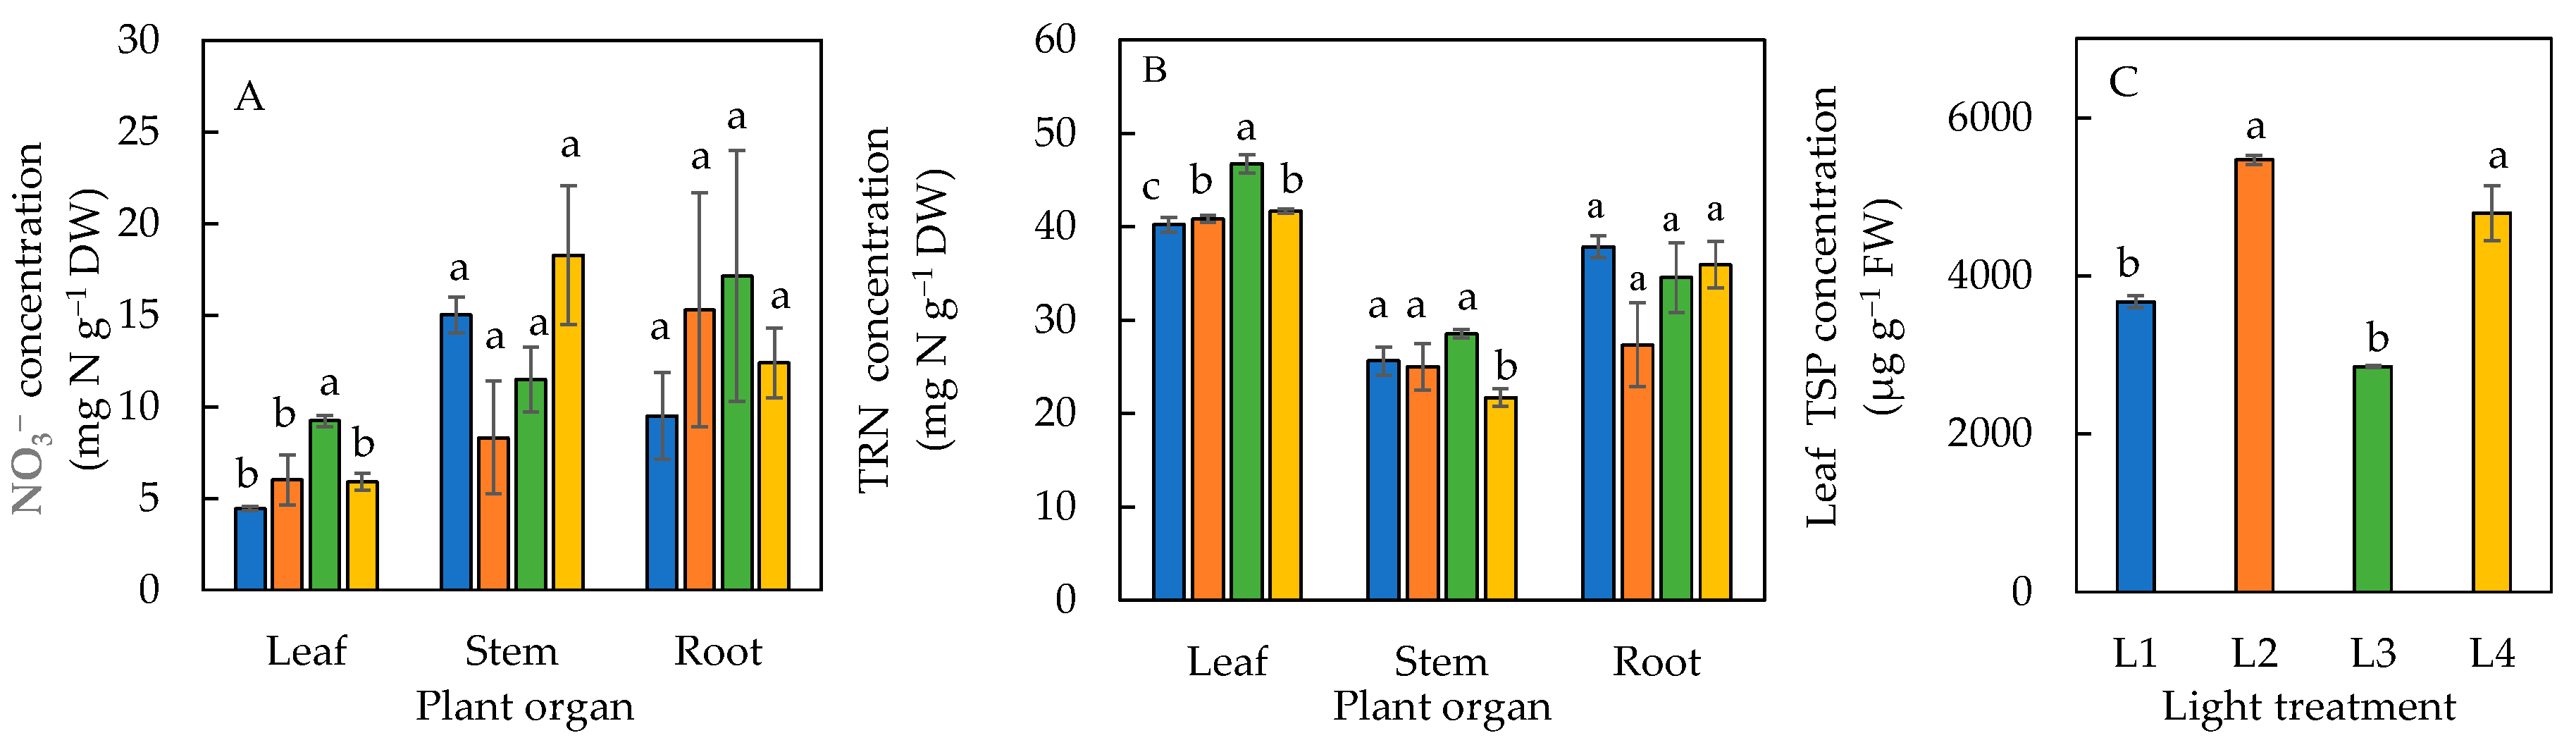
The leaf NO3− concentration in plants under the L3 condition was significantly higher than the L1, L2, and L4 conditions (Figure 7A). For both the stem and roots, there were no significant differences in their NO3− concentrations under all four light treatments (Figure 7A). The leaf TRN concentration was significantly lower in plants under L1 than the other three treatments and was significantly lowest for the stem TRN under L4. No significant difference in TRN was seen in the roots of plants under all four treatments (Figure 7B). The total soluble protein in leaves in the plants under L2 and L4 were similar but significantly higher than L1 and L3 plants (Figure 7C).
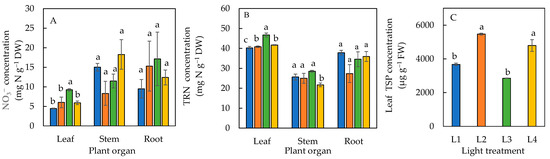
Figure 7.
NO3− (A) and total reduced nitrogen, TRN (B) concentrations in various plant organs, and leaf total soluble protein, TSP (C) of sweet basil grown under different light conditions for 12 days. Values are means ± standard errors. Means with different letters are statistically different (p < 0.05; n = 4) as determined by Tukey’s multiple comparison test. Refer to Table 1 for details of L1, L2, L3, and L4 treatments.
3.4. Total Ascorbic Acid, Total Phenolic Compounds, and Dietary Minerals
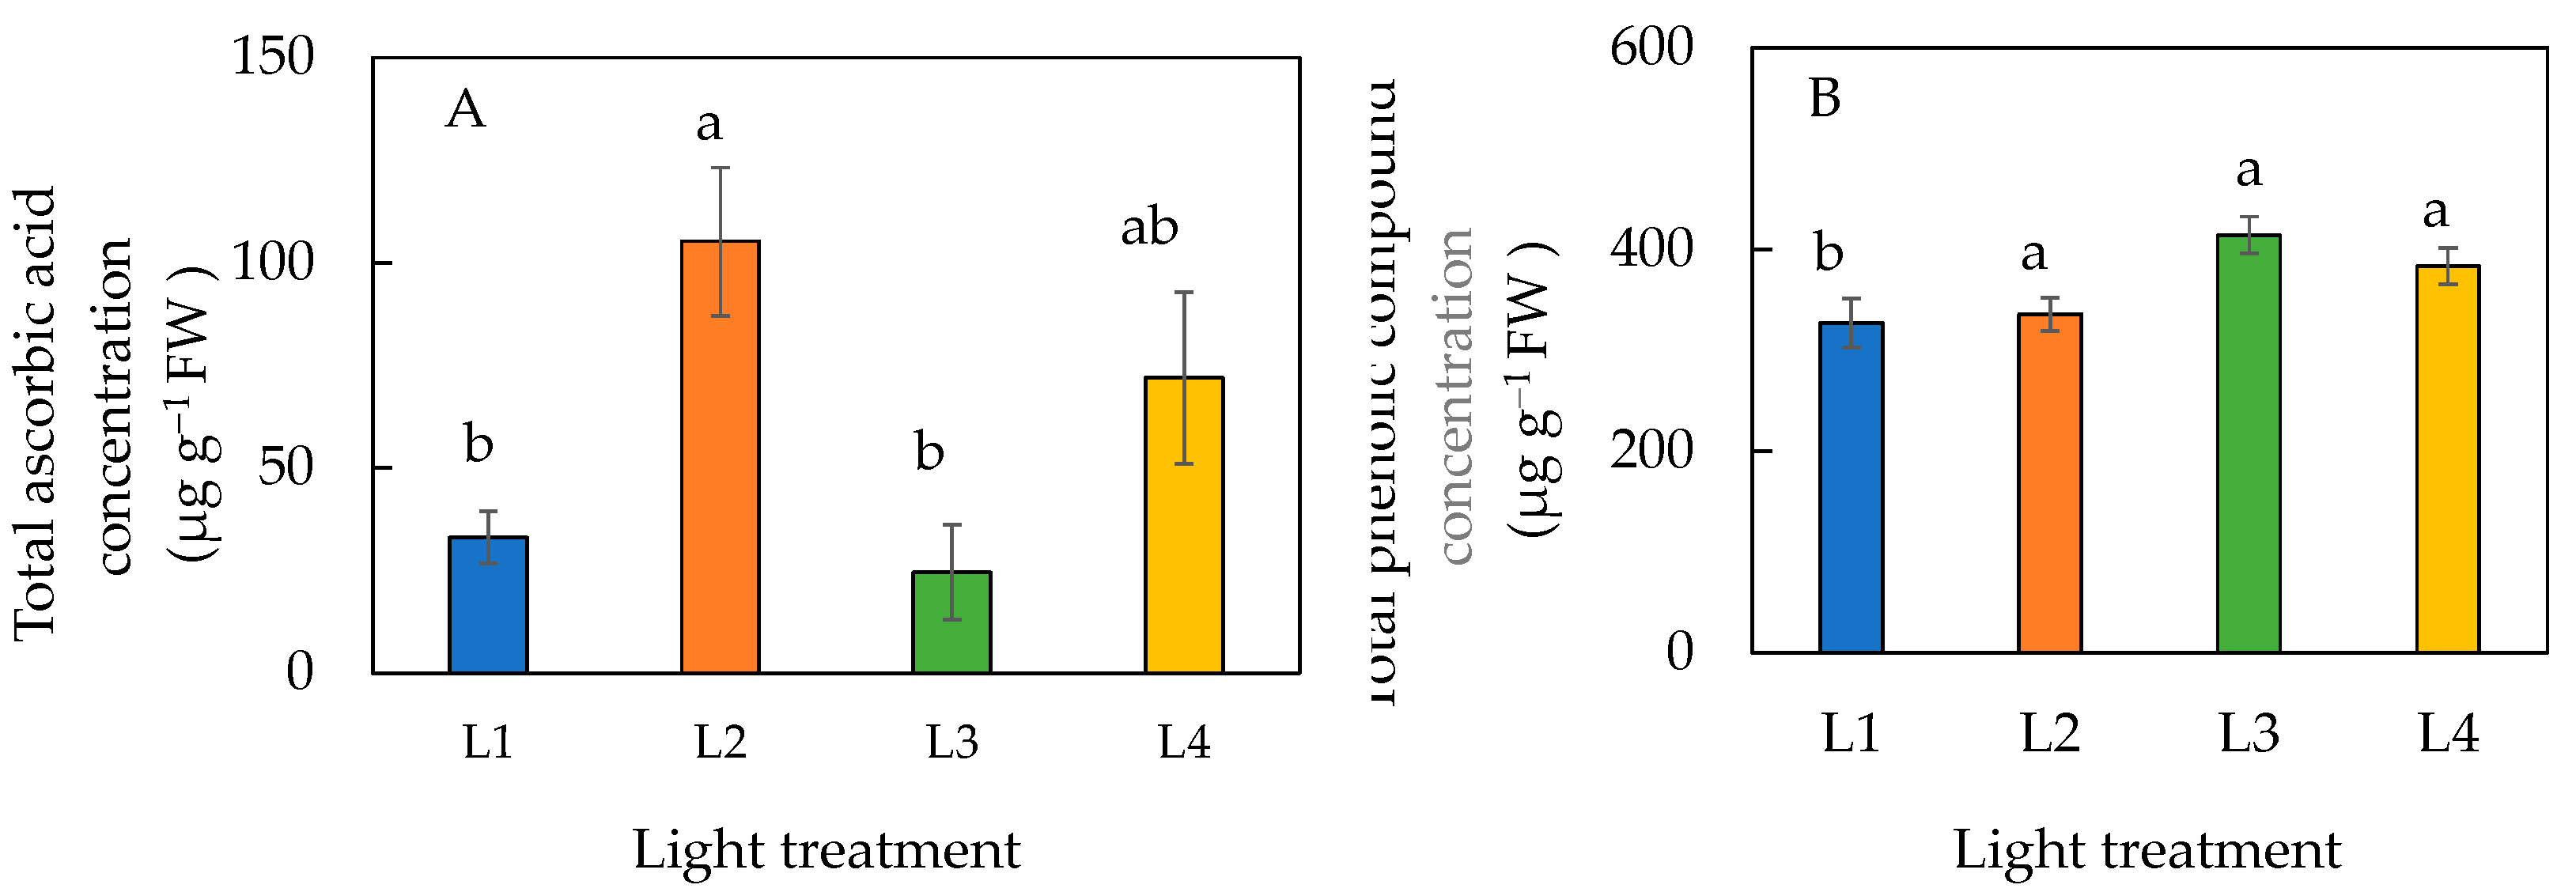
The total ascorbic acid concentration was significantly higher in plants under L2 than those under L1 and L3 conditions (Figure 8A). However, statistically there was no difference in the ascorbic acid concentration among plants grown under L1, L3, and L4 conditions and it was similar between plants grown under L2 and L4 conditions. Plants under L1 had a significantly lower concentration of total phenolic compounds than plants under L2, L3, and L4 conditions (Figure 8B).

Figure 8.
Total ascorbic acid concentration (A) and total phenolic compound concentration (B) of sweet basil grown under different light conditions for 12 days. Values are means ± standard errors. Means with different letters are statistically different (p < 0.05; n = 6) as determined by Tukey’s multiple comparison test. Refer to Table 1 for details of L1, L2, L3, and L4 treatments.
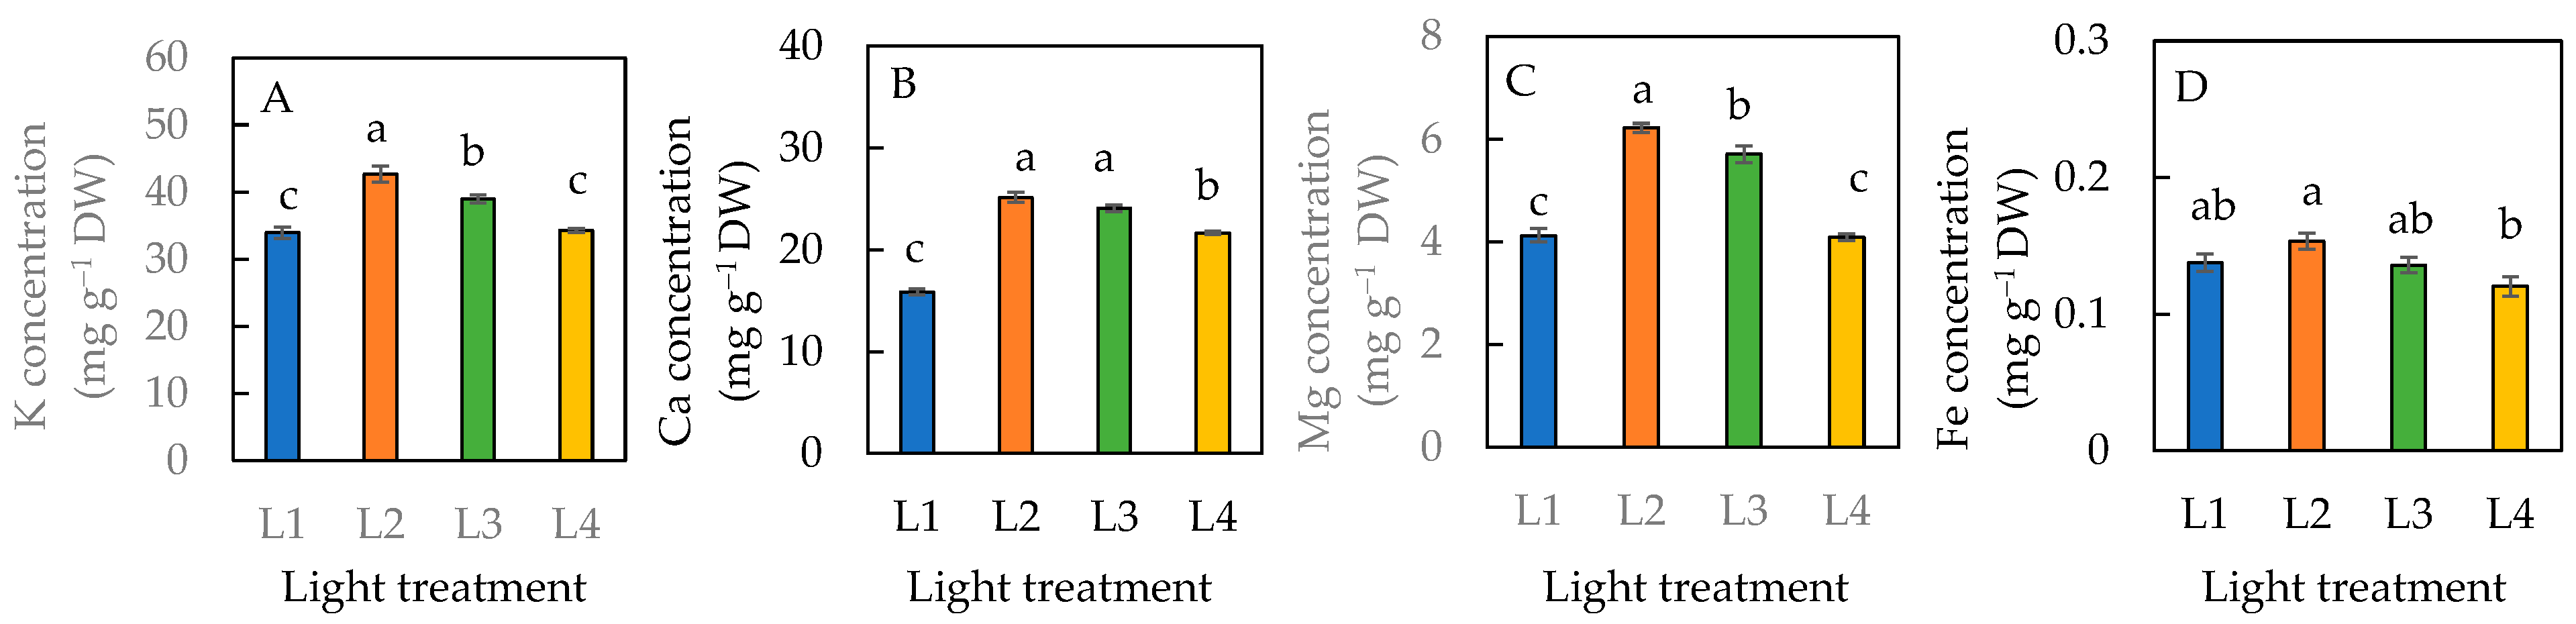
For the dietary minerals, plants grown under the L1 condition had significantly lower K, Ca, and Mg concentrations than the L2 and L3 conditions (Figure 9A–C). There was no significant difference in the K and Mg levels between the plants grown under L1 and L4 conditions (Figure 9A,C). Plants grown under the L4 condition had a significantly lower Ca concentration than those grown under L2 and L3 conditions but was significantly greater than the L1 condition (Figure 9B). The highest concentration of each dietary mineral was observed in plants grown under the L2 condition (Figure 9). There was a significantly higher concentration of Fe in plants under the L2 than L4 condition. However, statistically there was no significant difference among plants grown under L1, L2, and L3 or among L1, L3, and L4 conditions.
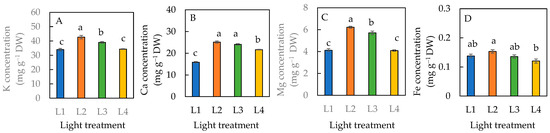
Figure 9.
Dietary minerals, K concentration (A), Ca concentration (B), Mg concentration (C), and Fe concentration (D) of sweet basil grown under different light conditions for 12 days. Values are means ± standard errors. Means with different letters are statistically different (p < 0.05; n = 4) as determined by Tukey’s multiple comparison test. Refer to Figure 1 for different light treatments of L1, L2, L3, and L4. Refer to Table 1 for details of L1, L2, L3, and L4 treatments.
4. Discussion
4.1. Leaf Growth, Root and Shoot Productivity, and Root Morphology
Plants supplemented with an additional 6 h extended photoperiod, such as L2, L3, and L4, all had a higher total leaf number, total leaf area, and plant height compared to L1 without supplemental LED lighting (Figure 2A,B,D). This is likely due to phenotypic plasticity, as positive correlations have been established between an increased DLI and total leaf number and leaf area, either through increasing the PPFD or extending photoperiod [24,25,26]. In the study with sweet basil grown indoors, it was reported that basil grown under the higher DLIs of 12.9, 16.5, and 17.8 mol m−2 day−1 had a greater leaf area compared to those grown under the lower DLIs of 9 and 11.5 mol m−2 day−1 [24]. Additional supplemental LED light provided to cucumbers also resulted in an increase in leaf number, compared to the no-supplemental-light treatment [25]. It was reported that supplementing SL with LED light for 3 h in a greenhouse significantly promoted the growth of the shoot and root of cucumber seedlings [26]. Similar results were observed in this study where the significantly lowest total leaf area was observed in plants grown under L1 (Figure 2B), which received the lowest DLI. Sweet basil grown under L1 conditions, with only SL, also possessed a higher SLA compared to those grown under the L2 and L4 conditions, indicating thinner leaves. Thin leaves are better able to intercept lower light [26]. Plants under L2 and L4 conditions had a lower SLA than L1. These plants had thicker leaves under an extended photoperiod, which partially contributed to the higher overall productivity of the shoot and root (Figure 3). Another study with basil plants grown under higher DLIs also had larger, thicker leaves and more branches [26]. However, the leaf thickness of sweet basil plants grown under the L3 condition, with 6 h LED light after 12 h of SL, were less sensitive to extended photoperiod. This could be due to circadian rhythm disruption. Plant circadian clocks are entrained by light and temperature signals from the environment. Like all other eukaryotes, plant circadian clocks control many aspects of their physiology [27].
Other studies on sweet basil [14,24] have found that a higher DLI led to a higher DW and FW, which was also observed in the L2, L3, and L4 conditions. This is likely because of the higher photosynthetic rate, which causes more carbohydrates to be formed in plants grown under L2, L3, and L4 conditions, with an additional DLI of 3.888 mol·m−2·d−1 (an extension of photoperiod of 6 h under 180 µmol photon m−2 s−1). The FW of the sweet basil was 2.68-, 2.33-, and 1.94-fold higher under L2, L3, and L4, respectively, with a total DLI of 14.688 mol·m−2·d−1, than under the L1 plants exposed to only natural SL with an average DLI of about 10.8 mol·m−2·d−1. In another study with sweet basil, the shoot FW under DLIs of 12.9, 16.5, and 17.8 mol·m−2·d−1 was 54.2%, 78.6%, and 77.9%, respectively, which is higher than the FW under a DLI of 9.3 mol·m−2·d−1 [24]. The reason for L4 plants having the lowest FW and DW among the three treatments with supplemental LED light might be due to the timing of the extended photoperiod. The additional 6 h of LED light was provided from 01:00 to 07:00, just before sunrise, when there is low transpiration under the tropical conditions of high relative humidity The rate of translocation in plants depends on the rate of transpiration. A Low transpiration rate results in A high cytosolic sucrose concentration, which likely inhibits triosephosphate, a product of photosynthesis, from leaving the chloroplast, thus slowing plant growth [28]. Sweet basil plants grown under the L2 condition had the highest total leaf number, largest total leaf area, greatest leaf thickness, and tallest height; all of which were linked to the highest productivity of the shoot and root (Figure 3). These findings suggest that the L2 condition, 3 h LED light before sunrise and after sunset, is the optimal timing of an extending photoperiod for enhanced productivity. This study also found that the shoot/root FW and DW ratios were highest in L1 compared to all other light conditions (Figure 3E,J). This is likely because more biomass might have been allocated and partitioned to the shoots to increase light interception, as the DLI was lower for L1 conditions compared to L2, L3, and L4 with supplemental LED light. Generally, plants allocate more biomass to shoots and less to roots in low-light environments. This is a strategy to optimize light when light is not abundant [29].
It was reported that shorter photoperiod and lower light intensity correlated to slower root growth [8,30]. Clearly, the optimal light treatment for root growth was the L2 condition (Figure 4). Plants grown under L2 had the highest photosynthetic performance, as they had the highest ETR (Figure 6B) and effective quantum yield Y(II) (Figure 6C). The large root surface area of plants under L2 (Figure 4C) is likely because high levels of the plant hormone auxin was formed in these plants and was transported to the roots via polar transport, stimulating lateral root formation supported by the longest total root length (Figure 4A) and the greatest total number of root tips (Figure 4B). The effects of auxin on the root growth of sweet basil were observed under supplementary blue and red light [31]. In this study, sweet basil plants were given supplementary LED light with a red/blue light ratio of 2.2; it is likely that auxin formation and polar transport occurred with an additional 6 h of LED lighting. In this study, the average root diameter was significantly higher in plants under L2, L3, and L4, with supplementary LED, compared to L1 (Figure 4D), without supplementary LED. This may result from additional blue light SL only [32].
4.2. Photosynthetic Pigment and Photosynthetic Light Use Efficiency
The Chl response to an increasing DLI depends on both the species and other growth conditions [8,26]. In this study, there was no significant difference in the total Chl concentration of sweet basil grown under different light conditions in the greenhouse (Figure 5A). In the study with cucumber seedlings, the supplemented SL with 3 h of LED light in a greenhouse significantly increased the total Chl concentration compared to those without supplemental LED lighting [26]. The sweet basil grown indoors had a higher total Chl concentration under higher DLIs than under lower DLIs [8]. A high DLI positively regulates photosynthetic capacity partially through accumulating higher Chl concentrations in flowering Chinese cabbage [33]. Conversely, Fu et al. [34] found that the total Chl concentrations decreased in lettuce with a DLI increasing from 4 to 14 mol·m−2 d−1. Chl and Car contents in tomato leaves were also negatively correlated with an increased DLI [35]. In this study, sweet basil grown under L2 and L3, with supplementary LED light, had a significantly higher Chl a/b ratio than those grown under the L1 condition (Figure 5B). Adjusting the Chl concentration and Chl a and b interconversion are physiological adaptations to increase photosynthetic output under increased light conditions [36]. The Chl a/b ratio is a key factor in determining the light absorption efficiency of photosynthesis [37]. A lower Chl a/b ratio at low light intensity, which could be due to increased Chl b, might relatively increase to optimize light absorption [37]. A higher total Chl a/b ratio in plants grown under L2 and L3 conditions compared to the L1 condition may increase photon absorptance under certain conditions. This postulation was supported by their higher ETRs (Figure 6B) and effective quantum of PSII [Y(II)] (Figure 6C).
It was reported that the maximum quantum efficiency, measured by the Fv/Fm ratio, decreased under the high DLI during midday due to the damage of PSII by excessive light [38]. For instance, the 6-week-old seedlings of Veronica rotunda grown under a DLI over 8.1 mol m−2 d−1 showed a lower midday Fv/Fm ratio than those grown under the DLI conditions of 3.6 and 6.6 mol m−2 d−1 after 2 weeks of treatment in a greenhouse [38]. In this study, sweet basil grown under a higher DLI with an extended photoperiod of 6 h, L2, L3, and L4, had midday Fv/Fm ratios around 0.81 (Figure 6A). Indeed, plants grown under the L1 condition, without extending photoperiod and thus a lower DLI, had a midday Fv/Fm ratio of 0.786 (Figure 6A). These results may imply that the photosynthetic apparatus of sweet basil grown with supplementary LED lighting through extending photoperiod were adapting well to the higher DLI. NPQ is a short-term mechanism for heat loss to safely dissipate excess absorbed light energy to prevent photoinhibition [39]. It is interesting to observe that the sweet basil plants grown under L2 had the lowest NPQ. Lower levels of NPQ could mean that at higher levels of qP less energy is dissipated as heat. Thus, more energy is channeled to photosynthesis supported by high Y(II) (Figure 6C), suggesting that L2 is the optimal treatment. Alternatively, sweet basil plants grown under the L2 condition may be coping very well with other protective mechanisms such as the high accumulation of antioxidants, mainly ascorbic acid (Figure 8A). Furthermore, L1, L3, and L4 are less optimal conditions than L2 as they have higher NPQ, which is possibly due to less energy being absorbed by the PSII used for photochemical reactions. The correlation between plant growth and photosynthetic light use, efficiency measured by ETR, Y(II), qP, and NPQ, could be affected by multiple factors. In this study, an increase in photosynthetic light use efficiency in L2 plants was generally associated with enhanced plant growth [34].
4.3. Nitrogen Metabolism
As discussed earlier, sweet basil plants grown under the L2 condition had the biggest root systems (Figure 1 and Figure 4), which could be associated with high NO3− uptake and transport [40]. However, in this study, the NO3− concentration in leaves was higher in L3 plants than in L1, L2, and L4 plants. Statistically, there was no significant difference in the NO3– concentrations in the stems and roots among the different light treatments (Figure 7A). In the study of two basil cultivars grown under a DLI below the recommended commercial range of 4, 6, 8, or 10 mol m−2 d−1 with a different light intensity for 14 h, it was found that all growth parameters linearly increased with the increasing DLI. However, no clear correlation was found between NO3− content and the DLI in both cultivars [40]. In this study, no clear trends were observed for the accumulation of NO3– (Figure 7A) and TRN (Figure 7B) among the different light treatments. However, sweet basil plants grown under L2 and L4 had a significantly higher total leaf soluble protein compared to those grown under L1 and L3 conditions (Figure 7C). In the study with lettuce, it was found that an increasing DLI reduced NO3– and increased protein content [41]. In our previous study on C4 halophyte Portulaca oleracea L. grown indoors under different DLIs through different combinations of PPFD and photoperiod, the NO3– concentrations in both stems and roots were similar regardless of different light treatments with different DLIs. P. oleracea grown under a higher PPFD with a higher DLI increased leaf maximum nitrate reductase activity and decreased NO3–, while a lower PPFD and longer light duration at the same DLI increased leaf NO3– concentrations [10]. Under a high PPFD, the lower NO3– in the leaves could be due to the increased nitrate reductase activity and more NO3– assimilation with high TRN [10]. Light intensity plays an important role in regulating NO3– reduction in plants. High light intensity increased nitrate reductase activity [41]. These results suggest that the impacts of the DLI on N metabolism could be due to the level of the DLI, variations of other growth factors, such as LED spectral quality and intensity, as well as plant species or cultivars. The positive impacts of the DLI on plant growth and photosynthetic capacity were attributed to an increased proportion of leaf nitrogen partition to the carboxy enzymes, such as Rubisco [33]. In this study, the high leaf TSP levels in L2 conditions (Figure 7C) might be because of the higher Rubisco protein levels, as Rubisco makes up 50 to 60% of leaf TSP. The study of Rubisco protein in sweet basil under different light conditions merits further study.
4.4. Nutritional Quality
Light plays an important role in the production of ascorbic acid [42]. However, the concentration of ascorbic acid varies among different plant species, organs, and growth stages [42]. Furthermore, temperature, and water availability can also regulate the accumulation of ascorbic acid in plants [43,44,45]. In this study, sweet basil grown under the L2 condition, with an extended photoperiod of 6 h and a higher DLI, had significantly higher ascorbic acid than those under the L1 condition, without extended photoperiod with a lower DLI. However, the level of ascorbic acid in L3 and L4 plants did not significantly differ from that of the L1 plants (Figure 8A). This result indicates the production of ascorbic acid in sweet basil may also depend on the timing of the extended photoperiod within a 24 h time frame. This study also found that sweet basil plants grown under a 6 h extended photoperiod with a higher DLI, such as the L2, L3, and L4 conditions, all had a higher concentration of total phenolic compounds (Figure 8B). Our result is congruent with another study on sweet basil, which found that the amount of total phenolic compounds in sweet basil was positively correlated with DLIs and was enhanced under a higher DLI [8]. The distinctive aroma and fragrance of basil are mainly due to phenolic compounds which are found in the cuticle, epidermis (mainly in the peltate glandular trichomes), and/or mesophyll. The most abundant phenolic compound in most sweet basils is rosmarinic acid, which accumulates higher concentrations under a higher proportion of red light compared to light spectral combinations [46]. In this study, basil plants under L2, L3, and L4 received more red light from supplementary LED lighting which may have led to this accumulation and higher levels of total phenolic compounds. Sweet basil leaves are rich in dietary minerals such as K, Ca, Mg, and Fe, which are a few of the many minerals that maintain healthy bones and muscles [47]. In this study, sweet basil plants grown under the L2 condition had the highest concentrations of K (Figure 9A), Ca (Figure 9B), Mg (Figure 9C), and Fe (Figure 9D) among all the four different light treatments. The highest concentrations of dietary minerals in the L2 plants could be attributed to their achievement of the longest root length, greatest number of root tips, largest root surface area, and biggest root diameter (Figure 1 and Figure 4). This could also be due to the effective absorption of red light by L2 plants during the timing of the supplementary LED light, from 04:00 to 07:00 and 19:00 to 22:00. The L4 light condition, 6 h LED light from 01:00 to 07:00 + 12 h SL, is the least optimal timing of the extended photoperiod treatments as plants here had the lowest Fe content among all treatments (Figure 9D). In the other study with sweet basil, it was found that a higher DLI increased the concentration of K, Mg, and Ca [11].
5. Conclusions
The results of this study show that when cloudy or rainy days occur regularly in Singapore, due to climate change, supplementary LED lighting could compensate for the shortage of light in a natural tropical greenhouse. Extending the photoperiod with supplemental LED lighting for 6 h during different times of a 24 h period allows higher sweet basil production year round, compared to growing only under natural sunlight. Overall, supplementary LED light improved both the yield and nutritional quality of sweet basil. L2 is the optimal strategy in this study as supported by the growth traits, shoot and root productivities, root morphology, photosynthetic light use efficiency, and nutritional quality. Thus, the L2 light treatment, 3 h LED light before sunrise and after sunset, is recommended to basil growers. However, the energy costs or sustainability concerns associated with extending the photoperiod with supplemental LED lighting need to be further addressed.
Author Contributions
Conceptualization, J.H.; methodology, J.H. and L.Q.; validation, J.H., A.N. and L.Q.; formal analysis, J.H. and A.N.; investigation, J.H.; A.N. and L.Q.; resources, J.H.; data curation, J.H., A.N. and L.Q.; writing—original draft preparation, J.H. and A.N.; writing—review and editing, J.H; supervision, J.H; project administration, L.Q.; funding acquisition, J.H. All authors have read and agreed to the published version of the manuscript.
Funding
This project is supported by the teaching materials’ vote of the National Institute of Education, Nanyang Technological University, Singapore.
Data Availability Statement
Data associated with this publication are deposited in the Data Repository of the National Institute of Education, Nanyang Technological University (Singapore) and will be made available upon publication of the manuscript: https://researchdata.nie.edu.sg/dataset.xhtml?persistentId=doi:10.25340/R4/1YOTQQ (accessed on 13 March 2025).
Conflicts of Interest
The authors declare no conflicts of interest.
References
- Singapore Food Agency. 30 by 30—Our Food Future. 2019. Available online: https://www.sfa.gov.sg/fromSGtoSG/our-sg-food-story (accessed on 23 October 2023).
- He, J. Enhancing productivity and improving nutritional quality of subtropical and temperate leafy vegetables in tropical greenhouses and indoor farming systems. Horticulturae 2024, 10, 306. [Google Scholar] [CrossRef]
- He, J.; Qin, L. Growth and photosynthetic characteristics of sweet potato (Ipomoea batatas) leaves grown under natural sunlight with supplemental LED lighting in a tropical greenhouse. J. Plant Physiol. 2020, 252, 153–239. [Google Scholar] [CrossRef] [PubMed]
- He, J.; Bte Jawahir, N.K.; Qin, L. Quantity of supplementary LED lightings regulates photosynthetic apparatus, improves photosynthetic capacity and enhances productivity of Cos lettuce grown in a tropical greenhouse. Photosynth. Res. 2021, 149, 187–199. [Google Scholar] [CrossRef] [PubMed]
- Poorter, H.; Niinemets, Ü.; Ntagkas, N.; Siebenkäs, A.; Mäenpää, M.; Matsubara, S.; Pons, T.L. A meta-analysis of plant responses to light intensity for 70 traits ranging from molecules to whole plant performance. New Phytol. 2019, 223, 1073–1105. [Google Scholar] [CrossRef]
- Azizah, N.S.; Irawan, B.; Kusmoro, J.; Safriansyah, W.; Farabi, K.; Oktavia, D.; Doni, F.; Miranti, M. Sweet Basil (Ocimum basilicum L.). A review of its botany, phytochemistry, pharmacological activities, and biotechnological development. Plants 2023, 12, 4148. [Google Scholar] [CrossRef] [PubMed]
- Charles, S. Sweet basil: An increasingly popular culinary herb. Int. J. Gastron. Food Sci. 2024, 36, 100927. [Google Scholar]
- Sipos, L.; Balázs, L.; Székely, G.; Jung, A.; Sárosi, S.; Radácsi, P.; Csambalik, L. Optimization of basil (Ocimum basilicum L.) production in LED light environments—A Review. Sci. Hortic. 2021, 289, 110486. [Google Scholar] [CrossRef]
- Kumar, S.S.; Arya, M.; Mahadevappa, P.; Giridhar, P. Influence of photoperiod on growth, bioactive compounds and antioxidant activity in callus cultures of Basella rubra L. J. Photochem. Photobiol. B Biol. 2020, 209, 11193. [Google Scholar] [CrossRef]
- He, J.; Gan, J.H.; Qin, L. Productivity, photosynthetic light-use efficiency, nitrogen metabolism and nutritional quality of C4 halophyte Portulaca oleracea L. grown indoors under different light intensities and durations. Front. Plant Sci. 2023, 14, 1106394. [Google Scholar] [CrossRef]
- Ciriello, M.; Formisano, L.; Rouphael, Y.; De Pascale, S.; Kacira, M. Effects of daily light integral and photoperiod with successive harvests on basil yield, morpho-physiological characteristics, and mineral composition in vertical farming. Sci. Hortic. 2023, 322, 112396. [Google Scholar] [CrossRef]
- Putievsky, E.; Galambosi, B. Production systems of basils. In Basil: The Genus Ocimum; Hiltunen, R., Holm, Y., Eds.; Harwood Academic Publishers: Reading, UK, 1999; pp. 39–65. [Google Scholar]
- Rahman, M.M.; Vasiliev, M.; Alameh, K. LED illumination spectrum manipulation for increasing the yield of sweet basil (Ocimum basilicum L.). Plants 2021, 10, 344. [Google Scholar] [CrossRef] [PubMed]
- Chutimanukul, P.; Wanichananan, P.; Janta, S.; Toojinda, T.; Darwell, C.T.; Mosaleeyanon, K. The influence of different light spectra on physiological responses, antioxidant capacity and chemical compositions in two holy basil cultivars. Sci. Rep. 2022, 12, 588. [Google Scholar] [CrossRef]
- Larsen, D.H.; Woltering, E.J.; Nicole, C.C.; Marcelis, L.F. Response of basil growth and morphology to light intensity and spectrum in a vertical farm. Front. Plant Sci. 2020, 11, 597906. [Google Scholar] [CrossRef]
- Douglas, J.S. Advanced Guide to Hydroponics; Natraj Publishers: Dehradun, India, 1982. [Google Scholar]
- Hunt, R.; Causton, D.R.; Shipley, B.; Askew, A.P. A modern tool for classical plant growth analysis. Ann. Bot. 2002, 90, 485–488. [Google Scholar] [CrossRef]
- Welburn, A.R. The spectral determination of chlorophylls a and b, as well as carotenoids, using various solvents with spectrophotometers of different resolution. J. Plant Physiol. 1994, 144, 307–313. [Google Scholar] [CrossRef]
- He, J.; Tan, B.H.G.; Qin, L. Source-to-sink relationship between green leaves and green pseudobulbs of C3 orchid in regulation of photosynthesis. Photosynthetica 2011, 49, 209–218. [Google Scholar] [CrossRef]
- He, J.; Qin, L.; Chong, E.L.C.; Choong, T.W.; Lee, S.K. Plant growth and photosynthetic characteristics of Mesembryanthemum crystallinum grown aeroponically under different blue- and red-LEDs. Front. Plant Sci. 2017, 8, 361. [Google Scholar] [CrossRef] [PubMed]
- Lowry, O.H.; Rosebrough, N.J.; Farr, A.L.; Randall, R.J. Protein measurement with Folin-phenol reagent. J. Biol. Chem. 1951, 193, 265–275. [Google Scholar] [CrossRef]
- Leipner, J.; Fracheboud, Y.; Stamp, P. Acclimation by suboptimal temperature diminishes photooxidative damage in maize leaves. Plant Cell Environ. 1997, 20, 366–372. [Google Scholar] [CrossRef]
- Ragee, S.; Abdel-Aal, E.M.; Noaman, M. Antioxidant Activity and Nutrient Composition of Selected Cereals for Food Use. Food Chem. 2006, 98, 32–38. [Google Scholar] [CrossRef]
- Dou, H.; Niu, G.; Gu, M.; Masabni, J.G. Responses of sweet basil to different daily light integrals in photosynthesis, morphology, yield, and nutritional quality. HortScience 2018, 53, 496–503. [Google Scholar] [CrossRef]
- Hernández, R.; Kubota, C. Growth and morphological response of cucumber seedlings to supplemental red and blue photon flux ratios under varied solar daily light integrals. Sci. Hortic. 2014, 173, 92–99. [Google Scholar] [CrossRef]
- Wang, S.; Fang, H.; Xie, J.; Wu, Y.; Tang, Z.; Liu, Z.; Lv, J.; Yu, J. Physiological responses of cucumber seedlings to different supplemental light duration of red and blue LED. Front. Plant Sci. 2021, 12, 709313. [Google Scholar] [CrossRef] [PubMed]
- Millar, A.J. Input signals to the plant circadian clock. J. Exp. Bot. 2004, 55, 277–283. [Google Scholar] [CrossRef]
- Miyoshi, Y.; Mincke, J.; Vermeiren, J.; Courtyn, J.; Vanhove, C.; Vandenberghe, S.; Kawachi, N.; Steppe, K. Translocation of 11C-labelled photosynthates to strawberry fruits depends on leaf transpiration during twilight. Environ. Exp. Bot. 2023, 211, 105353. [Google Scholar] [CrossRef]
- Jin, W.; Ji, Y.; Larsen, D.H.; Huang, Y.; Heuvelink, E.; Marcelis, L.F.M. Gradually increasing light intensity during the growth period increases dry weight production compared to constant or gradually decreasing light intensity in lettuce. Sci. Hortic. 2023, 311, 111807. [Google Scholar] [CrossRef]
- Wang, F.; Gao, Q.; Ji, G.; Wang, J.; Ding, Y.; Wang, S. Effects of light intensity and photoperiod on morphological development and photosynthetic characteristics of coriander. Horticulturae 2024, 10, 215. [Google Scholar] [CrossRef]
- van Gelderen, K.; Kang, C.; Pierik, R. Light signaling, root development, and plasticity. Plant Physiol. 2018, 176, 1049–1060. [Google Scholar] [CrossRef]
- Miotto, Y.E.; da Costa, C.T.; Offringa, R.; Kleine-Vehn, J.; Maraschin, F.d.S. Effects of light intensity on root development in a D-root growth system. Front. Plant Sci. 2021, 12, 778382. [Google Scholar] [CrossRef]
- Kang, Y.; Wu, Q.; Pan, G.; Yang, H.; Li, J.; Yang, X.; Zhong, M. High daily light integral positively regulate photosynthetic capacity through mediating nitrogen partitioning and leaf anatomical characteristic in flowering Chinese cabbage. Sci. Hortic. 2024, 326, 112715. [Google Scholar] [CrossRef]
- Fu, W.; Li, P.; Wu, Y. Effects of different light intensities on chlorophyll fluorescence characteristics and yield in lettuce. Sci. Hortic. 2012, 135, 45–51. [Google Scholar] [CrossRef]
- Zhang, M.; Cui, J.; Ju, J.; Hu, Y.; Liu, X.; He, R.; Song, J.; Huang, Y.; Liu, H. The impact of daily light integral from artificial lighting on tomato seedling cultivation in plant factory. Agronomy 2025, 15, 70. [Google Scholar] [CrossRef]
- Yao, X.Y.; Liu, X.Y.; Xu, Z.G.; Jiao, X.L. Effects of light intensity on leaf microstructure and growth of rape seedlings cultivated under a combination of red and blue LEDs. J. Integr. Agric. 2017, 16, 97–105. [Google Scholar] [CrossRef]
- Kume, A.; Akitsu, T.; Nasahara, K.N. Why is chlorophyll b only used in light-harvesting systems? J. Plant Res. 2018, 131, 961–972. [Google Scholar] [CrossRef] [PubMed]
- Lim, S.H.; Im, N.H.; An, S.K.; Lee, H.B.; Kim, K.S. Daily light integral affects photosynthesis, growth, and flowering of Korean native Veronica rotunda and V. longifolia. Hortic. Environ. Biotechnol. 2022, 63, 13–22. [Google Scholar] [CrossRef]
- Murakami, A.; Kim, E.; Minagawa, J.; Takizawa, K. How much heat does nonphotochemical quenching produce? Front. Plant Sci. 2024, 15, 1367795. [Google Scholar] [CrossRef] [PubMed]
- Solis-Toapanta, E.; Retana-Cordero, M.; Gómez, C. Effects of daily light integral on growth and nitrate content of basil grown for indoor gardening. Acta Hortic. 2022, 1337, 165–170. [Google Scholar] [CrossRef]
- Sheikhi, H.; Delshad, M.; Aliniaeifard, S.; Babalar, M.; Nasiri, R.; Shojaei, S.H.; Haghbeen, K. Trait component analysis of lettuce in response to daily light integrals at two growth stages. Agrosystems Geosci. Environ. 2024, 7, e20579. [Google Scholar] [CrossRef]
- Fasciolo, B.; van Brenk, J.; Verdonk, J.C.; Bakker, E.-J.; van Mourik, S. Quantifying the impact of light on ascorbic acid content in lettuce: A model proposal. Sustainability 2024, 16, 7470. [Google Scholar] [CrossRef]
- Ishikawa, T.; Dowdle, J.; Smirnoff, N. Progress in manipulating ascorbic acid biosynthesis and accumulation in plants. Physiol. Plant. 2006, 126, 343–355. [Google Scholar] [CrossRef]
- He, J.; Chua, E.L.; Qin, L. Drought does not induce crassulacean acid metabolism (CAM) but regulates photosynthesis and enhances nutritional quality of Mesembryanthemum crystallinum. PLoS ONE 2020, 15, e0229897. [Google Scholar] [CrossRef] [PubMed]
- He, J.; Chang, C.; Qin, L.; Lai, C.H. Impacts of deficit irrigation on photosynthetic performance, productivity and nutritional quality of aeroponically grown Tuscan Kale (Brassica oleracea L.) in a tropical greenhouse. Int. J. Mol. Sci. 2023, 24, 2014. [Google Scholar] [CrossRef] [PubMed]
- Kivimäenpä, M.; Mofikoya, A.; Abd El-Raheem, A.M.; Riikonen, J.; Julkunen-Tiitto, R.; Holopainen, J.K. Alteration in light spectra causes opposite responses in volatile phenylpropanoids and terpenoids compared with phenolic acids in sweet basil (Ocimum basilicum) leaves. J. Agric. Food Chem. 2022, 70, 12287–12296. [Google Scholar] [CrossRef] [PubMed]
- Irshad, M.; Firdous, W.I.; Parmar, N.S. Nutritional composition and health benefits of sweet basil: A Review. Pharm. Innov. J. 2023, 12, 1279–1285. [Google Scholar]
Disclaimer/Publisher’s Note: The statements, opinions and data contained in all publications are solely those of the individual author(s) and contributor(s) and not of MDPI and/or the editor(s). MDPI and/or the editor(s) disclaim responsibility for any injury to people or property resulting from any ideas, methods, instructions or products referred to in the content. |
© 2025 by the authors. Licensee MDPI, Basel, Switzerland. This article is an open access article distributed under the terms and conditions of the Creative Commons Attribution (CC BY) license (https://creativecommons.org/licenses/by/4.0/).