Article

Effects of Different Irrigation Rates and Microbial Fertilizers on Inter-Root Soil Environment and Yield and Quality of Brassica chinensis L.

1
College of Agriculture, Zhengzhou University, Zhengzhou 450001, China
2
Faculty of Water Resources and Civil Engineering, Graduate School of Chinese Academy of Agricultural Science, Beijing 100081, China
3
Institute of Farmland Irrigation, Chinese Academy of Agricultural Sciences, Xinxiang 453002, China
*
Authors to whom correspondence should be addressed.
These authors contributed equally to this work.
Horticulturae 2025, 11(3), 321; https://doi.org/10.3390/horticulturae11030321
Submission received: 5 February 2025 / Revised: 10 March 2025 / Accepted: 11 March 2025 / Published: 14 March 2025
(This article belongs to the Special Issue Irrigation and Water Management Strategies for Horticultural Systems)

Abstract

:
Brassica chinensis L. is often grown using ‘excessive water and fertilizer’, which has a negative impact on the inter-root soil environment and the yield and quality of the plant. As the concept of green and sustainable development takes root in people’s minds, it is important to determine the right amount of water and fertilizer. Based on this, the effects of different irrigation rates and microbial fertilizers on the inter-root soil environment and yield and quality of B. chinensis were investigated. A pot experiment was carried out with two irrigation levels (W1: 80–90% of field water capacity; W2: 70–80% of field water capacity) and three fertilizer treatments (F0: no fertilizer; F1: CPS Powder Drill microbial fertilizers; F2: Maya 85 microbial fertilizers). The results showed that microbial fertilizer and irrigation amount, as well as their interaction, all had significant effects on yield, polyphenol content, soluble protein content, nitrate content, and the activities of soil enzymes, such as urease, sucrase, and catalase (p < 0.05). Increases in irrigation amount and the application of microbial fertilizer can increase the yield of B. chinensis, effectively improve the activities of sucrase, urease, and catalase in soil, increase the contents of vitamin C, chlorophyll, soluble protein, and total phenol in leaves, and reduce the content of nitrate. In addition, the findings of the principal component analysis indicated that the F2W2 treatment was the optimal treatment. The results of this study demonstrate that an 80–90% field water capacity, in conjunction with Maya 85 microbial fertilizers, yields an optimal outcome, with a score of 1.86. This outcome suggests that this combination of water and fertilizer can be used as a recommended protocol for the cultivation of Brassica chinensis L.

1. Introduction

Brassica chinensis L., also known as Shanghai bok choy, is one of the vegetables often consumed in people’s daily lives. Due to its cost-effectiveness and broad market prospects, it has been widely planted. B. chinensis, a type of cabbage, boasts high nutritional value. It is abundant in fiber, effectively alleviating constipation, and rich in vitamins and minerals, which helps maintain blood vessel elasticity over time [1]. It provides essential nutrients for the body’s normal physiological needs and contributes to enhancing the body’s own immunity. In addition, B. chinensis, a commonly consumed vegetable in everyday diets, boasts a brief growth cycle, allowing for multiple plantings per year. It incurs low cultivation costs while possessing high economic value, thereby providing substantial financial benefits to farmers [2].
Research at home and abroad has shown that irrigation and fertilization are primary methods for effectively regulating vegetable yield and quality. In the cultivation of B. chinensis, numerous farmers, aiming to expedite the growing cycle and promptly realize economic gains, frequently adopt the practice of “excessive watering and fertilization” during planting. This approach, however, triggers a cascade of issues, including soil compaction, soil salinization, decreased vegetable yield, and diminished quality. Furthermore, it elevates farmers’ production costs and lowers their quality of life [3,4]. Consequently, previous researchers started exploring microbial fertilizers as an emerging type of fertilizer. As a novel fertilizer, microbial fertilizers contain inorganic nutrients, organic matter, and functional strains of bacteria; they are capable of fostering crop growth, enhancing disease resistance, suppressing bacterial infections, reducing soil-borne diseases, and improving soil properties. Microbial fertilizer stands as an exemplary organic fertilizer product and is used as a substitute for chemical fertilizers. It is currently extensively used in cash crops [5,6]. Yang et al. [7] showed that composite microbial fertilizers as basic fertilizers could not only increase the content of effective phosphorus and available potassium in the soil, but also substantially boost the height of wheat plants, the number of grains per spike, the number of spikes, and grain yield. Jin et al. [8] found that compared with conventional fertilization, the application of microbial fertilizers significantly elevated soil pH and soil organic matter (SOM), lowered nitrate content in lettuce, and increased the levels of soluble sugars and vitamin C. This indicates that the combination of reduced fertilizers and bio-organic fertilizers efficiently augmented soil fertility, optimized the microbial community structure, and improved both the yield and quality of lettuce. In conclusion, the application of microbial fertilizer can boost vegetable production and improve their quality.
Water is a pivotal constraining factor that influences the yield and quality of crops. Effective water management can significantly improve water use efficiency, while also maintaining crop quality and yield. Inadequate water supply restricts the growth of crop stems and leaves, leading to a redistribution of photosynthetic products and nutrient metabolites towards various tissues and organs, with a greater allocation to the fruit [9]. Kuslu et al. [10] demonstrated that both the total and early fruit yield of pumpkins were significantly greater under optimal irrigation conditions compared to alternative treatments. Furthermore, considering pumpkins’ particular sensitivity to soil water stress, metrics such as fruit diameter, length, the number of fruits per plant, and average fruit weight were maximized under full irrigation. In a separate study by Ma et al. [11], soil water stress markedly diminished potato plant height, leaf chlorophyll content, leaf photosynthetic capacity, tuber dimensions, and yield compared to normal irrigation. The intensity of soil water stress was inversely related to the growth and development indices of potatoes. Zhang et al. [12] reported significant variations in enzyme activity and microbial biomass in the rhizosphere soil of greenhouse grapes subjected to water stress (p < 0.05). In comparison to conditions with adequate water supply, mild (W2) and moderate (W1) water stress effectively decreased the accumulation of soil biological carbon throughout the growing season and reduced soil biological nitrogen content during the later growth stages. It has also been shown that drought stress significantly reduces the growth characteristics of cabbage, including total leaf number, total leaf area, fresh weight, and dry weight [13].
Water and fertilizer are crucial factors for plant growth and play a key role in agricultural production. The combined application of water and fertilizer has been demonstrated to engender a number of benefits, including the conservation of both water and fertilizer, as well as an enhancement in crop yields. In recent years, water and fertilizer management practices have been widely adopted and have yielded promising outcomes. However, there is still a lack of research on the combined use of microbial fertilizers with different levels of irrigation. Therefore, this experiment used B. chinensis as a test crop to explore the effects of different irrigation rates and microorganisms on soil physicochemical properties, soil microorganisms, enzymes, and the growth and physiological traits of B. chinensis, aiming to establish optimal water and fertilizer application rates.

2. Materials and Methods

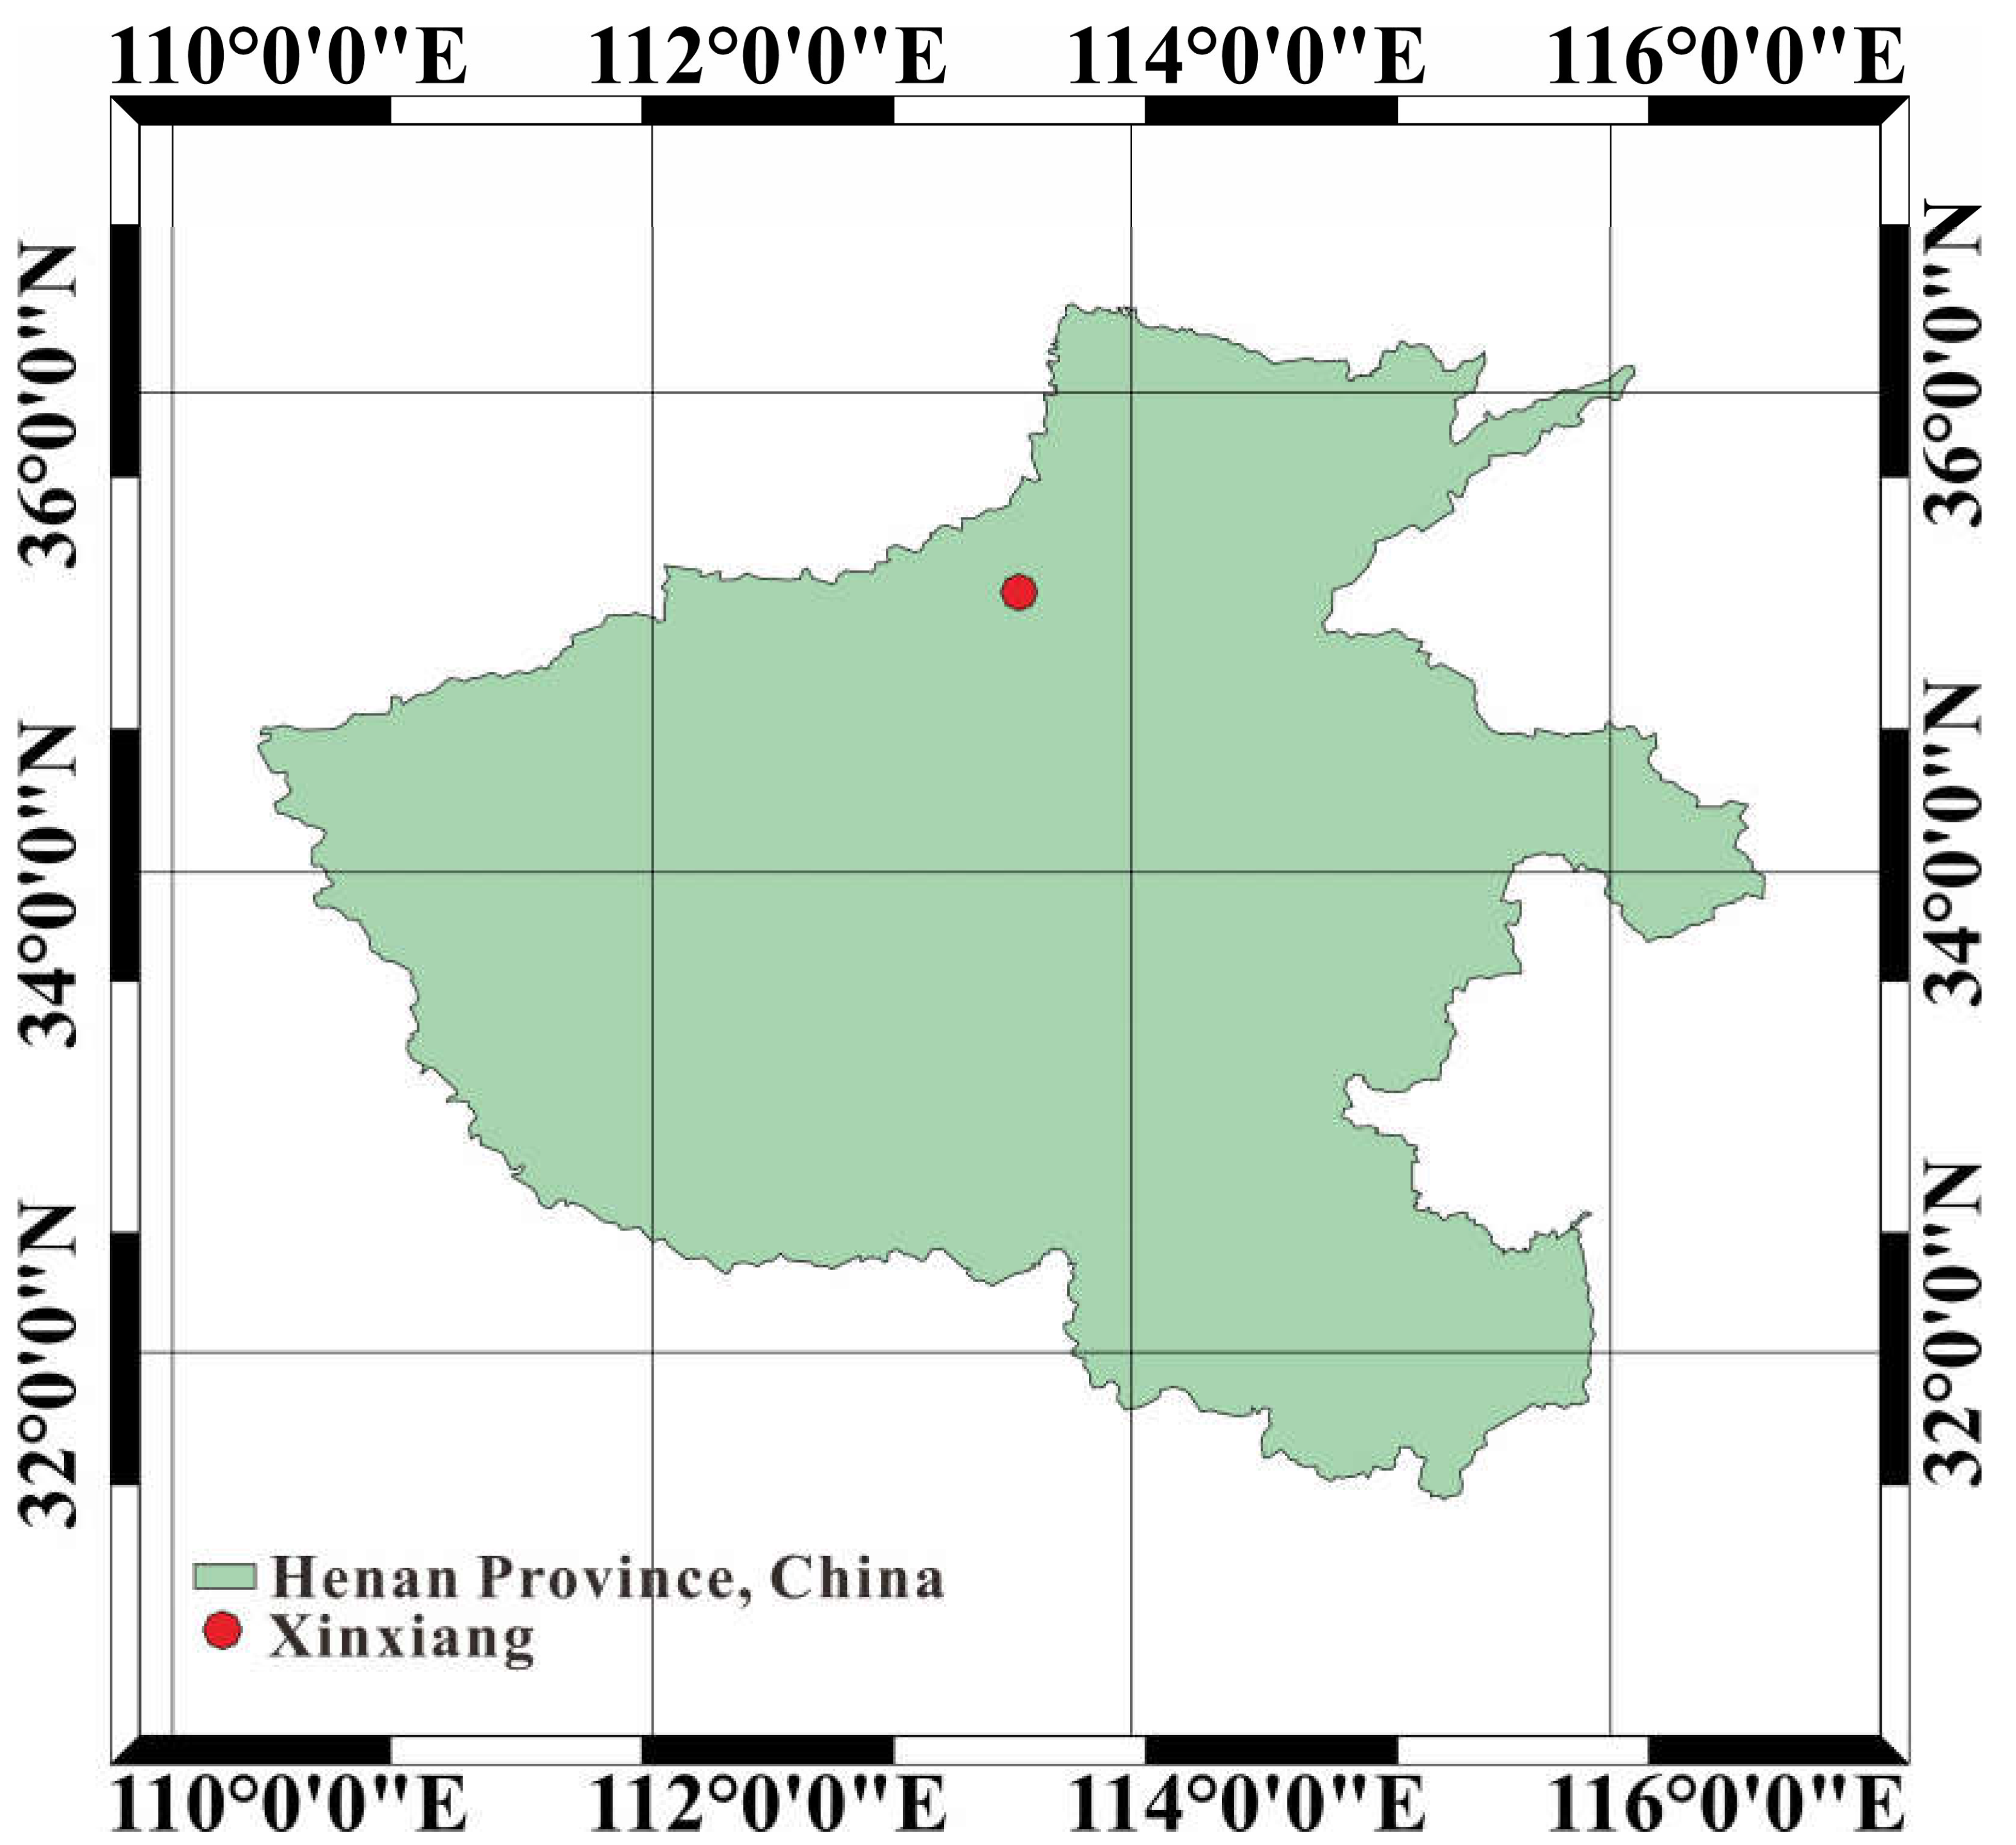
2.1. Overview of the Experimental Area

The experiment was conducted in April–May 2024 in a greenhouse at the Institute of Farmland Irrigation, Chinese Academy of Agricultural Sciences (35°18′13.71″ N, 113°55′15.05″ E). The average temperature during the planting period was 20–35 °C and the humidity was 50–60 °C, and local sandy loam soil was selected as the test soil for the experiment. The field water capacity was 21.3% in mass. The organic matter content was 14.42 g·kg−1, total nitrogen was 0.62 g·kg−1, total phosphorus was 0.67 g·kg−1, total potassium was 16.81 g·kg−1, and available phosphorus was 22.36 mg·kg−1. The test sites are shown in Figure 1.

2.2. Experimental Materials and Methods

The study employed a two-factor experimental design focusing on irrigation water amount (W) and microbial fertilizer (F), structured as a 2 × 3 factorial arrangement, resulting in six treatment combinations: high water with no fertilizer (F0W2), low water with no fertilizer (F0W1), high water with fertilizer I (F1W2), low water with fertilizer I (F1W1), high water with fertilizer II (F2W2), and low water with fertilizer II (F2W1). Each treatment was replicated six times.
In this context, high water (W2) was defined as maintaining soil moisture levels between 80 and 90% of field water capacity, while low water (W1) corresponded to soil moisture levels of 70–80% of field water capacity. Irrigation was conducted using spray bottles, with water application calculated based on soil moisture content measured via a probe (Meter Corporation, Washington, DC, USA).
The F1 microbial fertilizers were produced by Beijing Qigao Biotechnology Co., Ltd. (Beijing, China) (the main ingredients were Bacillus subtilis and Gliocladium roseum, and the effective number of live bacteria was ≥1 billion g−1). The F2 microbial fertilizers produced by Shanxi Guangyutong Technology Co., Ltd. (Jinzhong, China). were Maya 85 microbial fertilizers (the main ingredient was Bacillus amyloliquefaciens and the effective number of live bacteria was ≥200 million·g−1)
The pots used in the experiment were 19.5 cm in height and 23.5 cm in inner diameter, featuring six holes at the bottom to facilitate ventilation and drainage. The soil samples were naturally air-dried at room temperature in a clean environment after removing impurities such as roots, stones, and plant and animal residues. They were sieved through a 2 mm sieve and mixed evenly. The potting experiment was conducted with 7.4 kg of soil per pot, with a total of 36 pots. The seeds were sown on 1 April 2024. Irrigation was performed using a groundwater source and daily watering was initiated one week after sowing based on soil probe data. One month after sowing, only 5 plants per pot were retained. In the first period, the W1 treatment was about 50 mL·pot−1·d−1 and the W2 treatment was about 100 mL·pot−1·d−1. After one month, with the gradual growth and development of B. chinensis and the increase in temperature, the W1 treatment was about 100 mL·pot−1·d−1 and the W2 treatment was about 200 mL·pot−1·d−1. All microbial fertilizers used were applied as a base fertilizer at the recommended dosage (F1: 10 g·pot−1, F2: 25 g·pot−1), and no other fertilizers were added beyond that. B. chinensis was selected for the planted vegetables and the variety was Xia Fei 999. The planting area was treated with full shade and black mesh screens were installed.

2.3. Measurement Indicators and Methods

2.3.1. Yield

B. chinensis was harvested 60 days after sowing; the roots were cut off, washed with distilled water and air-dried, and weighed on a balance with a sensitivity of 0.01 as an indicator of yield.

2.3.2. Quality of B. chinensis

Fresh leaf samples were collected, surface dust was removed with a damp cotton cloth, and veins were removed and cut and set aside. Leaf chlorophyll and nitrate content were determined by UV spectrophotometry. Chlorophyll content was determined by a UV spectrophotometric method by weighing 0.2 g of clipped leaf samples; adding quartz sand, calcium carbonate powder, and ethanol; grinding until the tissues turned white; standing and filtering; and determining the absorbance at wavelengths of 665 nm, 649 nm, and 470 nm, using 95% ethanol as a blank. For the determination of nitrate content, 2 g of leaves was weighed, then ground in a mortar and pestle; ammonia buffer solution and activated charcoal were added. After shaking for 30 min, potassium ferricyanide solution and zinc sulphate solution were added, and the supernatant was collected after being left to stand (measured at 219 nm) [14]. Soluble protein content was assessed via the Kaomas Brilliant Blue G-250 method. A quantity of 0.5 g of fresh leaves was ground using a mortar and pestle, followed by centrifugation. The resulting residue was collected and added to 5 mL of Caulmers Brilliant Blue G-250 solution. The mixture was then left for a period of 2 min before undergoing colorimetric measurement at a wavelength of 595 nm. The total phenol content was determined by the Folin–Ciocalteu method. We weighed 5 g of the sample, added ethanol solution, sonicated it for 10 min, filtered it, took 2 mL of filtrate, and added forintol reagent and sodium carbonate solution, respectively. Then, we subjected the sample to a water bath at 40 °C for 60 min, let it stand for 20 min, and then measured the absorbance at 760 nm. Vitamin C content was measured from 5 g of leaves using 2,6-dichloroindophenol staining. The cut leaves were ground and treated with metaphosphoric acid before being filtered. Then, 2 mL of the filtrate was taken and 5 mL of metaphosphoric acid was added and titrated with 2,6-dichlorophenol indophenol solution until a pink color was maintained for five minutes [15,16].

2.3.3. Soil Microbial Communities

After the maturation of B. chinensis, rhizosphere soil was collected and transported to the laboratory in sterile, ice-packed plastic bags. The samples were divided into two portions: one was air-dried for the assessment of soil physicochemical properties and enzyme activity, while the other was stored at −80 °C for microbial sequencing analyses. Microbial DNA was extracted from Brassica chinensis L. inter-root soil samples using the CTAB method and DNA was detected by agarose gel electrophoresis. Sequencing libraries were generated using the NEBNext® UltraTM DNA Library Prep Kit for Illumina (NEB, Ipswich, MA USA, Catalog#: E7370L), following the manufacturer’s recommendations and adding index codes to each sample. Briefly, genomic DNA samples were fragmented to 350 bp size by sonication. The DNA fragments were then end-polished, A-tailed, and ligated with full-length adapters for Illumina sequencing, followed by further PCR amplification. The PCR products were purified with the AMPure XP system (Beverly, MA, USA). Subsequently, library quality was assessed and quantified by QPCR (1.5 nM) on an Agilent 5400 system (Agilent, Santa Clara, CA, USA). The raw reads were processed by Wekemo Tech Co, Ltd. (Shenzhen, China) using Kneaddata. Illumina aptamers with mass fractions below 20, 5′, or 3′ bases, and DNA sequences shorter than 50 bp were trimmed using cutadapt [17].

2.3.4. Soil Enzyme Activity

The sucrase activity was measured using the colorimetric method with 3,5-dinitrosalicylic acid. A quantity of 5 g of soil was accurately measured and added to a sucrose solution with phosphate buffer and toluene. The mixture was then incubated at 37 °C for a period of 24 h. Thereafter, the mixture was removed and filtered. Subsequently, 1 mL of the filtrate was aspirated, and 1 mL of DNS reagent was added. The mixture was then boiled in a water bath for 5 min, cooled down, and subjected to a colorimetric analysis at a wavelength of 540 nm. Urease was determined using the sodium total phenol–sodium hypochlorite colorimetric method from 5 g of soil. The soil samples were weighed and toluene was added. After 15 min, urea solution and pH 6.7 citrate buffer were added and the samples were incubated at 37 °C for 24 h. Then, 3 mL of filtrate was taken after filtration, and 17 mL of distilled water, 4 mL of sodium hypochlorite, and 4 mL of sodium total phenol were sequentially added, and absorbance was determined at 578 nm after 20 min. Then, 3 mL of urea solution and pH 6.7 citrate buffer were added to the soil, and after 20 min absorbance was determined at 578 nm. Additionally, soil catalase activity was assessed using the potassium permanganate titration method. We weighed 5 g of soil sample, added 0.5 mL of toluene, put it in the refrigerator at 4 °C for 30 min, took it out, and added 25 mL of aqueous hydrogen peroxide solution. Then, we left it for 1 h and filtered it. We took 1 mL of filtrate, added 5 mL of distilled water and 5 mL of sulfuric acid solution, and then titrated the sample with potassium permanganate solution until the purple color faded to a light-pink color [18].

2.4. Data Analysis

Data were organized and graphed using Microsoft Excel 2016, while SPSS 26.0 (IBM Crop., Armonk, NY, USA) was utilized for analysis of variance (ANOVA) and principal component analysis (PCA). Principal component analysis was performed using factor analysis with the software’s dimensionality reduction module. The correspondence between factors and items was determined by analyzing the rotated factor loading coefficient matrix table. Duncan’s multiple range test was applied to evaluate the significance of differences at the 0.05 level.

3. Results

3.1. Effects of Different Treatments on the Yield of B. chinensis

Yield of B. chinensis

The yields of B. chinensis under various treatments are illustrated in Figure 2. Under the W1 or W2 level, the order of yield was F2 > F1 > F0. At the F1 level, different irrigation rates had no significant effect. However, at the F0 and F2 levels, W2 was significantly higher than W1. Among all the treatments, F2W2 had the highest yield, which increased by 25% and 183% over F0W2 and F1W2, respectively. In summary, augmenting irrigation water and utilizing microbial fertilizers can significantly boost the yield of B. chinensis. Notably, Maya 85 microbial fertilizer demonstrated superior performance among the two tested microbial fertilizers. Figure 2 also shows that the effects of water, fertilizer, and water–fertilizer interactions on yield were obvious (p < 0.01).

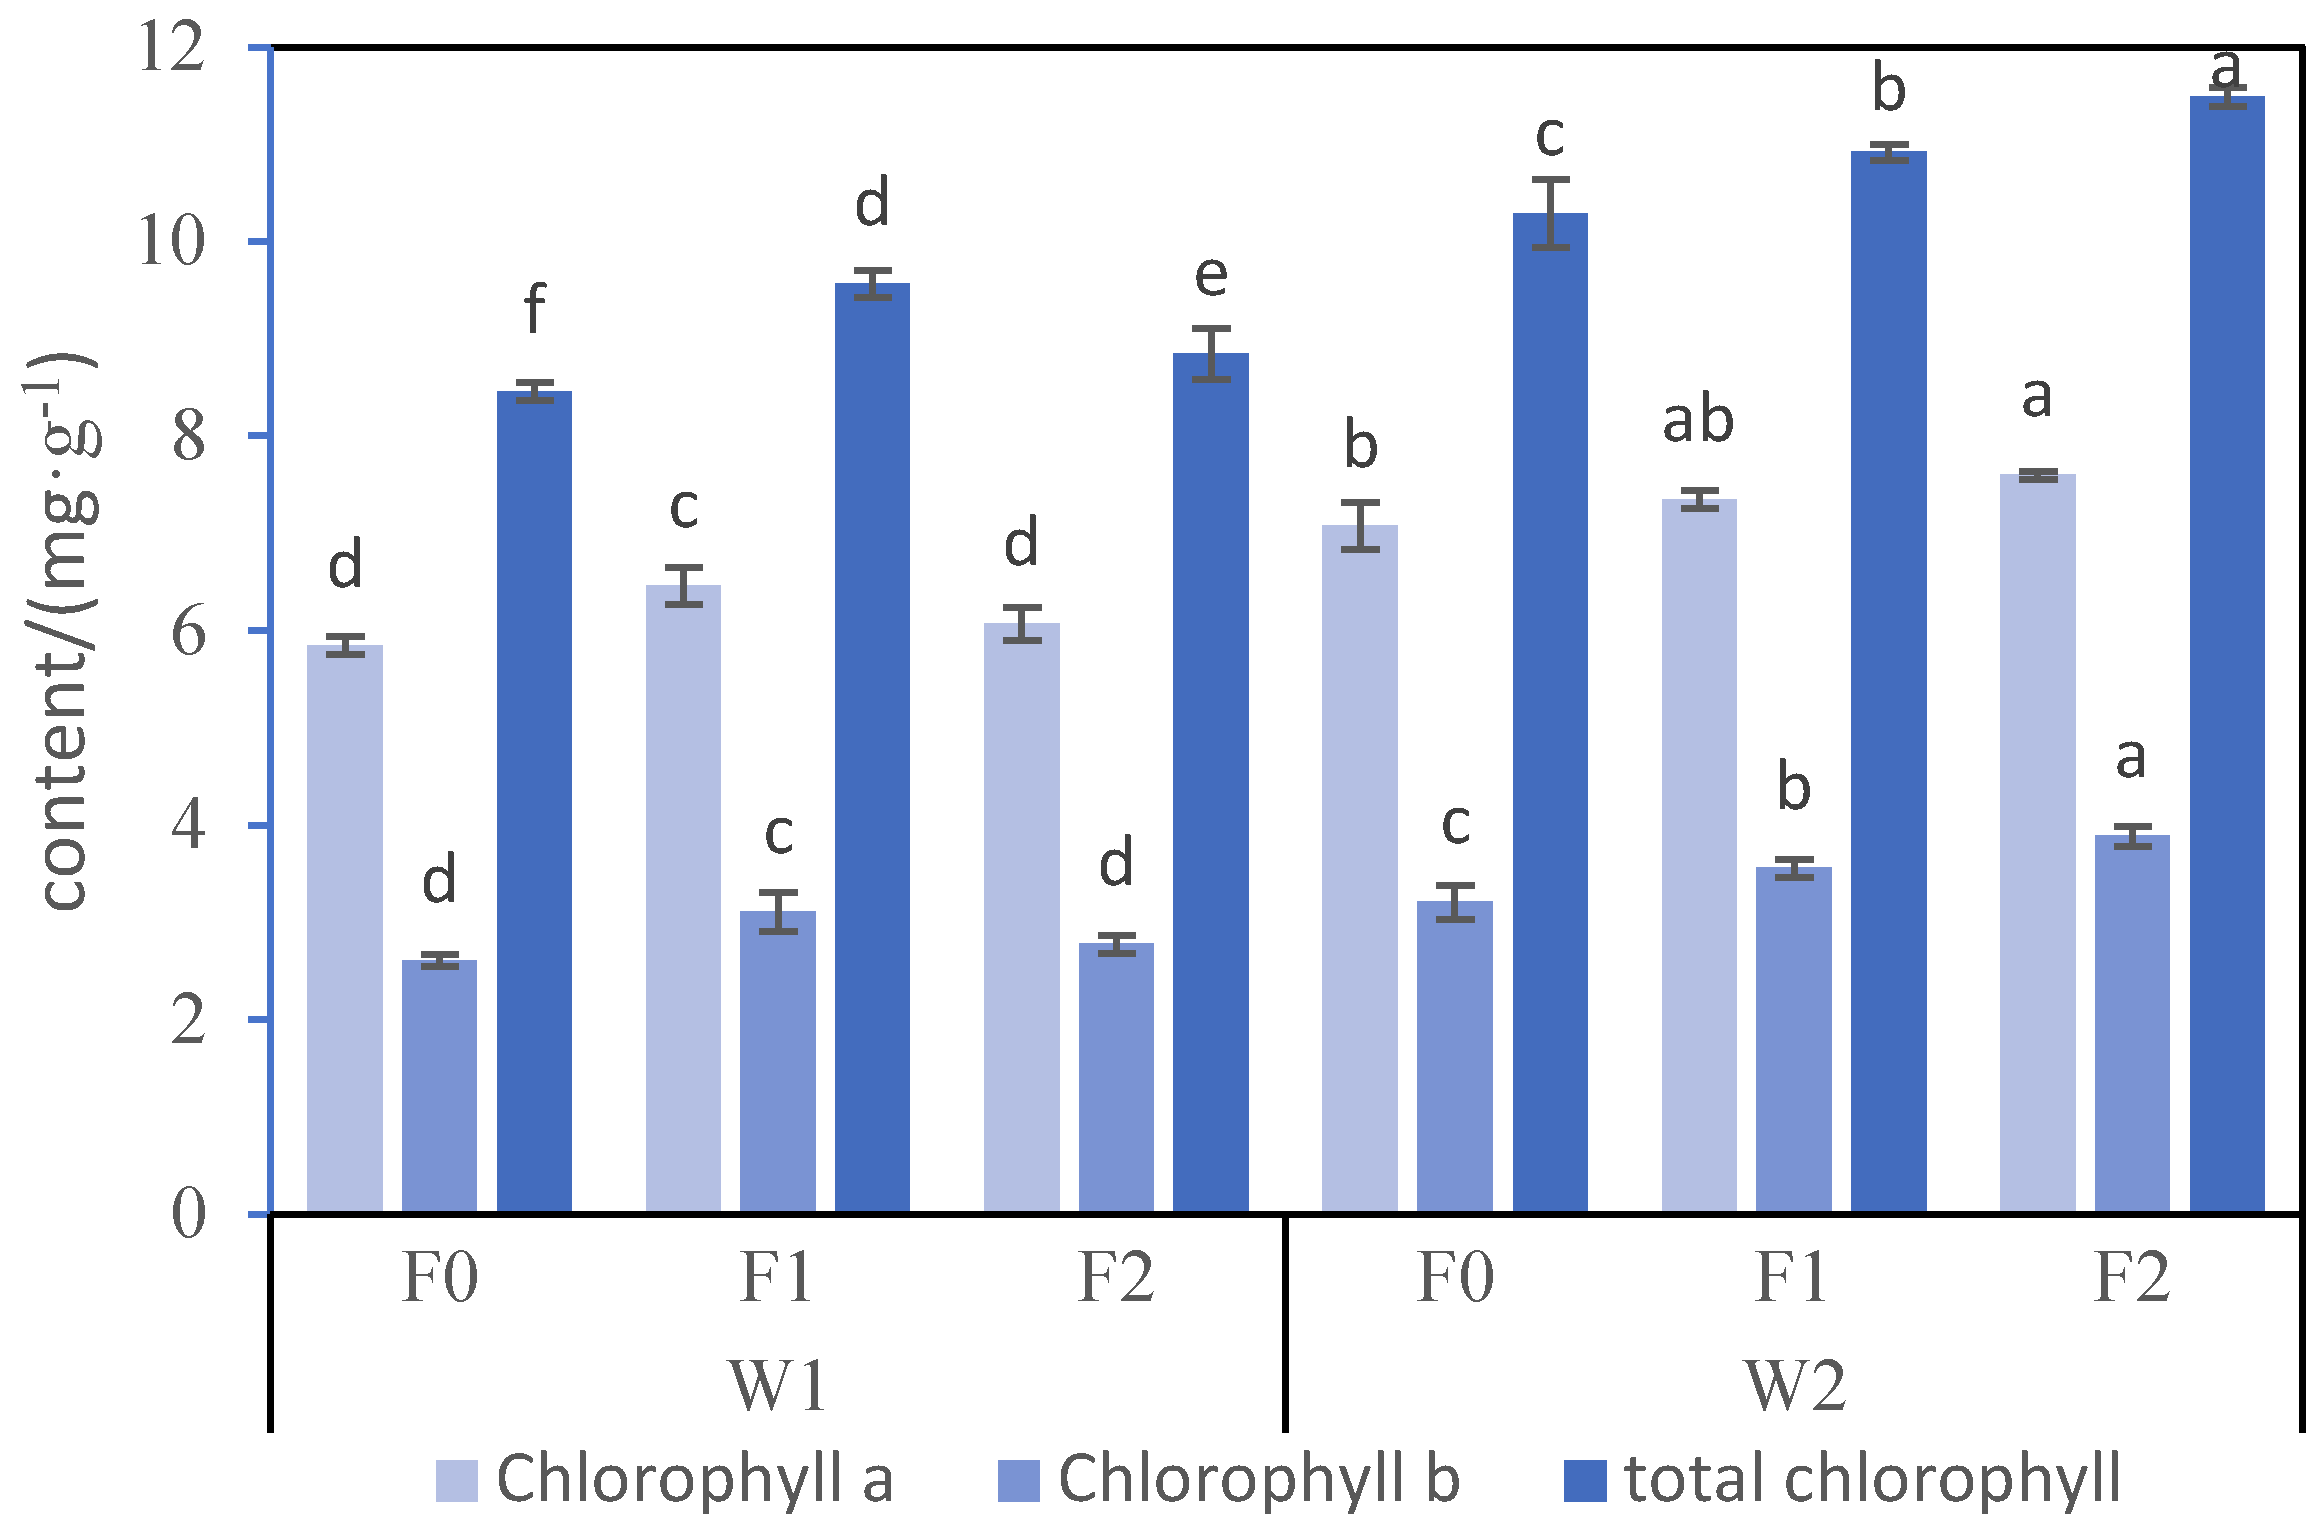
3.2. Chlorophyll in B. chinensis

The changes in chlorophyll a, chlorophyll b, and total chlorophyll content in B. chinensis leaves under different water and fertilization treatments are shown in Figure 3. At low water levels, the chlorophyll a, chlorophyll b, and total chlorophyll content of F1 was higher than that of F2 and F0. There was no significant difference in chlorophyll a and chlorophyll b content between F2 and F0. However, the total chlorophyll content of F1 was higher than that of F0. At the high water level, F2 demonstrated the highest chlorophyll a, chlorophyll b, and total chlorophyll content, followed by F1 and then F0. At the same fertilizer level, chlorophyll a, chlorophyll b, and total chlorophyll content were higher in W2 compared to W1. The application of microbial fertilizers increased chlorophyll content by 13% and 12% under the W1 and W2 treatments, respectively, as compared to the no-fertilizer treatment. In summary, increasing irrigation water and applying microbial fertilizers could enhance the chlorophyll content of B. chinensis. Specifically, F2 performed well under high-water conditions, while F1 exhibited higher chlorophyll content under low-water conditions.

3.3. Quality of B. chinensis

3.3.1. Vitamin C Content

Vitamin C functions as a vital antioxidant in plants, protecting cells from damage. Vitamin C is abundantly found in various vegetables and fruits, also acting as a key quality indicator. As illustrated in Figure 4a, the highest concentration of vitamin C was observed under the F2W2 treatment, with an increase ranging from 19% to 67%, demonstrating notable differences across treatments. At the same fertilization level, W2 surpassed W1. Therefore, the application of Maya 85 microbial fertilizers is more conducive to vitamin C accumulation under adequate irrigation. The factors of water, fertilizer and their interactions produced highly significant (p < 0.01) effects on the vitamin C content of B. chinensis.

3.3.2. Soluble Protein Content

Soluble protein is a vital osmoregulatory substance and nutrient within plants, with its concentration reflecting the water retention capacity of cells, thereby playing a protective role in essential cellular components and membranes. As shown in Figure 4b, at the same irrigation level, the order of soluble protein content was F2 > F1 > F0, while for the same microbial fertilizer level, it adheres to the sequence W2 > W1. The highest soluble protein content was found under F2W2 treatment, with increases of 8% to 64%. This indicates that high water availability combined with microbial fertilizer application promotes the synthesis of soluble proteins in leaves. ANOVA showed that the factors of F, W, and their interaction had a significant effect on the soluble protein content of B. chinensis (p < 0.01).

3.3.3. Total Phenol Content

Phenolic compounds are potent antioxidants that can neutralize free radicals, decelerate the aging process, and provide protection against chronic diseases such as cardiovascular conditions and cancer. These compounds are predominantly found in vegetables, fruits, legumes, nuts, tea, and cocoa beans. The effects of different irrigation rates and microbial fertilizers on total phenol content are illustrated in Figure 4c. At the same irrigation volume level, the total phenol content followed the order F2 > F1 > F0. Conversely, at the same fertilizer level, the total phenol content was higher in W2 than in W1, with statistically significant differences among the treatments. The application of microbial fertilizers increased total phenol content by a maximum of 50% compared to the no-fertilizer treatment, and increased total phenol content by a maximum of 131% in the high-water treatment compared to the low-water treatment. There was a significant (p < 0.01) effect of water, fertilizer, and the interaction of water–fertilizer on total phenol content.

3.3.4. Nitrate Content

Vegetables contain nitrate, which is absorbed from the soil and subsequently transformed into a nitrogen source within the plant during its growth cycle, particularly in green leafy varieties. Inside the human body, nitrate can be metabolized into nitrite, a recognized carcinogen. Furthermore, nitrite can react with human blood to form methemoglobin, impairing the blood’s ability to carry oxygen and potentially leading to hypoxic poisoning [19]. The impact of varying irrigation volumes and the application of microbial fertilizers on nitrate levels is illustrated in Figure 4d. This figure indicates that the use of microbial fertilizer led to a decrease in nitrate content compared to the treatments without fertilizer. This reduction may be attributed to enhanced plant resilience due to the activity of the bacterial strains present in the microbial fertilizers, alongside a decrease in chemical fertilizers and pesticides, which collectively contributed to lower nitrate levels compared to the no-fertilizer treatment. At the same fertilizer level, the nitrate concentration was lower in the W2 treatment compared to the W1 treatment, with reductions ranging from 4.5% to 33%. According to the ANOVA results, nitrate content in leaves was significantly affected by the factors of water, fertilizer, and their interaction (p < 0.01).

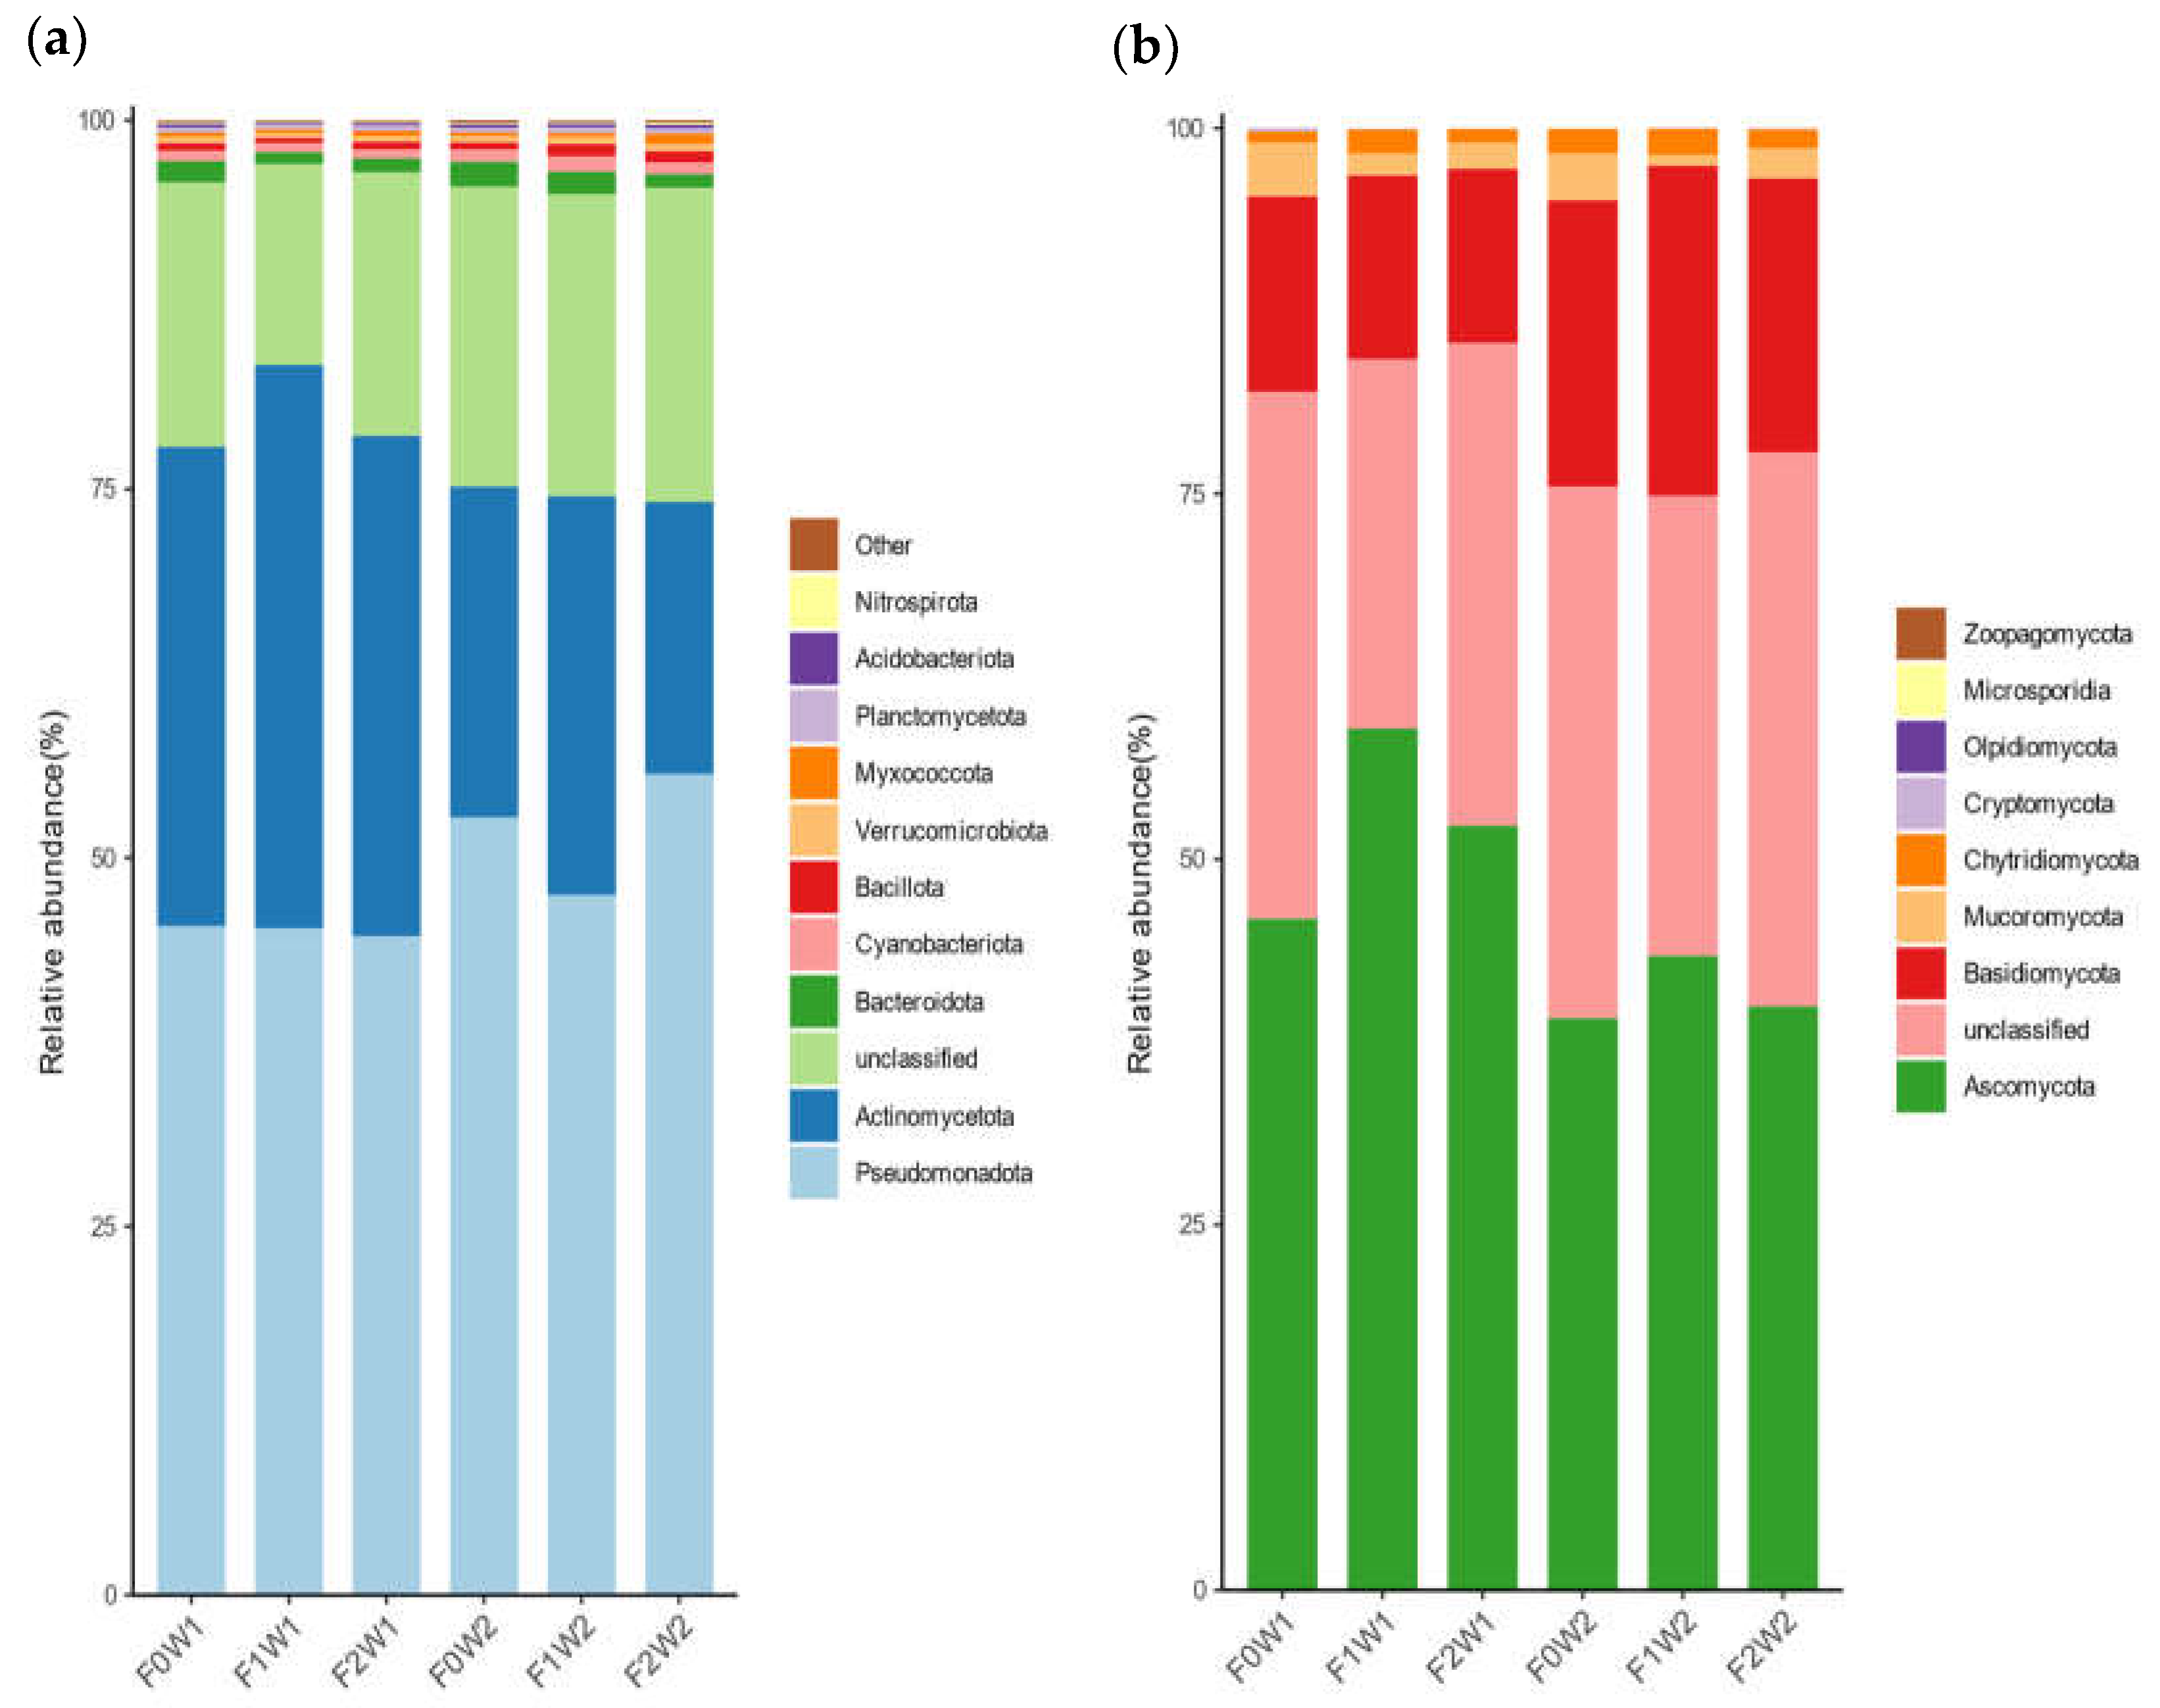
3.4. Soil Microbial Communities

As illustrated in Figure 5a, significant variations were observed in the relative abundance of bacterial communities in the rhizosphere soil among the different treatment groups. At the phylum level, Pseudomonadota and Actinomycetota emerged as the dominant bacterial phyla in the rhizosphere soil. Notably, Pseudomonadota was consistently the most abundant bacterial phylum across all treatment samples, comprising 44.25% to 55.08%, followed by Actinomycetota, which accounted for 18.24% to 37.72%. At identical fertilizer levels, the abundance of Pseudomonadota was greater in the W2 treatment compared to the W1 treatment, whereas the abundance of Actinomycetota was lower. In low-water conditions, the relative abundance of Pseudomonadota followed the order of F0 > F1 > F2, whereas the relative abundance of Actinomycetota in the F1 and F2 treatments exceeded that in F0. Conversely, at the high water level, the abundance of Pseudomonadota ranked as F2 > F0 > F1, and the abundance of Actinomycetota was F1 > F0 > F2. Additionally, each treatment exhibited unclassified bacteria at levels of 13.76% to 21.48%, indicating the presence of numerous unidentified bacterial species in the soil [20,21].
Among the fungal (Figure 5b) communities, two primary groups were identified: Ascomycota and Basidiomycota. Ascomycota was the dominant phylum across all treatment samples, ranging from 39.12% to 58.94%, followed by Basidiomycota, which accounted for 11.94% to 22.61%. At the same fertilizer level, the abundance of Basidiomycota was higher in the W2 treatment compared to the W1 treatment, while Ascomycota exhibited a lower abundance in W2 than in W1. In terms of irrigation level, the relative abundance of Ascomycota followed the sequence F1 > F2 > F0; at the low water level, the relative abundance of Basidiomycota in the F1 and F2 treatments was lower than that in F0. In high-water conditions, the abundance of Basidiomycota ranked as F1 > F0 > F2. The percentage of unclassified fungi ranged from 25.24% to 37.87%, with the high-water treatment exhibiting a higher proportion than the low-water treatment, and the F2W2 treatment showed the highest proportion.
Differential analyses of the top ten species regarding bacterial and fungal abundance across various treated soils were conducted at the genus level. As illustrated in Figure 6a, the bacterial genera identified included Pseudarthrobacter, Arthrobacter, Nocardioides, Pseudomonas, Sphingobium, Aminobacter, Streptomyces, Hydrogenophaga, Sinorhizobium, and unclassified taxa. Notably, the unclassified and other categories represented the largest proportion, ranging from 58.74% to 65.93%, indicating a significant presence of unclassified organisms in the soil. The second highest representation was observed for Pseudarthrobacter, which accounted for 4.66% to 7.38%, followed by Arthrobacter and Nocardioides.
The fungal community (Figure 6b) comprised Aspergillus, Wallemia, Fusarium, Alternaria, Pseudogymnoascus, Penicillium, Synchytrium, Metarhizium, and Nocardioides, along with unclassified species. The unclassified fungi constituted the highest proportion, ranging from 26.63% to 41.60%, while Aspergillus emerged as the predominant genus, accounting for 12.47% to 18.92%, followed by Wallemia and Fusarium [22].

3.5. Effect of Different Treatments on Soil Enzyme Activities

3.5.1. Sucrase Activity

The activity level of soil sucrase reflects the soil’s biological activity and its ability to convert organic matter [23]. As illustrated in Figure 7a, under the same fertilization conditions, sucrase activity was notably higher in the W2 treatment compared to the W1 treatment. At the same irrigation level, sucrase activity followed the order F2 > F1 > F0, with significant differences among the treatments. Among all treatments, F2W2 exhibited the highest sucrase activity at 9.84 mg·g−1·d−1, followed by F2W1 at 7.94 mg·g−1·d−1, suggesting that the Maya 85 microbial fertilizers substantially enhance sucrase activity. The high-water treatment increased sucrase by up to 43% under the same treatment conditions, and microbial fertilizers increased sucrase activity by 163% and 130% under low- and high-water conditions, respectively. According to the ANOVA results, the factors of F, W, and their interaction had significant effects on soil sucrase activity (p < 0.01).

3.5.2. Urease Activity

Urease activity levels play a key role in determining N use efficiency and soil N transformation. As illustrated in Figure 7b, the urease activity in the W2 treatment exceeded that of the W1 treatment under identical fertilization conditions. At the low water level, no significant differences were observed between the two fertilizers; however, both demonstrated higher activity than F0, suggesting that the application of microbial fertilizer enhances urease activity. Under high-water conditions, the order of urease activity was F1 > F2 > F0, with increases in the range of 19% to 66%, with notable differences among the treatments. The results of the ANOVA showed that F, W, and their interactions had a significant effect (p < 0.01) on the activity of urease in the soil.

3.5.3. Catalase Activity

Catalase is involved in soil redox reactions and enhances soil aeration. Changes in soil peroxidase production with the different irrigation rates and microbial fertilizers are shown in Figure 7c. There was no significant difference in catalase activity between the high- and low-water treatments with no fertilizer. However, at the F1 and F2 fertilizer levels, catalase activity was higher in the W2 treatment compared to the W1 treatment. With the low-water treatment, there was no significant difference between the two fertilizer types, but both were higher than F0. Conversely, at the high water level, F2 exhibited the highest catalase activity, followed by F1 and then F0, with significant differences among the treatments. Microbial fertilizers increased catalase activity by 25% and 49% under low- and high-water conditions, respectively. The high-water treatment increased the enzyme activity by up to 28%. The ANOVA showed that F, W, and their interactions significantly (p < 0.01) affected soil catalase activity.

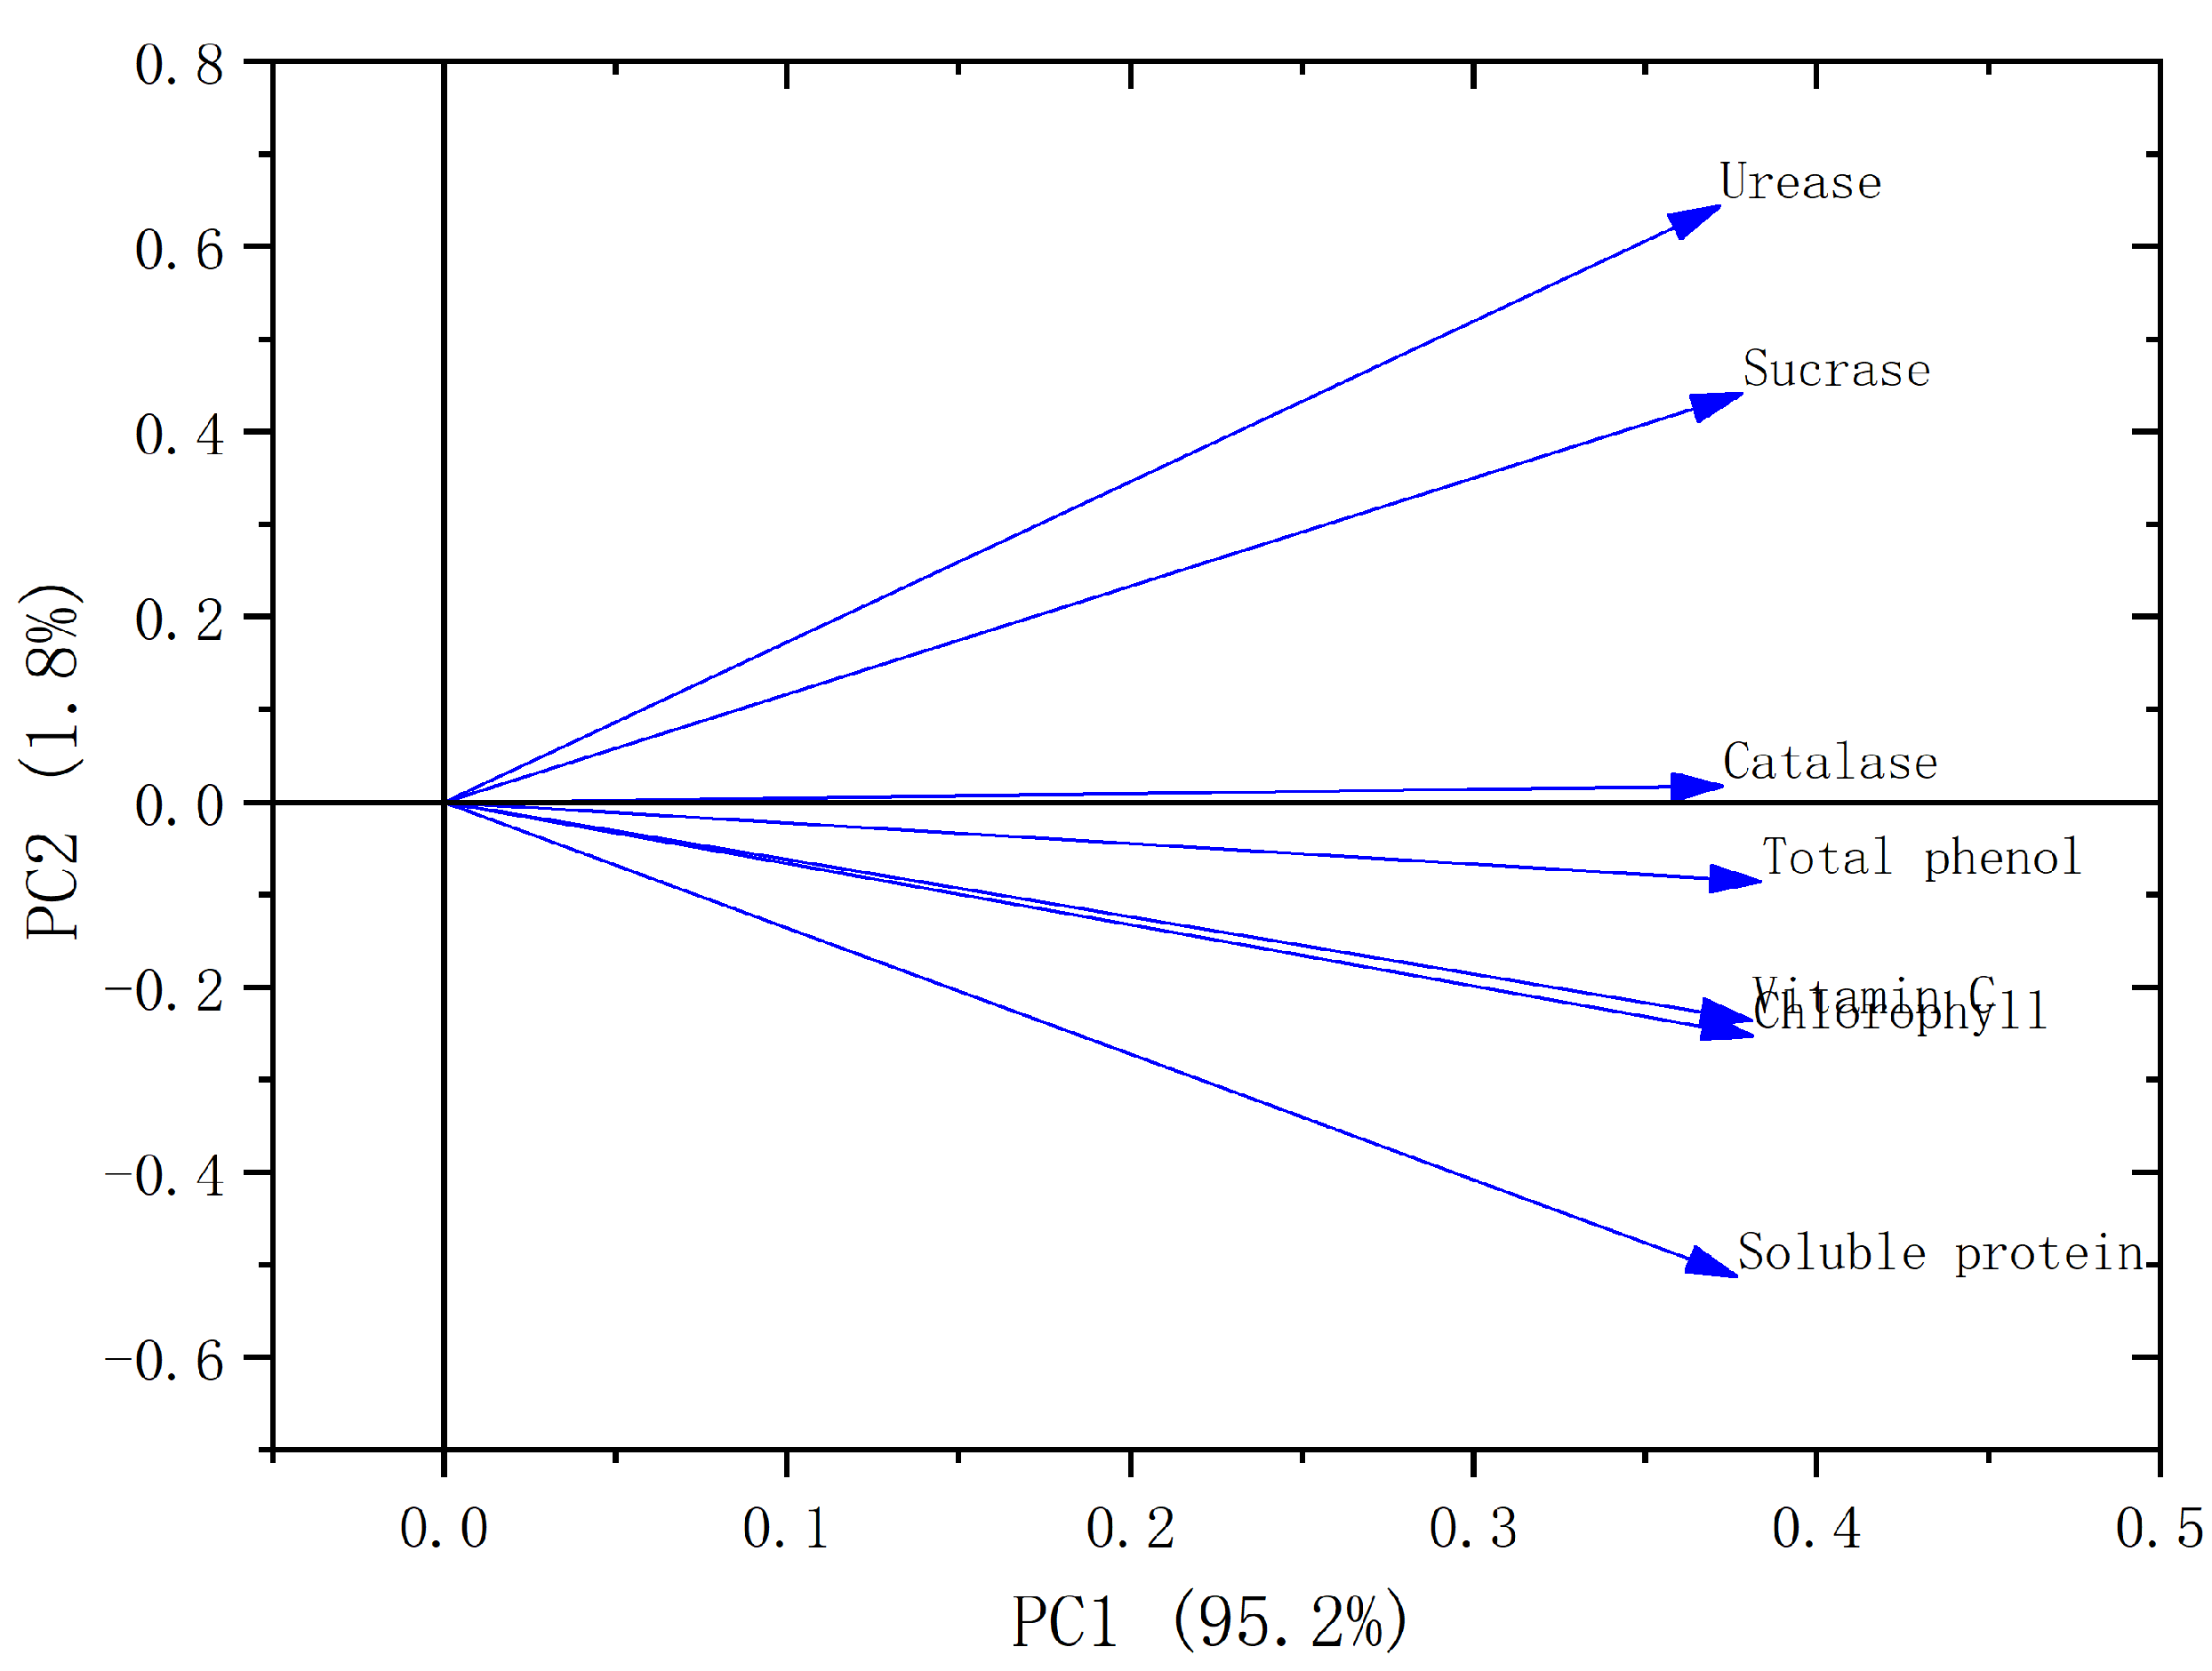
3.6. Principal Component Analysis

According to the method described in [24], the principal components were extracted for chlorophyll content, vitamin C content, polyphenol content, the soluble protein content of B. chinensis, sucrase activity, urease activity, and catalase activity in the soil. One principal component with an eigenvalue greater than 1 accounted for a cumulative variance contribution rate of 95.2%. This indicated that this one principal component could capture the majority of the information of the seven indicators. As shown in Figure 8, principal component 1 was strongly influenced by protein, vitamin C, sucrase, urease, catalase, polyphenols, and chlorophyll, with loading values of 0.973, 0.983, 0.977, 0.960, 0.962, 0.991, and 0.984, respectively.
Through the principal component eigenvector formula, the function expressions of the five principal components were derived as follows: F1 = 0.973X1 + 0.983X2 + 0.977X3 + 0.960X4 + 0.962X5 + 0.991X6 + 0.984X7. Then, the score of each principal component was multiplied by the contribution rate of variance, that is, the weight of each principal component, and we obtained a comprehensive model of the different treatments: F = 0.95F1. Using the model, we obtained comprehensive scores and rankings for the different treatments, with higher the scores representing better treatments. The models based on the different treatments of PCA are shown in Figure 8. As shown in Figure 9, the optimal fertilizer treatment was F2W2.

4. Discussion

4.1. Effects of Different Irrigation Rates and Microbial Fertilizers on Yield and Quality of B. chinensis

Crop yield is not only controlled by genetic factors, but also by environmental factors, such as soil, water, fertilizer, sunlight, and climate. Yield is the main indicator of the economic efficiency of crop cultivation, with water and fertilizer management being direct determinants of yield [25]. Previous studies have shown that the absence of microbial fertilizer results in a marked decrease in microbial community abundance and diversity compared to other treatments; furthermore, panax pseudoginseng yield was higher in the high-water treatment than in the low-water treatment with the same application of microbial fertilizer [26]. Microbial fertilizers showed a greater promotion of maize production in newly reclaimed land compared to compound fertilizers [27]. Therefore, the combination of microbial fertilizers and compound fertilizers can be considered. Some studies have shown that the combination of bio-organic fertilizer and chemical fertilizer can promote the growth of cucumber and shorten the ripening period of cucumber [28]. In this study, it was found that the yield of B. chinensis was higher when microbial fertilizer was applied, compared to the no-fertilizer control at the same water level. Meanwhile, the effect of microbial fertilizer application varied across experimental setups due to differences in crop type and the type and amount of microbial fertilizer applied, as well as the experimental site’s location and climate [29]. Additionally, the yield of B. chinensis was higher in the high-water treatment than in the low-water treatment, aligning with the findings reported by Kasprzyk W [30] and Muñoz V [31], which was likely due to B. chinensis’s preference for shaded environments and its relative sensitivity to drought, necessitating adequate irrigation. It has also been shown that the application of microbial fertilizers increases the yield of strawberries, reduces the application of mineral fertilizers, and improves economic efficiency [32,33].
The quality of vegetable products can be categorized into two main types: commodity quality and nutritional quality. Commodity quality encompasses observable attributes such as luster and shape, as well as sensory characteristics, including aroma and taste profiles like sweetness, bitterness, sourness, and texture. Nutritional quality pertains to the composition and concentration of essential nutrients, including sugars, proteins, amino acids, and fiber, present in vegetable products. The overall quality of vegetables is influenced by both the genetic makeup of the crops and external factors, such as environmental conditions and agricultural practices [34]. Previous studies have shown that irrigation, fertilization, and their interaction have highly significant effects on potato tuber starch content, soluble sugar content, and protein content [35]. Cucurbits treated with increased microbial fertilizer had the highest soluble solid and vitamin C content [36]. In the present study, it was observed that chlorophyll, vitamin C, soluble protein, and polyphenol concentrations were elevated under high-water application in conjunction with microbial fertilizer treatment compared to the other treatments. This may be attributed to water and fertilizer deficiencies, which hinder photosynthesis and diminish organic matter synthesis, subsequently affecting plant growth and development, aligning with findings from prior research [37]. Previous studies have also shown that inoculation with Bacillus amyloliquefaciens and Bacillus subtilis promotes tomato growth and increases the content of photosynthetic pigments and total phenolic compounds [38]. It is possible that Bacillus uses hydrolysis, chelation, redox, and acidity to solubilize minerals as a plant growth regulator while inducing resistance to biotic and abiotic stressors, which improves the quality and antioxidant properties of tomato fruits [39].

4.2. The Effect of Different Irrigation Rates and Microbial Fertilizer on Soil Microbial Activity

Microorganisms play a pivotal role in soil ecosystems, significantly influencing soil quality. The microbial population and its activity serve as critical indicators of soil health, with their abundance reflecting the fertility levels of the soil to some degree [13]. The application of organic fertilizer in combination with microorganisms alters the relative abundance and diversity of soil bacteria and fungi, particularly increasing the relative abundance of Xylaria spp. fungi [40]. In nurseries and pot plants, biofertilizer application increased the proportion of beneficial fungi (e.g., Trichoderma spp. and Penicillium spp.) and reduced the proportion of some harmful fungi [41]. In our current study, at the phylum level, Pseudomonas and Actinomycetes were the most dominant bacterial phyla in inter-root soils, and Ascomycetes and Basidiomycota were the most dominant fungal phyla. It has been demonstrated that the secretion of phytohormones, such as indole-3-acetic acid (IAA), by Pseudomonas spp. and Bacillus spp. is conducive to plant growth promotion (PGP). Actinomycetes can secrete antibiotics and growth factors in plant roots, as well as nitrogen fixation and phosphorus solubilization to promote plant growth and maintain a stable soil environment [42]. At the phylum level, enhanced irrigation water availability was associated with increased populations of Pseudomonadota bacteria and Basidiomycota fungi; conversely, the application of microbial fertilizers boosted the abundance of Actinomycetota bacteria and Ascomycota fungi. At the genus level, increased irrigation correlated with higher populations of Pseudomonas, Sphingomonas bacteria, and Aspergillus and Wallemia spp. fungi, whereas the use of microbial fertilizers elevated the abundance of Aminobacter, Streptomyces spp. bacteria, and Meyerozyma spp. fungi. These findings are in agreement with previous studies by Kumar S. et al. [43]. They also found that the application of microbial fertilizers resulted in significant quantitative and species changes in bacteria, with a significant increase in number and abundance.

4.3. Impact of Varying Irrigation Rates and Microbial Fertilizers on Soil Enzyme Activities

The level of soil enzyme activity is indicative of the essential nutrient cycling processes occurring within the soil, as well as the availability of nutrients necessary for plant growth, making it a vital parameter for evaluating soil fertility and productivity [13]. Biofertilizers increase soil microbial activity and the decomposition of organic matter, contributing to increased enzyme activity, nitrogen cycling, soil health, and soil fertility in the soil environment [44]. It was previously shown that peroxidase and sucrase activities were enhanced by different microbial fertilizer concentrations, and this enhancement was confirmed in the following year [45]. However, moderate and mild water stress inhibited urease and sucrase content in grapes [46]. Similar results were found in our experiments: sucrase, urease, and catalase were higher in the treatment with microbial fertilizer than in the treatment without fertilizer at the same irrigation rate, and the enzyme activities were higher in the high-water treatment than in the low-water treatment at the same microbial fertilizer level. This may be because microbial fertilizer contains a large number of microorganisms; these microorganisms can decompose the organic matter in the soil, convert complex organic nutrients into simple inorganic nutrients, improve the effectiveness of soil nutrients conducive to the growth and reproduction of microorganisms and enzyme synthesis, and at the same time provide a good nutrient base for enzyme activity [44]. The main component of microbial fertilizers in this study was Bacillus sp. It has been shown that Bacillus strains indirectly increase soil enzyme activity by decomposing organic matter and releasing nutrients from the soil [47]. This also creates a synergistic effect with other bacteria in the soil, leading to increased enzyme activity [48]. It has also been shown that soil moisture is highly correlated with enzyme activity [49]. At the phylum level, Ascomycetes and Basidiomycota are the most dominant fungal phyla. It has been shown that Ascomycetes and Stachybotrys are not only related to the carbon cycle, but also to the overall functioning of the soil, and both contain many enzymes responsible for the degradation of plant polysaccharides, while Ascomycetes are important decomposers in the soil, with a high capacity to decompose cellulose in the soil [50].

4.4. Principal Component Analysis with Different Treatments

Seven indicators were simplified by principal component analysis: chlorophyll content, vitamin C content, polyphenol content, soluble protein content, sucrase activity, urease activity, and catalase activity in the soil. PCA could evaluate the different treatments comprehensively and produce an evaluation model for the composite scores of the different treatments, according to which the composite indexes of the treatments were calculated and ranked in descending order as F2W2 > F1W2 > F0W2 > F0W2 > F2W1 > F1W1 > F0W1, respectively, among which the optimal water–fertilization treatment was F2W2. Therefore, F2W2 is recommended as the water–fertilization treatment for B. chinensis.

5. Conclusions

The varying irrigation rates and the application of microbial fertilizers had a significant impact on the soil microbial ecosystem, as well as the yield and quality of B. chinensis. The yield in the treatment with fertilizers surpassed that of the no-fertilizer control at the same irrigation volume. The concentrations of chlorophyll, vitamin C, soluble proteins, and polyphenols in B. chinensis were elevated in the high-water and microbial fertilizer treatments compared to the other treatments.
Regarding the inter-root soil environment, adequate irrigation rates and the use of microbial fertilizers led to an increase in the soil populations of Pseudomonas, Actinomycetes, Ascomycetes, and Ascospores. Specifically, sufficient irrigation and microbial fertilizer application enhanced the abundance of Pseudomonas, Actinomycetes, Ascomycetes, and Stramonas in the soil, while also stimulating the enzymatic activities of sucrase, urease, and catalase.
In conclusion, this study reveals significant changes in the inter-root soil environment and the yield and quality of B. chinensis with different irrigation rates and microbial fertilizers through potting experiments. The results showed that F2W2 can be used as a reference water and fertilizer treatment for the large-scale planting of Brassica chinensis L. Considering that plant growth is affected by many factors, subsequent field experiments comparing compound fertilizers can be added to further validate the results of this study.

Author Contributions

S.G.: writing (lead); conceptualization (lead); methodology (equal). M.X.: methodology (equal), writing—review and editing (equal). M.W.: writing—review and editing (equal). H.L.: software (equal); resources (equal). H.S.: methodology (equal); software (equal). Q.H.: writing—review and editing (equal); supervision (equal); funding acquisition. R.L.: writing—review and editing (equal); supervision (equal); funding acquisition. All authors have read and agreed to the published version of the manuscript.

Funding

This study is supported by the National Key Research and Development program of China (2022YFD1900403), the Henan Province Key R&D and Promotion Project (No. 242102110215, No. 252102110236), the Basic Research Project of the Institute of Farmland Irrigation of Chinese Academy of Agricultural Science (No. IFI2024-23).

Data Availability Statement

The original contributions presented in this study are included in the article. Further inquiries can be directed to the corresponding authors.

Conflicts of Interest

The authors declare no conflict of interest.

References

  1. Mampholo, B.M.; Sivakumar, D.; Beukes, M.; van Rensburg, W.J. Effect of Modified Atmosphere Packaging on the Quality and Bioactive Compounds of Chinese Cabbage (Brasicca rapa L. ssp. chinensis). J. Sci. Food Agric. 2013, 93, 2008–2015. [Google Scholar] [CrossRef] [PubMed]
  2. Pan, G.; Geng, S.; Wang, L.; Xing, J.; Fan, G.; Gao, Y.; Lu, X.; Zhang, Z. Effects of Modified Biochar on Growth, Yield, and Quality of Brassica chinensis L. in Cadmium Contaminated Soils. Plants 2025, 14, 524. [Google Scholar] [CrossRef] [PubMed]
  3. Wu, Q.; Chen, Y.; Dou, X.; Liao, D.; Li, K.; An, C.; Li, G.; Dong, Z. Microbial Fertilizers Improve Soil Quality and Crop Yield in Coastal Saline Soils by Regulating Soil Bacterial and Fungal Community Structure. Sci. Total Environ. 2024, 949, 175127. [Google Scholar] [CrossRef]
  4. Liu, J.; Li, H.; Yuan, Z.; Feng, J.; Chen, S.; Sun, G.; Wei, Z.; Hu, T. Effects of Microbial Fertilizer and Irrigation Amount on Growth, Physiology and Water Use Efficiency of Tomato in Greenhouse. Sci. Hortic. 2024, 323, 112553. [Google Scholar] [CrossRef]
  5. Abdul-Halim, A.M.A.A.; Shivanand, P.; Krishnamoorthy, S.; Taha, H. A Review on the Biological Properties of Trichoderma spp. as a Prospective Biocontrol Agent and Biofertilizer. J. Appl. Biol. Biotechnol. 2023, 11, 34–46. [Google Scholar] [CrossRef]
  6. Li, J.; Chen, J.; He, P.; Chen, D.; Dai, X.; Jin, Q.; Su, X. The Optimal Irrigation Water Salinity and Salt Component for High-Yield and Good-Quality of Tomato in Ningxia. Agric. Water Manag. 2022, 274, 107940. [Google Scholar] [CrossRef]
  7. Yang, W.; Gong, T.; Wang, J.; Li, G.; Liu, Y.; Zhen, J.; Ning, M.; Yue, D.; Du, Z.; Chen, G. Effects of Compound Microbial Fertilizer on Soil Characteristics and Yield of Wheat (Triticum aestivum L). J. Soil. Sci. Plant Nutr. 2020, 20, 2740–2748. [Google Scholar] [CrossRef]
  8. Jin, N.; Jin, L.; Wang, S.; Li, J.; Liu, F.; Liu, Z.; Luo, S.; Wu, Y.; Lyu, J.; Yu, J. Reduced Chemical Fertilizer Combined with Bio-Organic Fertilizer Affects the Soil Microbial Community and Yield and Quality of Lettuce. Front. Microbiol. 2022, 13, 863325. [Google Scholar] [CrossRef]
  9. Ariza, M.T.; Miranda, L.; Gómez-Mora, J.A.; Medina, J.J.; Lozano, D.; Gavilán, P.; Soria, C.; Martínez-Ferri, E. Yield and Fruit Quality of Strawberry Cultivars Under Different Irrigation Regimes. Agronomy 2021, 11, 261. [Google Scholar] [CrossRef]
  10. Kuslu, Y.; Sahin, U.; Kiziloglu, F.M.; Memis, S. Fruit Yield and Quality, and Irrigation Water Use Efficiency of Summer Squash Drip-Irrigated with Different Irrigation Quantities in a Semi-Arid Agricultural Area. J. Integr. Agric. 2014, 13, 2518–2526. [Google Scholar] [CrossRef]
  11. Ma, Y.Z.; Pan, N.; Su, W.; Zhang, F.J.; Ye, G.J.; Pu, X.Q.; Zhou, Y.; Wang, J. Soil Water Stress Effects on Potato Tuber Starch Quality Formation. Potato Res. 2024, 67, 1829–1848. [Google Scholar] [CrossRef]
  12. Zhang, R.; Zhang, H.; Yang, C.; Li, H.; Wu, J. Effects of Water Stress on Nutrients and Enzyme Activity in Rhizosphere Soils of Greenhouse Grape. Front. Microbiol. 2024, 15, 1376849. [Google Scholar] [CrossRef]
  13. Khalaf, R.A.; Abdullah, K.M.; Khalaf, A.A.; Al-Fatlawi, M.M. Improving the Chemical Content and Mineral Elements of Drought Stressed (Moringa oleifera L.) by Application of Glutathione and Bio-Fertilizer. IOP Conf. Ser. Earth Environ. Sci. 2023, 1225, 012021. [Google Scholar] [CrossRef]
  14. Li, H.S. Modern Plant Physiology; Higher Education Press: Beijing, China, 2002; pp. 194–197. [Google Scholar]
  15. Singleton, V.L.; Orthofer, R.; Lamuela-Raventós, R.M. Analysis of Total Phenols and Other Oxidation Substrates and Antioxidants by Means of Folin-Ciocalteu Reagent. Methods Enzymol. 1999, 299, 152–178. [Google Scholar] [CrossRef]
  16. Cintya, H.; Silalahi, J.; De Lux Putra, E.; Siburian, R. The Influence of Fertilizer on Nitrate, Nitrite and Vitamin C Contents in Vegetables. Orient. J. Chem. 2018, 34, 2614–2621. [Google Scholar] [CrossRef]
  17. Pang, L.; Wang, Y.; Ye, Y.; Zhou, Y.; Zhi, Q.; Lin, H. Metagenomic Analysis of Dental Plaque on Pit and Fissure Sites with and Without Caries Among Adolescents. Front. Cell Infect. Microbiol. 2021, 11, 740981. [Google Scholar] [CrossRef]
  18. Guan, S.Y.; Zhang, D.; Zhang, Z. Soil Enzyme and Its Research Methods; Chinese Agricultural Press: Beijing, China, 1986; pp. 274–297. [Google Scholar]
  19. Bai, X.; Liu, K.; Ning, T.; Deng, C.; Wang, L.; Li, D.; Wang, T.; Li, J. Effects of Multiple N, P, and K Fertilizer Combinations on Strawberry Growth and the Microbial Community. PLoS ONE 2023, 18, e0293088. [Google Scholar] [CrossRef]
  20. Sun, W.L.; Zhao, Y.G.; Yang, M. Microbial Fertilizer Improving the Soil Nutrients and Growth of Reed in Degraded Wetland. IOP Conf. Ser. Earth Environ. Sci. 2017, 69, 012062. [Google Scholar] [CrossRef]
  21. Nan, J.; Chao, L.; Ma, X.; Xu, D.; Mo, L.; Zhang, X.; Zhao, X.; Bao, Y. Microbial Diversity in the Rhizosphere Soils of Three Stipa Species from the Eastern Inner Mongolian Grasslands. Glob. Ecol. Conserv. 2020, 22, e00992. [Google Scholar] [CrossRef]
  22. Chang, E.-H.; Chung, R.-S.; Wang, F.-N. Effect of Different Types of Organic Fertilizers on the Chemical Properties and Enzymatic Activities of an Oxisol under Intensive Cultivation of Vegetables for 4 Years. Soil. Sci. Plant Nutr. 2008, 54, 587–599. [Google Scholar] [CrossRef]
  23. Al-Jiyashi, S.Z.S.; Noni, G.B. Effect of Scheduling Irrigation Water and Adding Organic Matter and Bio-Fertilizer on the Concentration of Some Nutrients in Wheat Plant (Triticum aestivum L.). IOP Conf. Ser. Earth Environ. Sci. 2023, 1225, 012001. [Google Scholar] [CrossRef]
  24. Nie, Z.; Wan, C.; Chen, C.; Chen, J. Comprehensive Evaluation of the Postharvest Antioxidant Capacity of Majiayou Pomelo Harvested at Different Maturities Based on PCA. Antioxidants 2019, 8, 136. [Google Scholar] [CrossRef] [PubMed]
  25. Wang, J.; He, X.; Gong, P.; Zhao, D.; Zhang, Y.; Wang, Z.; Zhang, J. Optimization of a Water-Saving and Fertilizer-Saving Model for Enhancing Xinjiang Korla Fragrant Pear Yield, Quality, and Net Profits under Water and Fertilizer Coupling. Sustainability 2022, 14, 8495. [Google Scholar] [CrossRef]
  26. Yao, L.; Kong, L.; Yang, Q.; Nian, H.; Liang, J. Analysis of Microbial Diversity in Rhizosphere Soil of Panax notoginseng under Different Water and Microbial Fertilizer Conditions. Agronomy 2024, 14, 922. [Google Scholar] [CrossRef]
  27. Li, X.; Lu, Q.; Li, D.; Wang, D.; Ren, X.; Yan, J.; Ahmed, T.; Li, B. Effects of Different Microbial Fertilizers on Growth and Rhizosphere Soil Properties of Corn in Newly Reclaimed Land. Plants 2022, 11, 1978. [Google Scholar] [CrossRef]
  28. Chen, C.; Lv, Q.; Tang, Q. Impact of Bio-Organic Fertilizer and Reduced Chemical Fertilizer Application on Physical and Hydraulic Properties of Cucumber Continuous Cropping Soil. Biomass Convers. Biorefin. 2022, 14, 921–930. [Google Scholar] [CrossRef]
  29. Fu, C.; Ma, W.; Qiang, B.; Jin, X.; Zhang, Y.; Wang, M. Effect of Chemical Fertilizer with Compound Microbial Fertilizer on Soil Physical Properties and Soybean Yield. Agronomy 2023, 13, 2488. [Google Scholar] [CrossRef]
  30. Kasprzyk, W.; Baranowska, M.; Korzeniewicz, R.; Behnke-Borowczyk, J.; Kowalkowski, W. Effect of Irrigation Dose on Powdery Mildew Incidence and Root Biomass of Sessile Oaks (Quercus petraea (Matt.) Liebl.). Plants 2022, 11, 1248. [Google Scholar] [CrossRef]
  31. Muñoz, V.; France, A.; Uribe, H.; Hirzel, J. Nitrogen and Irrigation Rates Affected Leaf Phosphorus and Potassium Concentrations in Different Cultivars of Pot-Grown Blueberry. J. Soil. Sci. Plant Nutr. 2023, 23, 965–973. [Google Scholar] [CrossRef]
  32. Nakielska, M.; Berbeć, A.K.; Madej, A.; Feledyn-Szewczyk, B. Microbial Fertilizing Products Impact on Productivity and Profitability of Organic Strawberry Cultivars. Horticulturae 2024, 10, 1112. [Google Scholar] [CrossRef]
  33. Sas-Paszt, L.; Sumorok, B.; Górnik, K.; Grzyb, Z.S.; Lisek, A.; Głuszek, S.; Trzciński, P.; Derkowska, E.; Frąc, M.; Treder, W.; et al. Influence of beneficial soil microorganisms and mineral fertilizers enriched with them on the flowering, fruiting, and physical and chemical parameters of the fruit of three-year-old strawberry plants in field cultivation. Hortic. Sci. 2023, 50, 112–126. [Google Scholar] [CrossRef]
  34. Caiyu, Z. Identification and Evaluation of the Characteristics of Local Varieties of Cabbage Without Balls; Zhejiang University: Hangzhou, China, 2018. [Google Scholar] [CrossRef]
  35. Teng, Z.; Yingying, X.; Kui, X. Effect of water and fertiliser regulation on potato tuber quality and water and fertiliser use efficiency. Northwest J. Agric. 2024, 33, 842–850. [Google Scholar]
  36. Tomar, V.; Topno, S.E.; Bahadur, V.; Kerketta, A. Effect of Organic, Inorganic and Biofertilizer on Growth, Yield and Quality of Bottle Gourd (Lagenaria siceraria Mol.). J. Adv. Biol. Biotechnol. 2024, 27, 683–691. [Google Scholar] [CrossRef]
  37. Jihadi, A.; Nikmatullah, A.; Sarjan, M. The Effect of Different Combinations of Biological Fertilizer and Different Doses of Chemical Fertilizer on the Severity of Late Blight on Potato Plants. IOP Conf. Ser. Earth Environ. Sci. 2023, 1220, 012023. [Google Scholar] [CrossRef]
  38. Chandrasekaran, M.; Chun, S.C.; Oh, J.W.; Paramasivan, M.; Saini, R.K.; Sahayarayan, J.J. Bacillus subtilis CBR05 for Tomato (Solanum lycopersicum) Fruits in South Korea as a Novel Plant Probiotic Bacterium (PPB): Implications from Total Phenolics, Flavonoids, and Carotenoids Content for Fruit Quality. Agronomy 2019, 9, 838. [Google Scholar] [CrossRef]
  39. Ali, D.F.I.; El-Nahrawy, S.; EL-Zawawy, H.A.H.; Omara, A.E.-D. Effective Applications of Bacillus subtilis and B. amyloliquefaciens as Biocontrol Agents of Damping-Off Disease and Biostimulation of Tomato Plants. Stresses 2025, 5, 9. [Google Scholar] [CrossRef]
  40. Sivojienė, D.; Masevičienė, A.; Žičkienė, L.; Ražukas, A.; Kačergius, A. Soil Microbial Community Structure and Carbon Stocks Following Fertilization with Organic Fertilizers and Biological Inputs. Biology 2024, 13, 534. [Google Scholar] [CrossRef]
  41. Zhao, S.; Liu, D.; Ling, N.; Chen, F.; Fang, W.; Shen, Q. Bio-Organic Fertilizer Application Significantly Reduces the Fusarium oxysporum Population and Alters the Composition of Fungi Communities of Watermelon Fusarium Wilt Rhizosphere Soil. Biol. Fertil. Soils 2014, 50, 765–774. [Google Scholar] [CrossRef]
  42. Mozumder, A.B.; Chanda, K.; Chorei, R.; Prasad, H.K. An Evaluation of Aluminum Tolerant Pseudomonas aeruginosa A7 for In Vivo Suppression of Fusarium Wilt of Chickpea Caused by Fusarium oxysporum f. sp. ciceris and Growth Promotion of Chickpea. Microorganisms 2022, 10, 568. [Google Scholar] [CrossRef]
  43. Kumar, S.; Sindhu, S.S.; Kumar, R. Biofertilizers: An Ecofriendly Technology for Nutrient Recycling and Environmental Sustainability. Curr. Res. Microb. Sci. 2021, 3, 100094. [Google Scholar] [CrossRef]
  44. Shao, F.; Tao, W.; Yan, H.; Wang, Q. Effects of Microbial Organic Fertilizer (MOF) Application on Desert Soil Enzyme Activity and Jujube Yield and Quality. Agronomy 2023, 13, 2427. [Google Scholar] [CrossRef]
  45. Yang, C.Y.; Zhang, R.; Lin, B.J.; Dong, B.; Gao, Y.T. Effects of water stress on inter-root soil organic nitrogen and soil enzyme activities of delayed grape cultivation in facilities. Arid. Zone Res. 2021, 38, 1376–1384. [Google Scholar]
  46. Ali, A.; Liu, X.; Yang, W.; Li, W.; Chen, J.; Qiao, Y.; Gao, Z.; Yang, Z. Impact of Bio-Organic Fertilizer Incorporation on Soil Nutrients, Enzymatic Activity, and Microbial Community in Wheat–Maize Rotation System. Agronomy 2024, 14, 1942. [Google Scholar] [CrossRef]
  47. Caballero, P.; Macías-Benítez, S.; Moya, A.; Rodríguez-Morgado, B.; Martín, L.; Tejada, M.; Castaño, A.; Parrado Rubio, J. Biochemical and Microbiological Soil Effects of a Biostimulant Based on Bacillus licheniformis-Fermented Sludge. Agronomy 2022, 12, 1743. [Google Scholar] [CrossRef]
  48. Kumar, M.; Mishra, S.; Dixit, V.; Kumar, M.; Agarwal, L.; Chauhan, P.S.; Nautiyal, C.S. Synergistic effect of Pseudomonas putida and Bacillus amyloliquefaciens ameliorates drought stress in chickpea (Cicer arietinum L.). Plant Signal. Behav. 2016, 11, e1071004. [Google Scholar] [CrossRef]
  49. Brockett, B.F.T.; Prescott, C.E.; Grayston, S.J. Soil Moisture Is the Major Factor Influencing Microbial Community Structure and Enzyme Activities across Seven Biogeoclimatic Zones in Western Canada. Soil. Biol. Biochem. 2012, 44, 9–20. [Google Scholar] [CrossRef]
  50. Manici, L.M.; Caputo, F.; De Sabata, D.; Fornasier, F. The Enzyme Patterns of Ascomycota and Basidiomycota Fungi Reveal Their Different Functions in Soil. Appl. Soil. Ecol. 2024, 196, 105323. [Google Scholar] [CrossRef]
Figure 1. Map of the location of the test site.
Horticulturae 11 00321 g001
Figure 2. Effects of different irrigation rates and microbial fertilizers on yield of B. chinensis. Note: Vertical bars are the standard deviation of the mean. Different letters on the bars indicate significant differences between treatments at the 0.05 level. ** indicates p < 0.01.
Horticulturae 11 00321 g002
Figure 3. Effects of different irrigation rates and microbial fertilizers on chlorophyll a, chlorophyll b and total chlorophyll content of B. chinensis. Note: Vertical bars are the standard deviation of the mean. Different letters on the bars indicate significant differences between treatments at the 0.05 level.
Horticulturae 11 00321 g003
Figure 4. Effects of different irrigation rates and microbial fertilizers on vitamin C content (a), soluble protein content (b), total phenol content (c), and nitrate content (d) of B. chinensis. Note: Vertical bars are standard deviation of the mean. Different letters on the bars indicate significant differences between treatments at the 0.05 level. ** indicates p < 0.01.
Horticulturae 11 00321 g004
Figure 5. Relative abundance of bacterial (a) and fungal (b) species at the phylum levels.
Horticulturae 11 00321 g005
Figure 6. Relative abundance of different treatments at the bacterial (a) and fungal (b) genus levels.
Horticulturae 11 00321 g006
Figure 7. Effects of different irrigation rates and microbial fertilizers on soil sucrase (a), urease (b) and catalase (c) activities. The different letters on the bars indicate significant differences between treatments at the 0.05 level. ** indicates p < 0.01.
Horticulturae 11 00321 g007
Figure 8. Principal component loading matrix (PCLM).
Horticulturae 11 00321 g008
Figure 9. Principal component analysis graph.
Horticulturae 11 00321 g009
Disclaimer/Publisher’s Note: The statements, opinions and data contained in all publications are solely those of the individual author(s) and contributor(s) and not of MDPI and/or the editor(s). MDPI and/or the editor(s) disclaim responsibility for any injury to people or property resulting from any ideas, methods, instructions or products referred to in the content.

