Article

Effects of Light Conditions on the Leaf Growth and Steviol Glycoside Yields of Hydroponically Cultivated Stevia Across Growth Stages

by
Cheng-Tai Chou
1,
Vivian Christabel
1,
Mai Anh Le
1,
Min-Lang Tsai
1,* and
Shang-Ta Wang
1,2,*
1
Department of Food Science, National Taiwan Ocean University, Keelung 202301, Taiwan
2
Institute of Food Safety and Risk Management, National Taiwan Ocean University, Keelung 202301, Taiwan
*
Authors to whom correspondence should be addressed.
Horticulturae 2025, 11(3), 316; https://doi.org/10.3390/horticulturae11030316
Submission received: 12 January 2025 / Revised: 18 February 2025 / Accepted: 11 March 2025 / Published: 13 March 2025
(This article belongs to the Special Issue Management of Artificial Light in Horticultural Crops)

Abstract

:
Extracts of Stevia rebaudiana are rich in sweet-tasting steviol glycosides (SG), which are widely valued as natural sweeteners. This study investigated the effects of different light conditions on stevia growth and SG production across growth stages using a controlled hydroponic system. Four light conditions were introduced at a low photosynthetic photon flux density of 50 μmol·m−2·s−1. Stevia growth was divided into four stages, and leaf weight and SG yield were analyzed. Red light resulted in the highest leaf fresh weights at 23.53 g·plant−1, whereas green light resulted in the lowest at 17.15 g·plant−1, marking a difference of 37.2%. However, green light performed the highest total SG content (LSG) at 190.68 mg·g−1 and total SG yield (YSG) at 39.24 g·m−2, compared to the lowest LSG under red light at 108.68 mg·g−1 and YSG at 24.76 g·m−2, derived differences of 75.45% and 58.48%, respectively. These results suggest a trade-off between vegetative growth and SG synthesis. Red light is optimal for early-stage biomass accumulation, while green light and blue light treatments during the last two stages, respectively, may enhance overall SG production. Consequently, the results offered insights into commercial stevia cultivation and the production of SG.

1. Introduction

Stevia (Stevia rebaudiana Bertoni) is a perennial shrub belonging to the Asteraceae family that is native to South America, particularly Paraguay, Argentina, and Brazil [1]. The primary compounds in stevia responsible for its sweet flavor are steviol glycosides (SG) [2], which are natural and noncaloric [3]. Isolated SG compounds share a common steviol frame [4]. Common SGs are stevioside (ST), steviolbioside (STB), rebaudioside A–F (RA–RF), dulcoside A (Du), and rubusoside (Ru). The sweetness of these compounds is influenced by the type and number of sugars bound at the C13 or C19 positions. For example, RA contains one more glucose unit than ST, which enhances its sweetness and improves taste quality, whereas pure ST often leaves a bitter aftertaste [5]. SGs are primarily extracted from stevia leaves, which comprise between 4% and 20% of the leaf dry weight [6]. Individual SGs exhibit varying sweetness: RA is 250–450 times sweeter than sucrose, RB 300–350 times sweeter, RC 50–120 times sweeter, RD 250–450 times sweeter, RE 150–300 times sweeter, Du 50–120 times sweeter, and STB and Ru 100–125 times sweeter [7]. As sucrose contains high levels of calories, which may potentially lead to obesity, using stevia as a low-calorie sweetener can, therefore, be highly beneficial for limiting or controlling dietary caloric intake [8]. Additionally, stevia leaves are rich in essential minerals such as potassium, calcium, magnesium, sodium, zinc, and iron, which are necessary to maintain health and regulate various metabolic processes [9].
Several factors influence the cultivation of stevia, such as sunlight, air, water, wind, and fertilizers. Among these, light is a critical factor in plant physiology. Light parameters can be categorized into light condition, light quantity, and photoperiod. For example, studies have shown nearly a two-fold increase in steviol accumulation in young stevia seedlings under short-day conditions when treated with red LED light. The midnight red LED interruption offers a practical method to enhance vegetative biomass production and steviol glycoside yield during short photoperiods [2]. Chlorophyll plays a central role in facilitating photosynthesis, while plants utilize five distinct classes of light-sensitive photoreceptors to effectively respond to various wavelengths of light energy. These photoreceptors are the phytochrome family (PHYs), cryptochrome family (CRYs), phototropin family (PHOTs), ZTL/FKF1/LKP2 group proteins, and UV-Resistance Locus 8 (UVR8) [10]. Each of these photoreceptor types is specialized to absorb specific wavelengths of light, influencing overall plant growth, metabolite synthesis and accumulation, as well as biochemical and physiological responses. Paradiso and Proietti [11] documented the numerous researchers who have investigated the effects of combined light spectra on plant physiology. Through controlled manipulation of light conditions, researchers have simulated changes in the light environment, which are perceived by the plant’s photoreceptors as signals. These signals, in turn, induce changes in plant physiology during growth.
PHYs primarily absorb red light within the wavelength range of 650–670 nm and far-red light within the wavelength range of 705–740 nm [12]. These photoreceptors influence several aspects of plant physiology, such as germination, deetiolation, inhibition of stem and petiole elongation, leaf expansion and flattening, circadian rhythms, flowering, and branching [11]. The red/far-red ratio affects flowering time, stem and petiole elongation, stomatal density, and the number of lower leaves [13]. A low red/far-red ratio can affect the activity of key enzymes involved in nitrogen metabolism, such as nitrate reductase and nitrite reductase [14].
CRYs are present in bacteria, fungi, animals, and embryophytes [12,15], which primarily absorb blue light (B) and UV-A light. Battle and Jones [16] noted that green light wavelengths fall between red and blue light wavelengths and can be absorbed by PHYs, although with lower sensitivity than red and blue light. Additionally, green light with wavelengths below 530 nm can be absorbed by CRYs and phototropins B (PHOTs B). CRYs play critical roles not only in circadian rhythms and phototropism but also in the synthesis and accumulation of metabolites, enhancing a plant’s ability to adapt to environmental conditions [17,18].
PHOTs primarily absorb blue light [12,19,20]. Boccalandro et al. [21] indicated that, within the PHOT family, PHOT1 and PHOT2 mediate phototropism, chloroplast movement, and the opening and closing of stomata in Arabidopsis. PHOTs regulate the photosynthetic process, such as the arrangement and density of chloroplasts. Under conditions of low light intensity, PHOTs enhance light capture, while under high light intensity, they reduce potential light-induced damage to crops. Notably, PHOT1 exhibits responsiveness across a broader spectrum of light intensities, whereas PHOT2 becomes activated primarily under higher light intensity levels. Additionally, ZTL/FKF1/LKP2 are sensitive to blue and UV-A light. In Arabidopsis, these photoreceptors regulate the circadian rhythm [22]. UVR8 functions as a photoreceptor for UV-A and UV-B light [10,23].
The SG in stevia leaves is derived from the diterpenoid steviol, a branch of the gibberellic acid biosynthesis pathway [24]. The process of steviol production begins with the conversion of kaurene to kaurenoic acid catalyzed by kaurene oxidase. Subsequently, kaurenoic acid is hydroxylated by ent-kaurenoic acid 13-hydroxylase to form steviol, which serves as a frame for the various SGs [25]. A series of uridine 5′-diphospho-glucuronosyltransferases (UGTs) subsequently catalyzes SG synthesis [26]. This pathway is the mechanism of SG biosynthesis [27]. Further investigations by Kumar et al. [28] and Hernández et al. [29] examined the relationship between UGT genes in stevia and the content of SG, ST, and RA. They identified four enzyme genes—UGT85C2, UGT74G1, UGT76G1, and KA13H—that were regulated by light conditions and affected the synthesis of ST, RA, and SG, leading to variations in their levels.
Variations in light conditions during cultivation have been shown to significantly influence plant growth, biomass yield, and the synthesis of secondary metabolites [30,31,32]. Specifically, studies on stevia cultivation have demonstrated that light conditions substantially affect plant morphology, secondary metabolite production, and, in particular, the accumulation of steviol glucosides by regulating the transcriptional expression of SG-related genes [33,34,35,36]. However, the effects of different light spectra applied at various growth stages on biomass yield and the accumulation of specific steviol glucosides remain insufficiently explored.
Thus, we hypothesize that optimizing light conditions at different growth stages could lead to significant improvements in biomass yield and steviol glucoside accumulation. This study aimed to investigate stevia growth across four distinct developmental stages to enhance leaf yield and SG content. The experiment utilized various monochromatic light treatments under fully enclosed and controlled environmental conditions, employing a long-day photoperiod to promote growth. At each growth stage, we analyzed stevia leaf yield, the content of individual steviol glucosides, and overall SG yield.

2. Materials and Methods

2.1. Plant Materials
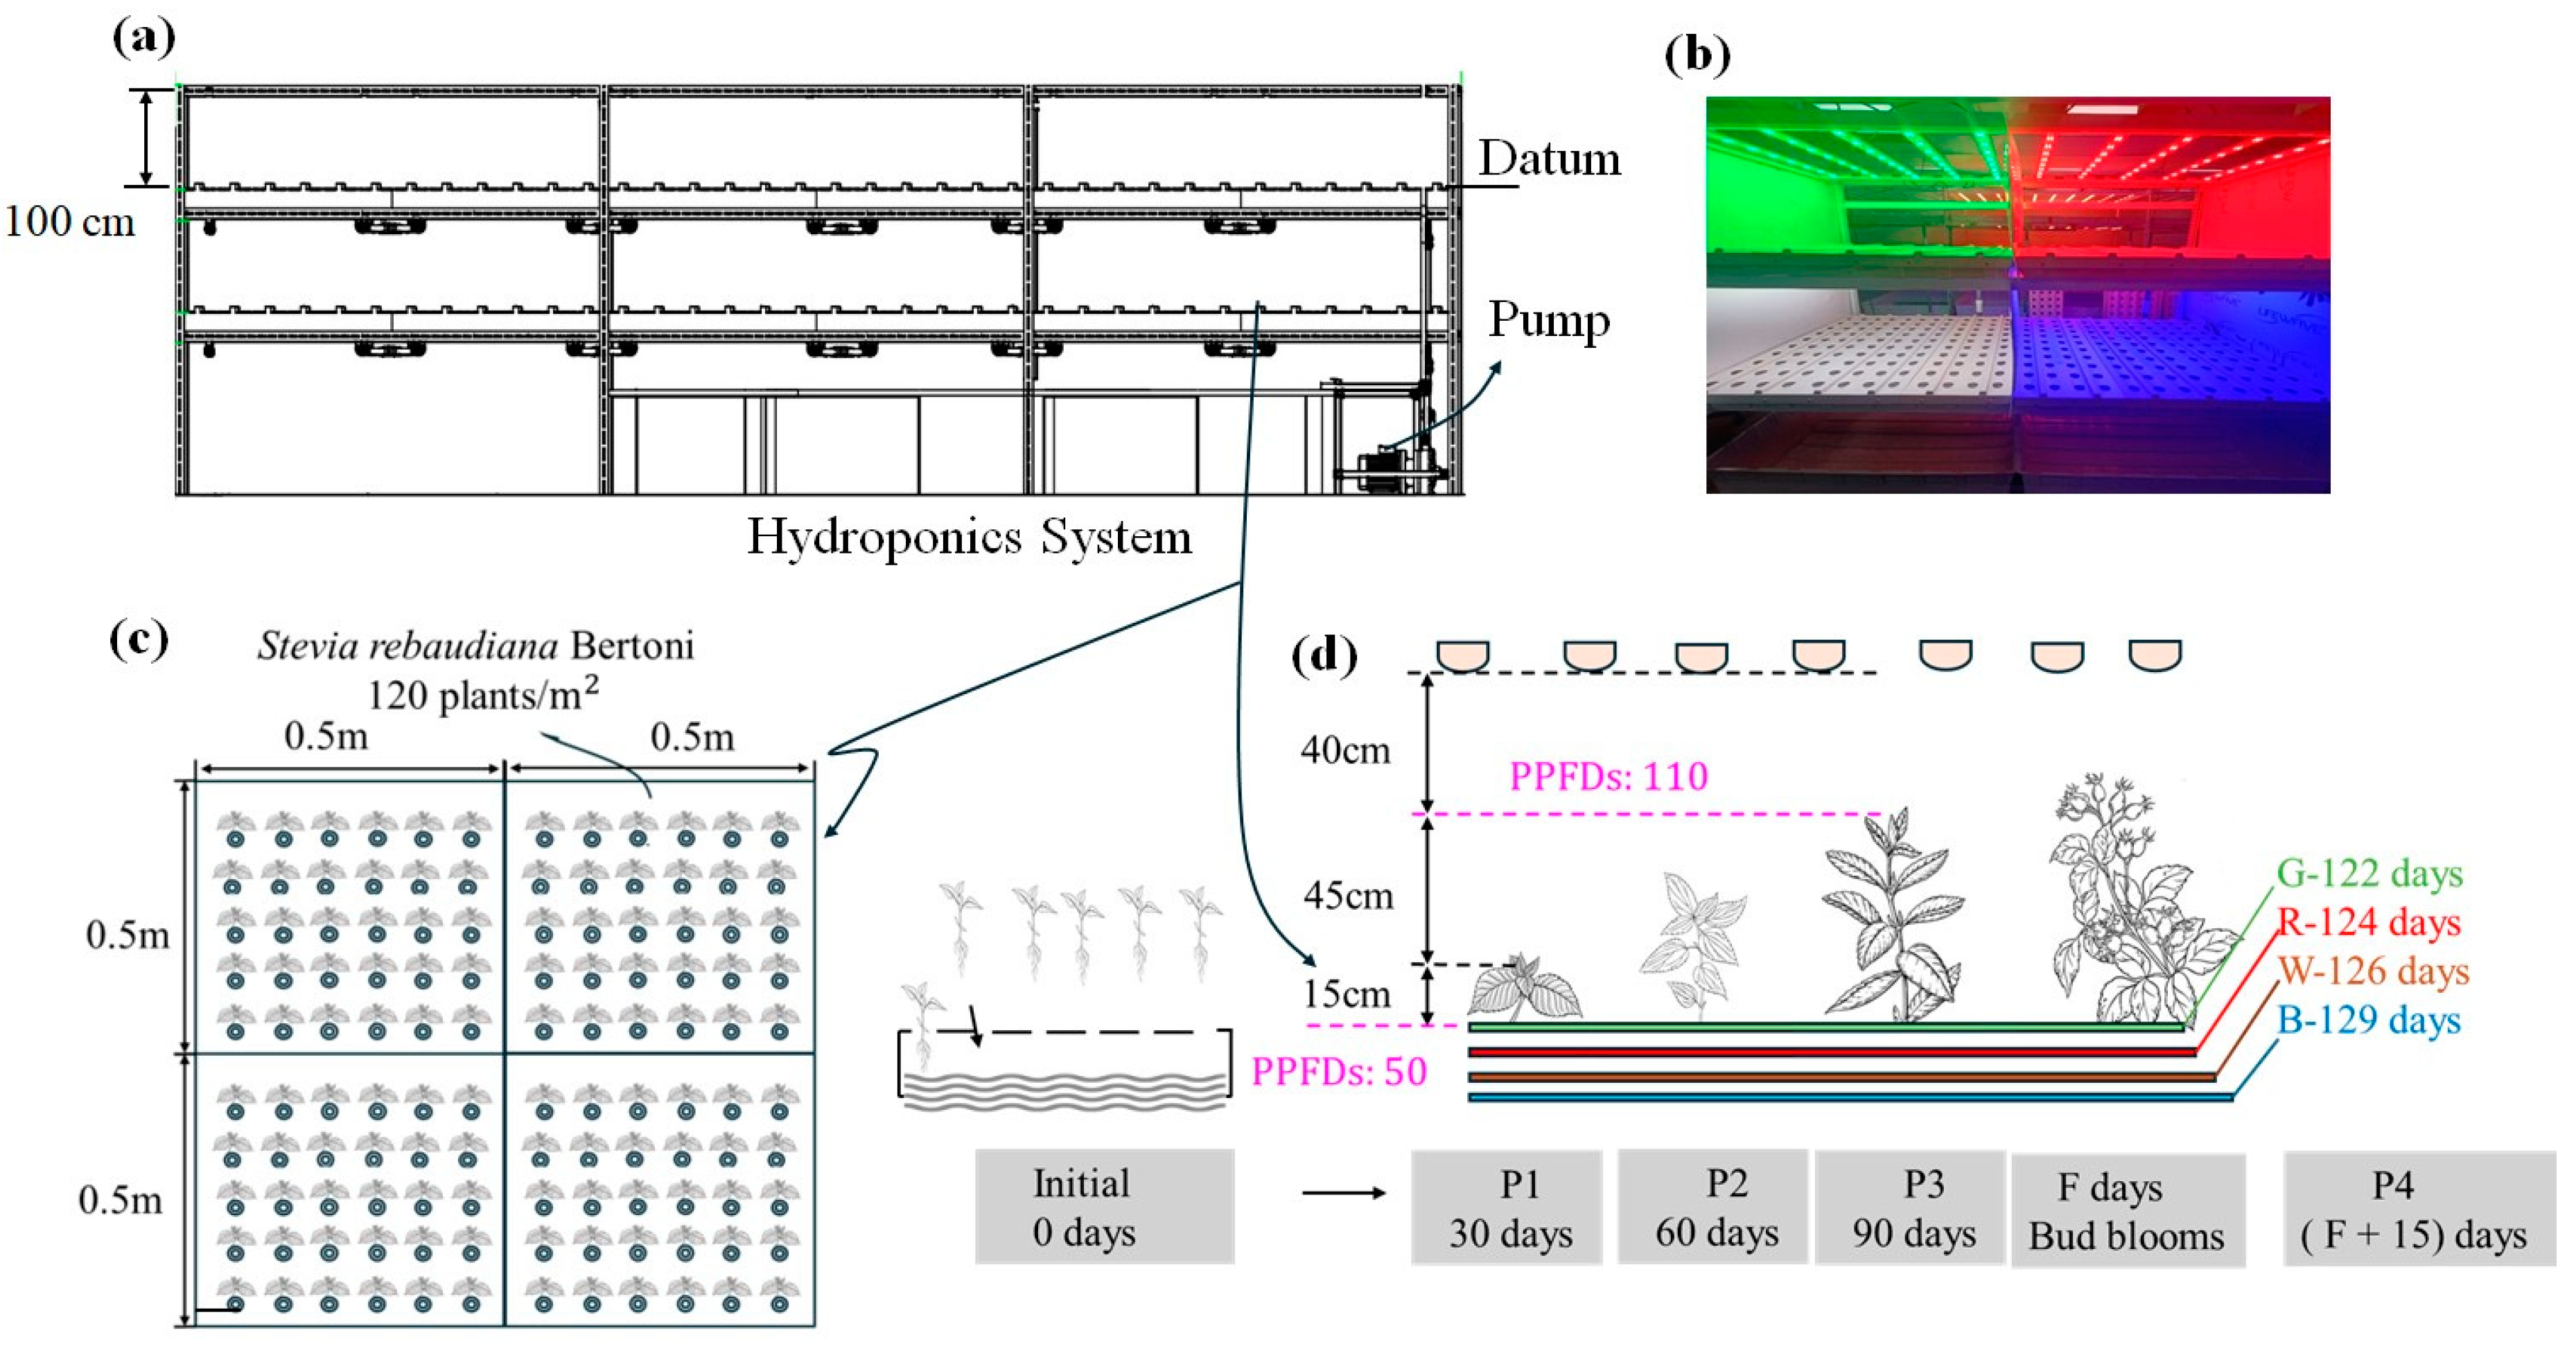
The seeds of stevia (Stevia rebaudiana var. criolla) used in this study were purchased from KNOWN-YOU Seed Company (Kaohsiung, Taiwan). The seeds were originally sourced from Japan. Seedling cultivation in a hydroponic system was conducted by NuPOLAR-LIGHTS Opto Company (New Taipei City, Taiwan). The seedling trays used for cultivation measured 60 × 40 × 8 cm (L × W × H). Each stevia seedling had a height of 7 ± 0.5 cm. A total of 120 seedlings were required for each experimental condition, with a total of 480 seedlings cultivated for subsequent cultivation research.

2.2. Culture System

To investigate the effects of four light conditions on plant growth, a light-emitting diode (LED) plant growth system with two tiers was designed, with each tier containing three cultivation compartments. Each cultivation compartment measured 100 × 100 × 100 cm (L × W × H). This study utilized four of these six compartments, each equipped with an LED module emitting one of four light conditions. The LED modules were manufactured by NuPOLAR-LIGHTS Opto Company and were measured using a spectroradiometer (LI-1800, LI-COR, Lincoln, NE, USA). The light conditions were white light with a wavelength (λ) range of 400–750 nm (Figure 1a), red light with a peak wavelength (λp) of 650 nm (Figure 1b), green light with a peak wavelength (λp) of 530 nm (Figure 1c), and blue light with a peak wavelength (λp) of 450 nm (Figure 1d).
The LED modules were operated under a constant voltage to control the output current. At a distance of 100 cm from the light source to the planting surface, the photosynthetic photon flux density (PPFD) was set to 50 μmol·m−2·s−1. When the distance from the light source to the crop canopy was reduced to 40 cm, the PPFD increased to 110 μmol·m−2·s−1 (Figure 2a). Each cultivation area covered a surface area of 1 m2. The PPFD was measured at five points (the center and the four corners) using an LI-COR spherical quantum sensor (LI-250A Light Meter, LI-COR, Lincoln, NE, USA) [37]. The PPFD was adjusted to 50 ± 0.5 μmol·m−2·s−1 (Figure 2b). The entire setup constituted a hydroponic circulation system (Figure 3a), which ensured that the pH and electrical conductivity (EC) remained consistent across all compartments. A view of the four illuminated cultivation compartments is illustrated in Figure 3b.

2.3. Culture and Light Treatments

Cultivation was conducted in a controlled-environment chamber with dimensions of 400 × 300 × 350 cm (L × W × H). The environmental conditions were maintained at a constant temperature of 25 ± 1 °C and a relative humidity of 75 ± 2%. A long-day photoperiod of 16 h of light per day was used. The nutrient solution consisted of two concentrated fertilizers, Solution A and Solution B, purchased from NuPOLAR-LIGHTS Opto Company (Taoyuan, Taiwan). The solution was prepared with a volume ratio of water to Solution A to Solution B of 200:1:1. The EC was maintained at 1.4 mS·cm−1, and the pH was controlled within the range of 6.8–7.2. Measurements of EC and pH were taken every 24 h. Each light treatment was applied to a cultivation area of 1 m2, with 120 stevia seedlings per condition. In total, 480 seedlings were used across the four light condition treatments, and the planting density was maintained, as depicted in Figure 3c. According to our farm cultivation experience, stevia typically flowers within 3–4 months under similar growth conditions. Therefore, the growth period in this study was divided into four periods or stages (P1–P4), each lasting 30 days. At the end of each growth stage, 30 stevia plants were collected from each light treatment group for drying, grinding, extraction, and analysis of SG. After the P3 growth stage, only 30 stevia plants remained in each cultivation trough for continued cultivation until flowering. The number of days required for the first flower bud to appear was designated as F days. The final harvest was conducted 15 days after flowering (F + 15 days), representing the P4 growth stage. The stevia growth process is illustrated in Figure 3d. For each growth stage, we collected the fresh leaves of the 30 harvested plants and weighed them to determine the FW. The leaves were subsequently dried at 60 °C for 24 h and weighed again to determine DW.

2.4. Microwave Extraction Process

The microwave extraction method was performed following the procedure described by Yilmaz et al. [38]. A mixture containing 0.5 g of stevia powder (SP), which was obtained by grinding the leaves part of stevia samples (grinder DV3-10, Yu-Chi Machinery, Changhua, Taiwan), and 10 mL of aqueous solution was homogenized and placed in microwave equipment (NE-1856, Panasonic Co., Tokyo, Japan) under a fixed stirring mode. The extraction was conducted at a constant power of 800 W for 10 s. After being extracted, the solution was cooled to room temperature for 30 min. This process was repeated four times. After being extracted, the mixture was centrifuged at 6000 rpm for 10 min (Himac CR22G, Hitachi Ltd., Tokyo, Japan). The supernatant was collected and filtered through a 0.45 µm nylon membrane filter. The resulting filtrate was subsequently subjected to vacuum freeze-drying (Kingmech, FD6-8P-L, New Taipei City, Taiwan). The dried extract was collected and stored for analysis.

2.5. Determination of Stevia Extraction Yield

The extraction yield (E, %) of the stevia extract was calculated as the percentage of the weight of the lyophilized Stevia rebaudiana leaf extract (LE) relative to the weight of the SP. The formula used for this calculation was as follows:
E (%) = [LE (g)/SP (g)] × 100%

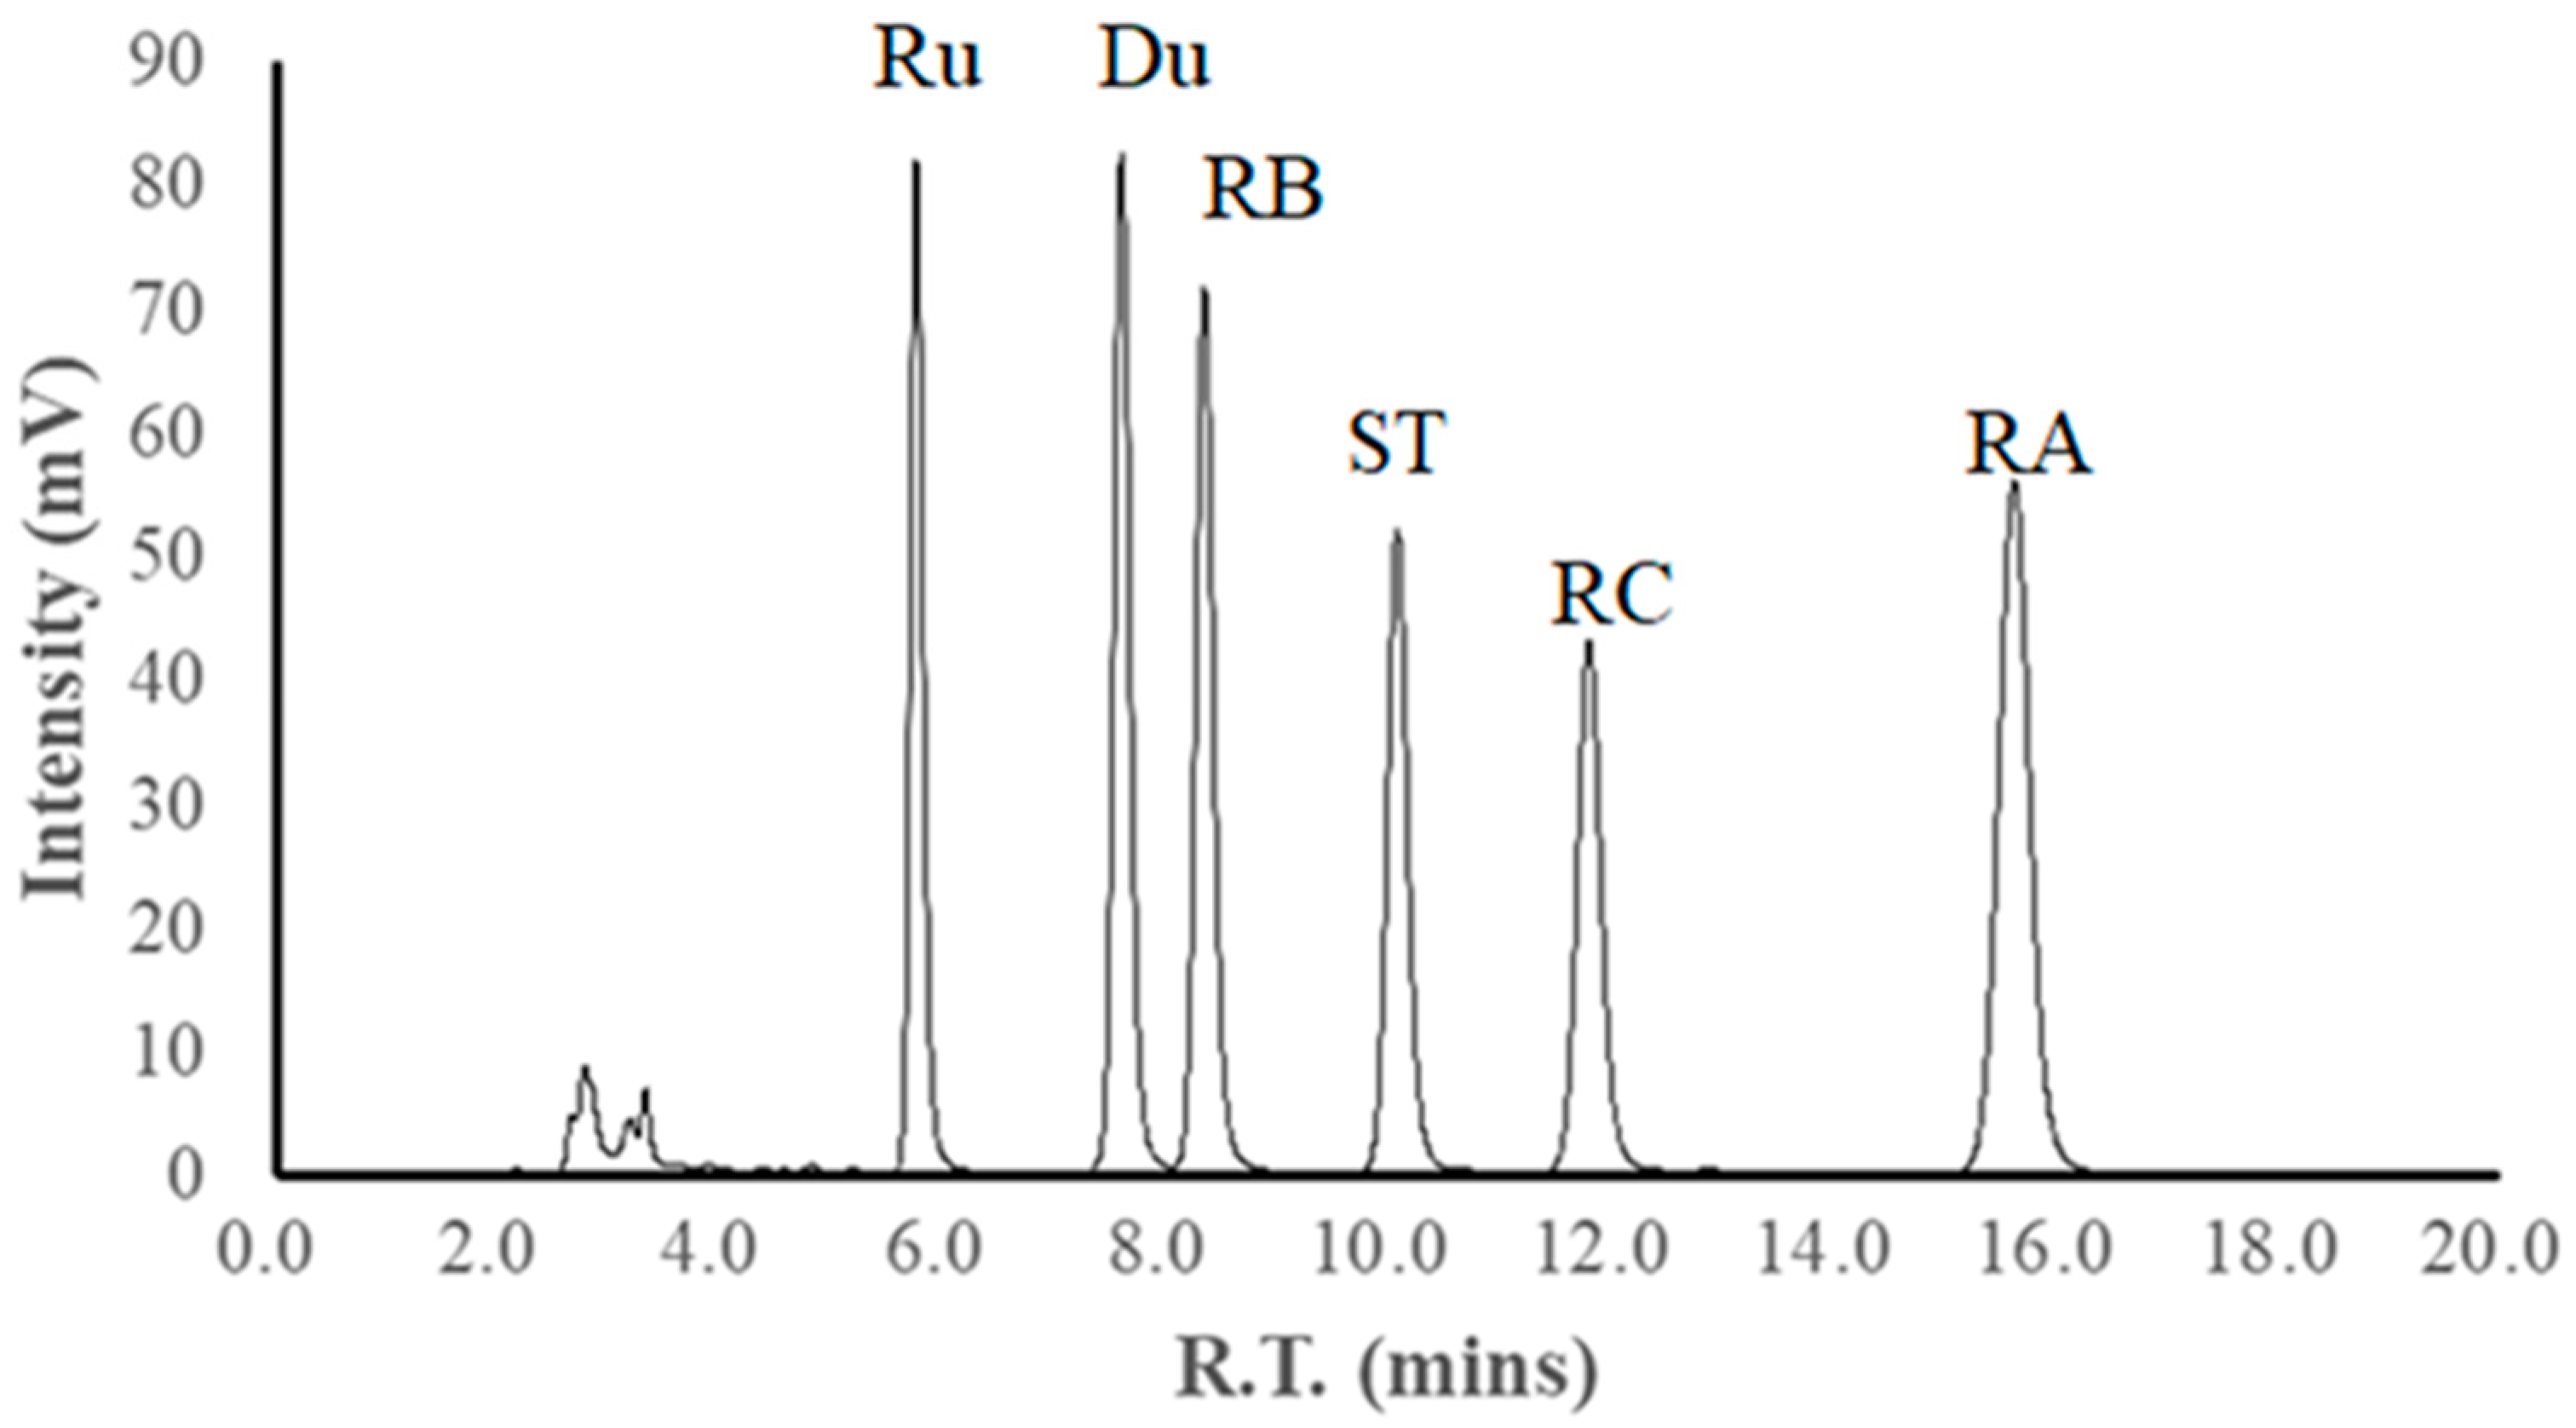
2.6. Content and Yield of Steviol Glycosides

The concentration of SG in extracts obtained from plants treated with various light treatments in various growth stages was determined using high-performance liquid chromatography (HPLC) [39]. The HPLC system consisted of a 321 HPLC pump (Gilson, Middleton, WI, USA), a SunArmor NH2 column (5 μm, 4.6 × 250 mm, Osaka, Japan), and a UV/Vis detector (UV/Vis detector-152, Gilson Inc., Middleton, WI, USA). The detection wavelength was set to 210 nm. Six standard SGs (ChromaDex Inc., Irvine, CA, USA) were used to construct a standard calibration curve, with concentrations ranging from 100 to 500 μg·mL−1. The standard solutions were mixed with the mobile phase and stirred for 30 min until dissolved. The mobile phase consisted of acetonitrile (HPLC reagents, J.T. Baker, Suwon-si, Republic of Korea): water (80:20), adjusted to pH 3.0 with phosphoric acid (Sigma-Aldrich Co., St Louis, MA, USA). The flow rate was set at 1.0 mL·min−1, and the analysis was conducted at 40 °C in a column oven (Colbox, Taiwan Hipoint, Kaohsiung, Taiwan). Data were acquired using SISC3.2 integration software (Ver. 3.2) and an EMB50S interface card (Scientific Information Services Co., Ltd., New Taipei City, Taiwan). The concentration of each SG component was calculated by inserting the peak areas from the HPLC analysis into the corresponding standard curve equations. Each concentration measurement was performed in triplicate.
The content (H) of each SG component in the lyophilized stevia extract was calculated using the following formula:
H (mg·g−1) = (C × V)/LE
where
  • C: Concentration of each SG component determined by HPLC (mg·mL−1)
  • V: Volume of the prepared stevia extract lyophilizate solution (mL)
  • LE: Weight of the lyophilized stevia extract (g)
  • HRu, HDu, HRB, HST, HRC, and HRA represent the content of Ru, Du, RB, ST, RC, and RA in the lyophilized extract, respectively.
To calculate the SG content (L, mg·g−1) in each gram of dried stevia leaf, the content of SG in the lyophilized extract (H, mg·g−1) was multiplied by E (%). The formula used was as follows:
L (mg·g−1) = H (mg·g−1) × E (%)
where LRu, LDu, LRB, LST, LRC, and LRA represent the content of Ru, Du, RB, ST, RC, and RA in the dried stevia leaf, respectively; the total SG content (LSG) in each gram of dried stevia leaf can be expressed as follows:
LSG = LRu + LDu + LRB + LST + LRC + LRA
To calculate the yields of each SG (Y, g·m−2) per m2 of cultivation area, the dry weight (DW) of the stevia leaves (g·plant−1) was multiplied by the planting density (D, plants·m−2) and the SG content (L, mg·g−1). The formula employed can be expressed as follows:
Y (g·m−2) = DW (g·plant−1) × D (plant·m−2) × L (mg·g−1)/1000
where YRu, YDu, YRB, YST, YRC, and YRA represent the yield of Ru, Du, RB, ST, RC, and RA per m2, respectively; the total SG yield (YSG) per m2 of cultivation area is calculated as follows:
YSG = YRu + YDu + YRB + YST + YRC + YRA

2.7. Statistical Analysis

The experimental data were collected in triplicate and expressed as means ± standard deviations. A one-way analysis of variance was conducted to determine whether significant differences existed between the experimental groups. When significant differences were identified, further analysis was conducted using Duncan’s New Multiple Range Test. A significance level of p < 0.05 was applied to identify statistically significant differences. All statistical analyses were conducted using IBM SPSS Statistics for Windows Version 22.0 (IBM Corp., Armonk, NY, USA).

3. Results and Discussion

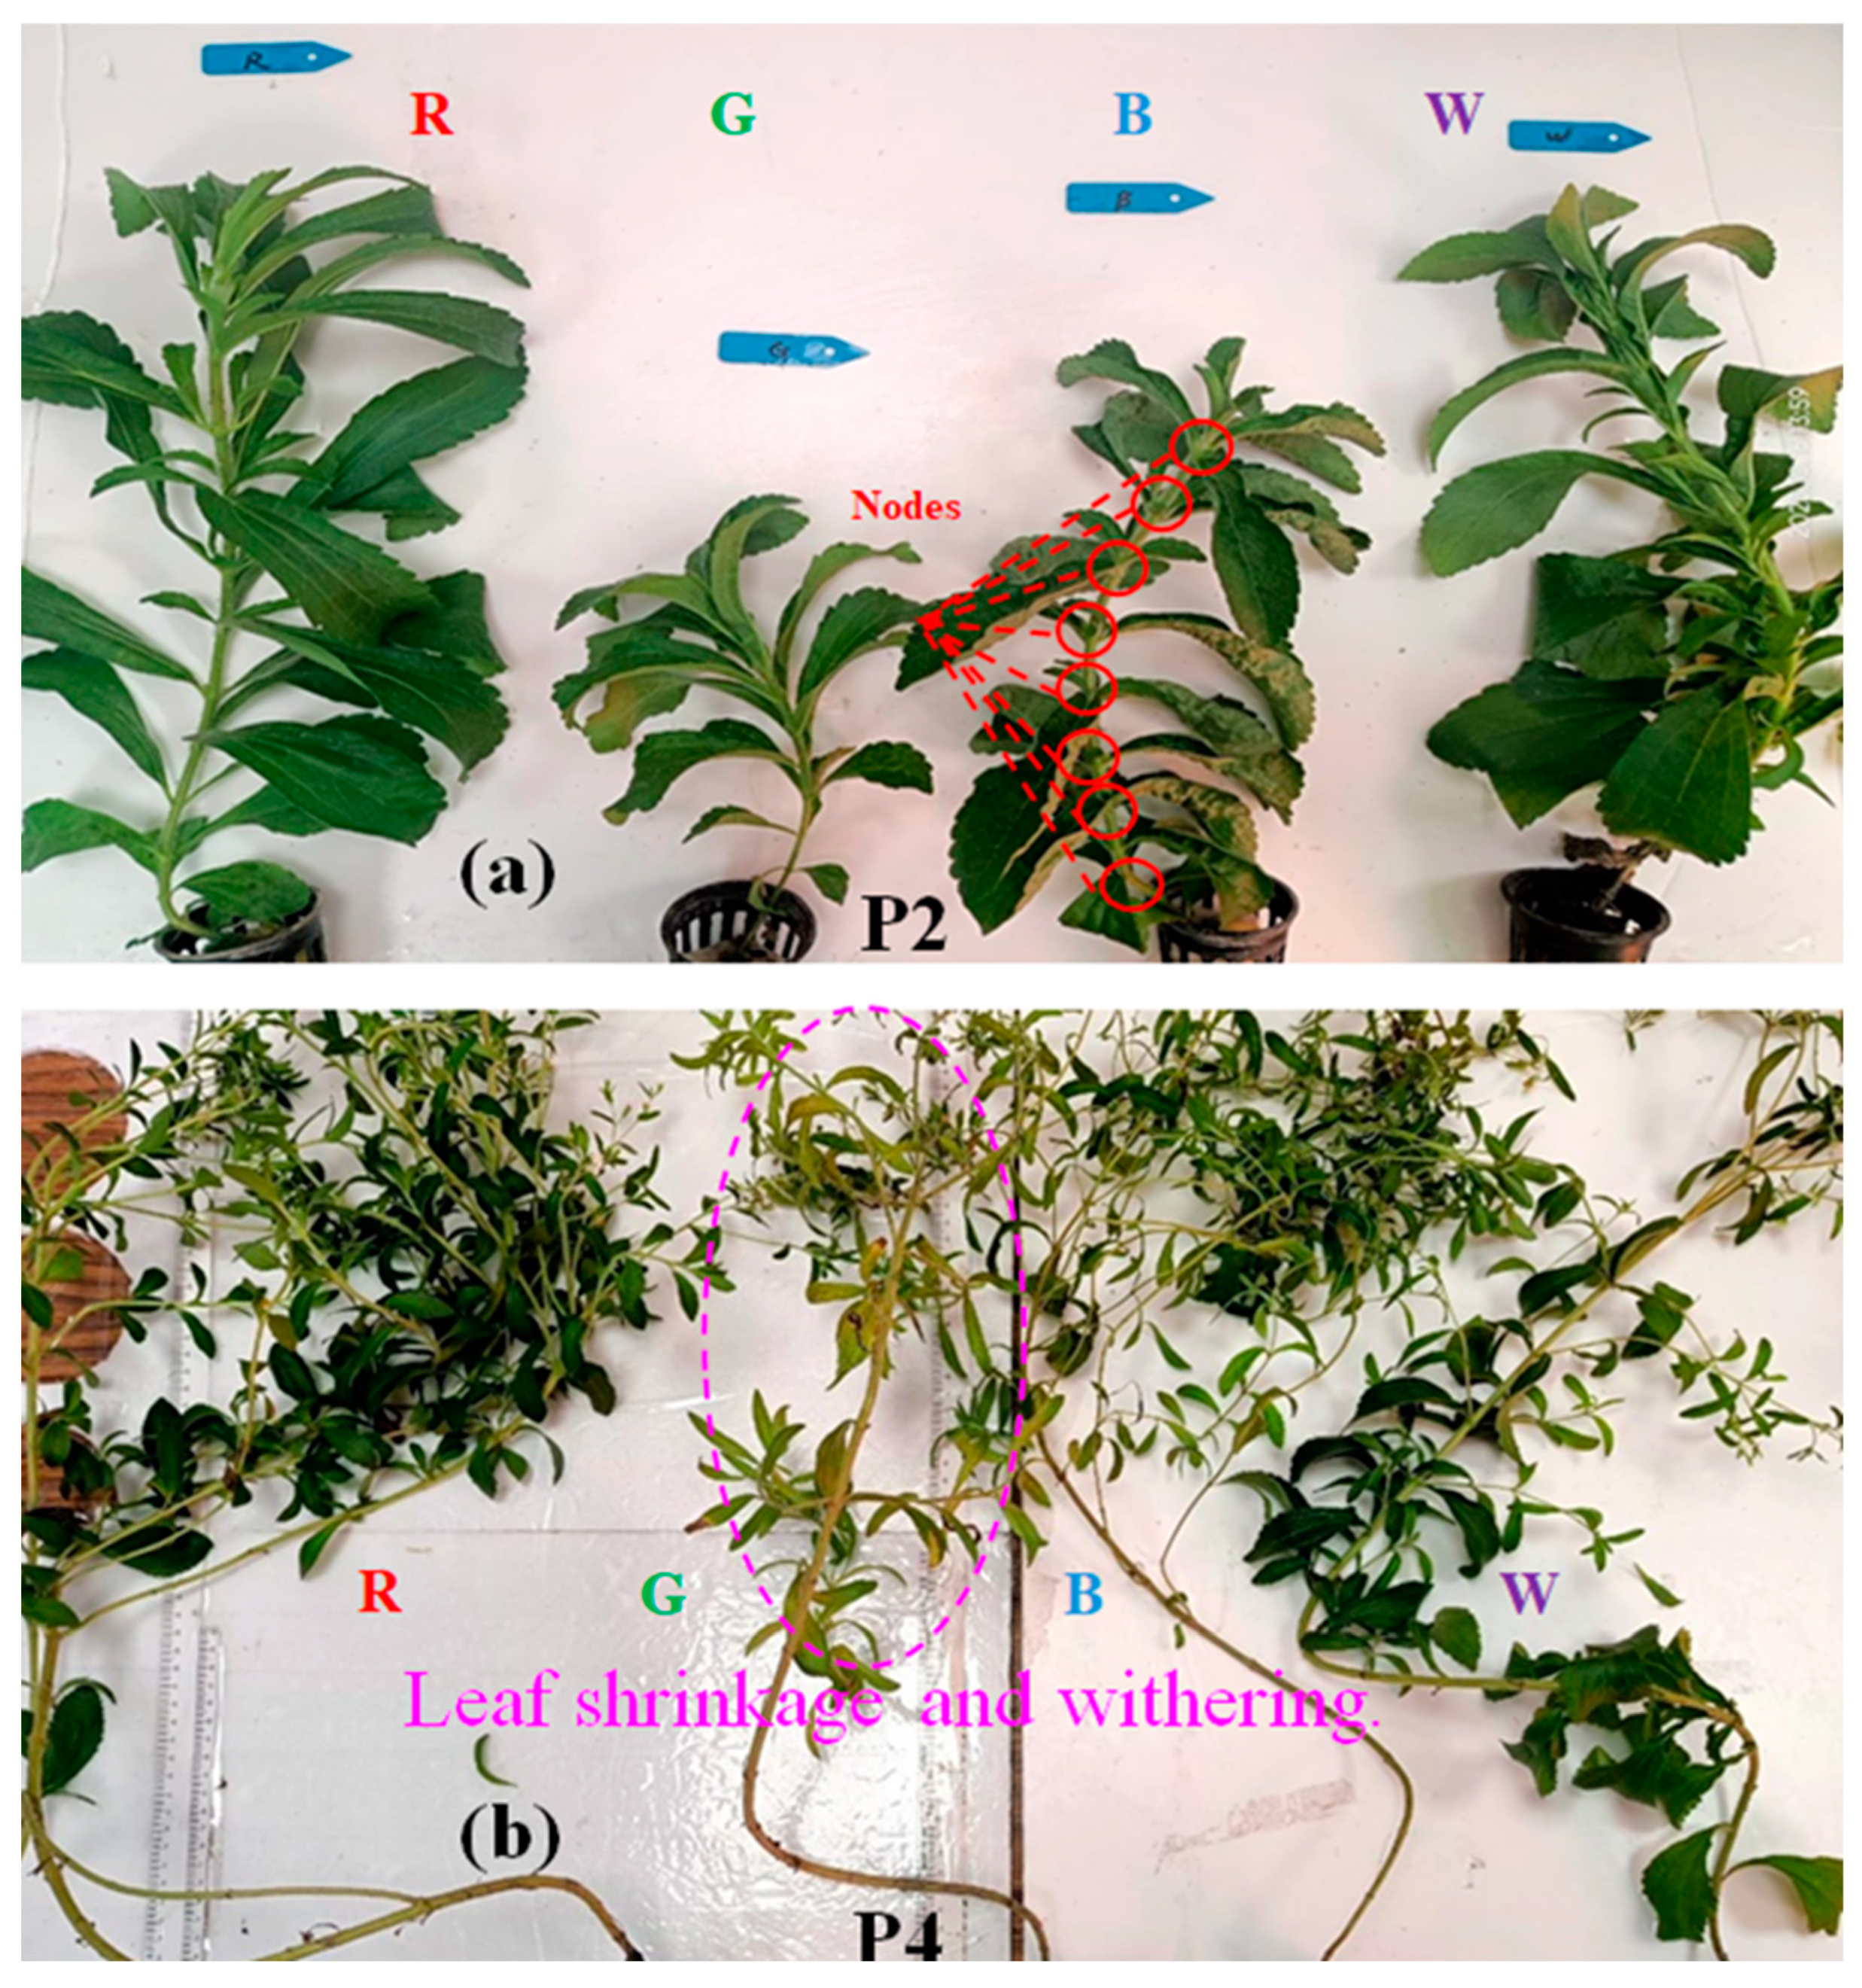
3.1. Effects of Light Quality on Biomass

3.1.1. Stevia Leaves Fresh Weight (FW)

As the results showed in Table 1, stevia grown under red light exhibited the highest FW, whereas grown under green light exhibited the lowest FW. Across light treatments, the maximum FW occurred during the P3 stage, with values reaching 18.59 g·plant−1 under white light, 23.53 g·plant−1 under red light, 17.15 g·plant−1 under green light, and 17.36 g·plant−1 under blue light.
In the P2 stage, the maximum FW was achieved under red light, measuring 8.97 g·plant−1, while the minimum FW was recorded under green light treatment at 5.58 g·plant−1, representing a 60.75% difference. During the P3 and P4 stages, FW was consistently higher under red light treatment compared to green light treatment, with red light promoting a substantially greater increase in FW over time. The peak and minimum values reflect 48.86 and 96.51% differences for P3 and P4, respectively. These results highlight the significant influence of red light in enhancing plant growth efficiency, leading to a more pronounced accumulation of biomass compared to green light exposure (FW increased 7.73-fold with red light and 5.89-fold with green light).
The results indicate that the red light treatment provided the optimal light condition for maximizing FW across growth stages. This finding is consistent with the study of Son and Oh [40], who reported that red light promoted leaf area growth in vegetables. Red light is detected by phytochrome, a key photoreceptor involved in plant growth and development. This light stimulates the conversion of phytochrome from its inactive to active form, influencing plastid development and gene expression in both chloroplasts and the nucleus. Additionally, red light plays a vital role in photosynthesis by promoting CO2 absorption into the mesophyll’s intercellular spaces, stimulating guard cells, and driving photophosphorylation to generate the energy necessary for stomatal opening. Ultimately, red light enhances photosynthetic efficiency, thereby directly supporting plant growth [40]. The findings of the present study verified that red light irradiation can substantially increase the FW yield of stevia leaves. Additionally, the FW values under treatment with white and blue light were comparable and had no statistical difference, with maximum values of 18.59 g·plant−1 and 17.37 g·plant−1, respectively. This similarity is likely due to the resemblance in the spectral compositions of white and blue light, which both contain similar proportions of blue light spectral components (Figure 1). However, FW was slightly higher under treatment with white light, which may be attributable to the additional red light energy present in the white light condition. By contrast, the maximum FW under green light was 17.15 g·plant−1, making it the least effective in increasing FW among the four light conditions.
The findings of this study also reveal that different light conditions differentially affected the flowering time of stevia (Figure 3d). The first flower bud appeared on day F, with the sequence of flowering under different light treatments occurring in the order of green, red, white, and blue light. The harvesting time for the P4 stage was set at F + 15 days, corresponding to days 122, 124, 126, and 129 for the green, red, white, and blue light treatments, respectively. The findings demonstrate that spectra containing blue light delayed the flowering time. During the flowering period, stevia plants under green light experienced noticeable growth stagnation, with leaf wilting and yellowing occurring in the P4 stage. This decline was particularly evident compared with the plants’ status during the P2 stage (Figure 4a,b). Additionally, all four light conditions resulted in growth stagnation during the P4 stage, but the effect was most pronounced under the green light treatment, in which FW decreased by 15.69% from P3 to P4 (Table 1). By contrast, FW reductions were substantially smaller under the other light conditions: 4.3% (white and red light and 4.26% (blue light). Serfaty et al. [41] reported that under outdoor cultivation conditions, FW and SG yields reached their highest values just before flowering. This phenomenon has been attributed to several factors, including the presence of dry, senescent leaves with significantly reduced steviol glycoside content, a decrease in leaf biomass due to reproductive development, or in situ catabolism by endogenous glycosidases. Hence, light conditions significantly affect stevia growth, and different growth stages differentially affect FW.

3.1.2. Stevia Leaves Dry Weight (DW)

After the fresh stevia leaves were harvested, they were dried using hot air at 60 °C for 24 h. The DW yields under the four light conditions and various growth stages are presented in Table 2. The results indicate that stevia grown under red light had the highest DW, whereas plants grown under green light had the lowest DW. Across the four light treatments, the maximum DW occurred in the P3 stage, with values of 1.86 g·plant−1 (white light), 2.35 g·plant−1 (red light), 1.72 g·plant−1 (green light), and 1.74 g·plant−1 (blue light). In the P1 stage, the highest DW was 0.26 g·plant−1 under red light, whereas the lowest DW values of 0.21 g·plant−1 were recorded under green and blue light, resulting in a 23.81% difference. In the P2 stage, the red light treatment resulted in the highest DW of 0.9 g·plant−1, whereas the green light treatment resulted in the lowest DW of 0.56 g·plant−1, reflecting a difference of 60.71%. During the P3 stage, the maximum DW of 2.35 g·plant−1 was observed under red light, and the minimum DW of 1.72 g·plant−1 occurred under green light, suggesting a 36.63% difference. In the P4 stage, red light yielded the highest DW of 2.25 g·plant−1, and green light yielded the lowest DW of 1.45 g·plant−1, indicating a 55.17% difference. These findings indicate that as the plants developed, DW under red light treatment increased from 0.26 g·plant−1 to 2.25 g·plant−1, representing a 7.65-fold increase. In comparison, DW under green treatment increased from 0.21 g·plant−1 to 1.45 g·plant−1, corresponding to a 5.9-fold increase.
The results of this study’s cultivation experiments indicated that DW was consistently highest under red light across all growth stages. The second-highest DW values were observed under white and blue light, with comparable maximums of 1.86 g·plant−1 and 1.74 g·plant−1, respectively. Ohashi-Kaneko et al. [42] reported similar findings in their study on lettuce, spinach, and komatsuna grown under white, red, blue, and red/blue ratio light. Specifically, their results demonstrated that lettuce achieved the highest DW of 2.64 g·plant−1 under white, followed by 2.07 g·plant−1 under red light. The highest DW for spinach of 2.90 g·plant−1 was recorded under red light, with white and red/blue ratio light yielding comparable DW values of 2.63 g·plant−1. The highest DW for komatsuna—2.69 g·plant−1—was observed under treatment with red light, followed by 1.88 g·plant−1 under treatment with white light. Studies have also demonstrated that chlorophyll a and b absorb red and blue light most efficiently [43,44]. Additionally, research on plant photoreceptors, particularly PHYs and PHOTs, has extensively documented their influence on plant growth patterns and biomass accumulation [12]. Paradiso and Proietti [11] have explored combining the red and blue light spectra to promote growth in plants. The findings of most studies indicate that red light, when used in high ratios, substantially enhances leaf growth, consistent with the results of the present study regarding stevia FW and DW.

3.2. Effects of Different Light Qualities and Growth Stages on Stevia Extraction Yield

The extraction yield of the stevia extract results are summarized in Table 3. The data indicate that there are no significant differences in the extraction yield of the stevia extract values among the four light condition treatments across all growth stages. However, the extraction yield of the stevia extract consistently increased as growth progressed. Under white light treatment, the extraction yield of the stevia extract rose from 18.97% in the P1 stage to 23.61% in the P4 stage, representing a 24.46% increase. Similarly, under red light treatment, the extraction yield of the stevia extract increased from 18.34% in the P1 stage to 23.47% in the P4 stage, a 27.97% increase. Under green light treatment, the extraction yield of the stevia extract improved from 19.42% in the P1 stage to 23.13% in the P4 stage, an increase of 19.10%. Finally, under blue light treatment, the extraction yield of the stevia extract increased from 19.85% in the P1 stage to 23.77% in the P4 stage, reflecting a 19.75% increase. Notably, the highest increase in the extraction yield of the stevia extract by the P4 stage was observed under red light treatment, likely due to the promotion of synthesis and accumulation of water-soluble substances within the stevia plants throughout growth.

3.3. Effects of Different Light Qualities on the Content of SG in Stevia Leaves

HPLC was used to measure the concentration of each SG component in the lyophilized stevia extract and further determine the L of six SGs, including Ru, Du, RB, RC, RA, and ST. The chromatograms obtained are depicted in Figure 5. The SG content in each gram of dried stevia leaf results are presented in Figure 6. Among all SGs, ST was the most abundant, which can be attributed to the variety of stevia used [29]. Hernández et al. [29] reported that in the stevia varieties Morita II and Criolla, Morita II exhibited the highest RA content, whereas Criolla exhibited the highest ST content. When comparing the changes in LST across the four light treatments and the four growth stages, the highest ST contents observed under the white, red, green, and blue light treatments were LSTW-P4 (65.76 mg·g−1), LSTR-P2 (46.5 mg·g−1), LSTG-P3 (83.09 mg·g−1), and LSTB-P4 (52.89 mg·g−1), respectively. On the other hand, among all treatments, the highest overall ST content in each gram of dried stevia leaf was observed under treatment with green light, followed in descending order by the content under treatment with white, blue, and red light. The highest ST content under the white, red, and blue light treatments exhibited less intergroup variation and occurred at different growth stages. Notably, the highest values under the white and blue light treatments were obtained during the P4 stage. This trend likely resulted from the upper leaves growing closer to the light source in later stages, which increased the intensity of the light to which these leaves were subjected. These findings also indicated that treatment with white and blue light, under higher PPFD, considerably affected LST. Additionally, the maximum ST content in each gram of dried stevia leaf under each treatment occurred during different growth stages: white light treatment in P4, red light treatment in P2, green light treatment in P3, and blue light treatment in P4 (Figure 6).
The results may be influenced by varied factors. Firstly, the synthesis and accumulation of SG in stevia are influenced by both temporal and spatial factors. The spatial factor involves the growth nodes of the plant (Figure 4a). Ceunen and Geuns [45] reported that varying quantities of SG accumulate in different growth stages. Under long-day conditions, stevia typically develops 22 growth nodes; in the study of Ceunen and Geuns, leaf data were grouped by every two nodes. They segmented the growth process into four stages: the young vegetative stage (up to 10 nodes), the old vegetative stage (up to 22 nodes), the bud formation stage, and the flowering stage (corresponding to the P4 stage in the present study). The results of Ceunen and Geuns’ analysis of SG content (mg·leaf−1) revealed that during the flowering stage, the leaves located below nodes 13–14 had lower SG content than those in the old vegetative stage. By contrast, the leaves located above nodes 13–14 had higher SG content than those in the old vegetative stage. This result suggests that SG content is associated with the position of leaves relative to the growth nodes. A similar pattern was observed when analyzing SG content as a percentage of leaf weight. In the present study, the data represent average SG content for each growth stage without considering the spatial distribution effect of leaf growth. Therefore, the number of leaves per node varied across growth stages depending on their relative positions. This variation in leaf number at each node likely influenced the maximum SG content observed across growth stages.
On the other hand, during the flowering stage, the presence of dry and withered leaves can lead to variations in SG content expressed as a percentage of leaf weight [41,46]. In the present study, withered and yellowing leaves were removed prior to analysis, eliminating this factor as a potential confounder. Moreover, the emergence of new leaves during the flowering stage can affect overall SG content [41,47]. Observations and FW data in the P4 stage of this study indicated that growth had nearly ceased. Therefore, the number of newly grown leaves was minimal, and their influence on overall SG content was negligible. Furthermore, endogenous glycosidase activity during the flowering stage can lead to the in situ catabolism of SG [41,48].
Also, In the later growth stages, the upper leaves grew closer to the light source, increasing the light intensity to which they were subjected (Figure 2a). Both the white and blue light spectra contained a high proportion of blue light wavelengths, which resulted in the highest SG content being present during the P4 stage. This result indicates that white and blue light considerably influenced SG content in the plants under higher PPFD. Similar findings have been reported in the literature. The spectra of white and blue light contain wavelengths absorbed by CRYs, which can enhance the accumulation of metabolites [17,18]. Yoneda et al. [34] investigated the expression of genes involved in SG biosynthesis under various light conditions, including different blue/red light ratios ranging from 0.12 to 8.57, as well as combinations of blue, red, and far-red light in different proportions. The relative transcription levels of biosynthetic genes associated with SG production were compared across these treatments. The results revealed that in the blue/red light treatment groups, the expression of the kaurene oxidase gene was most prominent under blue light alone, followed by a blue/red ratio of 0.67. In the biosynthetic pathway, the UGT74G1 enzyme primarily catalyzed the conversion of STB to ST, the UGT85C2 enzyme facilitated the conversion of steviol to steviolmonoside, and the UGT76G1 enzyme mediated the conversion of ST to RA. The highest relative transcription levels of these genes were observed under blue light alone, with no significant differences across other blue/red ratios. This finding suggests that blue light plays a critical role in regulating the gene expression of enzymes involved in SG biosynthesis. Furthermore, the regulation of SG synthesis-related gene expression under different light conditions showed trends similar to those observed in photosynthetic regulation. A study by Ptak et al. [49] demonstrated that under various cultivation light conditions, blue or white light supplementation resulted in significantly higher stomatal density, chlorophyll a and b concentrations, and carotenoid levels (indicating enhanced photosynthetic capacity) compared to red light alone. These findings imply a potential link between SG accumulation and photosynthetic capacity in stevia under specific light conditions. However, further research is required to elucidate this relationship more comprehensively.
Additionally, Wang et al. [50] examined the effect of blue light at three different intensities (50, 100, and 200 μmol·m−2 s−1) on tea plants. Their findings demonstrated that high-intensity blue light promoted lipid metabolism and flavonoid synthesis. Thoma et al. [51] reported that the accumulation of plant metabolites is influenced by CRYs absorbing blue light. Moreover, Hashim et al. [52] categorized light conditions by their differences, demonstrating that phenolic and flavonoid compounds are most effectively synthesized under the blue and ultraviolet wavelengths. These findings highlight the critical role of CRYs and UVR8 photoreceptors—which absorb blue and UV wavelengths—in the synthesis and accumulation of secondary metabolites.
Data from Figure 6 also reveals that the highest values of LRu, LDu, LRB, LRC, LRA, and LST were observed under green light, but the highest value of LRB was not. Specifically, the maximum values were LRuG-P2 (16.95 mg·g−1 of Ru), LDuG-P3 (18.94 mg·g−1 of Du), LRBB-P4 (24.35 mg·g−1 of RB), LRCG-P2 (15.44 mg·g−1 of RC), LRAG-P3 (35.64 mg·g−1 of RA), and LSTG-P3 (83.09 mg·g−1 of ST). These results indicate that stevia synthesizes and accumulates greater quantities of SG under less favorable growth conditions. Although green light has been relatively underexplored in photosynthesis research, the present study demonstrated that an increase in PPFD from 50 to 110 μmol·m−2 s−1 considerably affected the SG content. The application of green light also positively influenced the production of individual SGs. For example, Rengasamy et al. [53] conducted a study using various light combinations to examine their effects on the content of ST and RA. Their study involved two experimental groups: one using red, blue, and far-red (red + blue + far-red) and another that added a green light component (red + blue + far-red + green). Both groups were subjected to the same total PPFD. The results revealed that the RA content in the red + blue + far-red + green group increased by approximately 50%, consistent with the finding of the present study that green treatment positively influences the synthesis and accumulation of SG.
In the present study, high-density planting was implemented with a planting density of 120 plants·m−2, which is between 15 and 20 times higher than conventional planting densities. During the P2 and P3 growth stages, this resulted in the formation of dense canopies. The dense upper canopy of stevia leaves potentially limited light penetration to the lower leaves, reducing photosynthetic efficiency. Compared with treatments with white, red, and blue, treatment with green light penetrated the leaves and reached the lower canopy more effectively, influencing the overall leaf structure of the plants [54]. The optical properties of leaves cause a red-shift in absorption. Chlorophyll a contains a CH3 group, while chlorophyll b has a CHO group, shifting the absorption peak in the blue region to the right and strengthening absorption in the green region. This adjustment enables lower leaves in a canopy to better absorb transmitted green light through photoacclimation, increasing chlorophyll b synthesis and improving the acquisition of green wavelengths deeper in the canopy. This enhanced light penetration contributed to the higher SG content observed under green light treatment.
Multiple studies on CRYs have also demonstrated that green light falls within the range of CRYs’ absorption wavelength, promoting the synthesis of beneficial metabolites [16,17,18]. However, research examining the effects of green light treatment on stevia cultivation enzyme gene expression related to SG synthesis is lacking. Whether low-density cultivation also yields high SG content under green light treatment warrants further investigation. Nevertheless, research on blue light demonstrated that blue light treatment exerts substantial effects on the gene expression of enzymes involved in SG synthesis [34], consistent with the results of this study.
White and blue light treatments considerably affected the content of RB, RA, and ST during the P4 stage, with both treatments exhibiting similar trends (Figure 6). These results demonstrate that white and blue light, which both include blue light wavelengths, exerted pronounced effects at higher PPFD. This finding is consistent with the results of Hernández et al. [29], who reported that SG accumulation was enhanced under higher PPFD. Yoneda et al. [34] also observed that treatment with blue light under high PPFD substantially promoted the expression of enzyme genes involved in SG synthesis, supporting the results of the present study.
The LSG value was obtained by summing the content of the six SGs in each sample. The results for LSG under different light conditions and growth stages are presented in Figure 7. The highest LSG value was observed under the green light treatment during the P3 stage, specifically the LSG G-P3 value of 190.68 mg·g−1. Under the white, red, and blue light treatments, the maximum LSG values were LSG W-P4 (138.43 mg·g−1), LSG R-P2 (108.68 mg·g−1), and LSG B-P4 (137.07 mg·g−1), respectively. The LSG values under green light were significantly higher than those under the white, red, and blue light treatments, although the differences between the white, red, and blue light treatments were minor. Under the red light treatment, the highest LSG values were exhibited during the P2 stage, after which the values stabilized. By contrast, the LSG values for the white and blue light treatments increased throughout the growth stages, reaching their maximum in the P4 stage. The delayed flowering and reduced number of flowers under the white and blue light treatments resulted in slower leaf aging. Consequently, during the later growth stages, the LSG values continued to increase. This trend is consistent with the findings of Ceunen and Geuns [45], who reported that during the flowering stage, leaves on higher nodes contained higher SG content than those in the old vegetative stage. By contrast, leaves on lower nodes had lower SG content due to degradation, as described by Madore [48].
In the present study, the green light treatment yielded the highest LSG value during the P3 stage, as indicated in Figure 4 and Figure 7. By the P4 stage, rapid leaf yellowing occurred at all nodes, with minimal new leaf growth at the top, likely resulting in the sharp decrease observed in SG content. Under the white and blue light treatments, the delayed flowering and reduced flower numbers led to minimal changes in leaf morphology and further chemical profiles. Because the leaf data represented an average of all nodes, the SG content increased across all growth stages. This trend suggests that during the P4 stage, the accumulation of SGs under the white and blue light treatments occurred more gradually. As the lower-node leaves began to degrade and the upper-node leaves ceased growth, this study estimated a declining trend in overall SG content.

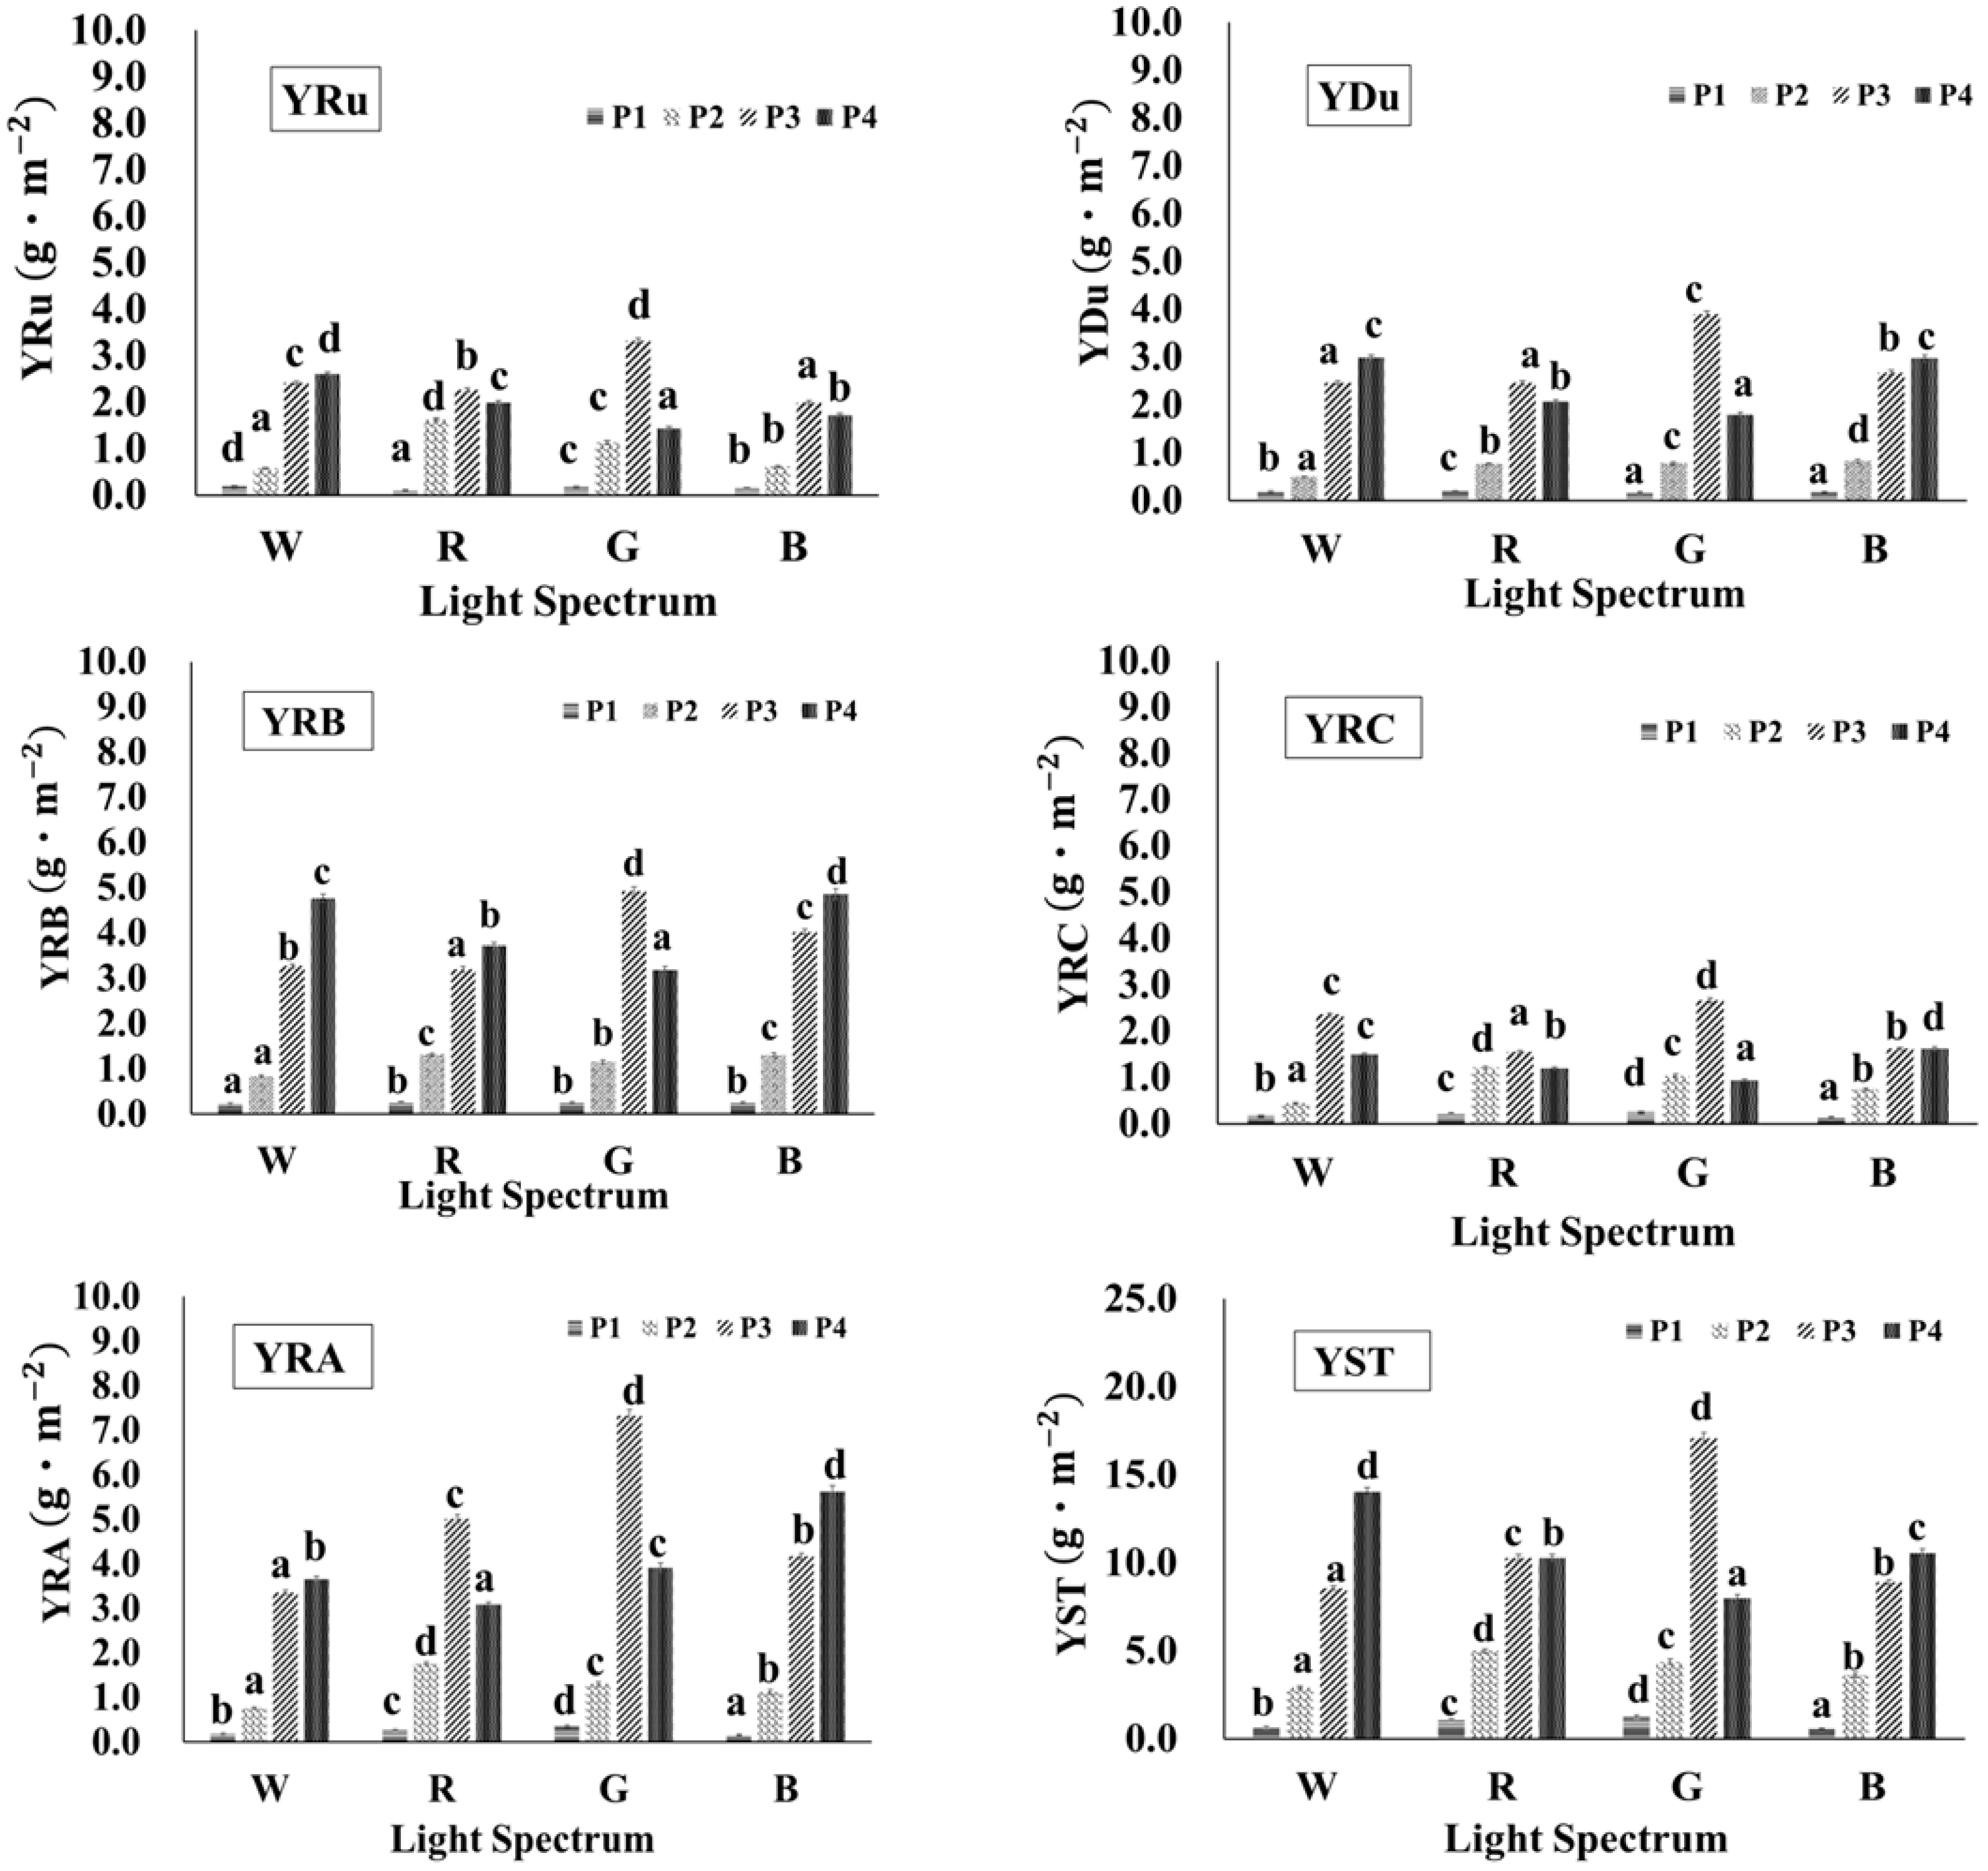
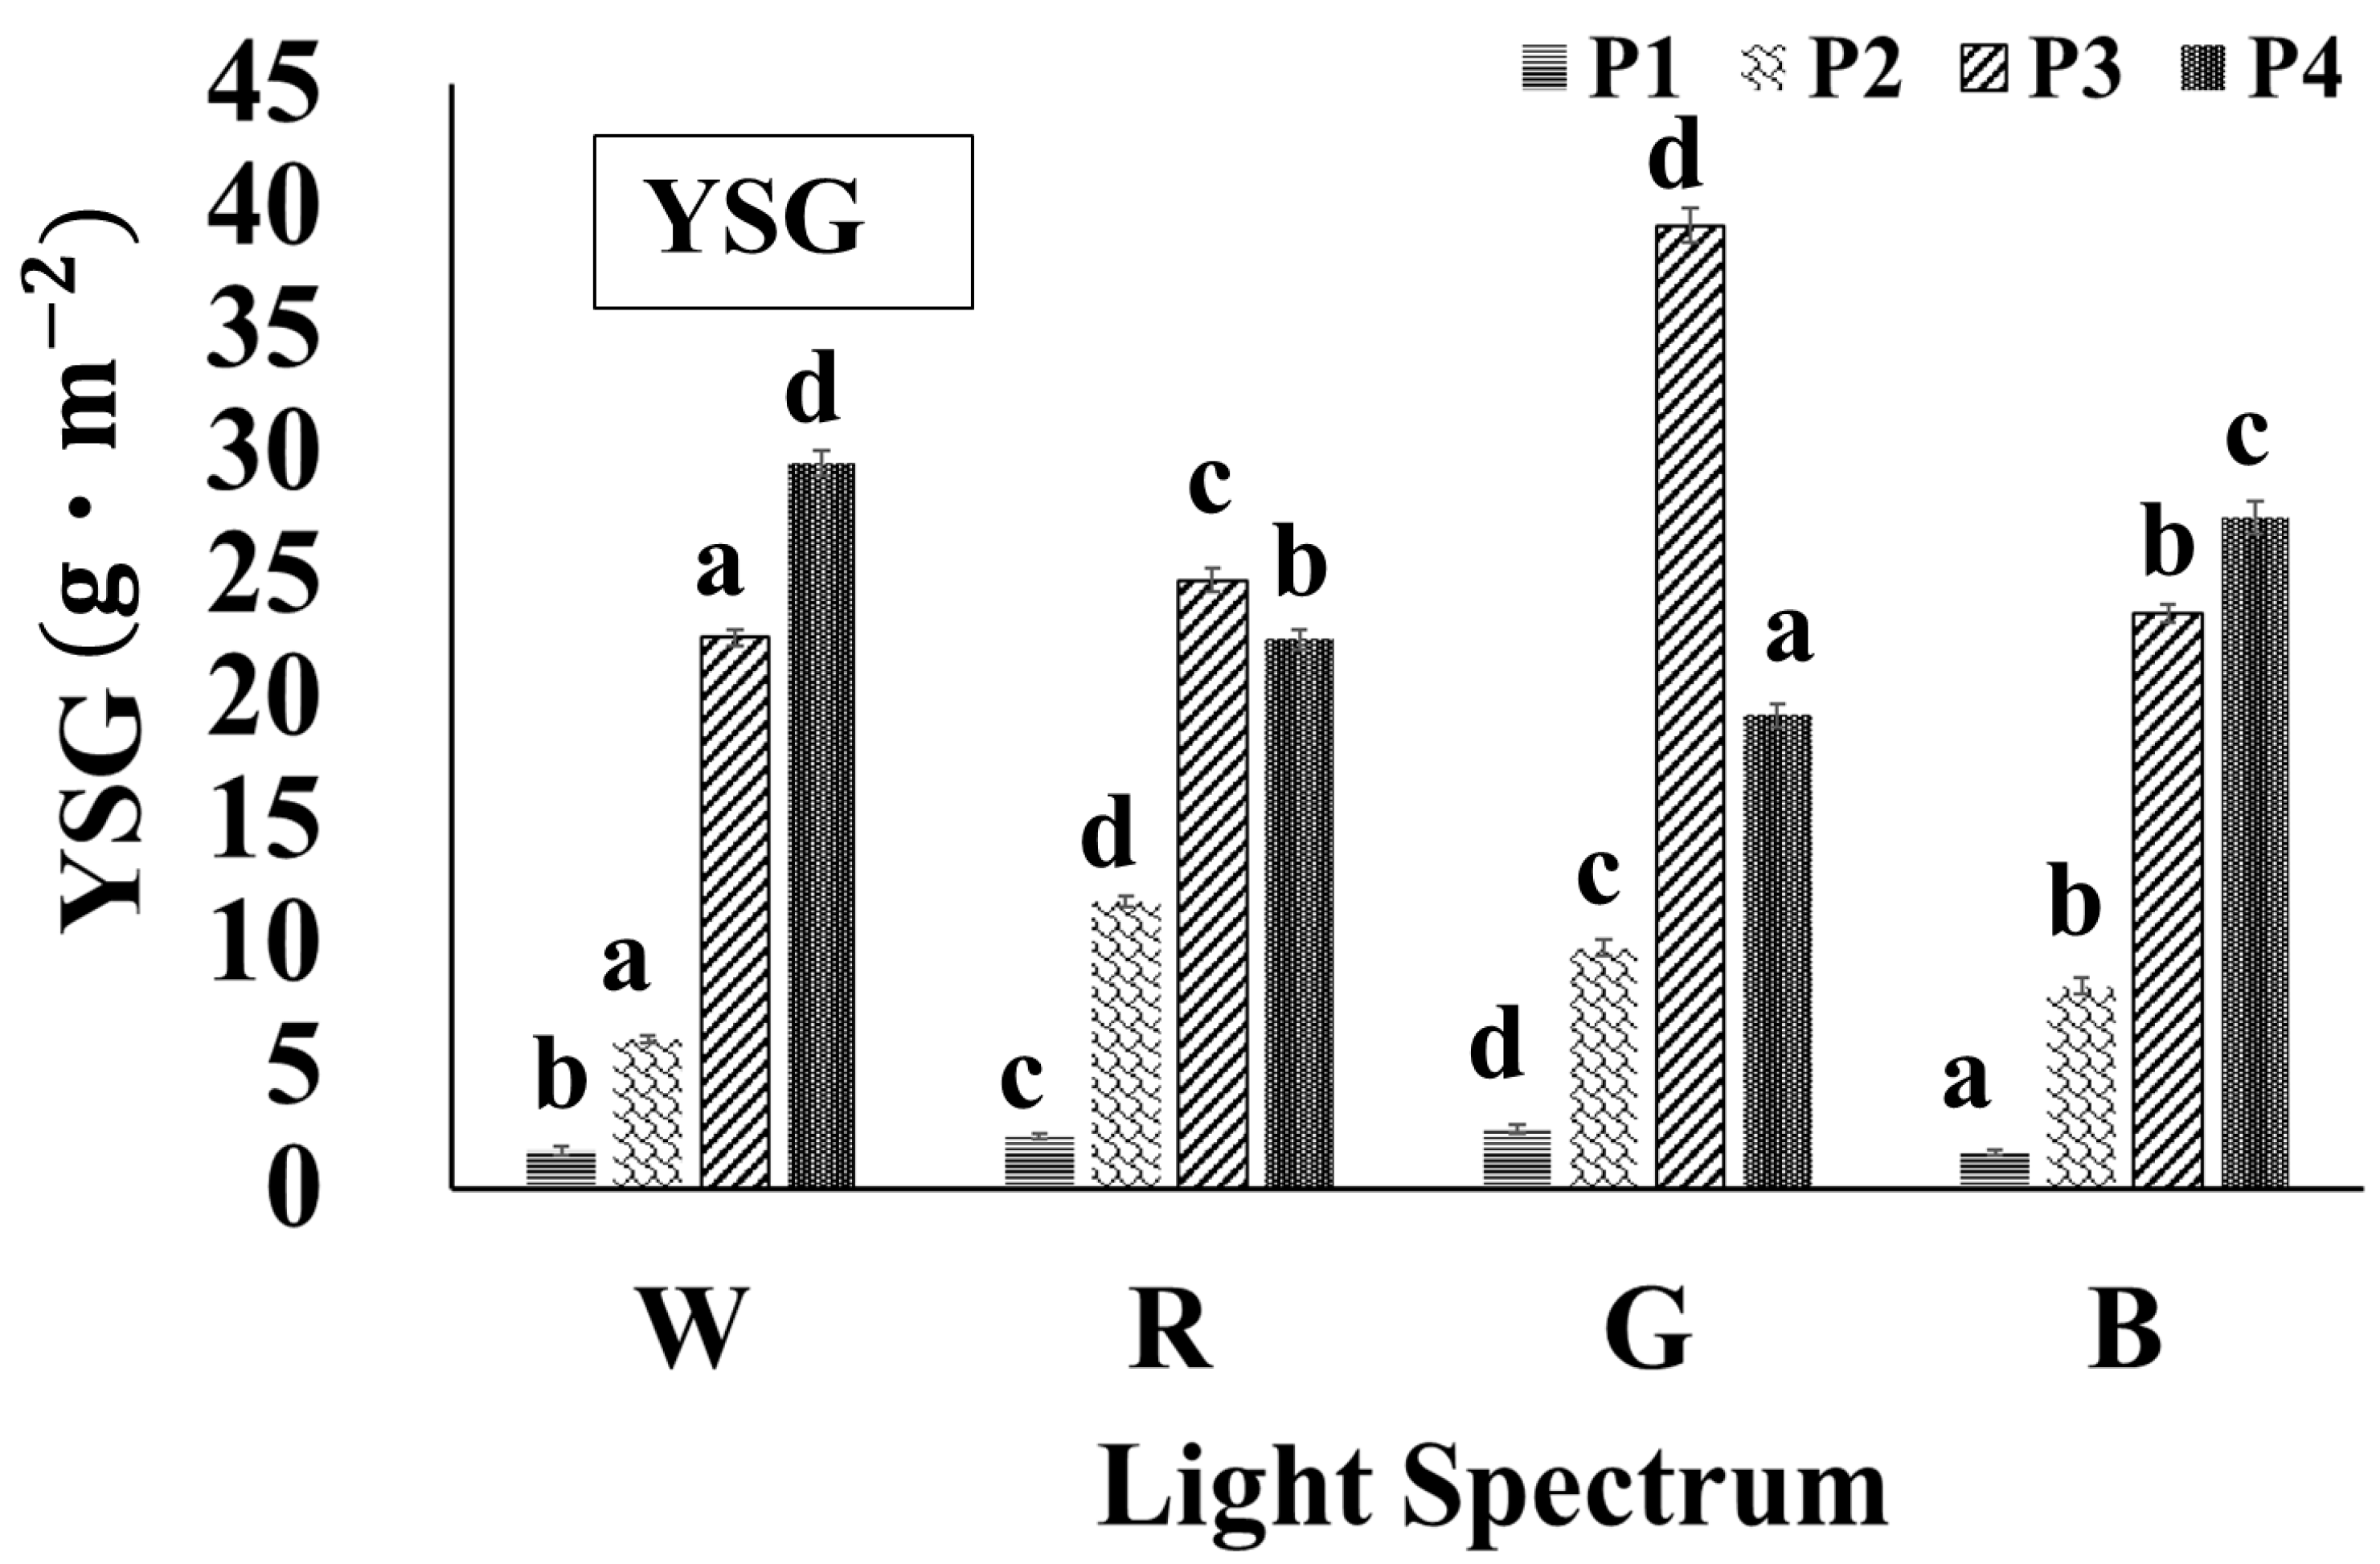
3.4. Effects of Different Light Qualities on the Yield of SG

Yield (Y, expressed in g·m−2) is a critical factor in determining costs in agricultural production. This study demonstrated that the use of different light conditions can regulate and influence the FW, DW, extraction yield of the stevia extract, concentration of each SG in the lyophilized stevia extract, content of each SG in the lyophilized stevia extract, and content of each SG in each gram of dried stevia leaf in stevia cultivation. Additionally, factors such as planting density, air circulation, water flow, carbon dioxide supply, and fertilizer regimes significantly impact the content and yield of SG. This study specifically emphasizes the role of light conditions in these processes. At each growth stage, 30 stevia plants were sampled for detailed analysis. Yield calculations were conducted under a standardized planting density of 120 plants·m−2, with statistical estimates derived from biomass measurements and the accumulation profiles of individual SGs.
The yield of each SG component per m2 of cultivation area was calculated using Equation (5), and the results are illustrated in Figure 8. The figure indicates that the maximum yield for each SG occurred under the green light treatment during the P3 stage. Specifically, the maximum yields were YRuG-P3 (3.32 g·m−2 of Ru), YDuG-P3 (3.9 g·m−2 of Du), YRBG-P3 (4.92 g·m−2 of RB), YRCG-P3 (2.67 g·m−2 of RC), YRAG-P3 (7.33 g·m−2 of RA), and YSTG-P3 (17.1 g·m−2 of ST).
Under red light, during the early P2 stage, five SGs exhibited a higher yield than under the other light treatments. The maximum yield of each SG component was YRuR-P2 (1.63 g·m−2 of Ru), YRBR-P2 (1.32 g·m−2 of RB), YRCR-P2 (1.21 g·m−2 of RC), YRAR-P2 (1.76 g·m−2 of RA), YSTR-P2 (5.00 g·m−2 of ST). The higher yield of each SG component value observed under the red light treatment during the P2 stage can be attributed to the superior FW and DW of the stevia plants at the early growth stages.
Figure 9 illustrates the yield of total SG per m2 of cultivation area under different light conditions and growth stages. The highest YSG was observed under the green light treatment during the P3 stage (YSGG-P3), with a value of 39.24 g·m−2. The maximum YSG values under the white, red, and blue light treatments were YSGW-P4 (29.56 g·m−2), YSGR-P3 (24.76 g·m−2), andYSGB-P4 (27.34 g·m−2), respectively. During the early growth stages (P1 and P2), the YSG values under all four light conditions remained less than 12 g·m−2, with minimal differences between treatments (Figure 9). However, after the P3 stage, the YSG values increased substantially under all treatments. The plants exhibited the maximum YSG values under red and green light during the P3 stage, although these values declined in the P4 stage. By contrast, under white and blue light, the YSG values continued to increase during the later growth stages, reaching a maximum in the P4 stage. This trend can be attributed to the two parameters used in the yield of the total SG calculation formula: DW and SG content in each gram of dried stevia leaf.

4. Conclusions

This study was conducted to address the growing market demand for SG and the challenges posed by climate change, which impact cultivation and product quality. Optimized methods and conditions for cultivating S. rebaudiana were developed using light-controlled hydroponic systems tailored for plant factories. The results revealed that red light treatment resulted in the highest FW and DW, leading to the highest overall plant growth. However, the SG content in each gram of dried stevia leaf under the red light treatment was lower than that under the other light treatments. When evaluated in terms of YSG values, red light alone did not yield the optimal results. In contrast, the green treatment yielded the highest HSG, LSG, and YSG values, indicating that green light is highly beneficial to stevia cultivation.
However, precisely controlling the harvesting time during the P4 growth stage under green light is crucial, as rapid leaf yellowing and senescence were observed during this phase. Under white and blue light, continual and rapid increases in HSG, LSG, and YSG were observed during the later growth stages (P3–P4). Moreover, flowering was delayed, enabling extended harvesting times. Furthermore, higher photosynthetic photon flux densities (PPFD) enhanced SG content as upper leaves approached the light source. The findings of this study provide a fundamental basis for optimizing light conditions at different growth stages in commercial stevia cultivation, contributing to enhanced SG production.

Author Contributions

Conceptualization, C.-T.C. and M.-L.T.; methodology, C.-T.C. and M.-L.T.; validation, C.-T.C. and V.C.; formal analysis, C.-T.C.; investigation, C.-T.C., V.C. and M.A.L.; resources, C.-T.C.; data curation, C.-T.C., V.C. and M.A.L.; writing—original draft preparation, C.-T.C.; writing—review and editing, M.-L.T. and S.-T.W.; visualization, C.-T.C., M.-L.T. and S.-T.W.; supervision, M.-L.T.; project administration, M.-L.T.; funding acquisition, M.-L.T. All authors have read and agreed to the published version of the manuscript.

Funding

The authors gratefully acknowledge the financial support provided by the National Science and Technology Council, Taiwan [NSTC 111-2320-B-019-004-MY3].

Data Availability Statement

The raw data supporting the conclusions of this article will be made available by the authors on request.

Conflicts of Interest

The authors declare no conflicts of interest.

Abbreviations

The following abbreviations are used in this manuscript:
CRYsCryptochrome family
DPlanting density (plants·m−2)
DWStevia leaves dry weight (g·plant−1)
EExtraction yield of the stevia extract (%)
ECElectrical conductivity (mS·cm−1)
FThe number of days required for the first flower bud to appear (days)
FWStevia leaves fresh weight (g·plant−1)
HPLCHigh-performance liquid chromatography
KA13HEnt-kaurenoic acid 13-hydroxylase
LEThe weight of the lyophilized stevia leaf extract (g)
LEDLight-emitting diode
PPFDPhotosynthetic photon flux density (μmol·m−2·s−1)
PHOTsPhototropin family
PHYsPhytochrome family
RA–RFRebaudioside A–F
SPStevia powder weight (g)
STBSteviolbioside
UGTsA series of uridine 5′-diphospho-glucuronosyltransferases
UVR8UV-resistance locus 8
1st code
Concentration, content, yield
CConcentration of each SG component determined by HPLC.
HContent of each SG component in the lyophilized stevia extract.
LContent of each SG component in each gram of dried stevia leaf.
YYield of each SG component per m2 of cultivation area.
2nd code
Steviol glycosides type
RuRubusoside
DuDulcoside A
RBRebaudioside B
STStevioside
RCRebaudioside C
RARebaudioside A
SGTotal SG
3rd code
Light condition
WWhite
RRed
GGreen
BBlue
4th code
Cultivation period
P130 days
P260 days
P390 days
P4(F + 15) days

References

  1. Budeguer, C.J.; Camadro, E.L.; Erazzú, L.E. Reproductive biology and pollen-pistil compatibility relationships in an Argentinian collection of Stevia rebaudiana Bertoni. J. Basic Appl. Genet. 2024, 35, 65–72. [Google Scholar] [CrossRef]
  2. Basharat, S.; Huang, Z.; Gong, M.; Lv, X.; Ahmed, A.; Hussain, I.; Li, J.; Du, G.; Liu, L. A review on current conventional and biotechnical approaches to enhance biosynthesis of steviol glycosides in Stevia rebaudiana. Chin. J. Chem. Eng. 2021, 30, 92–104. [Google Scholar] [CrossRef]
  3. Muñoz-Labrador, A.; Hernandez-Hernandez, O.; Moreno, F.J. A review of the state of sweeteners science: The natural versus artificial non-caloric sweeteners debate. Stevia rebaudiana and Siraitia grosvenorii into the spotlight. Crit. Rev. Biotechnol. 2024, 44, 1080–1102. [Google Scholar]
  4. Watanabe, T.; Fujikawa, K.; Urai, S.; Iwaki, K.; Hirai, T.; Miyagawa, K.; Uratani, H.; Yamagaki, T.; Nagao, K.; Yokoo, Y.; et al. Identification, chemical synthesis, and sweetness evaluation of rhamnose or xylose containing steviol glycosides of stevia (Stevia rebaudiana) leaves. J. Agric. Food Chem. 2023, 71, 11158–11169. [Google Scholar] [CrossRef]
  5. Tian, X.; Zhong, F.; Xia, Y. Dynamic characteristics of sweetness and bitterness and their correlation with chemical structures for six steviol glycosides. Food Res. Int. 2022, 151, 110848. [Google Scholar] [CrossRef]
  6. Rivera-Avilez, J.A.; Jarma-Orozco, A.; Pompelli, M.F. Stevia rebaudiana Bertoni: The interaction of night interruption on gas exchange, flowering delay, and steviol glycosides synthesis. Horticulturae 2021, 7, 543. [Google Scholar] [CrossRef]
  7. Huang, C.; Wang, Y.; Zhou, C.; Fan, X.; Sun, Q.; Han, J.; Hua, C.; Li, Y.; Niu, Y.; Okonkwo, C.E.; et al. Properties, extraction and purification technologies of Stevia rebaudiana steviol glycosides: A review. Food Chem. 2024, 453, 139622. [Google Scholar] [CrossRef]
  8. Zewail, R.M.; Ali, M.; El-Gamal, I.S.; Al-Maracy, S.H.; Islam, K.R.; Elsadek, M.; Azab, E.; Gobouri, A.A.; ElNahhas, N.; Mohamed, M.H.M.; et al. Interactive effects of arbuscular mycorrhizal inoculation with nano boron, zinc, and molybdenum fertilization on stevioside contents of stevia (Stevia rebaudiana L.) plants. Horticulturae 2021, 7, 260. [Google Scholar] [CrossRef]
  9. Khiraoui, A.; Bakha, M.; Boulli, A.; Hasib, A.; Faiz, C.A. The productivity of Stevia rebaudiana (Bertoni) on dry leaves and steviol glycosides of four varieties grown in six regions of Morocco. Biocatal. Agric. Biotechnol. 2021, 37, 102151. [Google Scholar] [CrossRef]
  10. Wu, D.; Hu, Q.; Yan, Z.; Chen, W.; Yan, C.; Huang, X.; Zhang, J.; Yang, P.; Deng, H.; Wang, J.; et al. Structural basis of ultraviolet B perception by UVR8. Nature 2012, 484, 214–219. [Google Scholar] [PubMed]
  11. Paradiso, R.; Proietti, S. Light-quality manipulation to control plant growth and photomorphogenesis in greenhouse horticulture: The state of the art and opportunities of modern LED systems. J. Plant Growth Regul. 2022, 41, 742–780. [Google Scholar] [CrossRef]
  12. Konrad, K.R.; Gao, S.; Zurbriggen, M.D.; Nagel, G. Optogenetic methods in plant biology. Annu. Rev. Plant Biol. 2023, 74, 313–339. [Google Scholar] [CrossRef] [PubMed]
  13. Casal, J.J. Photoreceptor signaling networks in plant responses to shade. Annu. Rev. Plant Biol. 2013, 64, 403–427. [Google Scholar] [CrossRef] [PubMed]
  14. Lei, K.; Hu, H.; Chang, M.; Sun, C.; Ullah, A.; Yu, J.; Dong, C.; Gao, Q.; Jiang, D.; Cao, W.; et al. A low red/far-red ratio restricts nitrogen assimilation by inhibiting nitrate reductase associated with downregulated TaNR1. 2 and upregulated TaPIL5 in wheat (Triticum aestivum L.). Plant Physiol. Biochem. 2024, 206, 107850. [Google Scholar] [CrossRef] [PubMed]
  15. D’Amico-Damião, V.; Barreto, R.F.; de Oliveira Garcia, L.F.; Porto, J.S.; de Mello Prado, R.; Carvalho, R.F. Cryptochrome 1a of tomato modulates nutritional deficiency responses. Sci. Hortic. 2022, 291, 110577. [Google Scholar] [CrossRef]
  16. Battle, M.W.; Jones, M.A. Cryptochromes integrate green light signals into circadian system. Plant Cell Environ. 2020, 43, 16–27. [Google Scholar] [CrossRef]
  17. Karki, N.; Vergish, S.; Zoltowski, B.D. Cryptochromes: Photochemical and structural insight into magnetoreception. Protein Sci. 2021, 30, 1521–1534. [Google Scholar] [CrossRef]
  18. Mawphlang, O.I.L.; Kharshiing, E.V. Photoreceptor mediated plant growth responses: Implications for photoreceptor engineering toward improved performance in crops. Front. Plant Sci. 2017, 8, 1181. [Google Scholar] [CrossRef]
  19. Hart, J.E.; Gardner, K.H. Lighting the way: Recent insights into the structure and regulation of phototropin blue light receptors. J. Biol. Chem. 2021, 296, 100594. [Google Scholar] [CrossRef]
  20. Christie, J.M.; Blackwood, L.; Petersen, J.; Sullivan, S. Plant flavoprotein photoreceptors. Plant Cell Physiol. 2015, 56, 401–413. [Google Scholar] [CrossRef]
  21. Boccalandro, H.E.; Giordano, C.V.; Ploschuk, E.L.; Piccoli, P.N.; Bottini, R.; Casal, J.J. Phototropins but not cryptochromes mediate the blue light-specific promotion of stomatal conductance, while both enhance photosynthesis and transpiration under full sunlight. Plant Physiol. 2012, 158, 1475–1484. [Google Scholar] [CrossRef]
  22. Lopez, L.; Fasano, C.; Perrella, G.; Facella, P. Cryptochromes and the circadian clock: The story of a very complex relationship in a spinning world. Genes 2021, 12, 672. [Google Scholar] [CrossRef]
  23. Jenkins, G.I. Structure and function of the UV-B photoreceptor UVR8. Curr. Opin. Struct. Biol. 2014, 29, 52–57. [Google Scholar] [CrossRef]
  24. Ahmad, A.; Ali, H.; Khan, H.; Begam, A.; Khan, S.; Ali, S.S.; Ahmad, N.; Fazal, H.; Ali, M.; Hano, C.; et al. Effect of gibberellic acid on production of biomass, polyphenolics and steviol glycosides in adventitious root cultures of Stevia rebaudiana (Bert.). Plants 2020, 9, 420. [Google Scholar] [CrossRef]
  25. Zhou, X.; Gong, M.; Lv, X.; Liu, Y.; Li, J.; Du, G.; Liu, L. Metabolic engineering for the synthesis of steviol glycosides: Current status and future prospects. Appl. Microbiol. Biotechnol. 2021, 105, 5367–5381. [Google Scholar] [CrossRef]
  26. Richman, A.; Swanson, A.; Humphrey, T.; Chapman, R.; McGarvey, B.; Pocs, R.; Brandle, J. Functional genomics uncovers three glucosyltransferases involved in the synthesis of the major sweet glucosides of Stevia rebaudiana. Plant J. 2005, 41, 56–67. [Google Scholar] [CrossRef] [PubMed]
  27. Biswas, P.; Kumari, A.; Modi, A.; Kumar, N. Improvement and regulation of steviol glycoside biosynthesis in Stevia rebaudiana Bertoni. Gene 2024, 891, 147809. [Google Scholar] [CrossRef] [PubMed]
  28. Kumar, H.; Kaul, K.; Bajpai-Gupta, S.; Kaul, V.K.; Kumar, S. A comprehensive analysis of fifteen genes of steviol glycosides biosynthesis pathway in Stevia rebaudiana (Bertoni). Gene 2012, 492, 276–284. [Google Scholar] [CrossRef] [PubMed]
  29. Hernández, K.V.; Moreno-Romero, J.; de la Torre, M.H.; Manríquez, C.P.; Leal, D.R.; Martínez-Garcia, J.F. Effect of light intensity on steviol glycosides production in leaves of Stevia rebaudiana plants. Phytochchemistry 2022, 194, 113027. [Google Scholar] [CrossRef] [PubMed]
  30. Trumpler, K.; Wu, B.; Addo, P.W.; MacPherson, S.; Lefsrud, M. Plant growth optimization using amber light supplemented with different blue light spectra. Horticulturae 2024, 10, 1097. [Google Scholar] [CrossRef]
  31. Kaiser, E.; Weerheim, K.; Schipper, R.; Dieleman, J.A. Partial replacement of red and blue by green light increases biomass and yield in tomato. Sci. Hortic. 2019, 249, 271–279. [Google Scholar] [CrossRef]
  32. Zoratti, L.; Karppinen, K.; Escobar, A.L.; Häggman, H.; Jaakola, L. Light-controlled flavonoid biosynthesis in fruits. Front. Plant Sci. 2014, 5, 534. [Google Scholar] [CrossRef]
  33. Ahmad, N.; Rab, A.; Ahmad, N. Light-induced biochemical variations in secondary metabolite production and antioxidant activity in callus cultures of stevia rebaudiana (Bert). J. Photochem. Photobiol. B 2016, 154, 51–56. [Google Scholar] [CrossRef]
  34. Yoneda, Y.; Nakashima, H.; Miyasaka, J.; Ohdoi, K.; Shimizu, H. Impact of blue, red, and far-red light treatments on gene expression and steviol glycoside accumulation in Stevia rebaudiana. Phytochchemistry 2017, 137, 57–65. [Google Scholar] [CrossRef]
  35. Shulgina, A.A.; Kalashnikova, E.A.; Tarakanov, I.G.; Kirakosyan, R.N.; Cherednichenko, M.Y.; Polivanova, O.B.; Baranova, E.N.; Khaliluev, M.R. Influence of light conditions and medium composition on morphophysiological characteristics of Stevia rebaudiana Bertoni in vitro and in vivo. Horticulturae 2021, 7, 195. [Google Scholar] [CrossRef]
  36. Semenova, N.A.; Ivanitskikh, A.S.; Uyutova, N.I.; Smirnov, A.A.; Proshkin, Y.A.; Burynin, D.A.; Kachan, S.A.; Sokolov, A.V.; Dorokhov, A.S.; Chilingaryan, N.O. Effect of UV stress on the antioxidant capacity, photosynthetic activity, flavonoid and steviol glycoside accumulation of stevia rebaudiana Bertoni. Horticulturae 2024, 10, 210. [Google Scholar] [CrossRef]
  37. Kang, L.K.; Huang, Y.J.; Lim, W.T.; Hsu, P.H.; Hwang, P.A. Growth, pigment content, antioxidant activity, and phytoene desaturase gene expression in Caulerpa lentillifera grown under different combinations of blue and red light-emitting diodes. J. Appl. Phycol. 2020, 32, 1971–1982. [Google Scholar] [CrossRef]
  38. Yılmaz, F.M.; Görgüç, A.; Uygun, Ö.; Bircan, C. Steviol glycosides and polyphenols extraction from Stevia rebaudiana Bertoni leaves using maceration, microwave and ultrasound-assisted techniques. Sep. Sci. Technol. 2020, 56, 936–948. [Google Scholar] [CrossRef]
  39. FAO/WHO. Steviol Glycosides from Stevia rebaudiana Bertoni. In Proceedings of the FAO Joint FAO/WHO Expert Committee on Food Additives (JECFA), Rome, Italy, 6–15 June 2017. [Google Scholar]
  40. Son, K.H.; Oh, M.M. Leaf shape, growth, and antioxidant phenolic compounds of two lettuce cultivars grown under various combinations of blue and red light-emitting diodes. HortScience 2013, 48, 988–995. [Google Scholar] [CrossRef]
  41. Serfaty, M.; Ibdah, M.; Fischer, R.; Chaimovitsh, D.; Saranga, Y.; Dudai, N. Dynamics of yield components and stevioside production in Stevia rebaudiana grown under different planting times, plant stands and harvest regime. Ind. Crops Prod. 2013, 50, 731–736. [Google Scholar] [CrossRef]
  42. Ohashi-Kaneko, K.; Takase, M.; Kon, N.; Fujiwara, K.; Kurata, K. Effect of light quality on growth and vegetable quality in leaf lettuce, spinach amd komatsuna. Environ. Control Biol. 2007, 45, 189–198. [Google Scholar] [CrossRef]
  43. Frank, S.R. The effectiveness of the spectrum in chlorophyll formation. J. Gen. Physiol. 1946, 29, 157–179. [Google Scholar] [CrossRef]
  44. Zhang, J.; Han, C.; Liu, Z. Absorption spectrum estimating rice chlorophyll concentration: Perliminary investigations. J. Plant Breed. Crop Sci. 2009, 1, 223–229. [Google Scholar]
  45. Ceunen, S.; Geuns, J. Influene of photoperiodism on the spatio-temporal accumulation of steviol glycosides in Stevia rebaudiana Bertoni. Plant Sci. 2013, 198, 72–82. [Google Scholar] [CrossRef]
  46. Kalandia, A.; Papunidze, G.; Vanidze, M.; Papunidze, S. HPLC of stevia (Stevia rebaudiana Bertoni) diterpene glycosides. Bull. Georgian Acad. Sci. 2004, 169, 147–150. [Google Scholar]
  47. Kienle, U. Welches Stevia hätten sie den gerne? Anbau und herstellung-perspektiven weltweit. J. Verbr. Lebensm. 2010, 5, 241–250. [Google Scholar] [CrossRef]
  48. Madore, M.A. Synthesis and degradation of diterpene glycosides in source leaves of Stevia rebaudiana (Bert.) Bertoni. Plant Biol. 2000, 129. [Google Scholar]
  49. Ptak, A.; Szewczyk, A.; Simlat, M.; Pawłowska, B.; Warchoł, M. LED light improves shoot multiplication, steviol glycosides and phenolic compounds biosynthesis in Stevia rebaudiana Bertoni in vitro culture. Sci. Rep. 2024, 14, 30860. [Google Scholar] [CrossRef]
  50. Wang, P.; Chen, S.; Gu, M.; Chen, X.; Chen, X.; Yang, J.; Zhao, F.; Ye, N. Exploration of the effects of different blue LED light intensities on flavonoid and lipid metabolism in tea plants via transcriptomics and metabolomics. Int. J. Mol. Sci. 2020, 21, 4606. [Google Scholar] [CrossRef]
  51. Thoma, F.; Somborn-Schulz, A.; Schlehuber, D.; Keuter, V.; Deerberg, G. Effects of light on secondary metabolites in selected leafy greens: A review. Front. Plant Sci. 2020, 11, 497. [Google Scholar] [CrossRef]
  52. Hashim, M.; Ahmad, B.; Drouet, S.; Hano, C.; Abbasi, B.H.; Anjum, S. Comparative effects of different light sources on the production of key secondary metabolites in plants in vitro cultures. Plants 2021, 10, 1521. [Google Scholar] [CrossRef] [PubMed]
  53. Rengasamy, N.; Othman, R.Y.; Che, H.S.; Harikrishna, J.A. Beyond the PAR spectra: Impact of light quality on the germination, flowering, and metabolite content of Stevia rebaudiana (Bertoni). J. Sci. Food Agric. 2022, 102, 299–311. [Google Scholar] [CrossRef] [PubMed]
  54. Smith, H.L.; McAusland, L.; Murchie, E.H. Don’t ignore the green light: Exploring diverse roles in plant processes. J. Exp. Bot. 2017, 68, 2099–2110. [Google Scholar] [CrossRef]
Figure 1. Light conditions and their spectrums were used in this study. (a) White light spectrum (λ = 400~750 nm). (b) Red light spectrum (λp = 660 nm). (c) Green light spectrum (λp = 530 nm). (d) Blue light spectrum (λp = 450 nm). The colors in the image represent the indicative colors of the corresponding wavelength range.
Horticulturae 11 00316 g001
Figure 2. The illustrations depict (a) the variation in photosynthetic photon flux densities (PPFD, μmol·m−2·s−1) relative to plant height and (b) the uniformity of PPFD distribution as measured at the cultivation datum.
Horticulturae 11 00316 g002
Figure 3. The illustrations represent the hydroponic recycling system, encompassing (a) a schematic system description, (b) an illuminated real light depiction, (c) cultivation density, and (d) four distinct stages of stevia growth, including flowering time and corresponding photosynthetic photon flux densities (PPFD). P1–P4 denote the cultivation periods, while W (white light: 400–750 nm), R (red light: 660 nm), G (green light: 530 nm), and B (blue light: 452 nm) indicate the spectral composition of the lighting used.
Horticulturae 11 00316 g003
Figure 4. The photographs depict stevia plants cultivated under varying growth and light conditions: (a) during cultivation period P2 and (b) during cultivation period P4. W, R, G, B, P2, and P4 are defined in the abbreviations list.
Horticulturae 11 00316 g004
Figure 5. The HPLC chromatograms of stevia extract and spiked mix steviol glycosides standards dissolved in the mobile phase (80 ACN:20 H2O). Abbreviations CRu, CDu, CRB, CST, CRC, and CRA are defined in the abbreviations list.
Horticulturae 11 00316 g005
Figure 6. The contents of individual steviol glycosides in stevia leaf extracts under various light conditions. The abbreviations W, R, G, B, P1–P4, LRu, LDu, LRB, LST, LRC, and LRA are detailed in the abbreviations list. a–d Different letters in the same growth period indicate significant differences between the means obtained by Duncan’s test (p < 0.05). All values are presented as mean ± SD based on triplicate experiments (n = 3).
Horticulturae 11 00316 g006
Figure 7. The total steviol glycoside content in stevia leaf extracts. Abbreviations W, R, G, B, and P1–P4 are defined in the abbreviations list. a–d Different letters in the same growth period indicate significant differences between the means obtained by Duncan’s test (p < 0.05). All values are expressed as mean ± SD based on triplicate experiments (n = 3).
Horticulturae 11 00316 g007
Figure 8. The yield of individual steviol glycosides from stevia leaf extracts under different light conditions. The abbreviations W, R, G, B, P1–P4, YRu, YDu, YRB, YST, YRC, and YRA are detailed in the abbreviations list. a–d Different letters in the same growth period indicate significant differences between the means obtained by Duncan’s test (p < 0.05). All values are reported as mean ± SD based on triplicate experiments (n = 3).
Horticulturae 11 00316 g008
Figure 9. The yield of individual steviol glycosides from stevia leaf extracts under different light conditions. The abbreviations W, R, G, B, P1–P4, and YSG are defined in the abbreviations list. a–d Different letters in the same growth period indicate significant differences between the means obtained by Duncan’s test (p < 0.05). All values are reported as mean ± SD based on triplicate experiments (n = 3).
Horticulturae 11 00316 g009
Table 1. The fresh weight (FW, g·plant−1) of stevia leaves in various cultivation periods under different growth light conditions.
Light ConditionP1P2P3P4
W *2.38 ± 0.30 b7.51 ± 0.18 c18.59 ± 0.28 c17.79 ± 0.32 c
R2.58 ± 0.13 c8.97 ± 0.18 d23.53 ± 0.47 d22.52 ± 0.43 d
G2.10 ± 0.19 a5.58 ± 0.20 a17.15 ± 0.31 a14.46 ± 0.37 a
B2.09 ± 0.17 a7.12 ± 0.28 b17.36 ± 0.28 b16.62 ± 0.41 b
* W: White light (400–750 nm), R: Red light (660 nm), G: Green light (530 nm), B: Blue light (452 nm). P1: 30 days, P2: 60 days, P3: 90 days, P4: (F + 15) days. F: The time point of the first bud blooms. a–d Different letters in the same column indicate significant differences between the means obtained by Duncan’s test (p < 0.05). All values are presented as mean ± standard deviation (SD) based on 30 plants (subsample size n = 30).
Table 2. The dry weight (DW, g·plant−1) of stevia leaves in various cultivation periods under different growth light conditions.
Light ConditionP1P2P3P4
W *0.24 ± 0.03 b0.75 ± 0.02 c1.86 ± 0.03 c1.78 ± 0.03 c
R0.26 ± 0.01 c0.90 ± 0.02 d2.35 ± 0.05 d2.25 ± 0.04 d
G0.21 ± 0.02 a0.56 ± 0.02 a1.72 ± 0.03 a1.45 ± 0.04 a
B0.21 ± 0.03 a0.71 ± 0.03 b1.74 ± 0.03 b1.66 ± 0.04 b
* W, R, G, B, P1–P4 are as described as Table 1 and abbreviations list. a–d Different letters in the same column indicate significant differences between the means obtained by Duncan’s test (p < 0.05). All values are presented as mean ± SD based on 30 plants (subsample size n = 30).
Table 3. Extraction yield (E, %) of stevia cultivated under different light conditions in various cultivation periods.
Light ConditionP1P2P3P4
W *18.97 ± 0.78 a21.76 ± 1.32 b22.89 ± 1.53 c23.61 ± 2.04 d
R18.34 ± 0.43 a21.39 ± 1.44 b21.47 ± 1.36 c23.47 ± 0.91 d
G19.42 ± 0.98 a22.62 ± 1.00 b22.92 ± 0.30 c23.13 ± 1.04 c
B19.85 ± 0.50 a22.98 ± 0.43 b23.65 ± 0.69 c23.77 ± 0.60 c
* W, R, G, B, P1–P4 have been described as Table 1 and abbreviations list. a–d Different letters in the same row indicate significant differences between the means obtained by Duncan’s test (p < 0.05). All values are presented as mean ± SD based on triplicate experiments (n = 3).
Disclaimer/Publisher’s Note: The statements, opinions and data contained in all publications are solely those of the individual author(s) and contributor(s) and not of MDPI and/or the editor(s). MDPI and/or the editor(s) disclaim responsibility for any injury to people or property resulting from any ideas, methods, instructions or products referred to in the content.

