Article

Seed Geometry in Species of the Nepetoideae (Lamiaceae)

by
Diego Gutiérrez del Pozo
1,2,
José Javier Martín-Gómez
3,
Nick Israel Reyes Tomala
2,
Ángel Tocino
4 and
Emilio Cervantes
3,*
1
Herbario Amazónico del Ecuador ECUAMZ, Universidad Estatal Amazónica, Carretera Tena a Puyo km. 44, Carlos Julio Arosemena Tola 150950, Napo, Ecuador
2
Facultad de Ciencias de la Vida, Universidad Estatal Amazónica (UEA), Paso lateral km. 2.5, Puyo 160101, Pastaza, Ecuador
3
Instituto de Recursos Naturales y Agrobiología, Consejo Superior de Investigaciones Científicas, Cordel de Merinas 40, 37008 Salamanca, Spain
4
Departamento de Matemáticas, Facultad de Ciencias, Universidad de Salamanca, Plaza de la Merced 1-4, 37008 Salamanca, Spain
*
Author to whom correspondence should be addressed.
Horticulturae 2025, 11(3), 315; https://doi.org/10.3390/horticulturae11030315
Submission received: 31 January 2025 / Revised: 6 March 2025 / Accepted: 8 March 2025 / Published: 13 March 2025
(This article belongs to the Section Propagation and Seeds)

Abstract

:
The Nepetoideae are a subfamily of the Lamiaceae with 124 genera in three tribes: Elsholtzieae, Mentheae and Ocimeae. Their seeds have variable shapes, described in the literature by using adjectives derived from geometry, such as ellipsoid or elliptic, oblong, oval, ovate, ovoid, subspherical, round, spheroidal or their binary combinations. The articles describing seed shape mainly refer to single genera or even species, but a comprehensive approach covering different genera is lacking. Here we present general seed morphological measurements, curvature values and similarity to a geometric model (J-index) for seeds of the subfam. Nepetoideae. Seed morphology is described for 21 species belonging to nine genera of the three tribes and compared between genera as well as between different species in Mentha, Salvia, Thymus, Lavandula and Ocimum. The research objective was to investigate the application of the J-index and curvature analysis in the taxonomy of this subfamily. Individual genera can be defined by size and shape measurements, while species can be distinguished via the J-index and curvature. New methods are presented for studying the morphological relationships between taxa in the Nepetoideae.

1. Introduction

The Lamiaceae Martinov (syn. Labiatae Juss.) is a large family of annual or perennial plants with almost 245 genera and about 7900 accepted species. The plants in this family have opposite leaves, bilaterally symmetrical flowers with two or four stamens [1,2] and a characteristic stem with a quadrangular cross-section. The ovary has two carpels divided by a secondary partition to form four chambers, each containing an ovule or seed [3]. The fruits are schizocarpic, often drupes or berries [3]. Seeds are variable in size and shape, and often present bilateral symmetry and dorso-ventral asymmetry.
The most diverse subfamily is Nepetoideae (Dumort.) Luerss [4], which is distributed on all continents except Antarctica and contains most species with human applications. Many of these are aromatic culinary herbs, such as basil, mint, rosemary, sage, oregano, hyssop, thyme, as well as medicinal herbs such as lavender or catnip [1,2,3]. Some species of Salvia L. and Ocimum L. produce edible seeds such as chia. The monophyly of Nepetoideae with respect to other subfamilies is supported by hexacolpated pollen, analysis of the rbcL sequence, mucilaginous nutlets, and the three-cell stage of pollen development [4,5,6]. Actually, and based on phylogenetic studies, the subfam. Nepetoideae is divided into three tribes, namely Mentheae Dumort. and Ocimeae Dumort. with more than 40 genera each [7,8] and the smallest Elsholtzieae (Burnett) R.W.Sanders and P.D.Cantino, which currently contains only 8 genera [9].
Given the medicinal and culinary interest in this subfamily, it is not surprising that the number of articles devoted to seed morphology is small compared to those devoted to physiological properties or seed biochemistry [10,11,12,13,14]. Monographs on seed morphology include those on Ocimum and Plectranthus L’Hér. species in Arabia [15,16], Salvia blepharoclaena Hedge and Hub.-Mor. and Marrubium L. in Turkey [17,18], Orthosiphon Benth. in West Java [19], Salvia in Iran [20] and Turkey [21] or Scutellaria L. [22,23]. These articles include SEMs (scanning electron micrographs) of seeds and their descriptions, focusing on the general shape and texture. The general shape is described as oval, ellipsoid, ellipsoid-oblong, ellipsoid-ovate [15]; ovoid, subspherical, obovoid [16]; oblong, ovate, ovoid, elliptic-oblong or round spheroidal [19] or by similar adjectives. This way of describing seeds is common in many other plant families, but it is not very precise and lacks the analytical value of quantitative descriptions. To obtain quantitative descriptions of seed shape, we proposed the method of shape quantification by comparison with models. The cardioid-derived models were first applied to the seeds of Arabidopsis thaliana (L.) Heynh. [24] as well as to the seeds of the model legumes Lotus japonicus (Regel) K.Larsen and Medicago truncatula Gaertn [25] and other species.
Geometric models that fit the two-dimensional shape observed in seed images provide the means to quantify the seed shape by comparison with reference figures. The J-index is the percentage of similarity between the seed image and the model [24,25]. In addition to the J-index, general measurements, including area, circularity, aspect ratio and roundness and curvature analysis complete the morphological descriptions. In a plane curve, curvature measures the rate at which the tangent line varies per unit distance. In plants, curvature was first measured in the root apex of Arabidopsis, showing reduced values in ethylene-insensitive mutants (etr1-1 and ein2-1) [26] or with hydrogen peroxide treatment [27]. Curvature measurements include the following: (1) maximum curvature, (2) minimum curvature and the presence or absence of negative values, (3) mean curvature, (4) ratio of maximum to mean curvature. Negative curvature values indicate the presence of non-convexities in the curve.
Seed morphological characters have traditionally been used in the taxonomy of Nepetoideae. For example, in Salvia, detailed descriptions of the seed size, shape and surface texture were used as diagnostic characters to distinguish species and sections in Hedge’s work in Africa and Arabia [28], and later to confirm molecular groupings within the subgenera [29]. Seed morphology and surface structure have also been useful for investigating evolutionary relationships, subdividing subgenera and sections, and distinguishing species [30,31,32,33]. The seed surface ultrastructure has also been proposed as an important taxonomic character in Nepeta and Clinopodium [34,35]. The methods here described for the description of the overall seed shape by comparison with models and curvature analysis may provide new tools for the application of seed morphology in the taxonomy and evolutionary history of the Nepetoideae taxonomy.
General morphological measurements and curvature analysis were carried out on a total of 21 species belonging to nine genera, and comparisons were made between tribes as well as between genera, showing differences in both cases. Geometric models were obtained for each of the 21 species and applied via calculation of the J-index to differentiate species in diverse genera.

2. Materials and Methods

2.1. Seeds

The three tribes of Nepetoideae are represented in this study by nine genera and a total of 21 species, as shown in Table 1. Plants representative of some of the species studied are shown in Figure 1. The natural distribution of the species is based on information from the Royal Botanic Gardens, Kew [36]. The origin of the seeds is also given. Seeds from wild populations in Ecuador were returned to the wild after being photographed. Seeds from wild populations in Ecuador (Marsypianthes chamaedris (Vahl) Kuntze and Ocimum campechianum Mill.) were returned to the original areas located in Puyo, Pastaza Province, dispersing them over the surrounding soil so that they become part of the seed bank after being photographed.

2.2. Photography

Photographs of individual seeds were taken using a Nikon stereomicroscope model SMZ1500 (Nikon, Tokyo, Japan) equipped with a Nikon DS-Fi1 camera with 5.24 megapixels (Nikon, Tokyo, Japan) for seeds photographed in Salamanca and an INCH digital microscope (model 7-Z01C) with 500× and 1000× magnification lenses for seeds photographed in Ecuador. The photographs were saved as JPG images of 1280 × 960 with 300 ppi. One image of 20 seeds (300 ppi) was compiled for each species. The images are available in Zenodo (Supplementary Materials, Figure S1).

2.3. Morphological Measurements

Seed image area (A), perimeter (P), major axis length (L), minor axis length (W), aspect ratio (AR = L/W), circularity (C), roundness (R) and solidity (S) were measured using the ImageJ program (version v1.8.0) [37,38,39,40]. The program converts pixels into mm according to a ruler contained in the images. Thus, the measurements refer to the seed images in the photographs. Circularity is the ratio:
C = ( 4 π × A ) / P 2
where A is the area and P is the perimeter. The aspect ratio is the quotient L/W, where L is the length, and W is the width. The roundness is given by:
R = ( 4 × A ) / ( π × L 2 ) .
Solidity is a property of closed-plane curves related to their convexity. It expresses the ratio of the area of an object to the area of its convex Hull (the convex Hull is the smallest convex set that contains a plane figure).

2.4. Quantitative Seed Shape Analysis (J-Index)

The J-index is the percentage of similarity between a seed contour and a given model. The model chosen can be either a geometric figure or the average contour of a number of seeds representing a species or population. Average contours can be derived from image analysis or after the algebraic elaboration of the image coordinates. In this study, the models used were average contours derived from 20 seeds via image analysis [41]. Those were evaluated for the J-index (percentage of similarity) with 20 seeds of their own species or with 20 seeds of different species. The J-index is calculated by comparing both images: those of the seeds and the model. For this, the models are superimposed on the images of 20 seeds looking for maximum similarity. The models are overlaid on Corel Photo Paint images containing 20 seeds of each cultivar, and two new files are saved for each of these images: one with the model in black and one with the model in white. The Image J program [37] gives for each of these images the values of the total area (T, being the contour of the model in black, and the whole area is considered) and area shared between the model and the seeds (S, being the contour of the model in white, and the measured area is limited to the area shared between the seed and the model); see Figure 2. “T” is the total surface occupied by either the seed or the model, whereas in “S”, the measured surface is shortened by the white profile of the model. For each seed, the J-index is calculated as the ratio S/T. For each variety, the J-index is the mean value of its 20 (or 30) seeds. In the quantification of shape, the J-index is the ratio between the area shared between the seed image and the model (S) and the total area (T; Figure 2):
J   i n d e x = S / T

2.5. Curvature Analysis

Seed images (JPEG, 150 ppi) were opened in ImageJ, converted to 8-bit and their thresholds adjusted. The contour corresponding to the image was selected, and a new threshold was defined prior to the corresponding line graph analysis to obtain the x and y coordinates used to calculate the Bézier curve and the corresponding curvature function in Mathematica according to published protocols [26,27,42]. The curvature of the resulting Bézier curves is given as a parametric function defined in the interval [0, 1]. The maximum and minimum curvature values indicate the major changes in the slope of the curve. In a straight line, the curvature is equal to 0, and in a circular curve, the curvature is constant and equal to the inverse of the radius. Therefore, different maximum and minimum curvatures diverging from the mean indicate a deviation from circularity. The curvature depends on the size of the figure and is given in mm−1, so a curvature of 10 corresponds to a circumference with a radius of 100 microns, and a curvature of 2 corresponds to a circumference with a radius of 0.5 mm. The mean curvature is the mean of this curvature function, i.e., its Riemann integral divided by the interval length. A ratio of maximum to mean curvature close to 1 indicates a contour approaching a circumference with a radius equal to the inverse of the mean curvature value. Curvature ratios different from 1 indicate low circularity. The curvature analysis is here applied to the entire contours of the seed images and the values given are those corresponding to the Bézier curves that fit these contours, so an adequate fit between the seed contour and the Bézier curves is a requirement that can be controlled by the similarity between the two images. The fitting of the Bézier curves is supported here by the automatic point extraction in ImageJ. Mathematica files (.nb) for curvature analysis are available in Zenodo (Supplementary Materials, Figure S2).

2.6. Statistical Analysis

Factorial analysis and PCA were performed on all primary data searching for simplification of the data and avoiding redundant information. For most measurements, populations did not follow a normal distribution, so the Kruskal–Wallis test (non-parametric) was used for comparisons instead of ANOVA. These analyses were performed using IBM SPSS Statistics v29 (SPSS 2022). The p-values below 0.05 were considered significant. Figure 3 was generated using R 4.4.2 [43].

3. Results

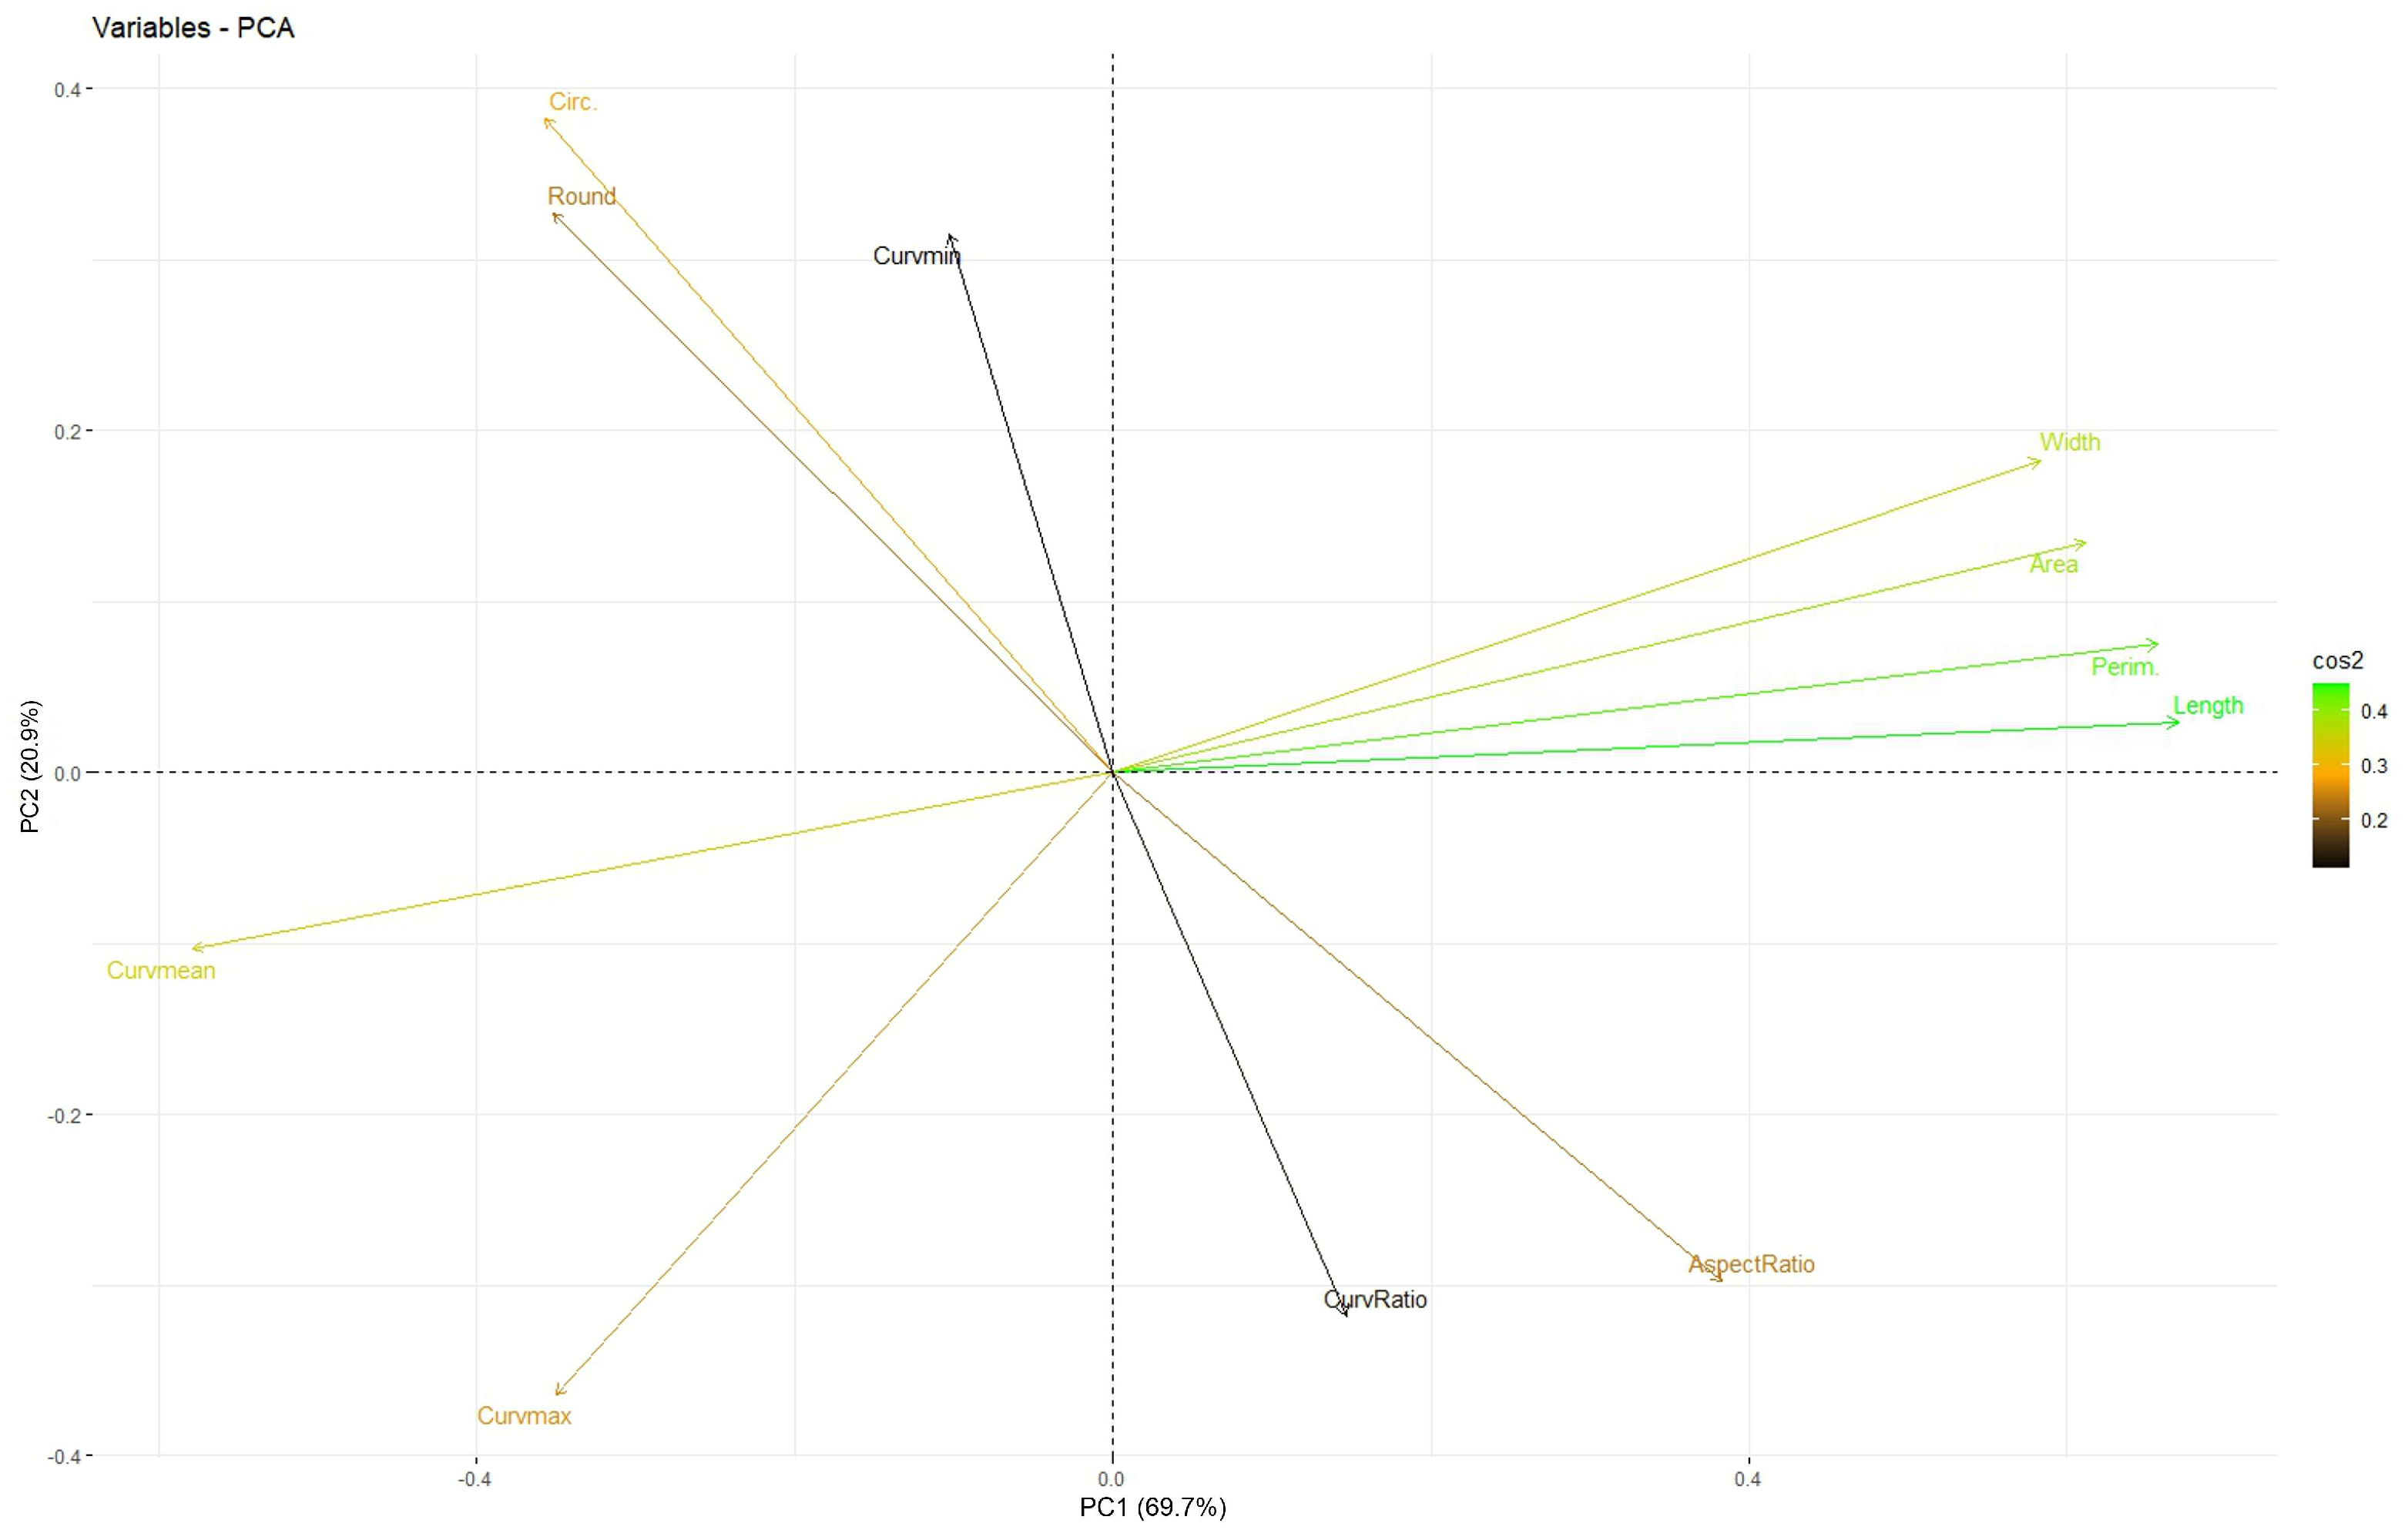
3.1. Factorial Analysis

Factorial analysis by using PCA attributed 83.9% of the variation to three principal components (Table 2). In the first component, perimeter is related to width, area and length, and inversely related to mean curvature (PC1 was called Size). In the second component, roundness and circularity are inversely related to the aspect ratio (PC2 was called Roundness). In the third component, the minimum curvature is inversely related to the curvature ratio and maximum curvature (PC3 was called Curvature ratio). The factors resulting from the PCA were used for the comparisons between tribes and genera.

3.2. Differences Between Tribes and Genera

The Kruskal–Wallis test showed differences between the tribes (Table 3) for the three principal components. The Elsholtzieae had a greater size and roundness than the other two tribes, and the Ocimeae had a greater size and lower roundness and minimum curvature than the Mentheae.
The Kruskal–Wallis test also showed differences between genera (Table 4). The smallest seeds were those of Mentha (0.58 to 0.77 mm length). The largest were those of Perilla and Salvia (1.71 to 2.04 mm for Perilla and 1.94 to 3.04 mm for Salvia). For the remaining genus, the length of the seeds was between 0.87 and 1.03 mm (Clinopodium), 0.80 and 2.72 (Lavandula), 1.56 and 1.81 (Marsipianthes), 1.28 and 2.53 (Ocimum), 0.81 and 0.88 mm (Origanum) and 0.55 and 1.05 mm (Thymus). The roundness was lowest in Lavandula and highest in Perilla. Differences in the minimum curvature were also found between genera, with the lowest values in Marsypianthes and the highest in Salvia.

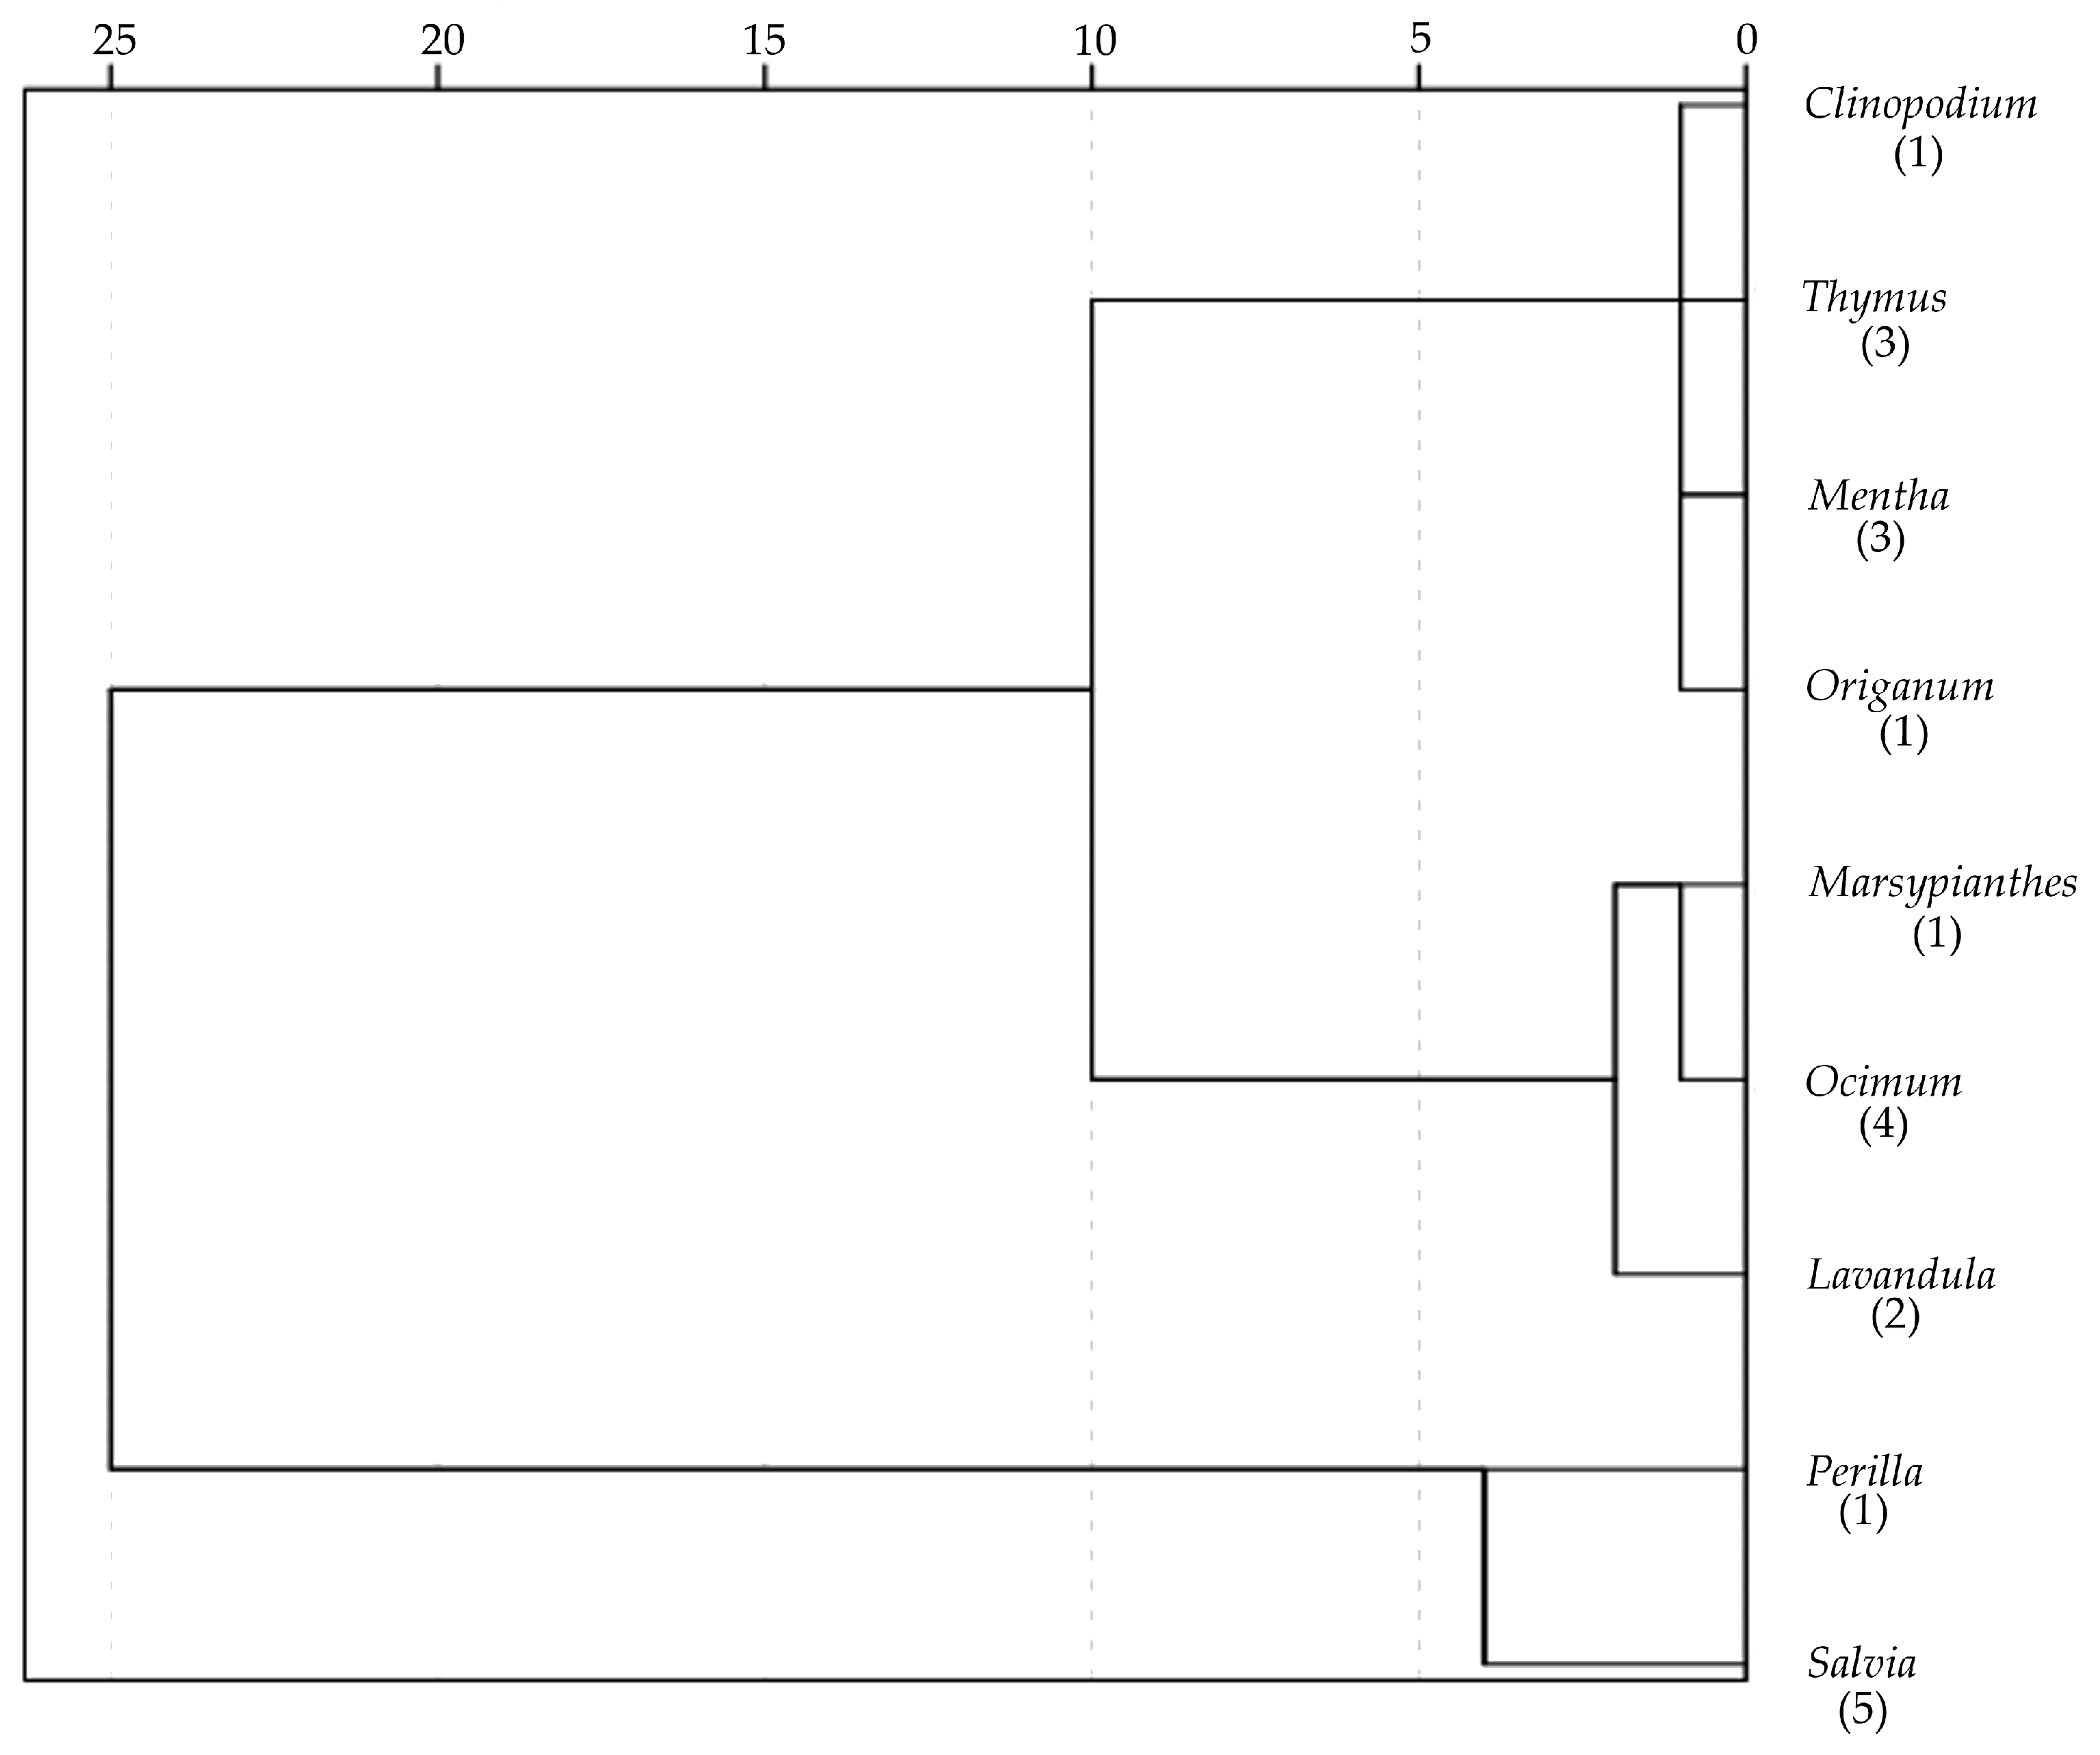
3.3. Hierarchical Clustering

Hierarchical clustering was carried out using general morphological measurements and revealed the association of genera in three groups: The first group contains the genera with small seeds (Clinopodium, Thymus, Mentha and Origanum), a second group with intermediate seeds (Marsypianthes, Ocimum, Lavandula) and an outer group with the larger seeds (Perilla and Salvia; Figure 4). The dendrogram is thus mainly defined by seed size.

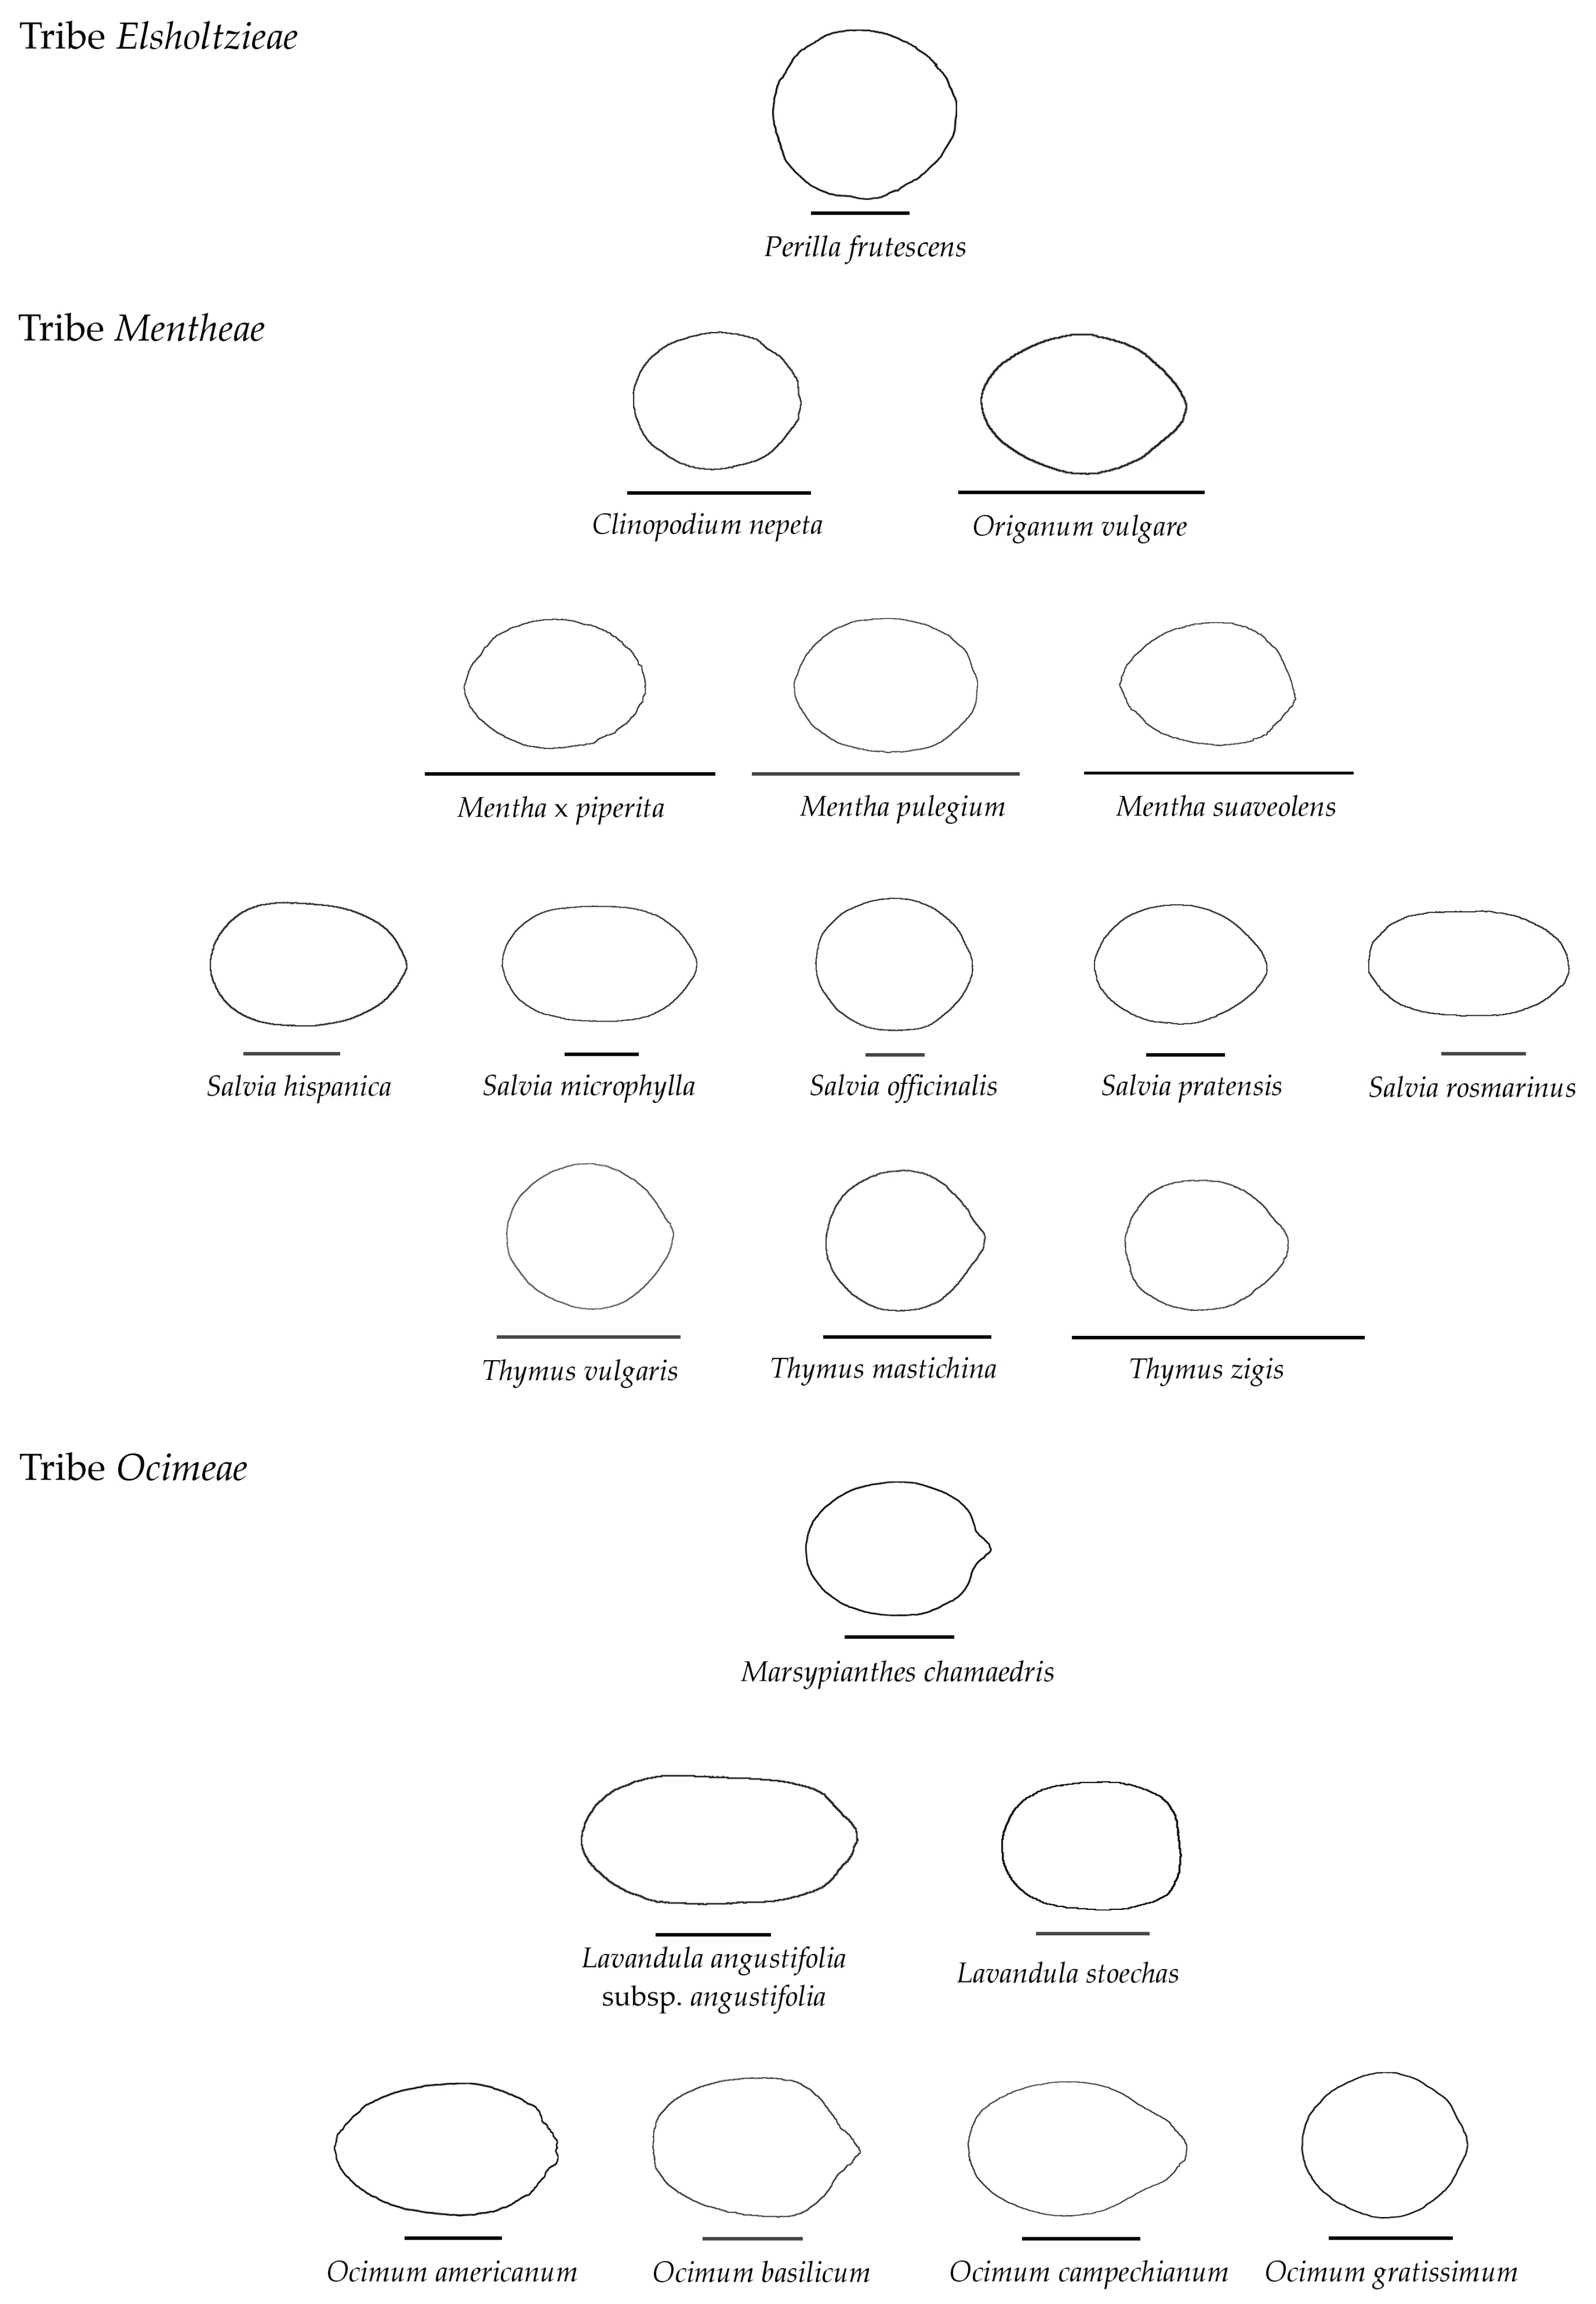
3.4. Average Contours

The average contours resulting from 20 seeds of each of 21 species are shown in Figure 5.

3.5. Differences in Shape Among the Species of Five Genera

The following sections compare the seed shape between species in the genera Mentha, Salvia, Thymus, Lavandula and Ocimum. For each genus, four general measures (area, circularity, aspect ratio, solidity) and four measures related to curvature (maximum, minimum, mean and ratio of maximum to mean curvature) were compared between species.

3.5.1. Tribe Mentheae: Mentha

The seeds of M. pulegium were larger and had a higher solidity than those of M. × piperita and M. suaveolens. Correspondingly, they had lower mean and maximum curvature values (Table 5, Figure 6). The differences between these two species consisted of higher area, lower circularity, higher solidity and higher minimum curvature (abs. value) for M. suaveolens (Table 5), due to a non-convexity region around the hilum (Figure 6).
Differences in the J-index were found between these three species when comparing the percentage of similarity of their seed images with the models (average contours) of each species (Table 6). The analysis with each of the three models showed differences between the species: the model of M. piperita showed the differences between M. piperita and M. suaveolens, the model of M. pulegium showed the differences between M. suaveolens and the other two species and the model of M. suaveolens showed the differences between M. pulegium and M. suaveolens.

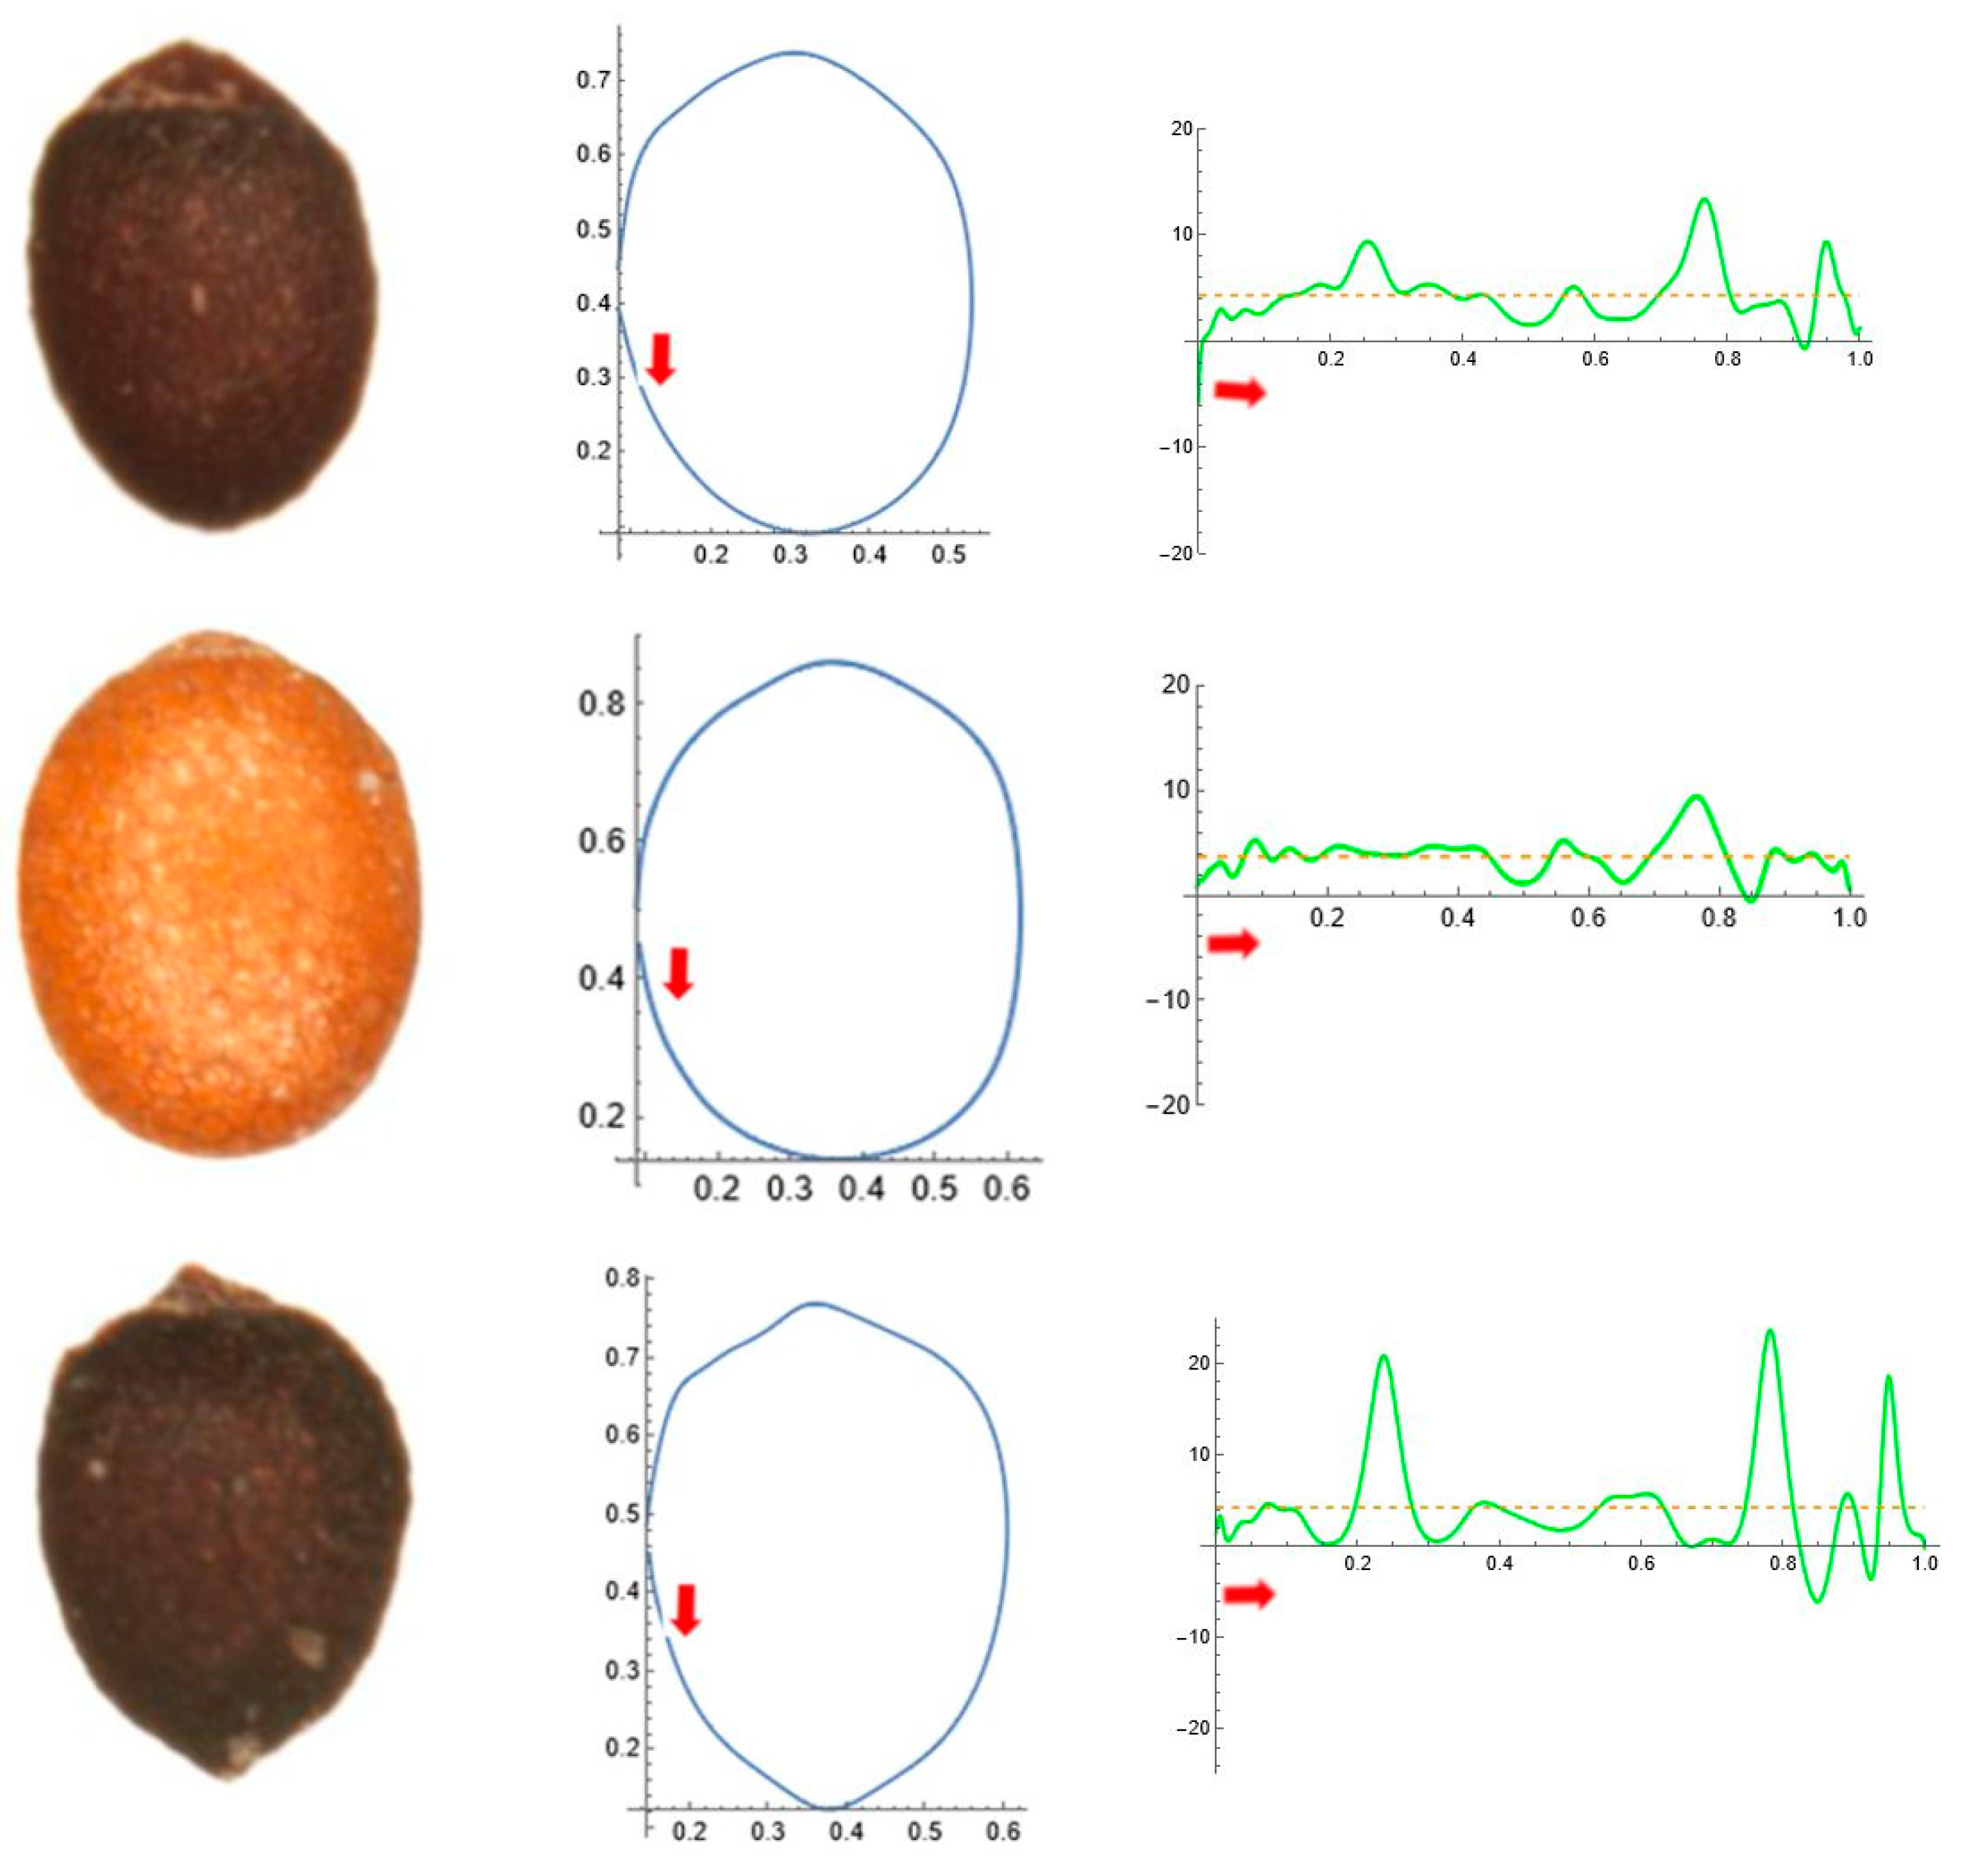
3.5.2. Tribe Mentheae: Salvia

The seeds of S. hispanica were characterised by their smaller size (Table 7, Figure 7). They also had a lower solidity than S. microphylla and S. officinalis, but higher than S. pratensis and S. rosmarinus. S. officinalis had larger seeds and a lower mean curvature than S. microphylla.
The seeds of S. pratensis and S. rosmarinus had a lower solidity than those of the other three species (Table 7). The seeds of S. pratensis had a higher circularity than those of S. rosmarinus (Table 7, Figure 8).

3.5.3. Tribe Mentheae: Thymus

The seeds of T. zygis were smaller and had a higher aspect ratio and mean curvature than those of T. mastichina or T. vulgaris (Table 8, Figure 9). T. mastichina had lower minimum curvature values than T. vulgaris, with negative values corresponding to non-convex regions on the seed surface. The ratio of maximum to mean curvature was higher in T. mastichina than in T. vulgaris.
Differences between these three species were also found in the J-index by comparing the percentage of similarity of their seed images with the models based on the average contours of each species (Table 9). The two models based on the average contours of T. mastichina and T. vulgaris showed differences between the three species, while the model of T. zygis showed differences between T. zygis and the other two species.

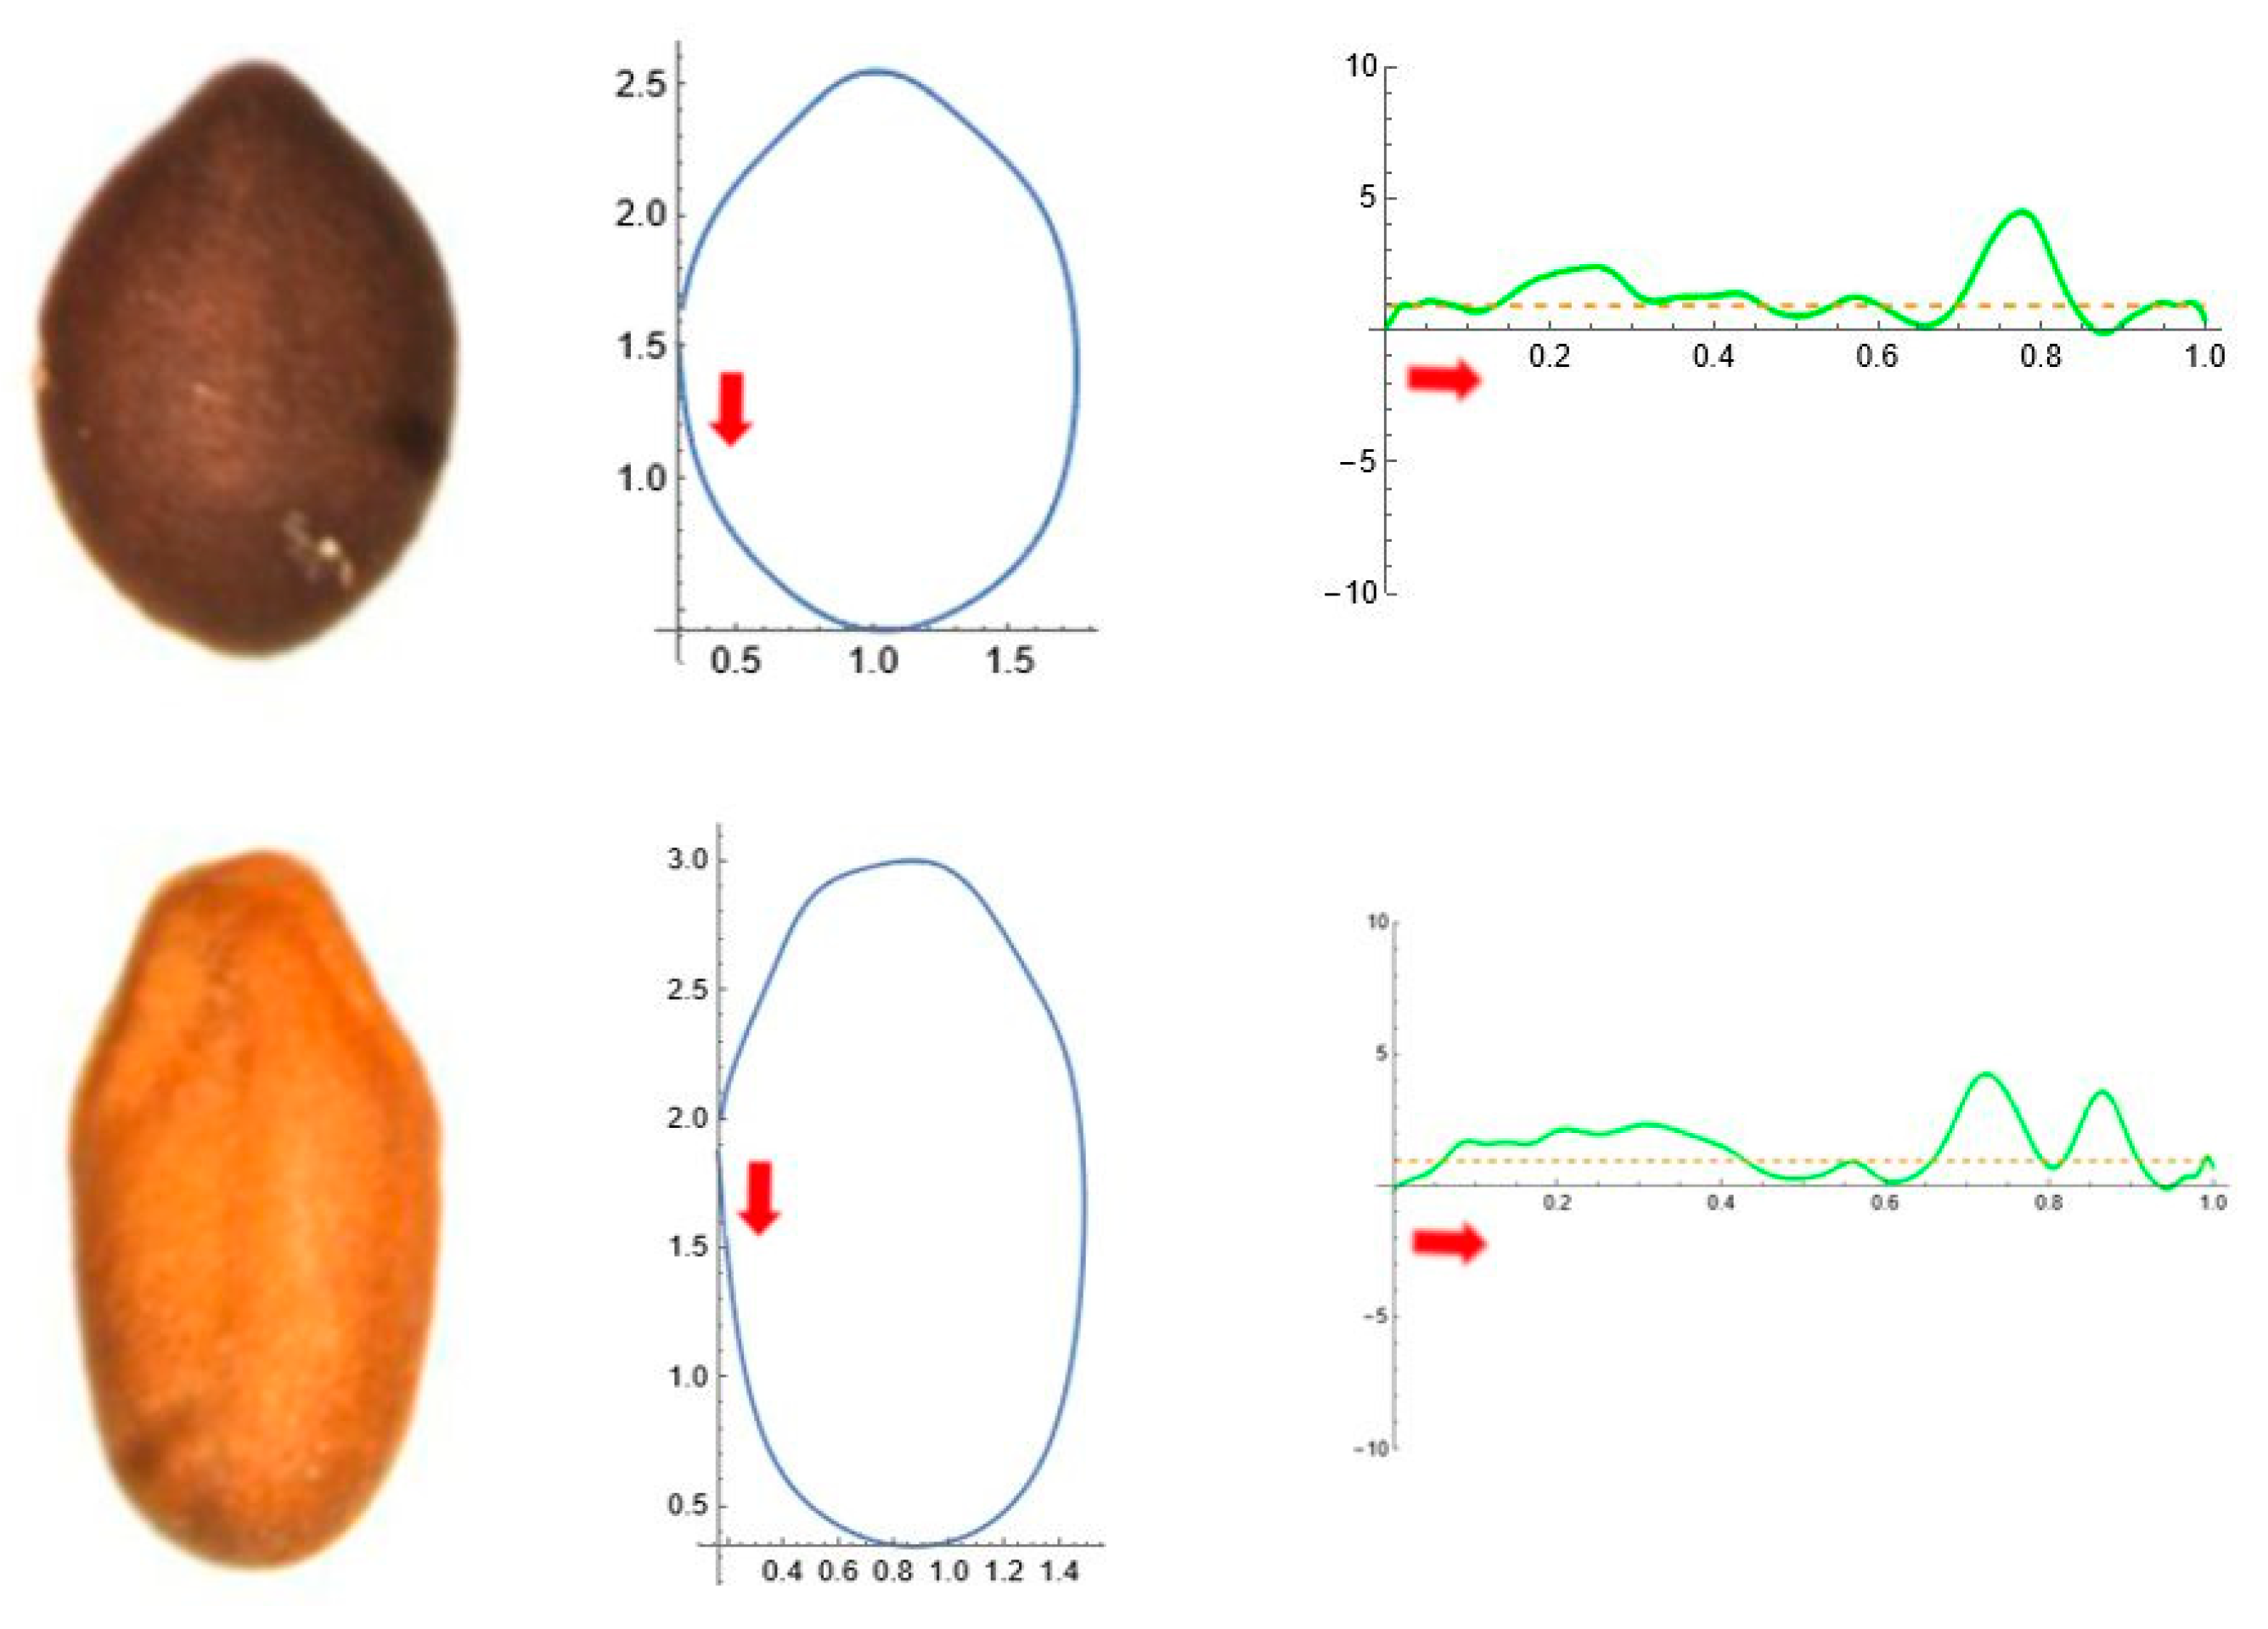
3.5.4. Tribe Ocimeae: Lavandula

The seeds of L. angustifolia had a higher area and aspect ratio and lower circularity, maximum curvature and mean curvature than L. stoechas. L. stoechas had negative mean values of minimum curvature, lower than L. angustifolia (Table 10, Figure 10).

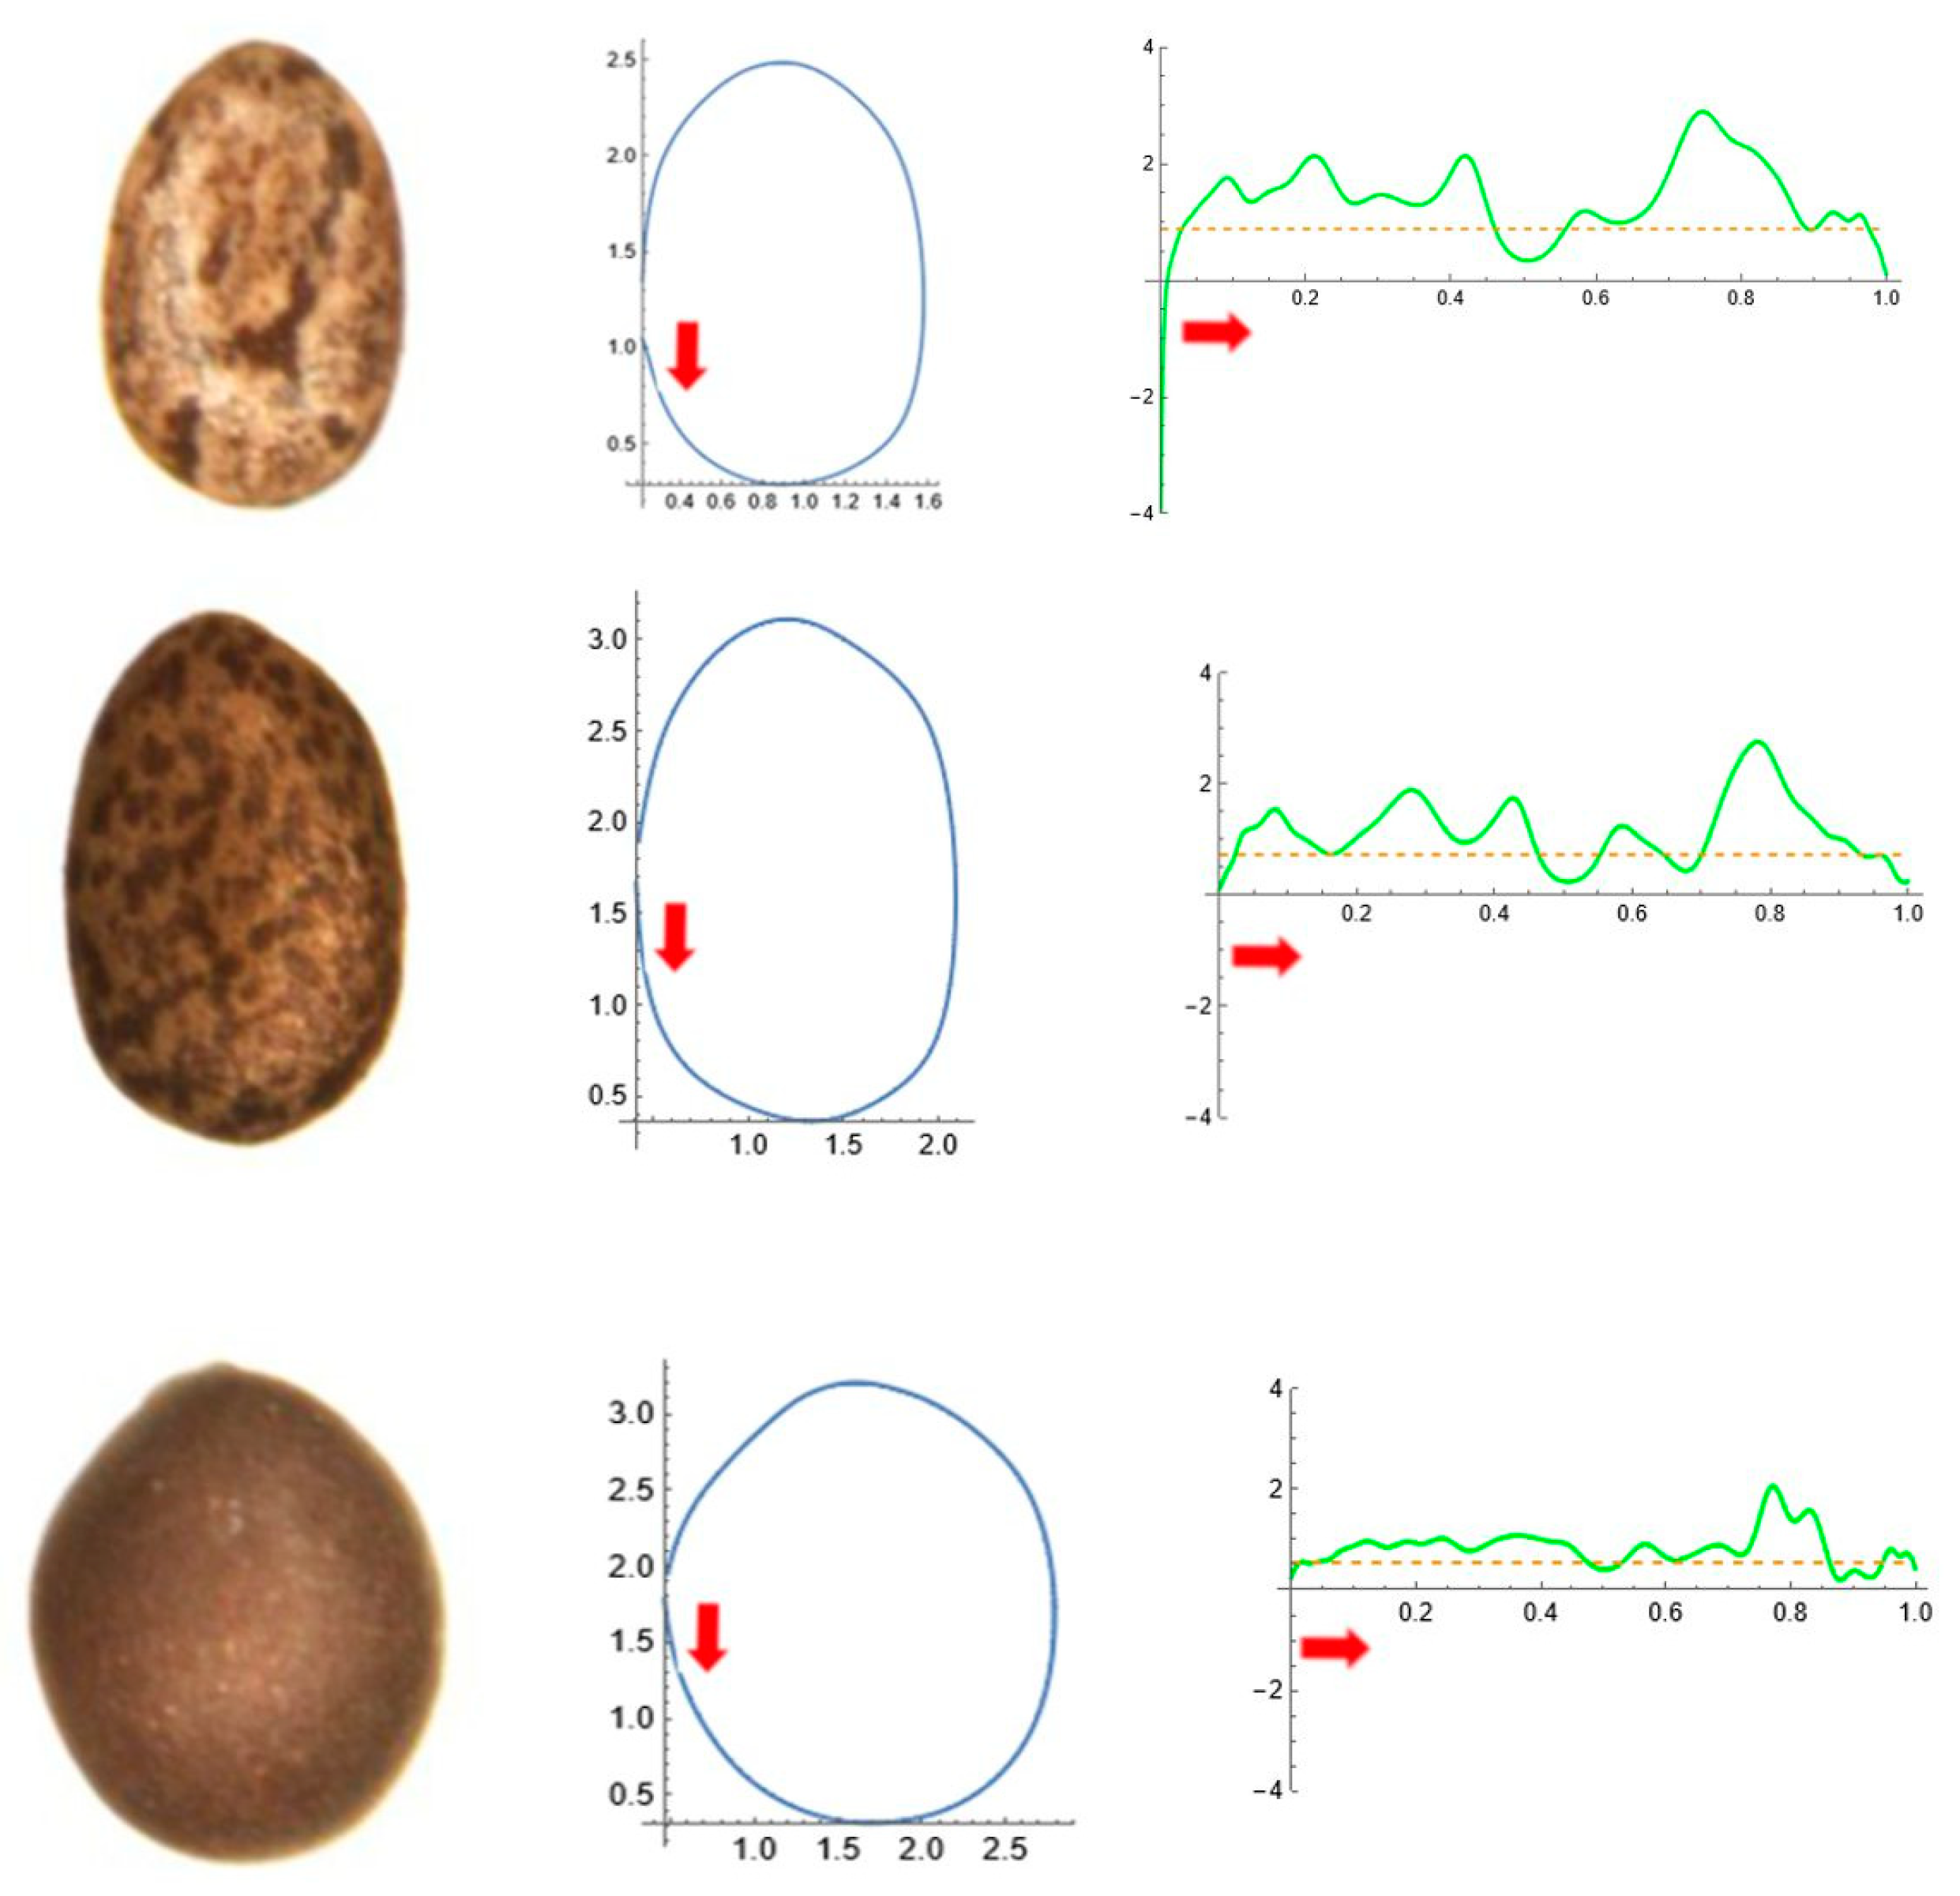
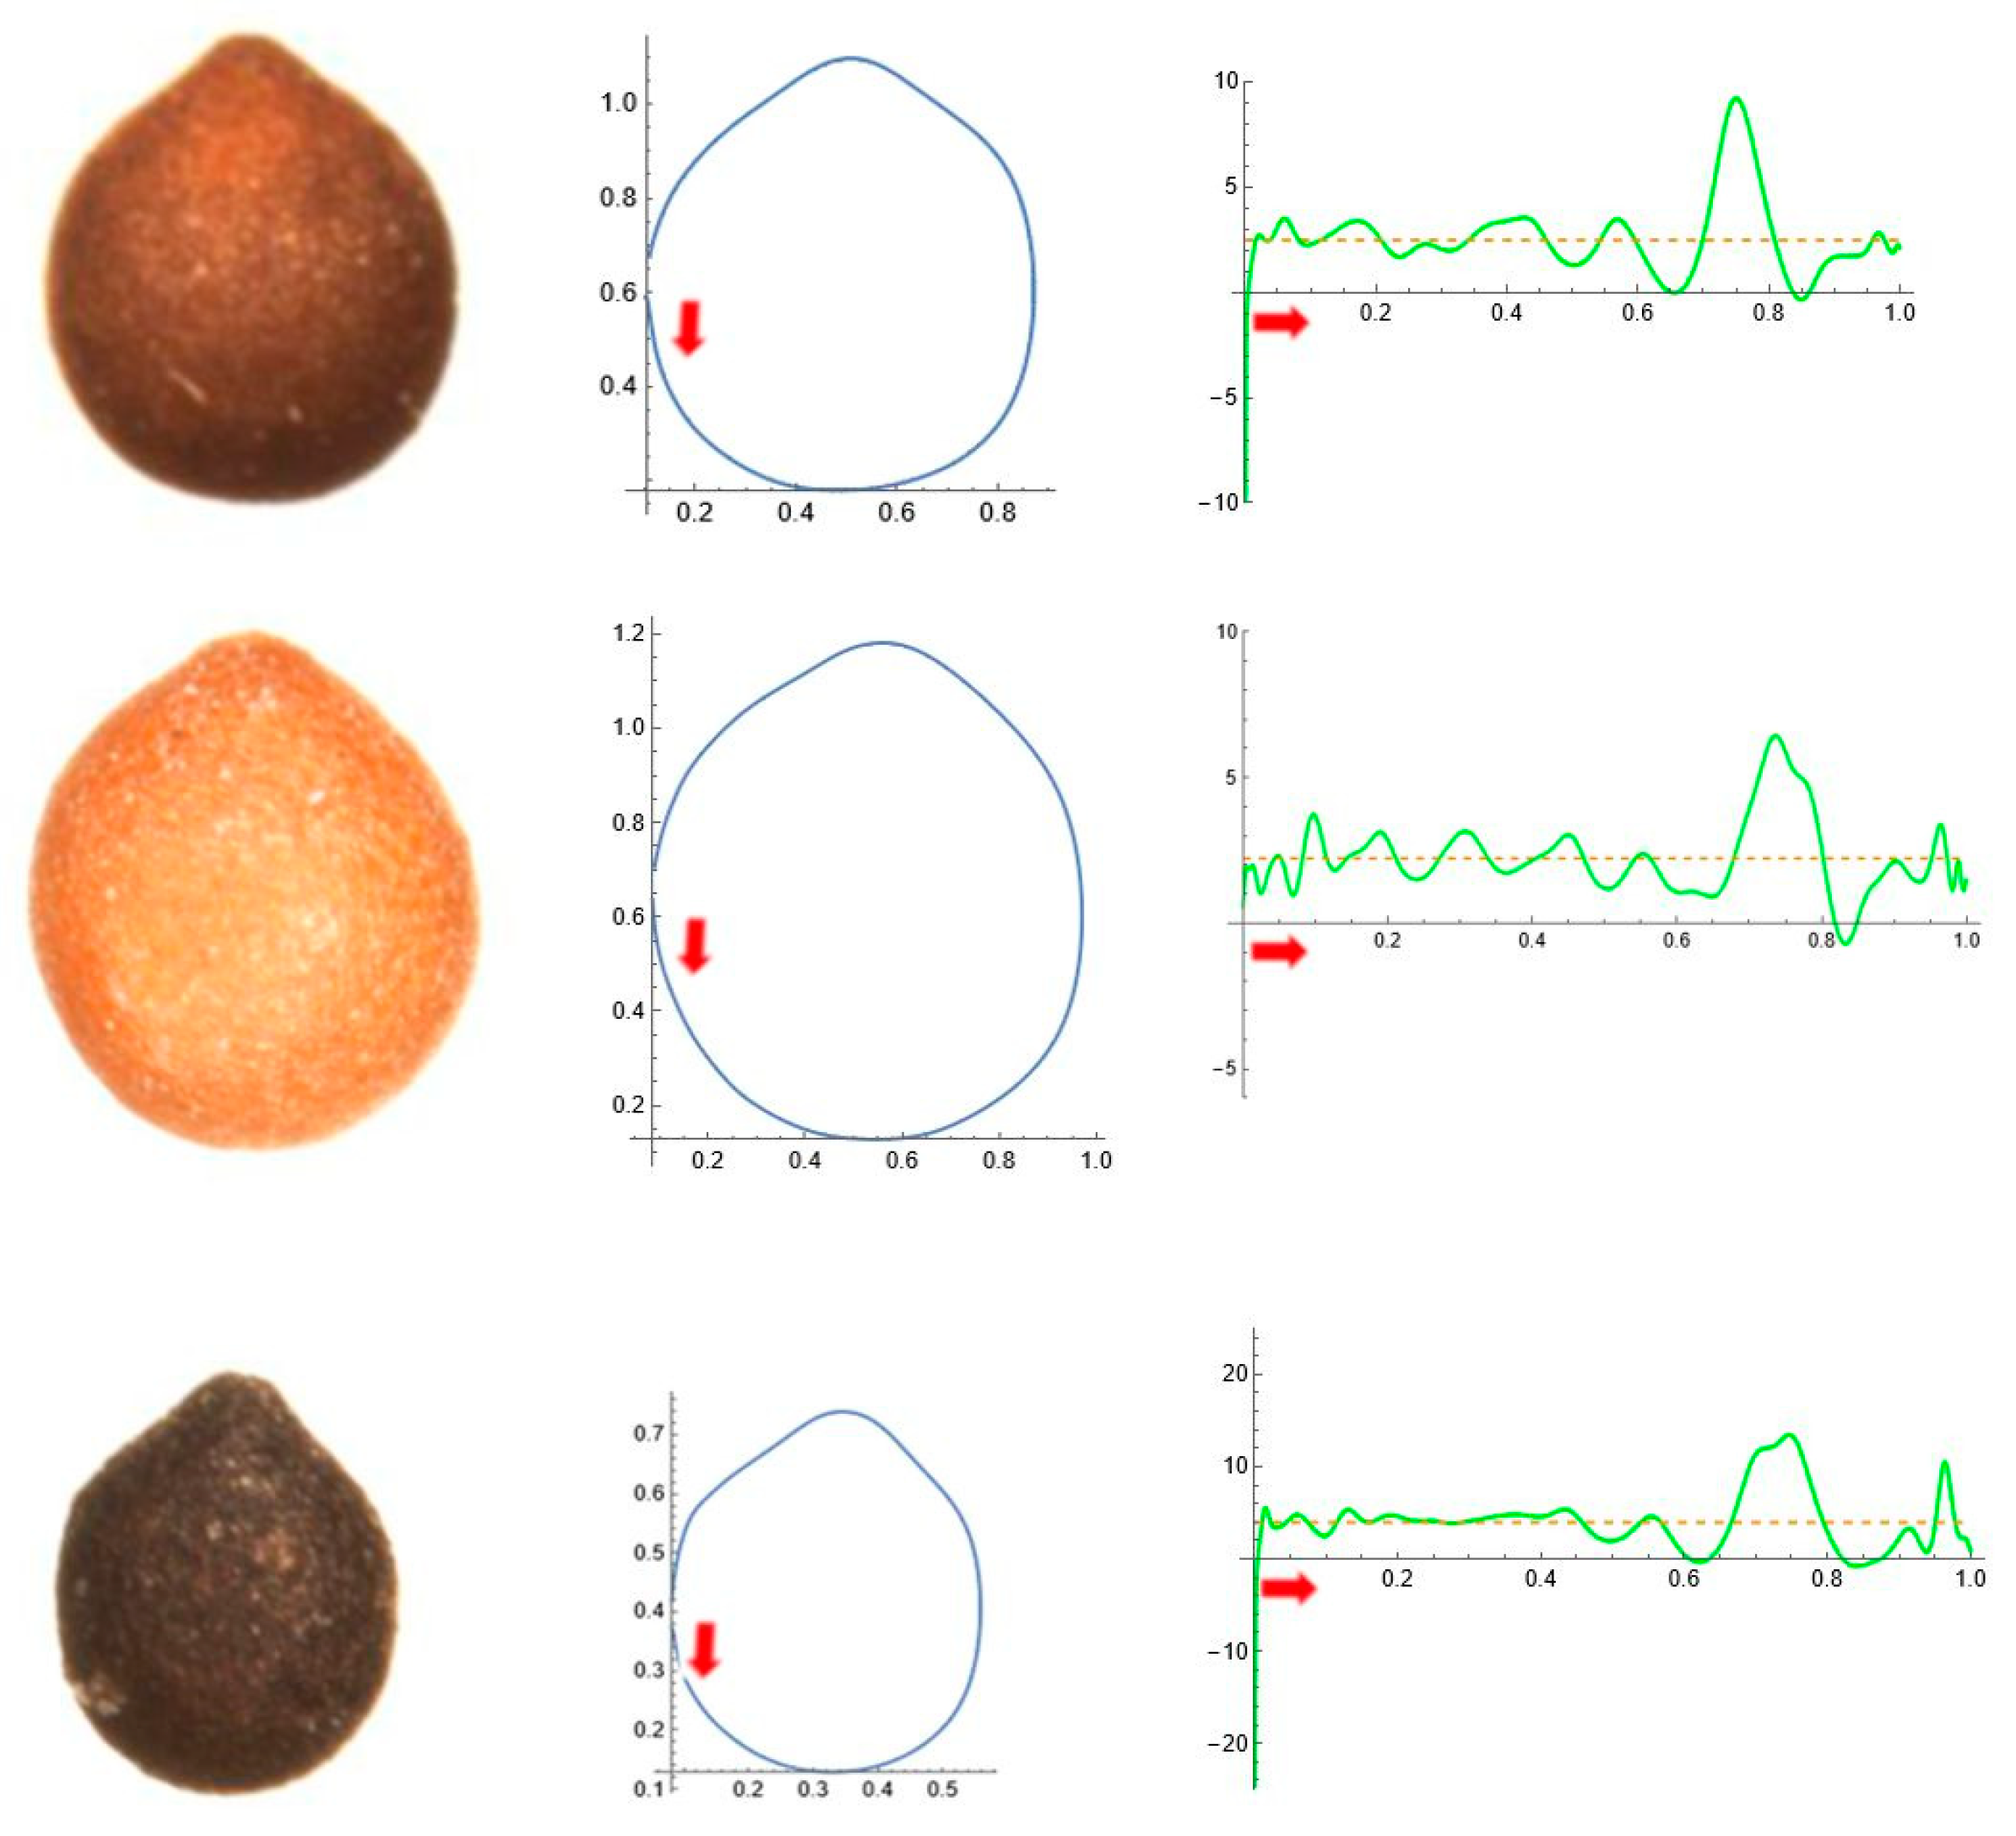
3.5.5. Tribe Ocimeae: Ocimum

There were differences between the Ocimum species. O. americanum had the highest area values, followed by O. basilicum, O. campechianum and O. gratissiumum (Table 11, Figure 11). The values of circularity followed an inverse order, being higher in O. gratissiumum and lower in O. americanum. The maximum curvature values were higher in O. americanum and O. basilicum than in the other two species. The mean curvature values were higher in O. basilicum, lower in O. americanum and intermediate in the other two species.
The minimum curvature values were negative for all four species, indicating non-convex regions in their seed contours. Higher absolute values were observed in O. americanum, lower in O. campechianum and intermediate in the other two species.
Differences between the four species were also found in the J-index, comparing the percentage of similarity of their seed images with the average contours of the models for each species (Table 12). Interestingly, three of the four models showed differences between the four species, demonstrating the usefulness of this method in analysing morphological differences.

4. Discussion

The seed morphology of Lamiaceae species has received some attention in the scientific literature. The published work is generally based on geographical regions and focuses on specific genera [15,16,17,18,19,20,21,22,23], and often seed morphological data were considered of taxonomic value for species’ description and classification [28,29,30,31,32,33,34,35]. The work presented here includes a morphological analysis of seeds for nine genera of the subfam. Nepetoideae, represented by one to five species, and representing all its tribes. The species studied belong to the tribes Elsholtzieae (Perilla frutescens), Mentheae (Clinopodium nepeta, Mentha × piperita, M. pulegium, M. suaveolens, Origanum vulgare, Salvia hispanica, S. microphylla, S. officinalis, S. pratensis, S. rosmarinus, Thymus mastichina, T. vulgaris, T. zygis) and Ocimeae (Lavandula angustifolia subsp. angustifolia, L. stoechas, Marsypianthes chamaedris, Ocimum americanum, O. basilicum, O. campechianum, O. gratissimum).
Factorial analysis attributed the variation to three main factors: one was related to the area and inversely related to the mean curvature values, a second was related to roundness and circularity and inversely related to the aspect ratio, and a third was related to the minimum curvature and inversely related to the curvature ratio and maximum curvature. The differences in shape observed between the tribes and genera are associated with the differences in these three factors. Thus, hierarchical clustering based on general morphological measurements resulted in a division corresponding to differences in seed size (the main component of the factorial analysis), with smaller seeds in Mentheae, intermediate in Ocimeae and larger in Elsholtzieae. The grouping of genera resulting from the analysis is consistent with tribes according to the current taxonomy [4,9], with the sole exception of Salvia, which is located outside Mentheae and with Perilla, which belongs to Elsholtzieae. The seed size can vary significantly within these plant tribes due to ecological adaptations and dispersal mechanisms. The seeds of the species of Mentha and Thymus, which predominate in the Mentheae in this work, are adapted to different environments, humid in the case of Mentha and dry for Thymus, but are generally small and lack endosperm, consistent with dispersal mainly by water, wind or gravity. The branches corresponding to Escholtzieae (Perilla) and Salvia are less represented, especially the latter considering the complexity of this genus [44,45]. The analysis of the seed shape in the species of the Malvaceae and in Rhus tripartita (Ucria) Grande (Anacardiaceae) revealed a relationship between the J-index, seed shape and size with life forms [46,47]. In the other families studied, i.e., Euphorbiaceae [48], there was a tendency to observe larger seeds in ancient taxa, but not such a clear relationship between the seed size and taxonomic position, so it will be interesting to analyse other genera and tribes in Lamiaceae to confirm if these differences in size and shape between tribes and genera are due to their evolutionary history or associated with other attributes such as their life habit.
When comparing the seed shape between the species within each genus, differences were often based on the general morphological measurements, such as in the area between the species of Mentha, Salvia or Thymus in the Mentheae, or between L. angustifolia and L. stoechas, or between all four Ocimum species analysed in the Ocimeae. Differences between species were also found in the curvature analysis as well as in the morphological analysis based on the J-index. Thus, the combination of general morphological measurements via the curvature analysis and the percentage of similarity of the general shape with specific models offers a promising approach to identify the peculiarities of seed shape in a larger number of species.
In contrast to the seed morphology, where studies have focused on a reduced number of species, phylogenetic analyses based on DNA sequence data in this tribe have focused on many taxa. For example, in their analysis based on ITS sequences (rDNA), Katsiotis et al. used 32 different entries belonging to seven Origanum species, demonstrating monophyly between all Origanum entries, as well as a distinction between Greek and Spanish entries [49]. Similarly, in their comprehensive phylogeny of the subtribe Menthinae, Bräuchler et al. used 278 accessions representing 38 of the 40 genera in the subtribe and 11 outgroup genera in their analysis of sequence data from two plastid regions (trnL-F and trnK) and a nuclear ribosomal DNA region (ITS) [50]. The work of Li et al. involved 70 accessions from 59 taxa in the phylogeny of Elsholtzieae based on two nuclear (ETS, ITS) and five chloroplast (rbcL, matK, trnL-F, ycf1, ycf1-rps15) fragments [51]. Other phylogenetic analyses are based on chemical components in Sage [52,53,54].
Sequencing projects have opened new avenues for population and phylogenetic studies. In the Lamiaceae, numerous chloroplast genomes have been published, such as those of Salvia miltiorrhiza Bunge [55], Phlomis fruticosa L. and Phlomoides strigosa (C.Y.Wu) Kamelin and Makhm [56], S. plebeia R.Br. and other Salvia species [57,58,59,60]. Genome sequencing analysis has also contributed to the understanding of the chemodiversity in Lamiaceae [61]. Seed morphological analysis can provide data that contribute to the evolutionary history of this diverse and cosmopolitan family.

5. Conclusions

Differences in size and shape were found between the tribes, genera and species of subfam. Nepetoideae. Cluster analysis based on morphological measurements showed a distribution of genera according to their tribe, with the sole exception of Salvia. Differences between the species included those in the J-index and curvature analysis. The quantification of the seed shape with specific geometric models and the comparison of the J-index between species are proposed here as a new technique in the taxonomy of Lamiaceae. The combination of traditional morphometric measurements with the J-index and curvature analysis contributes to the description of the seed shape and its application in the taxonomy of this family.

Supplementary Materials

Figure S1: Supplementary Images for “Analysis of seed geometry in the Nepetoideae (Lamiaceae)”, contains images with 20 seeds (300 ppi) for each species can be downloaded at: https://zenodo.org/records/14654418 (Accessed on 15 January 2025); Figure S2: Mathematica files with curvature analysis are available at: https://zenodo.org/records/14654541 (Accessed on 15 January 2025).

Author Contributions

Conceptualization, D.G.d.P. and E.C.; data curation, D.G.d.P., J.J.M.-G. and E.C.; formal analysis, D.G.d.P., J.J.M.-G., N.I.R.T., Á.T. and E.C.; investigation, D.G.d.P., J.J.M.-G., N.I.R.T., Á.T. and E.C.; methodology, D.G.d.P., J.J.M.-G., Á.T. and E.C.; project administration, Á.T. and E.C.; resources, D.G.d.P., J.J.M.-G., N.I.R.T., Á.T. and E.C.; software, D.G.d.P., J.J.M.-G., Á.T. and E.C.; supervision, D.G.d.P., Á.T. and E.C.; validation, D.G.d.P., J.J.M.-G., N.I.R.T., Á.T. and E.C.; visualization, D.G.d.P., J.J.M.-G., N.I.R.T., Á.T. and E.C.; writing—original draft, D.G.d.P. and E.C.; Writing—review and editing, D.G.d.P., J.J.M.-G., N.I.R.T., Á.T. and E.C. All authors have read and agreed to the published version of the manuscript.

Funding

This research received no external funding.

Data Availability Statement

The original contributions presented in the study are included in the article/Supplementary Material, further inquiries can be directed to the corresponding author/s.

Acknowledgments

We appreciate the support and growing contribution during these years with many of the species used in this work collected in Villanueva de Gómez (Ávila, Spain), Felipe Gutiérrez, María del Pozo and Mónica Gutiérrez.

Conflicts of Interest

The authors declare no conflicts of interest.

References

  1. Judd, W.S.; Campbell, C.S.; Kellogg, E.A.; Stevens, P.F.; Donoghue, M.J. Plant Systematics: A Phylogenetic Approach; Sinauer Associates, Inc.: Sunderland, MA, USA, 2016. [Google Scholar]
  2. Berry, P.E. “Lamiales”. Encyclopedia Britannica. Available online: https://www.britannica.com/plant/Lamiales/Main-families (accessed on 20 August 2024).
  3. Islam, M.; Gottlieb, A.; Maher, M.; Scher, J.; Redford, A. Lamiaceae. Available online: https://www.idtools.org/tools/1060/index.cfm?packageID=2246&entityID=57903 (accessed on 19 November 2024).
  4. Zhao, F.; Chen, Y.-P.; Salmaki, Y.; Drew, B.T.; Wilson, T.C.; Scheen, A.-C.; Celep, F.; Bräuchler, C.; Bendiksby, M.; Wang, Q.; et al. An updated tribal classification of Lamiaceae based on plastome phylogenomics. BMC Biol. 2021, 19, 2. [Google Scholar] [CrossRef] [PubMed]
  5. Erdtman, G. Pollen morphology and plant taxonomy. IV. Labiatae, Verbenaceae and Avicenniaceae. Sven. Bot. Tidskr. 1945, 39, 279–285. [Google Scholar]
  6. Harley, R.M.; Atkins, S.; Budantsev, A.; Cantino, P.D.; Conn, B.J.; Grayer, R.; de Kok, R.; Krestovskaja, T.; Morales, R.; Paton, A.J.; et al. Labiatae. In The Families and Genera of Vascular Plants; Kubitzki, K., Ed.; Springer: Berlin/Heidelberg, Germany, 2004; Volume 7, pp. 167–275. [Google Scholar]
  7. Stevens, P.F. Angiosperm Phylogeny Website. Version 14, July 2017 [and More or Less Continuously Updated Since].” Will Do. 2001 Onwards. Available online: http://www.mobot.org/MOBOT/research/APweb/ (accessed on 20 December 2024).
  8. Paton, A.J.; Springate, D.; Suddee, S.; Otieno, D.; Grayer, R.J.; Harley, M.M.; Willis, F.; Simmonds, M.S.; Powell, M.P.; Savolainen, V. Phylogeny and evolution of basils and allies (Ocimeae, Labiatae) based on three plastid DNA regions. Mol. Phylogenet. Evol. 2004, 31, 277–299. [Google Scholar] [CrossRef] [PubMed]
  9. Wang, Y.; Wu, X.; Chen, Y.; Xu, C.; Wang, Y.; Wang, Q. Phylogenomic analyses revealed widely occurring hybridization events across Elsholtzieae (Lamiaceae). Mol. Phylogenet. Evol. 2024, 198, 108112. [Google Scholar] [CrossRef]
  10. Marcinek, K.; Krejpcio, Z. Chia seeds (Salvia hispanica): Health promoting properties and therapeutic applications—A review. Rocz. Panstw. Zakl. Hig. 2017, 68, 123–129. [Google Scholar]
  11. Kulczyński, B.; Kobus-Cisowska, J.; Taczanowski, M.; Kmiecik, D.; Gramza-Michałowska, A. The Chemical Composition and Nutritional Value of Chia Seeds-Current State of Knowledge. Nutrients 2019, 11, 1242. [Google Scholar] [CrossRef]
  12. Melo, D.; Machado, T.B.; Oliveira, M.B.P.P. Chia seeds: An ancient grain trending in modern human diets. Food Funct. 2019, 10, 3068–3089. [Google Scholar] [CrossRef]
  13. Xia, Y.; Zhang, L.; Hong, X.; Huang, Y.; Lou, G.; Hou, Z.; Abozeid, A.; Wei, Y.; Yang, D. Metabolomic and antioxidant analyses of Salvia miltiorrhiza Bunge and Salvia prattii Hemsl. seeds. Nat. Prod. Res. 2024, 38, 3909–3916. [Google Scholar] [CrossRef]
  14. Habtemariam, S. Molecular pharmacology of Rosmarinic and Salvianolic acids: Potential seeds for Alzheimer’s and vascular dementia drugs. Int. J. Mol. Sci. 2018, 19, 458. [Google Scholar] [CrossRef]
  15. Kasem, W.T. Pollen grains and seed-morphology as related to biochemical patterns in five species of genus Ocimum L (Lamiaceae Juss.) of Saudi Arabia. J. Phytol. 2017, 8, 42–48. [Google Scholar] [CrossRef]
  16. Khali, K.A. Seed morphology and surface microstructure of the genus Plectranthus L. (Lamiaceae) in Arabian Peninsula highlighting on their systematic implications. Aust. J. Crop Sci. 2016, 10, 1222–1231. [Google Scholar] [CrossRef]
  17. Ozkan, M.; Soy, E. Morphology, Anatomy, Hair and Karyotype Structure of Salvia blepharoclaena Hedge and Hub.-Mor. (Lamiaceae), Endemic to Turkey. Pak. J. Biol. Sci 2007, 10, 893–898. [Google Scholar] [CrossRef]
  18. Akgül, G.; Ketenoğlu, O.; Pınar, N.M.; Kurt, L. Pollen and seed morphology of the genus Marrubium (Lamiaceae) in Turkey. Ann. Bot. Fenn. 2008, 45, 1–10. [Google Scholar] [CrossRef]
  19. Sudrarmono Seed Micromorphology of Orthosiphon spp. and Its Relatives (Lamiaceae). In Advances in Biological Sciences Research, Proceedings of the 3rd KOBI Congress, International and National Conferences (KOBICINC 2020), Online, 24–25 November 2020; Atlantis Press: Dordrecht, The Netherlands, 2021; Volume 14, pp. 215–219. [CrossRef]
  20. Mousavi, S.; Jafari, A.; Najafi, S. Nutlet micromorphological study on Salvia L. (Lamiaceae) from NE Iran. Am. J. Plant Sci. 2013, 4, 1457–1460. [Google Scholar] [CrossRef]
  21. Kılıç, M.; Mungan Kılıç, F. Nutlet micromorphology of Mardin in Turkey Salvia L. (Lamiaceae) and its systematic implications. Nordic J. Bot. 2021, 39. [Google Scholar] [CrossRef]
  22. Lane, T.M. Mericarp micromorphology of great plains Scutellaria (Labiatae). Southw. Nat. 1983, 28, 71–79. [Google Scholar] [CrossRef]
  23. Rodideal, T.; Frunzete, M.E.; Olaru, S.M.; Grigore, M.N.; Zamfirache, M.M.; Ivănescu, L.C. Comparative analysis of seed morphology in genus Scutellaria L. Not. Bot. Horti Agrobot. 2024, 52, 14088. [Google Scholar] [CrossRef]
  24. Cervantes, E.; Martín, J.J.; Ardanuy, R.; De Diego, J.G.; Tocino, Á. Modeling the Arabidopsis seed shape by a cardioid: Efficacy of the adjustment with a scale change with factor equal to the Golden Ratio and analysis of seed shape in ethylene mutants. J. Plant Physiol. 2010, 167, 408–410. [Google Scholar] [CrossRef]
  25. Cervantes, E.; Martín, J.J.; Chan, P.K.; Gresshoff, P.M.; Tocino, Á. Seed shape in model legumes: Approximation by a cardioid reveals differences in ethylene insensitive mutants of Lotus japonicus and Medicago truncatula. J. Plant Physiol. 2012, 169, 1359–1365. [Google Scholar] [CrossRef]
  26. Cervantes, E.; Tocino, A. Geometric analysis of Arabidopsis root apex reveals a new aspect of the ethylene signal transduction pathway in development. J. Plant Physiol. 2005, 162, 1038–1045. [Google Scholar] [CrossRef]
  27. Noriega, A.; Tocino, A.; Cervantes, E. Hydrogen peroxide treatment results in reduced curvature values in the Arabidopsis root apex. J. Plant Physiol. 2009, 166, 554–558. [Google Scholar] [CrossRef] [PubMed]
  28. Hedge, I.C. A revision of Salvia in Africa and Arabia. Notes Roy. Bot. Gard. Edinburgh 1974, 33, 1–121. [Google Scholar]
  29. Drew, B.T.; Sytsma, K.J. Phylogenetics, biogeography, and staminal evolution in the tribe Mentheae (Lamiaceae). Am. J. Bot. 2012, 99, 933–953. [Google Scholar] [CrossRef]
  30. Walker, J.B.; Sytsma, K.J. Staminal evolution in the genus Salvia (Lamiaceae): Molecular phylogenetic evidence for multiple origins of the staminal lever. Ann. Bot. 2007, 100, 375–391. [Google Scholar] [CrossRef]
  31. Celep, F.; Kahraman, A.; Atalay, Z.; Doğan, M. Seed morphology of some Salvia species (Lamiaceae) from Turkey and its systematic importance. Plant Syst. Evol. 2014, 300, 1179–1190. [Google Scholar]
  32. Kriebel, R.; Drew, B.T.; Drummond, C.P.; Gonzalez-Gallegos, J.G.; Celep, F.; Mahdjoub, M.M.; Rose, J.P.; Xiang, C.L.; Hu, G.X.; Walker, J.B.; et al. New World Salvia: Phylogeny, taxonomy, and biogeography. Syst. Bot. 2019, 44, 829–865. [Google Scholar]
  33. Kahraman, A.; Büyükkartal, H.N.; Doğan, M. Pericarp Ultrastructure of Salvia Section Hemisphace (Mentheae; Nepetoideae; Lamiaceae). Commagene J. Biol. 2018, 2, 1–7. [Google Scholar] [CrossRef]
  34. Pădure, I.M. Nepeta (Lamiaceae) morphology and anatomy in Romania and their taxonomic significance. In Proceedings of the Plant, Fungal and Habitat Diversity Investigation and Conservation, Proceedings of IV BBC, Sofia, Bulgaria, 20–26 June 2006; pp. 34–38. [Google Scholar]
  35. Kaya, A.; Dinc, M. Nutlet morphology of six Clinopodium taxa, previously treated as Acinos, in Turkey. Biol. Divers. Conserv. 2015, 7, 119–125. [Google Scholar]
  36. POWO. Plants of the World Online. Facilitated by the Royal Botanic Gardens, Kew. Published on the Internet. 2024. Available online: https://powo.science.kew.org/ (accessed on 24 December 2024).
  37. Ferreira, T.; Rasband, W. ImageJ User Guide-Ij1.46r. 2012. 186p. Available online: https://imagej.net/ (accessed on 12 June 2024).
  38. Cox, E.P. A method of assigning numerical and percentage values to the degree of roundness of sand grains. J. Paleontol. 1927, 1, 179–183. [Google Scholar]
  39. Riley, N.A. Projection sphericity. J. Sediment. Pet. 1941, 11, 94–97. [Google Scholar]
  40. Schwartz, H. Two-dimensional feature-shape indexes. Mikroskopie 1980, 37, 64–67. [Google Scholar]
  41. Cervantes, E.; Martín-Gómez, J.J.; Espinosa-Roldán, F.E.; Muñoz-Organero, G.; Tocino, Á.; Cabello-Sáenz de Santamaría, F. Seed Morphology in Key Spanish Grapevine Cultivars. Agronomy 2021, 11, 734. [Google Scholar] [CrossRef]
  42. Bézier, P.E. How Renault Uses Numerical Control for Car Body Design and Tooling (Paper 680010 SAE Congress); Society of Automotive Engineers Congress: Detroit, MI, USA, 1968. [Google Scholar]
  43. R Core Team. R: A Language and Environment for Statistical Computing, Version 4.1.2; R Foundation for Statistical Computing: Vienna, Austria, 2021; Available online: https://www.R-project.org (accessed on 20 November 2024).
  44. Moein, F.; Jamzad, Z.; Rahiminejad, M.; Landis, J.B.; Mirtadzadini, M.; Soltis, D.E.; Soltis, P.S. Towards a global perspective for Salvia L.: Phylogeny, diversification and floral evolution. J. Evol. Biol. 2023, 36, 589–604. [Google Scholar] [CrossRef] [PubMed]
  45. Kriebel, R.; Drew, B.T.; Drummond, C.P.; González-Gallegos, J.G.; Celep, F.; Mahdjoub, M.M.; Rose, J.P.; Xiang, C.; Hu, G.; Walker, J.B.; et al. Tracking temporal shifts in area, biomes, and pollinators in the radiation of Salvia (sages) across continents: Leveraging anchored hybrid enrichment and targeted sequence data. Am. J. Bot. 2019, 106, 573–597. [Google Scholar] [CrossRef]
  46. Martín Gómez, J.J.; Gutiérrez del Pozo, D.; Cervantes, E. Seed shape quantification in the Malvaceae reveals cardioid-shaped seeds predominantly in herbs. Botanica 2019, 25, 21–31. [Google Scholar] [CrossRef]
  47. Saadaoui, E.; Martín Gómez, J.J.; Tlili, N.; Khaldi, A.; Cervantes, E. Effect of Climate in seed diversity of wild Tunisian Rhus tripartita (Ucria) Grande. J. Adv. Biol. Biotechnol. 2017, 13, 1–10. [Google Scholar] [CrossRef]
  48. Cervantes, E.; Martín-Gómez, J.J.; del Pozo, D.G.; Tocino, Á. Curvature Analysis of Seed Silhouettes s in the Euphorbiaceae. Seeds 2024, 3, 608–638. [Google Scholar] [CrossRef]
  49. Katsiotis, A.; Nikoloudakis, N.; Linos, A.; Drossou, A.; Constantinidis, T. Phylogenetic relationships in Origanum spp. based on rDNA sequences and intra-genetic variation of Greek O. vulgare subsp. hirtum revealed by RAPD. Sci. Hortic. 2009, 121, 103–108. [Google Scholar] [CrossRef]
  50. Bräuchler, C.; Meimberg, H.; Heubl, G. Molecular phylogeny of Menthinae (Lamiaceae, Nepetoideae, Mentheae). Taxonomy, biogeography and conflicts. Mol. Phylogenet. Evol. 2010, 55, 501–523. [Google Scholar] [CrossRef]
  51. Li, P.; Qi, Z.-C.; Liu, L.-X.; Ohi-Toma, T.; Lee, J.; Hsieh, T.-H.; Fu, C.-X.; Cameron, K.M.; Qiu, Y.-X. Molecular phylogenetics and biogeography of the mint tribe Elsholtzieae (Nepetoideae, Lamiaceae), with an emphasis on its diversification in East Asia. Sci. Rep. 2017, 7, 2057. [Google Scholar] [CrossRef]
  52. Altindal, D. Determination of genetic diversity of natural sage populations in Mugla region of Turkey. Int. J. Environ. Sci. Technol. 2019, 16, 5219–5226. [Google Scholar] [CrossRef]
  53. Elmas, S.; Arabaci, O.; Akpinar, E.; Hasancebi, S.; Zeybek, A. Chemical and molecular characterization of Anatolian Sage (Salvia fruticosa mill.) populations distributed naturally in Southwestern Aegean. Appl. Ecol. Environ. Res. 2021, 19, 1407–1421. [Google Scholar] [CrossRef]
  54. Craft, J.D.; Satyal, P.; Setzer, W.N. The Chemotaxonomy of Common Sage (Salvia officinalis) Based on the Volatile Constituents. Medicines 2017, 4, 47. [Google Scholar] [CrossRef]
  55. Qian, J.; Song, J.; Gao, H.; Zhu, Y.; Xu, J.; Pang, X.; Yao, H.; Sun, C.; Li, X.; Li, C.; et al. The complete chloroplast genome sequence of the medicinal plant Salvia miltiorrhiza. PLoS ONE 2013, 8, e57607. [Google Scholar] [CrossRef]
  56. Zhao, W.; Guo, L.; Yang, Y.; Wang, Y.; Yang, L.; Wei, C.; Guo, J.; Yan, K. Complete chloroplast genome sequences of Phlomis fruticose and Phlomoides strigosa and comparative analysis of the genus Phlomis sensu lato (Lamiaceae). Front. Plant Sci. 2022, 13, 1022273. [Google Scholar] [CrossRef]
  57. Cui, N.; Liao, B.-S.; Liang, C.-L.; Li, S.-F.; Zhang, H.; Xu, J.; Li, X.-W.; Chen, S.-L. Complete chloroplast genome of Salvia plebeia: Organization, specific barcode and phylogenetic analysis. Chin. J. Nat. Med. 2020, 18, 563–572. [Google Scholar] [CrossRef]
  58. Gao, C.; Wu, C.; Zhang, Q.; Zhao, X.; Wu, M.; Chen, R.; Zhao, Y.; Li, Z. Characterization of chloroplast genomes from two Salvia medicinal plants and gene transfer among their mitochondrial and chloroplast genomes. Front. Genet. 2020, 11, 574962. [Google Scholar] [CrossRef]
  59. Su, T.; Geng, Y.-F.; Xiang, C.-L.; Zhao, F.; Wang, M.; Gu, L.; Hu, G.-X. Chloroplast genome of Salvia sect: Drymosphace: Comparative and phylogenetic analysis. Diversity 2022, 14, 324. [Google Scholar] [CrossRef]
  60. Yu, D.; Pei, Y.; Cui, N.; Zhao, G.; Hou, M.; Chen, Y.; Chen, J.; Li, X. Comparative and phylogenetic analysis of complete chloroplast genome sequences of Salvia regarding its worldwide distribution. Sci. Rep. 2023, 13, 14268. [Google Scholar] [CrossRef]
  61. Bornowski, N.; Hamilton, J.P.; Liao, P.; Wood, J.C.; Dudareva, N.; Buell, C.R. Genome sequencing of four culinary herbs reveals terpenoid genes underlying chemodiversity in the Nepetoideae. DNA Res. 2020, 27, dsaa016. [Google Scholar] [CrossRef]
Figure 1. Above: Salvia rosmarinus Spenn., Lavandula angustifolia subsp. angustifolia; Lavandula stoechas subsp. pedunculata (Mill.) Samp. Ex Rozeira. Below: Marsypianthes chamaedris (Vahl) Kuntze; Ocimum basilicum L., Ocimum gratissimum L.
Horticulturae 11 00315 g001
Figure 2. Summary of the method for estimating the J-index (percentage of similarity between a plane figure and a geometric model). Left: Salvia hispanica L. seed image (top) and model (bottom). Centre: Image and model superimposed. Right: The image with the model superimposed in black gives in imageJ the value of the total area (above, black was converted to red by adjusting the threshold in imageJ), while the image with the model superimposed in white gives in imageJ the value of the area shared between the image and the model (below).
Horticulturae 11 00315 g002
Figure 3. Graph showing the results of the PCA. The four arrows in the first quadrant represent width, area, perimeter and length, and opposite to them is the mean curvature, which corresponds to PC1 (Size). PC2 (Roundness) is represented in the second quadrant by roundness and circularity, opposite to aspect ratio. The minimum curvature, opposite to the curvature ratio, forms PC3 (Curvature ratio). The length and direction of each vector represent the contribution of the corresponding variable to the principal components. Variables that are more strongly related to these components will appear with higher cos² values.
Horticulturae 11 00315 g003
Figure 4. Dendrogram based on hierarchical clustering with the mean values of the data given in Table 3. Between parentheses: number of species.
Horticulturae 11 00315 g004
Figure 5. Average contours for 21 species of subfam. Nepetoideae, tribes Elsholtzieae, Mentheae and Ocimeae.
Horticulturae 11 00315 g005
Figure 6. Curvature analysis in the seeds of Mentha piperita, M. pulegium and M. suavolens (Left): Seed images. (Centre): The Bézier curve representing the seed contours. (Right): The change in curvature along the Bézier curve. The dashed line (orange) shows the mean curvature. The green line shows the curvature values along the curve. The red arrows indicate the direction of the curvature measurements.
Horticulturae 11 00315 g006
Figure 7. Curvature analysis of Salvia hispanica, S. microphylla and S. officinalis seeds. (Left): Seed images. (Centre): The Bézier curve representing the seed contours. (Right): The change in curvature along the Bézier curve. The dashed line (orange) shows the mean curvature. The green line shows the curvature values along the curve. The red arrows indicate the direction of the curvature measurements.
Horticulturae 11 00315 g007
Figure 8. Curvature analysis of Salvia pratensis and S. rosmarinus. (Left): seed images. (Centre): The Bézier curve, representing the seed contours. (Right): The change in curvature along the Bézier curve. The dashed line (orange) shows the mean curvature. The green line shows the curvature values along the curve. The red arrows indicate the direction of the curvature measurements.
Horticulturae 11 00315 g008
Figure 9. Curvature analysis of Thymus mastichina, T. vulgaris and T. zygis. (Left): seed images. (Centre): The Bézier curve, representing the seed contours. (Right): The change in curvature along the Bézier curve. The dashed line (orange) shows the mean curvature. The green line shows the curvature values along the curve. The red arrows indicate the direction of the curvature measurements.
Horticulturae 11 00315 g009
Figure 10. Curvature analysis of Lavandula angustifolia and L. stoechas seeds. (Left): Seed images. (Centre): The Bézier curve representing the seed contours. (Right): The variation in curvature along the Bézier curve. The dashed line (orange) shows the mean curvature. The green line shows the curvature values along the curve. The red arrows indicate the direction of the curvature measurements.
Horticulturae 11 00315 g010
Figure 11. Curvature analysis of Ocimum americanum, O. basilicum, O. campechianum and O. gratissiumum. (Left): Seed images. (Centre): The Bézier curve representing the seed contours. (Right): The variation in curvature along the Bézier curve. The dashed line (orange) shows the mean curvature. The green line shows the curvature values along the curve. The red arrows indicate the direction of the curvature measurements.
Horticulturae 11 00315 g011
Table 1. Seeds used in the present work.
Tribe/SpeciesPopulation (Place of Origin and Date of Collection)Natural Distribution
Elsholtzieae
Perilla frutescens (L.) BrittonCommercial seeds (Dolça Revolució, Barcelona, Spain)India/China
Mentheae
Clinopodium nepeta (L.) KuntzeWild population. Villanueva de Gómez (20 August 2024)Mediterranean
Mentha × piperita L.Cultivated plants. Villanueva de Gómez (20 August 2024)European
Mentha pulegium L.Commercial seeds (Eurogarden, Fitó, Barcelona, Spain)European/Asiatic
Mentha suaveolens Ehrh.Wild population. Villanueva de Gómez (20 August 2024)European
Origanum vulgare L.Cultivated plants. Salamanca (20 September 2024)European
Salvia hispanica L.Commercial seeds (Eurogarden, Fitó, Barcelona, Spain)Mesoamerican
Salvia microphylla Sessé & Moc.Cultivated plants. Villanueva de Gómez (20 July 2024)Neotropical
Salvia officinalis L.Commercial seeds (Semillas Marcos, Salamanca, Spain)Mediterranean
Salvia pratensis L.Wild population. Villanueva de Gómez (20 August 2024)European
Salvia rosmarinus Spenn.Commercial seeds (Eurogarden, Fitó, Barcelona, Spain)Mediterranean
Thymus mastichina (L.) L.Wild population. Villanueva de Gómez (20 August 2024)Mediterranean
Thymus vulgaris L.Commercial seeds (Eurogarden, Fitó, Barcelona, Spain)Mediterranean
Thymus zygis L.Commercial seeds (Eurogarden, Fitó, Barcelona, Spain)Mediterranean
Ocimeae
Lavandula angustifolia subsp. angustifoliaCommercial seeds (Eurogarden, Fitó, Barcelona, Spain)Mediterranean
Lavandula stoechas subsp. pedunculata (Mill.) Samp. Ex RozeiraWild population. Villanueva de Gómez (20 August 2024)Mediterranean
Marsypianthes chamaedris (Vahl) KuntzeWild population, Puyo, Ecuador (October 2024)Neotropical
Ocimum americanum L.Cultivated plants, Puyo, Ecuador (October 2024)Paleotropical
Ocimum basilicum L.Comercial seeds (Eurogarden, Fitó, Barcelona, Spain)Paleotropical/Australian
Ocimum campechianum Mill.Wild population, Puyo, Ecuador (October 2024)Neotropical
Ocimum gratissimum L.Cultivated plants, Puyo, Ecuador (October 2024)Paleotropical
Table 2. Component matrix after PCA.
MeasurementPC1 (Size)PC2 (Roundness)PC3 (Curvature Ratio)
Perimeter0.974
Width0.972
Area0.953
Length0.939
Mean curvature−0.923
Aspect ratio −0.930
Roundness 0.918
Circularity 0.851
Ratio Max to Mean curvature −0.945
Min. curvature 0.885
Max. curvature−0.614 −0.693
Percentage variation39.523.720.6
Accumulated39.563.383.9
Table 3. Kruskal–Wallis analysis of the factors Size, Roundness and Curvature ratio in the three tribes of Nepetoideae. The data are means of each factor for each tribe. Different superscript letters denote significant differences within columns at p ≤ 0.05, N is the number of seeds measured. Coefficients of variation between parentheses.
Tribe NPC1 (Size)PC2 (Roundness)PC3 (Curvature Ratio)
Elsholtzieae (Perilla)60.96 (14.0) c1.24 (26.1) c0.37 (66.1) b
Mentheae (Clinopodium, Mentha, Origanum, Salvia, Thymus)74−0.20 (584.8) a0.10 (864.3) b0.41 (138.2) b
Ocimeae (Lavandula, Marsypianthes, Ocimum)420.21 (276.2) b−0.36 (294.2) a−0.77 (157.2) a
Table 4. Kruskal–Wallis analysis of the factors of Size, Roundness and Curvature ratio in genera of the Nepetoideae. The data are means of each factor for each genus. Different superscript letters denote significant differences within columns at p ≤ 0.05, N is the number of seeds measured. Coefficients of variation between parentheses.
GenusNPC1 (Size)PC2 (Roundness)PC3 (Minimum Curvature)
Perilla (P. frutescens)60.96 (14.0) e1.24 (26.1) e0.37 (66.1) cd
Clinopodium (C. nepeta)6−0.54 (16.6) bc0.66 (49.6) cd0.13 (303.9) cd
Mentha (M. × piperita, M. pulegium, M. suaveolens)18−1.40 (16.7) a−0.30 (155.7) b0.03 (3043.9) cd
Origanum (O. vulgare) 5−0.90 (6.8) b0.04 (338.3) b−0.15 (245.5) c
Salvia (S. hispanica, S. microphylla, S. officinalis, S. pratensis, S. rosmarinus)281.14 (47.4) e−0.24 (452.4) b0.73 (23.2) e
Thymus (T. mastichina, T. vulgaris, T. zygis)17−0.79 (52.6) b0.93 (34.8) d0.53 (54.9) cd
Lavandula (L. angustifolia subsp. angustifolia, L. stoechas subsp. pedunculata)12−0.27 (310.6) bcd−1.29 (79.8) a0.55 (66.6) de
Marsypianthes (M. chamaedris) 60.31 (40.5) cd0.48 (57.5) bc−1.99(19.8) a
Ocimum (O. americanum, O. basilicum, O. campechianum, O. gratissimum)240.43 (65.6) d−0.10 (841.0) b−1.12 (92.3) b
Table 5. Means and Kruskal–Wallis analysis of area (A), circularity (C), aspect ratio (AR), solidity (S) and curvature (C; maximum, Cmax; minimum, Cmin; mean, and ratio of maximum to mean) in three species of Mentha. Coefficients of variation are between parentheses. Different superscripts denote differences at p < 0.05. N, number of seeds analysed.
NACARSCmaxCminMeanRatio
M. × piperita60.23 a
(7.9)
0.84 b
(1.7)
1.38 ab
(6.3)
0.987 b
(0.2)
15.1 b
(37.3)
0.3 b
(463)
4.1 b
(8.7)
3.7 b
(32.2)
M. pulegium60.30 c
(9.3)
0.84 b
(2.4)
1.35 a
(7.7)
0.991 c
(0.1)
9.6 a
(11.1)
−0.5 ab
(121)
3.7 a
(4.5)
2.6 a
(15.3)
M. suaveolens60.25 b
(9.3)
0.80 a
(2.2)
1.41 b
(5.0)
0.983 a
(0.3)
21.6 b
(20.7)
−2.4 a
(76)
3.9 b
(23.8)
6.1 b
(43)
Table 6. Means and Kruskal–Wallis analysis of J-index values in three species of Mentha. Values are means of 20 measurements, with the average contours as models applied to the seed images of each species. MM: model Mentha. Different superscripts denote differences at p < 0.05. N, number of seeds analysed. Coefficients of variation are between parentheses.
SpeciesNIJ MMpipIJ MMpulIJ MMsuav
M. × piperita2092.3 b (1.6)93.0 b (1.5)91.6 ab (1.8)
M. pulegium2091.8 ab (2.4)93.2 b (1.8)91.0 a (2.3)
M. suaveolens2091.2 a (2.1)91.8 a (1.8)92.6 b (1.8)
Table 7. Means and Kruskal–Wallis analysis of area (A), circularity (C), aspect ratio (AR), solidity (S) and curvature (C; maximum, Cmax; minimum, Cmin; mean, and ratio of maximum to mean) in five species of Salvia. Different superscripts denote differences at p < 0.05. N, number of seeds analysed. Coefficients of variation are between parentheses.
NACARSCmaxCminMeanRatio
S. hispanica62.23 a
(10.7)
0.83 b
(1.0)
1.55 c
(2.8)
0.991 b
(0.1)
3.3 b
(15.6)
0.4 b
(42.7)
1.0 bc
(8.9)
3.3 ab
(12.0)
S. microphylla63.50 c
(7.1)
0.83 b
(1.3)
1.62 d
(3.5) e
0.992 c
(0.1)
3.3 b
(13.6)
0.2 ab
(29.4)
0.9 b
(11.9)
3.8 ab
(8.1)
S. officinalis65.11 d
(12.3)
0.89 d
(0.9)
1.16 a
(5.1)
0.991 c
(0.1)
1.8 a
(12.2)
0.3 ab
(51.6)
0.6 a
(6.2)
3.2 a
(15.1)
S. pratensis62.80 b
(11.3)
0.84 c
(1.4)
1.41 b
(3.5)
0.988 a
(0.2)
3.9 b
(16.6)
0.3 ab
(68.3)
0.9 bc
(6.0)
4.3 b
(18.0)
S. rosmarinus62.70 b
(13.4)
0.77 a
(4.0)
1.89 a
(9.1)
0.987 a
(0.3)
3.8 b
(17.1)
0.1 a
(74.2)
1.0 c
(9.8)
3.7 ab
(18.2)
Table 8. Means and Kruskal–Wallis analysis of area (A), circularity (C), aspect ratio (AR), solidity (S) and curvature (C; maximum, Cmax; minimum, Cmin; mean, and ratio of maximum to mean) in three species of Thymus. Different superscripts denote differences at p < 0.05. N, number of seeds analysed. Coefficients of variation are between parentheses.
NACARSCmaxCminMeanRatio
T. mastichina60.65 b
(13.1)
0.88 b
(0.8)
1.09 a
(3.7)
0.988 a
(0.2)
7.5 a
(17.7)
−0.8 a
(129)
2.4 a
(6.4)
3.2 b
(17.1)
T. vulgaris60.62 b
(15.4)
0.88 b
(0.7)
1.12 a
(3.8)
0.992 a
(0.1)
6.1 a
(16.6)
0.4 b
(178)
2.5 a
(11.3)
2.4 a
(19.6)
T. zygis60.21 a
(12.5)
0.86 a
(1.5)
1.23 b
(7.8)
0.988 b
(0.2)
12.4 b
(7.1)
0.3 ab
(337)
4.1 b
(7.7)
3.0 ab
(9.2)
Table 9. Means and Kruskal–Wallis analysis of the J-index values in three species of Thymus. Values are means of 20 measurements, with the average contours as models applied to the seed images of each species. MT: Thymus model. Different superscripts denote differences at p < 0.05. N, number of seeds analysed. Coefficients of variation are between parentheses.
Species NIJ MTmastIJ MTvulgIJ MTzig
T. mastichina2094.8 c (0.8)93.8 b (1.2)89.8 a (2.3)
T. vulgaris2093.7 b (1.1)94.8 c (0.8)90.7 a (1.9)
T. zygis2089.7 a (3.9)90.5 a (3.5)92.3 b (2.4)
Table 10. Means and Kruskal–Wallis analysis of area (A), circularity (C), aspect ratio (AR), solidity (S) and curvature (C; maximum, Cmax; minimum, Cmin; mean, and ratio of maximum to mean) in two species of Lavandula. Different superscripts denote differences at p < 0.05. N, number of seeds analysed. Coefficients of variation are between parentheses.
NACARSCmaxCminMeanRatio
L. angustifolia62.36 b
(7.7)
0.73 a
(3.1)
2.07 b
(5.1)
0.986 a
(0.1)
5.0 a
(24.6)
0.2 b
(14.8)
1.7 a
(6.2)
3.0 a
(23.1)
L. stoechas60.40 a
(8.4)
0.84 b
(2.4)
1.40 a
(4.2)
0.987 a
(0.2)
9.3 b
(30.7)
−1.4 a
(74)
3.5 b
(3.6)
2.7 a
(32.0)
Table 11. Means and Kruskal–Wallis analysis of area (A), circularity (C), aspect ratio (AR), solidity (S) and curvature (C; maximum, Cmax; minimum, Cmin; mean, and ratio of maximum to mean) in four species of Ocimum. Different superscripts denote differences at p < 0.05. N, number of seeds analysed. Coefficients of variation are between parentheses.
NACARSCmaxCminMeanRatio
O. americanum62.57 d
(5.0)
0.74 a
(4.3)
1.68 c
(5.9)
0.985 b
(0.2)
13.4 b
(25.7)
−9.2 a
(27.1)
1.0 a
(11.7)
14.2 b
(34.0)
O. basilicum62.34 c
(6.2)
0.79 c
(2.7)
1.44 b
(6.2)
0.977 a
(0.6)
13.1 b
(21.7)
−1.5 bc
(66.9)
1.4 c
(5.4)
9.5 b
(22.4)
O. campechianum61.64 b
(6.1)
0.77 b
(1.7)
1.63 c
(3.0)
0.986 b
(0.2)
8.4 a
(25.3)
−1.0 c
(56.1)
1.3 b
(8.4)
6.7 a
(21.3)
O. gratissimum61.20 a
(5.1)
0.85 d
(1.4)
1.14 a
(2.3)
0.990 c
(0.1)
8.4 a
(16.7)
−2.1 b
(23.2)
1.2 b
(4.4)
7.2 a
(15.2)
Table 12. Means and Kruskal–Wallis analysis of J-index values in four species of Ocimum. Values are averages of 20 measurements with the average contours as models applied to the seed images of each species. Different superscripts denote differences at p < 0.05. MO: Ocimum model. Between parentheses, coefficients of variation.
NMOamMObaMOcaMOgr
O. americanum2094.3 d (1.9)86.8 b (3.5)88.9 c (1.5)73.9 a (5.1)
O. basilicum2088.1 b (3.2)93.3 c (1.3)87.8 b (2.3)84.9 c (3.5)
O. campechianum2090.4 c (0.9)87.9 b (1.4)95.3 d (0.8)78.9 b (1.9)
O. gratisimum2077.6 a (1.8)84.3 a (1.8)77.3 a (1.7)96.2 d (0.5)
Disclaimer/Publisher’s Note: The statements, opinions and data contained in all publications are solely those of the individual author(s) and contributor(s) and not of MDPI and/or the editor(s). MDPI and/or the editor(s) disclaim responsibility for any injury to people or property resulting from any ideas, methods, instructions or products referred to in the content.

