Article

Locating Appropriate Reference Genes in Heteroblastic Plant Ottelia cordata for Quantitative Real-Time PCR Normalization

1
School of Life and Health Sciences, Hainan Province Key Laboratory of One Health, Collaborative Innovation Center of One Health, Hainan University, Haikou 570228, China
2
School of Breeding and Multiplication (Sanya Institute of Breeding and Multiplication), Hainan University, Sanya 572022, China
*
Author to whom correspondence should be addressed.
Horticulturae 2025, 11(3), 313; https://doi.org/10.3390/horticulturae11030313
Submission received: 13 January 2025 / Revised: 10 March 2025 / Accepted: 12 March 2025 / Published: 13 March 2025
(This article belongs to the Special Issue Germplasm, Genetics and Breeding of Ornamental Plants)

Abstract

:
Selecting the right reference genes for data normalization is the only way to ensure the precision and reproducibility of gene expression measurement using qRT-PCR. Ottelia cordata is a member of the Hydrocharitaceae family in aquatic plants that exhibits both floating and submerged leaf forms. It has recently drawn interest as a possible model plant for research into non-KRANZ C4 photosynthesis and heteroblastic leaves. Our earlier research has demonstrated bias in gene expression analysis when actin or GAPDH, two common reference genes, are used for normalization. Furthermore, there has been no study on the Hydrocharitaceae family reference gene selection published to date. To standardize qRT-PCR in O. cordata, seven genes were chosen from a transcriptome database: ACT7, EF1_α, GAPDH, BRCC36, PP2A, UBC7, and UBQ. We conducted qRT-PCR experiments in various tissues, leaves in different developmental stages, leaves in high/low carbon treatment, and leaves in high/low temperature treatment. After analyzing the stability using five statistical methods (geNorm, normFinder, comparative ΔCt, bestKeeper, and comprehensive analysis), PP2A and UBQ were identified as the most stable genes. BRCC36 was identified as a new reference gene in plants. Finally, by contrasting the expression patterns of pepc2, a crucial gene connected to C4 photosynthesis, in floating and submerged leaves, PP2A, UBQ, and UBC7 were verified. Of these, PP2A and UBQ were shown to be the superior gene for the precise qRT-PCR data normalization. The results of this study offer the initial information concerning reference gene identification for O. cordata as well as the first data in Hydrocharitaceae plants. It will make it easier to do more gene function and molecular biology research on O. cordata and other closely related species.

1. Introduction

Due to its superior sensitivity and specificity, qRT-PCR is commonly used to analyze gene expression levels [1]. As opposed to Northern blot hybridization, qRT-PCR is more affordable, practical, and user-friendly. It is an essential instrument used in almost every molecular biology study to investigate gene expression levels. The quantity and quality of the template, as well as the normalization of one or more reference genes with stable expression, determine the accuracy and reliability of gene expression data obtained from qRT-PCR studies [2]. Using internal reference genes is crucial for data normalization in gene expression level analysis. By comparing the gene expression profiles of target genes with reference genes, it is possible to filter out non-specific changes that can affect the results [2,3]. This facilitates the comparison of expression levels across various samples or experimental groups as well as the precise measurement of gene expression variations under various circumstances. Choosing the right reference genes is essential since utilizing the wrong ones might provide inaccurate results or biased interpretation [3]. While similar studies have been conducted in terrestrial plants, they are lacking in aquatic plants, including the Hydrocharitaceae family. The plants in the Hydrocharitaceae family are annual or perennial freshwater and marine herbs, representing a group of ancient monocotyledonous plants. They originated in the Paleocene or Cretaceous period, around 70~100 million years ago. The aquatic C4 plants in this family likely appeared before terrestrial C4 plants, representing the prototype of the C4 photosynthetic pathway [4,5,6]. Ottelia cordata has the potential to be a model plant for studying heteroblastic leaves and non-KRANZ C4 photosynthesis in Hydrocharitaceae plants. There is currently no information available on the identification of the best reference gene in O. cordata or other closely related species. We used to normalize qRT-PCR data with actin or GAPDH (Glyceraldehyde–3-phosphate dehydrogenase), two common reference genes, while both showed bias in our analysis (unpublished data). Molecular research on O. cordata has been restricted by the absence of reference genes.
O. cordata, a large aquatic plant, plays a valuable role in water purification and serves as an ornamental feature in tropical wetlands. It also has several key traits that make it an experimental model, including (1) aquatic heteroblastic submerged leaves and floating leaves; (2) different types of inorganic carbon concentration mechanisms; (3) prolific seed production; (4) dioecious; and (5) tenacious vitality. Different carbon concentration mechanisms (CCMs) are employed by the different types of leaves. Floating leaves can absorb CO2 from the air and HCO3 (Carbonic acid hydrogen radical) from water, typically implementing C3 photosynthesis [7]. However, there have been studies reporting that they can also implement C4 and CAM (Crassulacean acid metabolism) [8]. Submerged leaves are entirely underwater, facing a more stringent low-carbon environment, where their only source of inorganic carbon is water. Hence, more CCMs are applied at the same time to deal with the low-carbon stress, such as C4 and HCO3 use [9,10,11,12]. C4 metabolism is typically associated with KRANZ anatomy; however, our previous research has not revealed any presence of a KRANZ structure [7,8]. Because of its unique heteroblastic leaves and various CCMs, O. cordata has drawn a lot of attention; yet, research on C4 metabolism is still in its early stages. Consequently, learning more about the molecular underpinnings of O. cordata may help identify novel and intriguing genes involved in C4 photosynthesis and heteroblastic leaf growth. Moreover, the study of non-KRANZ C4 aquatic plants could provide new insights for C4 photosynthesis engineering.
CO2 fixation is the most important step in photosynthesis [13,14]. C4 metabolism utilizes the high CO2 affinity of Phosphoenolpyruvate carboxylase (PEPC) to fix CO2 into C4 compounds for storage. Following the decarboxylation of these molecules by decarboxylase enzymes, CO2 is released and concentrates spatially near the Ribulose-1, 5-bisphosphate carboxylase/oxygenase (Rubisco). This concentration increases the affinity of Rubisco for CO2, reducing photorespiration and ultimately improving carbon assimilation efficiency [15]. The most important aspect of reference genes is their consistent expression level across many tissues, developmental stages, and treatments [16]. Common housekeeping genes, such as actin, GAPDH, EF1_α (Eukaryotic elongation factor 1-alpha), PP2A (Protein phosphatase 2A), UBQ (Ubiquitin), and UBC (Ubiquitin-conjugating enzyme), were chosen as the preferred targets in this investigation. Additionally, BRCC36 (Lys-63-specific deubiquitinase), a new reference gene in O. cordata, was discovered. This deubiquitinase is widely studied in animals but is rarely reported in plants [17]. To increase the reliability of the data, alternative reference genes must be selected for various scenarios. Stability assessment benefits greatly from the use of statistical algorithms such the comparative cycle threshold (comparative ΔCt) technique, genorm, normfinder, bestkeeper, and comprehensive analysis [18,19,20,21,22,23]. Seven potential reference genes were evaluated and confirmed in this work, and the best gene for adjusting O. cordata gene expression levels was adopted.

2. Materials and Methods

2.1. Plant Materials

The Yangshan Wetland in Haikou City, Hainan Province (N 19.55°, E 110.23°) is where the O. cordata were collected. The male and female plants provided the following common specimens: root, submerged leaf and petiole, and floating leaf and petiole. Other tissues should be sampled separately from male and female plants. From male plants, the flower petiole, flower stalk, sepal, petals, spathe, filament, anther, stamen, and bract were harvested. From female plants, the flower petiole, sepal, petals, spathe, stigma, ovary, pistil, and style were harvested. All tissues were analyzed separately in this study.
In addition to the natural plant samples, we also used treated samples under specific conditions. For the high/low CO2 treatment, saturated CO2 water was added to the plant culture chamber at 9:00 AM and 5:00 PM each day in the high CO2 treatment group. The water was gently mixed, and the pH was maintained between 6.40 and 7.20. Each treatment had 6 replicates, and the entire experiment lasted for 1 week. The low CO2 group served as the control (CK), with no additional treatment. Ambient temperature was maintained between 22 °C and 25 °C, and light intensity was approximately ~120 μmol quanta m−2 s−1, measured at the water surface using a Portable PAM Fluorometer 2500 (WALZ, Germany). The photoperiod was set to 14 h of light (08:00~22:00) and 10 h of darkness. The high-temperature condition was applied using a high-temperature incubator set to 40 °C. All other conditions, including those for the CK group, remained the same as described above.
In our investigation, three biological replicates were employed. Following their instant freezing in liquid nitrogen, all samples were kept at −80 °C.

2.2. Selection of Reference Genes and the Design of Primers

Seven candidate reference genes (ACT7, EF1_α, GAPDH, BRCC36, PP2A, UBC7, UBQ) were selected based on FPKM (Fragments Per Kilobase of exon model per Million mapped fragments) values from transcriptome data to evaluate their suitability for qRT-PCR. Sequence data have been submitted to the National Center for Biotechnology Information with the accession number PRJNA 1197590, CDS (coding sequence) and FPKM values were applied in File S1 and Figures S1–S3. Primer Premier 5.0 was used to design primers (Table 1). The melting temperature (Tm) values were set between 50 and 65 °C, the GC percent was set between 35 and 65%, the primer lengths were between 16 and 24 bp, and the product lengths ranged from 80 to 300 bp. The amplification efficiency for each primer pair was calculated according to the method described by Bustin SA. et al., with specific modifications implemented to accommodate our experimental conditions. The slope of the standard curve was measured using fivefold gradient dilutions of cDNA, and E = 5−1/slope − 1 was the amplification efficiency (E) of the primer. Optimal primers should fulfill two criteria: E within 90 to 110%, and R2 > 0.99 [16].

2.3. Extraction of RNA and Synthesis of cDNA

RNA extraction utilized TRNzol Universal Reagent (QIAGEN, Cat # DP424, China). The manufacturer’s instructions were followed in all steps, and RNase/DNase-free double distilled water (Vazyme, P071-01, China) was used to dissolve the RNA. 1% agarose gel electrophoresis and a nanodrop spectrophotometer (Nano Photometer N Touch, implen, Germany) were used to evaluate the quality and amount of the isolated RNA. For subsequent tests, RNA samples were used only if they displayed clear bands of 28S, 18S, and 5S on agarose gel electrophoresis; A260/A280 ratio between 1.8 and 2.2; and A260/A230 ratio > 1.8. The Evo M-MLV RT Mix Kit with gDNA Clean for qPCR Ver.2 (ACCURATE BIOLOGY, AG 11728, China) was used for first strand cDNA synthesis, in accordance with the manufacturer’s instructions. For the reverse transcription experiment, 1 μg of total RNA was used. The product was diluted four-fold before being used.

2.4. qRT-PCR Analysis

qRT-PCR was performed using the ABI 7500 real-time PCR System (Applied Biosystems 7500, Thermo, USA) with the SYBR Green Pro Taq HS qPCR Tracking kit (ROX plus) (ACCURATE BIOLOGY, AG 1175, China). Each 20 μL reaction mixture contained 2 μL of cDNA as a template, 10 μL of SYBR mix, and 0.4 μL of each primer. The following were the parameters for the PCR reaction: 30 s at 95 °C, 40 cycles at 95 °C for 5 s, and 30 s at 60 °C. To verify primer specificity, the fragment was reheated from 60 to 95 °C to create a melting curve. Three biological replicates were used in triplicate for each PCR reaction. Values for the threshold cycle (Ct) were computed automatically. Using the 2−ΔΔCt method, relative fold changes in gene expression were identified [24].

2.5. Gene Expression Stability Analysis

The potential reference genes in the tissues of male and female O. cordata, as well as in the phases of leaf development, were compared and ranked using the geNorm (V3.4) [18], normfinder (http://blooge.cn/RefFinder/, accessed on 11 March 2025) [19], bestkeeper (V1.0) [20], and comparative ΔCt (http://blooge.cn/RefFinder/) [21] techniques. It allocates a suitable weight to each gene based on the results of each program and determines the geometric mean of all of their weights to obtain the final overall ranking. Every analysis made use of Ct values. The expression level of PEPC (phosphoenolpyruvate carboxylase), a crucial gene involved in C4 photosynthesis, was examined using qRT-PCR in several leaf tissues in order to confirm the validity of the chosen reference genes.

2.6. Statistical Analysis

The Duncan test and the t-test were used to compare the means in the statistical analysis, which was carried out with SPSS 23 software.

3. Results

3.1. Selection of Candidate Reference Genes

In this work, seven different candidate genes were chosen from the transcriptome of O. cordata by comparing their FPKM values and assessing the significance of differences in leaves (see File S1). cDNA sequences were provided in Figures S1–S3. The cDNA segments of seven reference genes varied from 1178 to 2103 bp.

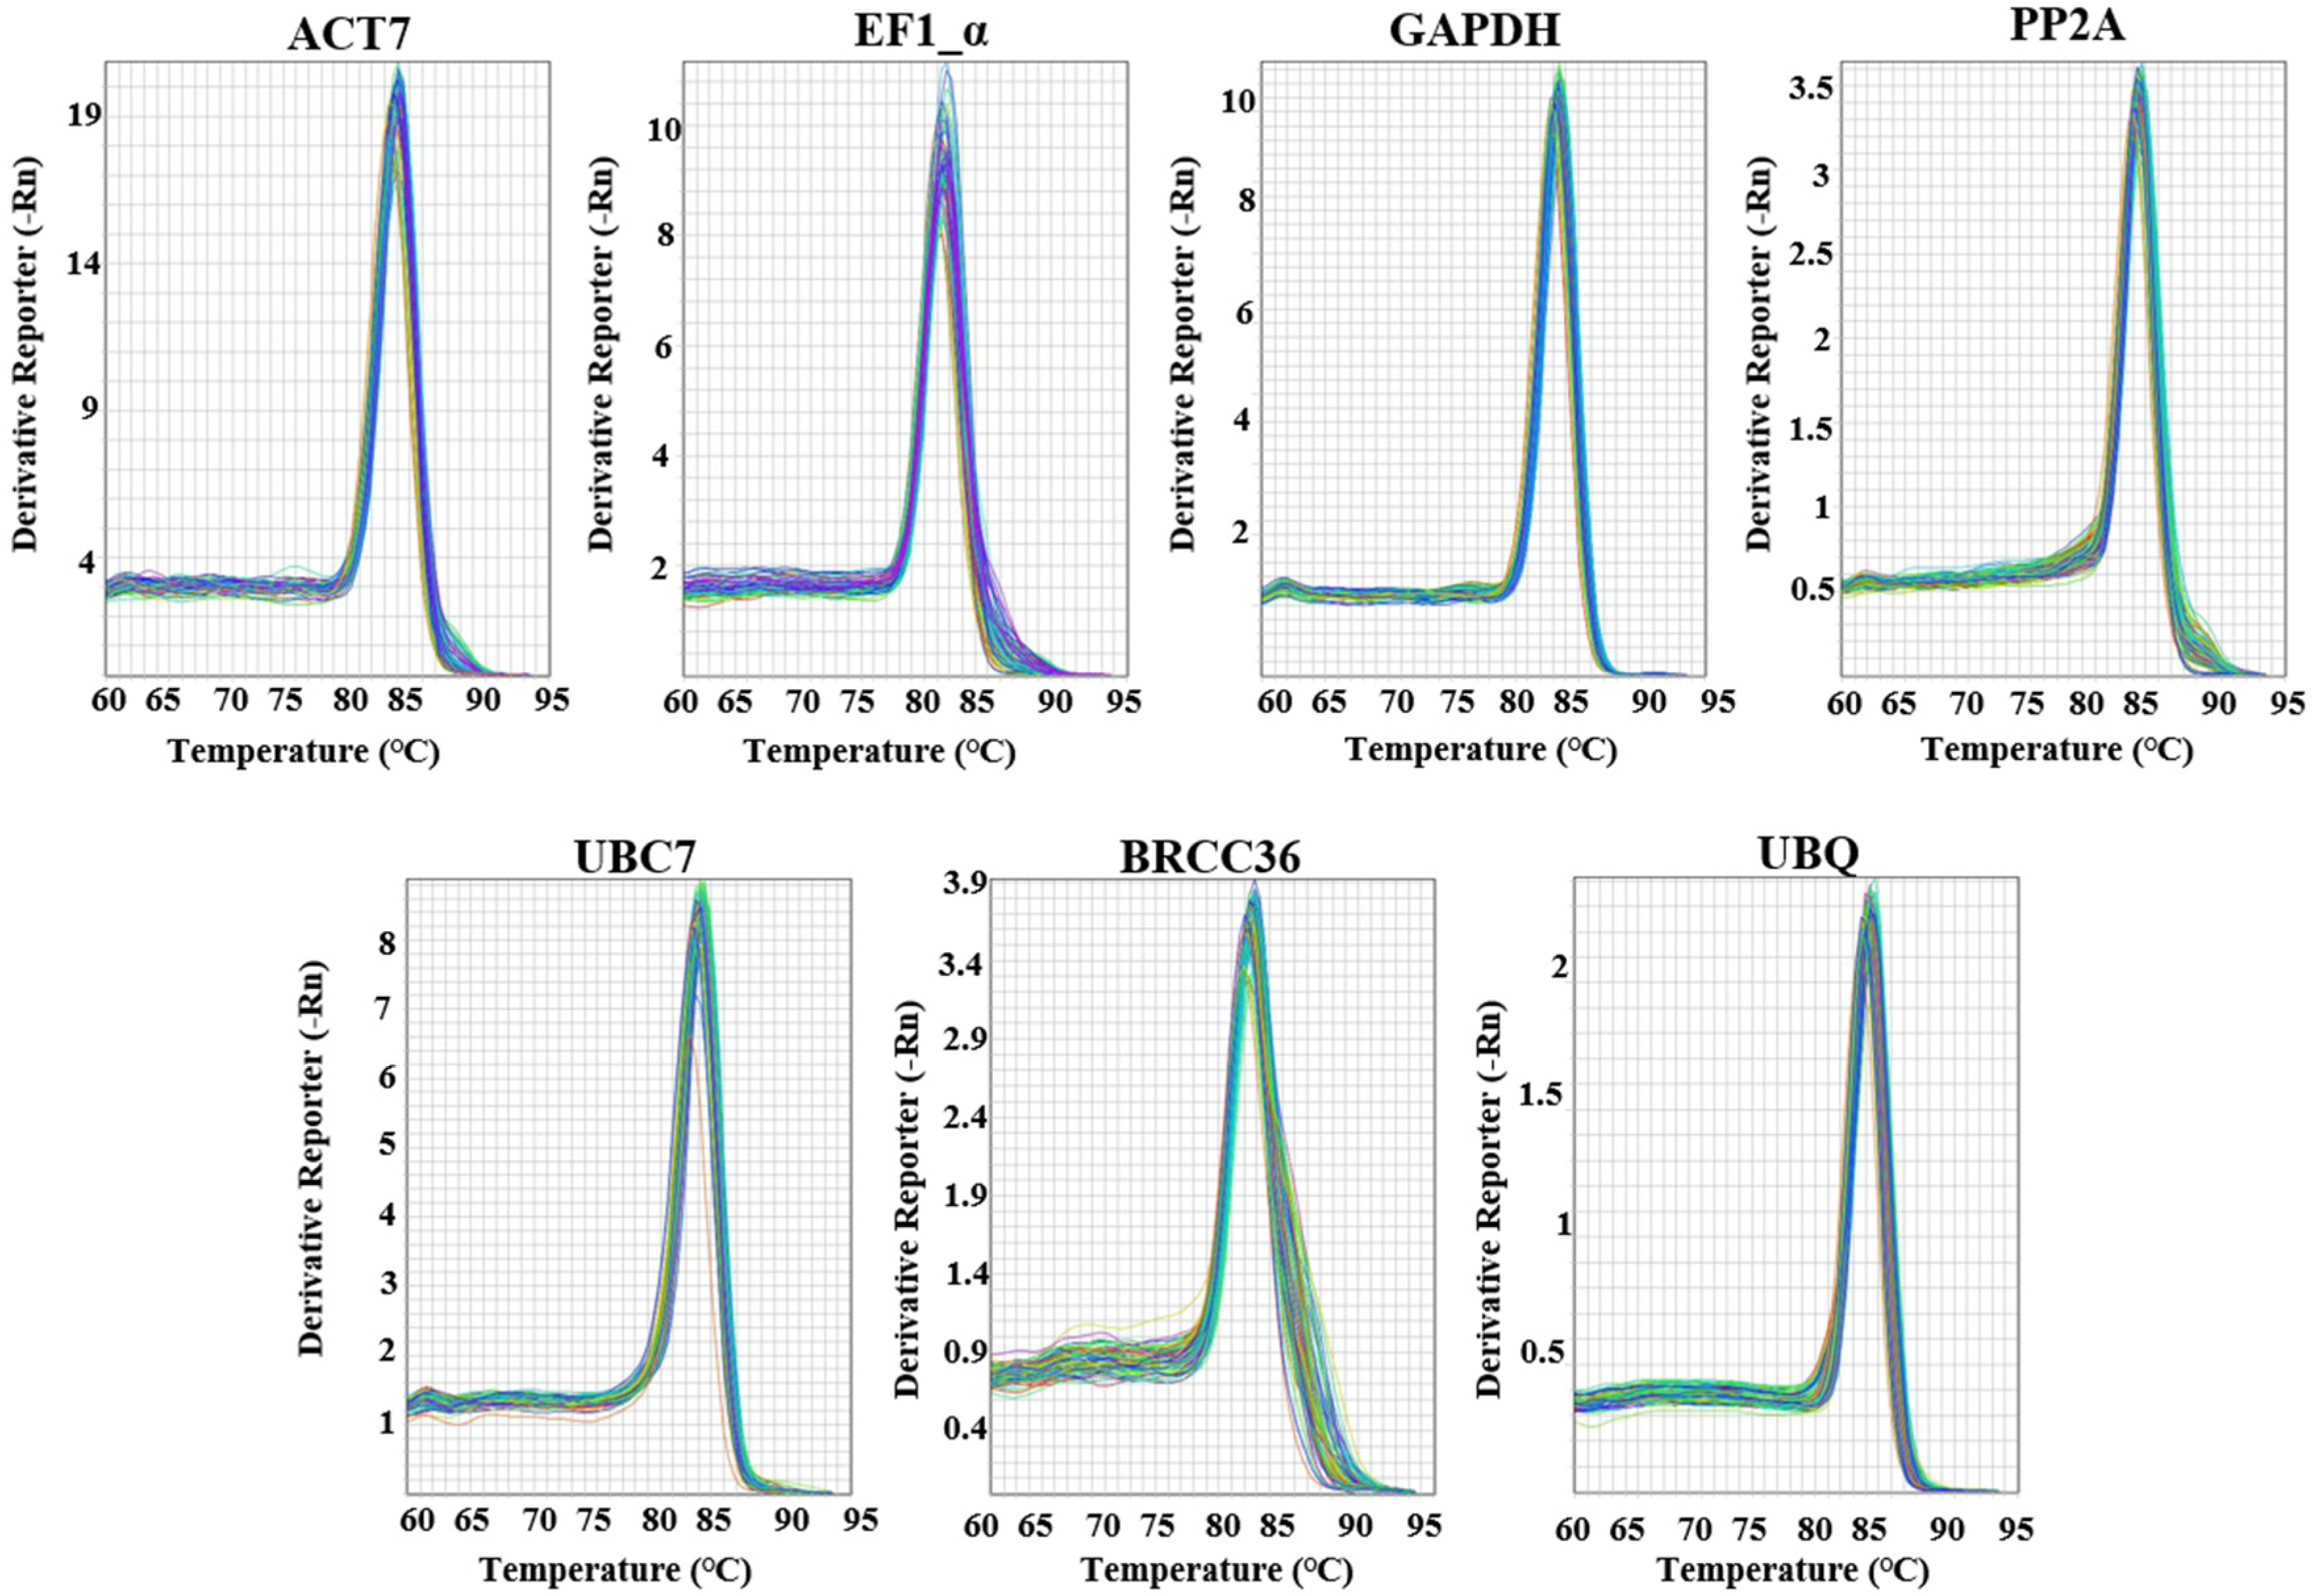
3.2. Verification of Primer Specificity and Efficacy

Construction of melt curves through a standard qRT-PCR approach was used to assess the specificity of seven primer pairs. As shown in Figure 1, there was only one distinctive peak for each gene; this indicated that each primer pair only generated a unique amplicon. Corresponding amplification curves were shown in Figure S1. Moreover, no signal was detected in NTR (no template reaction) samples. The qPCR products were run on an agarose gel electrophoresis, and a signal band was observed (Figure S2). The standard curve method was used to determine the PCR efficiency. The results (Table 1) showed that PCR efficiency for reference genes varied from 90.1 to 103.3%, with R2 values between 0.993 and 0.999. According to MIQE recommendations [16], the permissible range for PCR efficiency is 80% to 120%, with an optimal value of 100%. Therefore, all seven primer pairs we studied are considered valid.

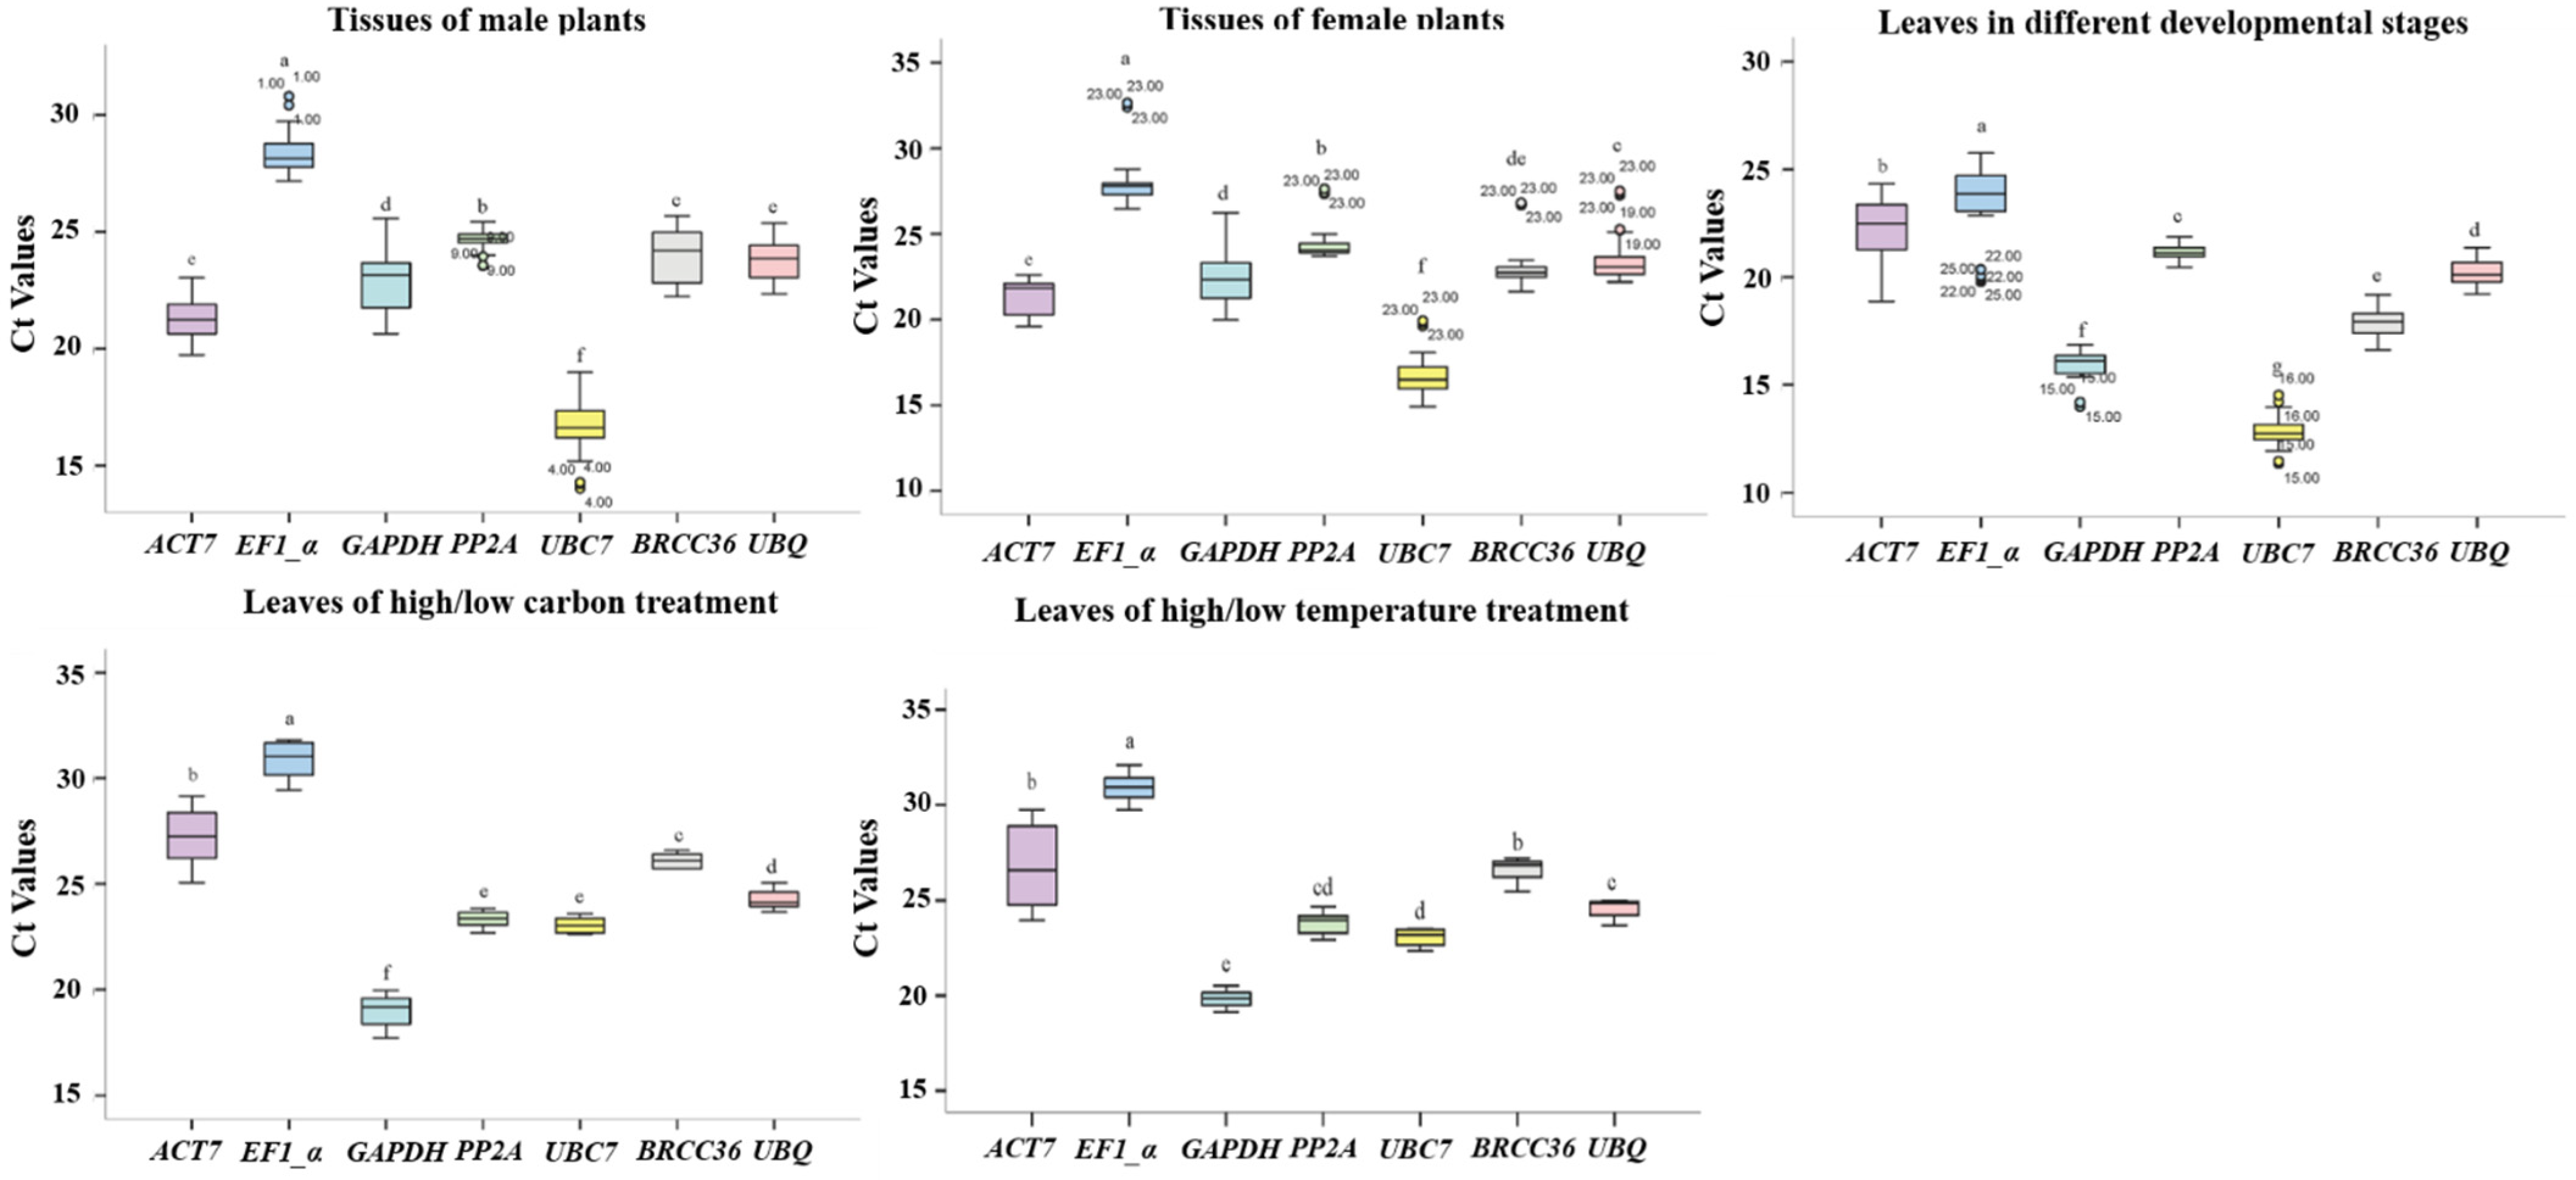
3.3. Ct Value Analyses of Seven Reference Genes

Ct values of ACT7, EF1_α, GAPDH, BRCC36, PP2A, UBC7, and UBQ were calculated to evaluate their expression levels across various tissues in whole plants, different developmental stages (Figure S3) and different treatments in leaves. Ranges of Ct values in various tissues and phases of leaf development were shown in Figure 2. EF1_α was the lowest expression gene both in male and female plant tissues, with mean Ct values of 28.36 ± 0.88 and 28.01 ± 1.45, respectively. UBC7 was the highest expression gene both in male and female plant tissues, with mean Ct values of 16.63 ± 1.12 and 16.74 ± 1.29, respectively. PP2A returned the most compact Ct value distribution both in male and female plant tissues, with mean Ct values of 24.64 ± 0.41 and 24.39 ± 0.96, respectively. In different developmental stages of leaves, the lowest expression gene was EF1_α, with a mean Ct value of 23.52 ± 1.80, the highest expression gene was UBC7, with a mean Ct value of 12.78 ± 0.66. PP2A also returned the most compact Ct value distribution both in leaves, with a mean Ct value of 21.14 ± 0.36. In high/low carbon treatment plant leaves, EF1_α was the lowest expression gene (30.93 ± 0.71) while GAPDH was the highest (19.82 ± 0.45). In high/low temperature treatment plant leaves, EF1_α was the lowest expression gene (30.86 ± 0.71) while GAPDH was the highest (19.00 ± 0.82). As well as the high/low carbon treatment group, EF1_α was the lowest expression gene (30.86 ± 0.82) while GAPDH was the highest (19.00 ± 0.82). These results indicated the expression pattern of PP2A and UBQ were more stable among those assessed across all samples analyzed.

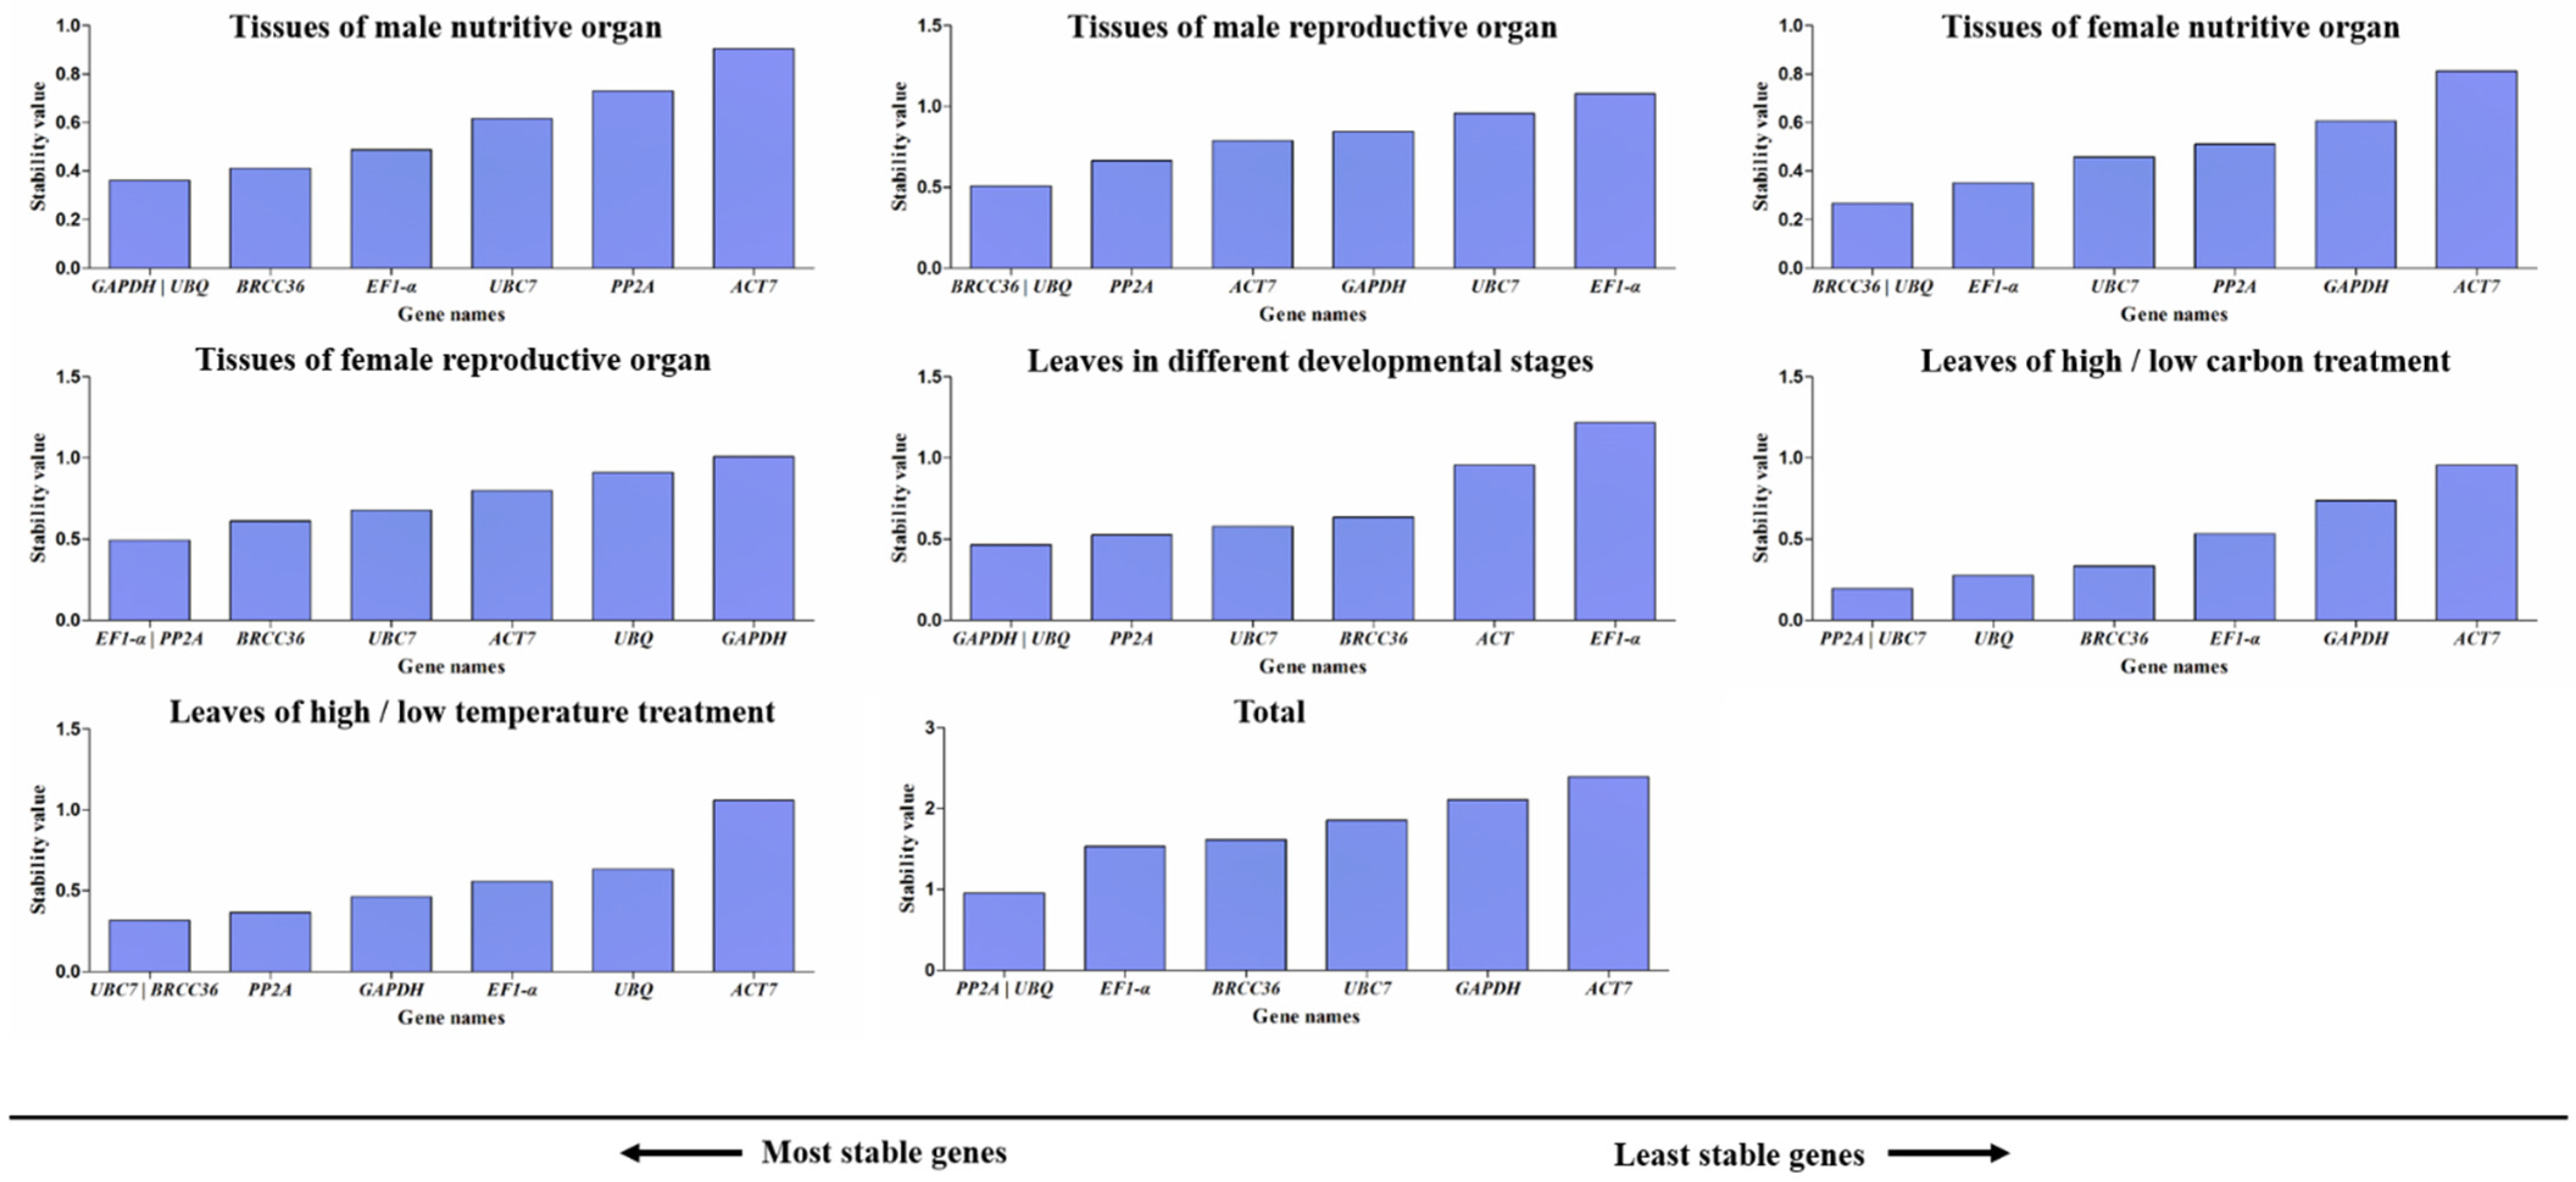
3.4. GeNorm Analysis of Candidate Reference Genes

The gene expression stability measure (M) was calculated using the geNorm method, which relies on average pairwise expression ratios, to select the most stable reference genes. A lower M value indicates better gene stability [18]. In Figure 3, the M values of seven genes were found to be less than 1.5 in the seven group samples of O. cordata. However, aside from PP2A and UBQ, the M values of other genes (ACT7, EF1_α, GAPDH, BRCC36 and UBC7) were higher than 1.5 across all tissues. UBQ and GAPDH were the most stable genes in male nutritive tissues and leaves in different developmental stages. BRCC3 and UBQ were most stable in male reproductive tissues and female nutritive tissues. EF1_α and PP2A were most stable in female reproductive tissues. PP2A and UBC7 were most stable in leaves of high/low carbon treatment. BRCC36 and UBC7 were most stable in leaves of high/low temperature treatment. In all 47 samples, the ranking of stability expression from high to low is as follows: PP2A = UBQ > EF_α > BRCC3 > UBC7 > GAPDH > ACT7. PP2A and UBQ were identified as the most suitable reference genes for qRT-PCR normalization across all examined samples. These two genes were the most reliable across various conditions for studying the expression of target genes. Other genes should be selected based on specific experimental conditions.
Pairwise variation (Vn/Vn + 1, V-value) examination of potential reference genes was performed, since a single reference gene usually cannot satisfy the exact quantitative criteria for gene expression transcription study. It was commonly used to determine the optimal number of reference genes needed for accurate normalization in gene expression studies. The V-value indicates the degree of change in stability after adding an internal reference gene. The smaller the value, the higher the stability. Vn/Vn + 1 indicates the stability difference between using n and n + 1 reference genes. When Vn/Vn + 1 is less than 0.15, adding more reference genes offers limited improvement in stability, indicating that n reference genes are sufficient. If Vn/Vn + 1 exceeds the 0.15 threshold, additional reference genes (n + 1) are needed to enhance normalization accuracy. As shown in Figure 4, the radio of V2/V3 were lower than 0.15 in all groups, suggesting that two reference genes can significantly enhance the reliability and accuracy of quantitative results. In conclusion, the best reference genes for different O. cordata samples were PP2A and UBQ.

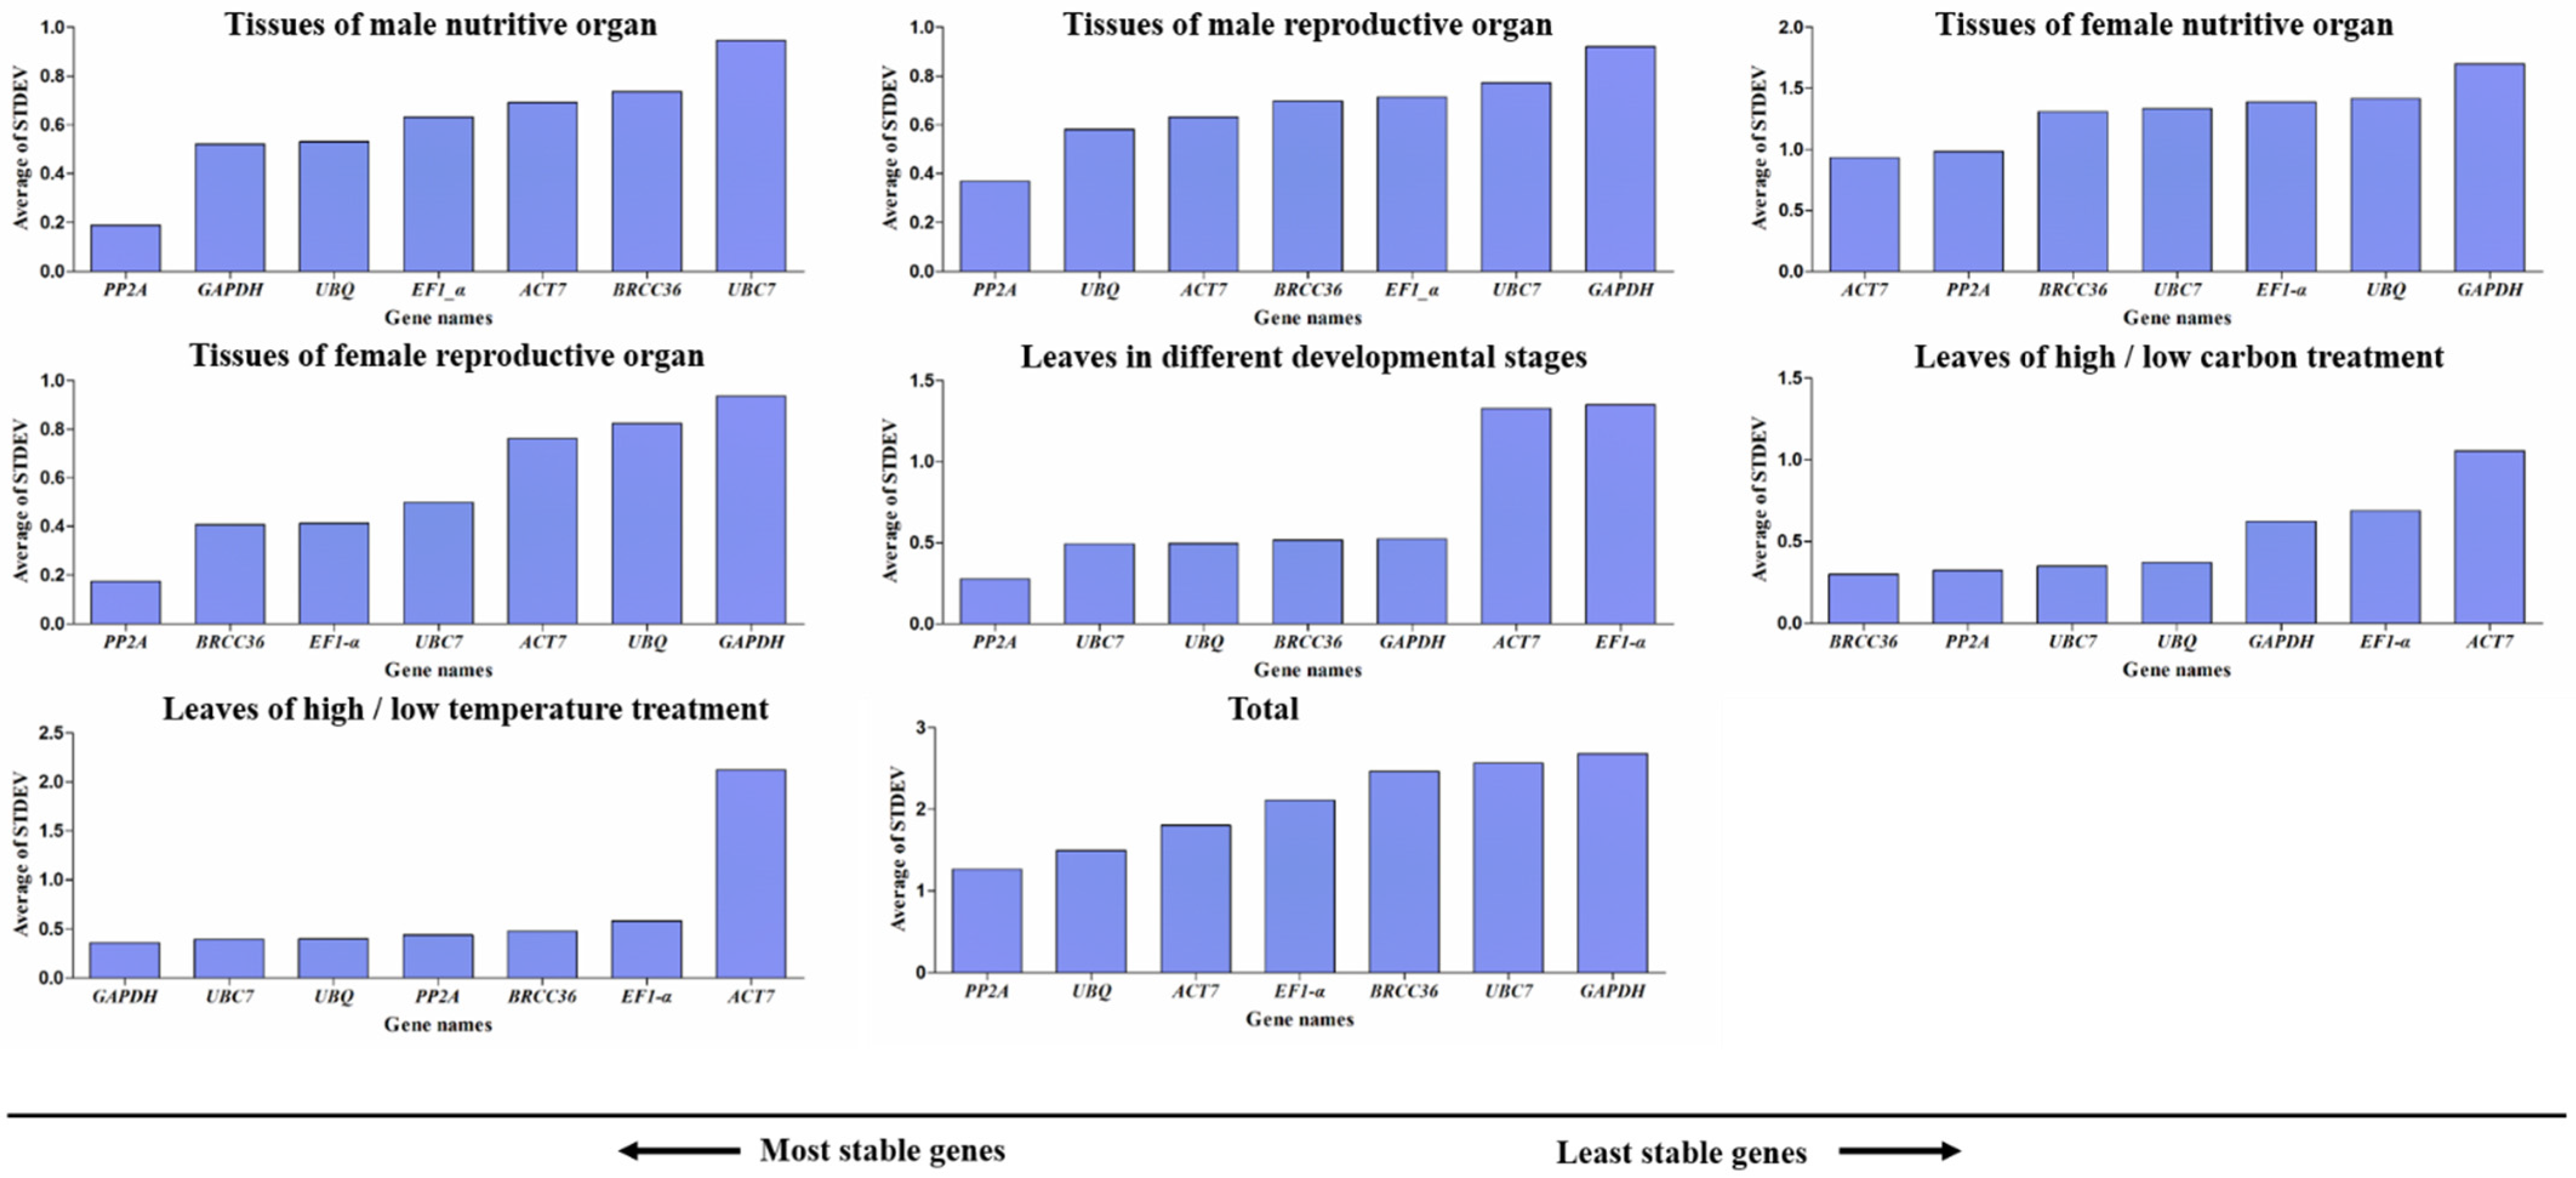
3.5. NormFinder Analysis of Candidate Reference Genes

The normFinder technique, which uses normalization by intra- and inter-group variances to establish the optimal number of reference genes, was used to assess the stability of possible reference genes [19]. The stability values were calculated for the seven candidate reference genes; the lower stability value means higher stability value. As shown in Figure 5, GAPDH was most stable in male nutritive tissues. In reproductive tissues, different developmental period leaves and high/low carbon treatment leaves, PP2A was the most stable one. BRCC36 was most stable in female nutritive tissues and high/low temperature treatment leaves. In all samples, UBQ was the most stable gene, which was in line with geNorm’s findings. In agreement with the findings of the geNorm analysis, ACT7 was the reference gene that was least stable over the whole dataset.

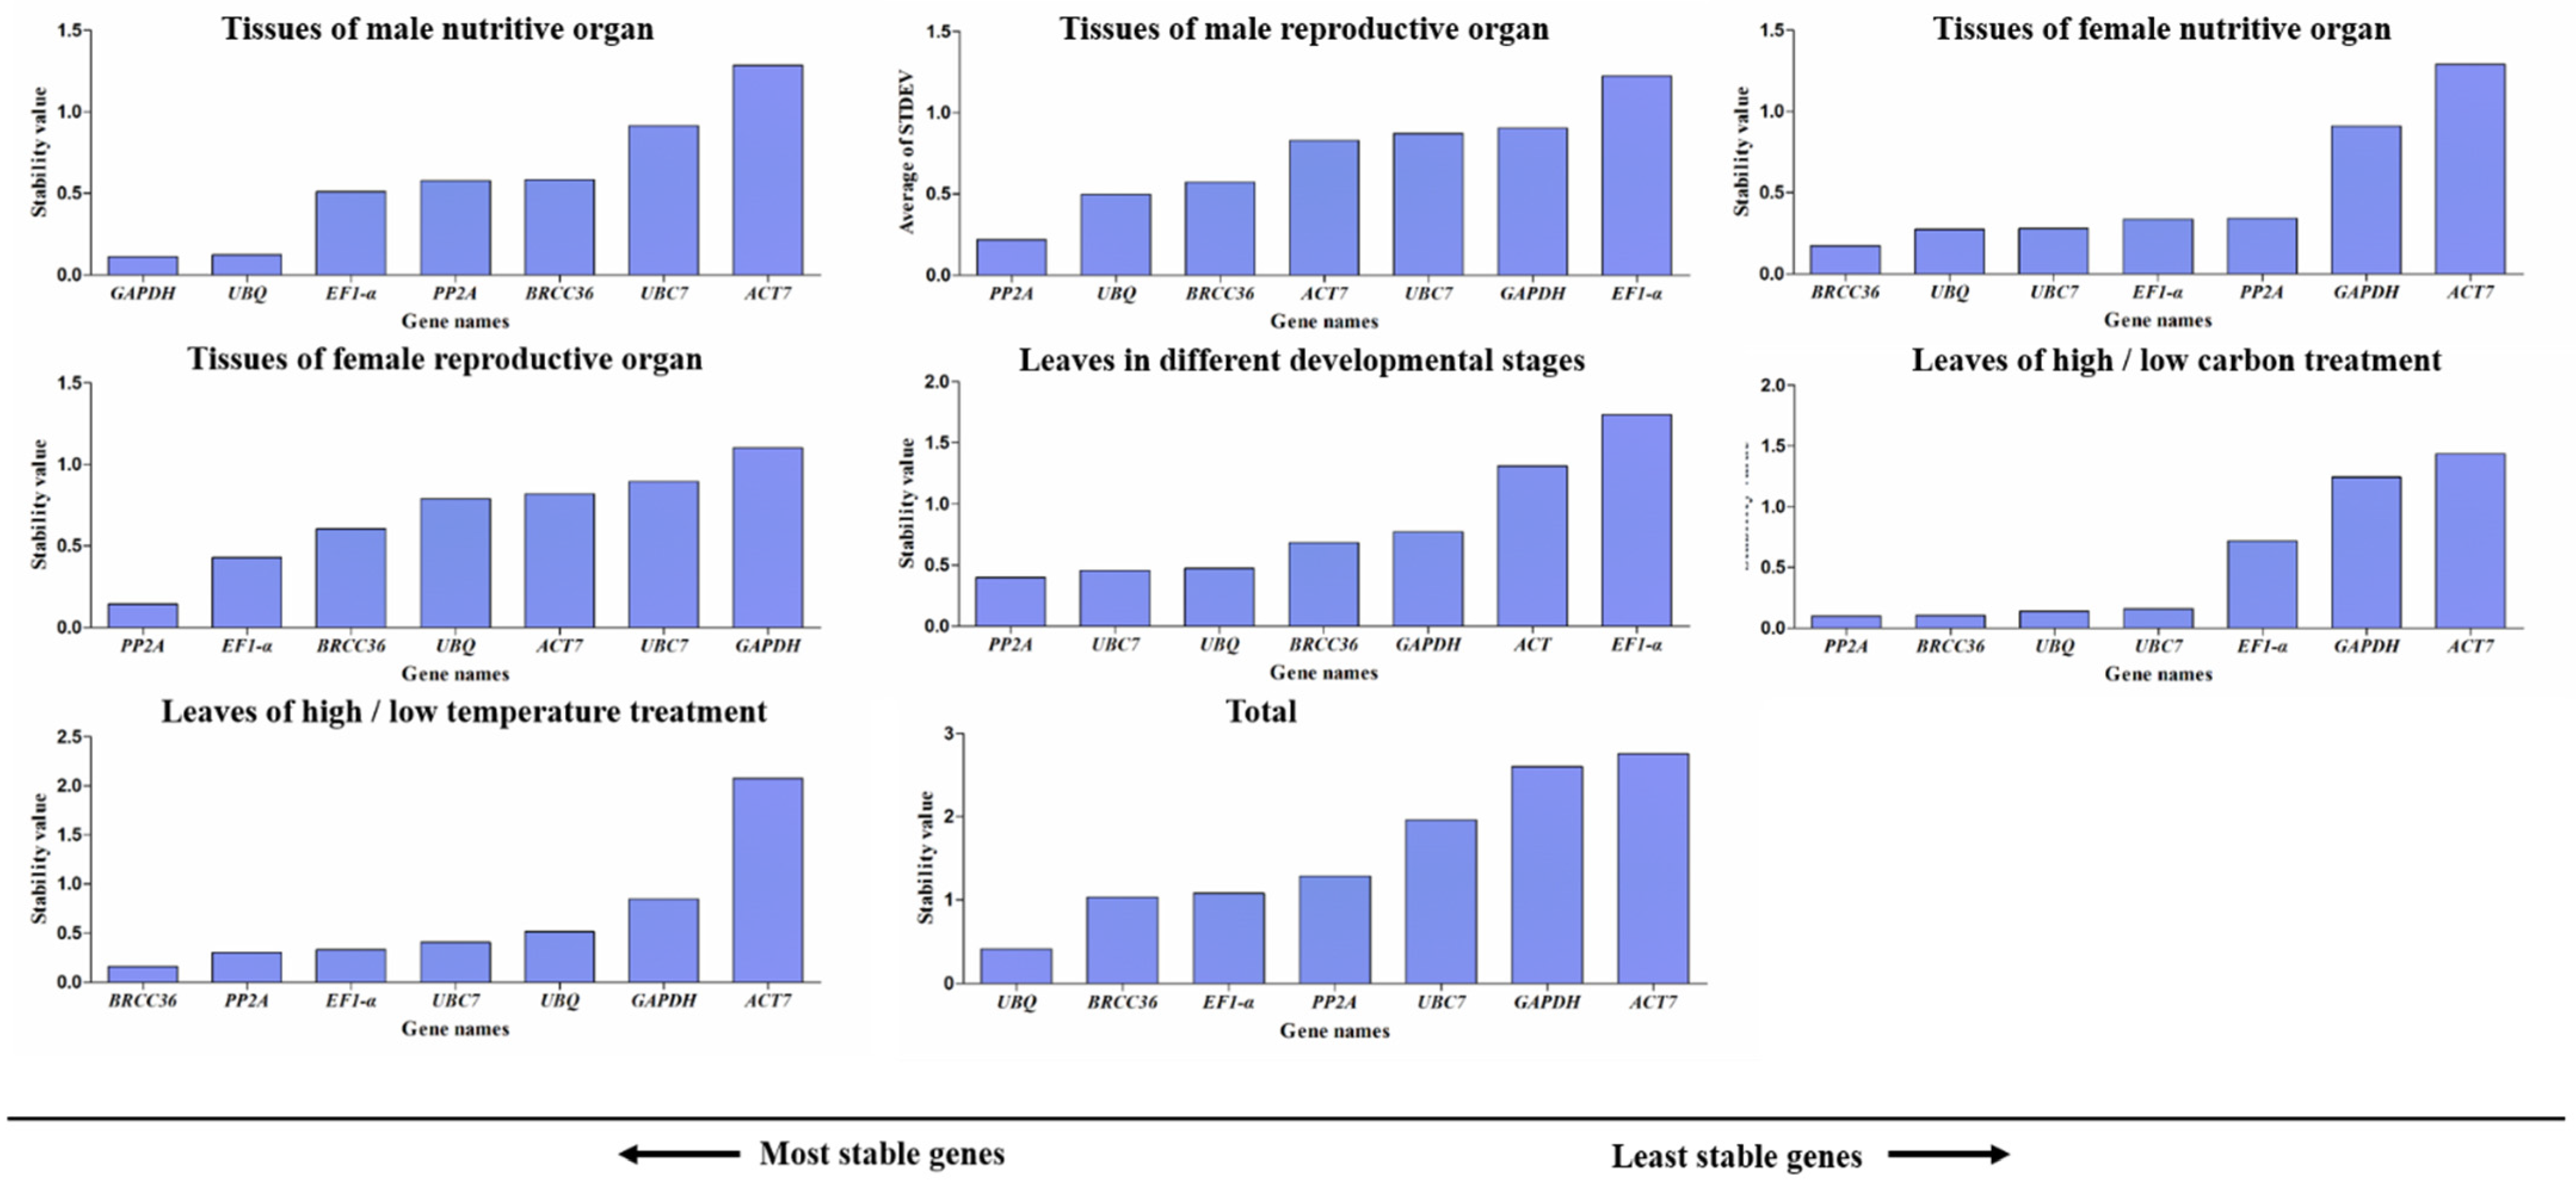
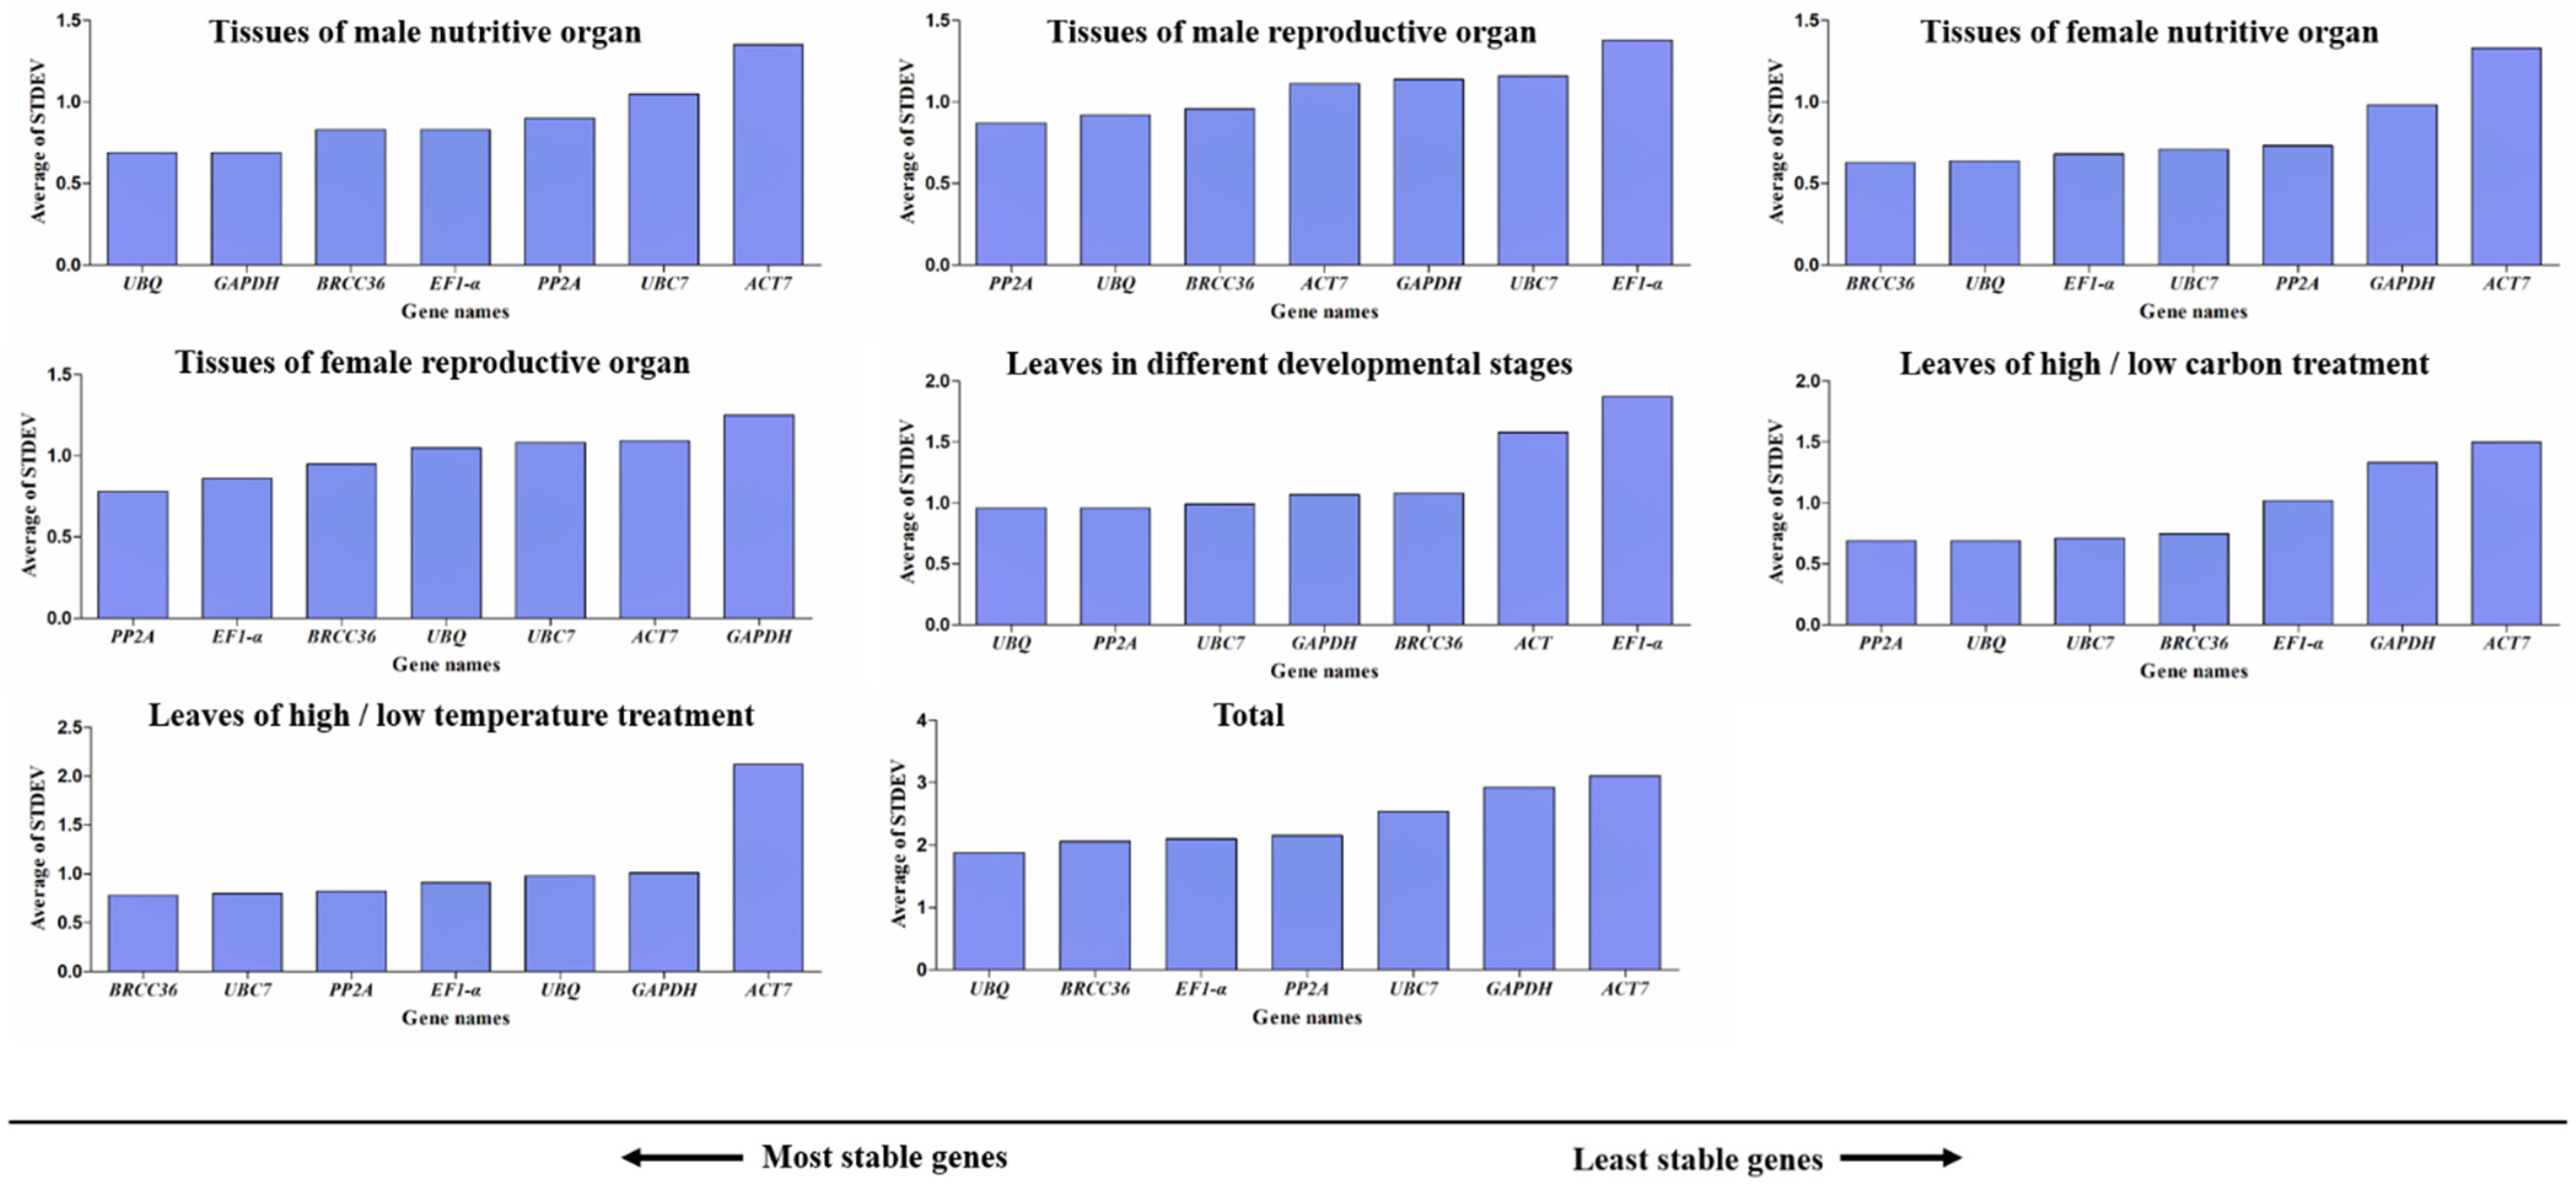
3.6. BestKeeper Analysis of Candidate Reference Genes

BestKeeper method was used to assess stability of candidate reference genes by calculating SD (standard deviation) and CV (coefficient of variation) based on Ct values. The trend of variation coefficient was consistent with that of the SD values [20]. Hence, the SD value was commonly utilized as the criterion for the stability of gene expression. In Figure 6, PP2A exhibited the highest stability in male nutritive tissues, male reproductive tissues, female reproductive tissues, and leaves in different developmental stages. PP2A was the most stable gene in male nutritive and reproductive tissues, female reproductive tissues, and all samples. ACT7 was the most stable gene in female nutritive tissues. BRCC36 was most stable in the high/low carbon treatment leaves. GAPDH was the most stable gene in high/low temperature treatment leaves. When considering a SD value below 1.0 as indicative of gene stability, our analysis of female nutritive samples identified ACT7 and PP2A as qualified reference genes, showing SD scores of 0.93 (n = 15) and 0.984 (n = 15), separately. The reference genes PP2A (SD = 0.276, n = 36), UBC7 (SD = 0.492, n = 36), UBQ (SD = 0.485, n = 36), BRCC36 (SD = 0.516, n = 36), and GAPDH (SD = 0.523, n = 36) can be utilized at various phases of leaf development. All genes could be used in male tissues and female reproductive tissues. In addition to ACT7, other genes could be used in high/low carbon and temperature treatment leaves.

3.7. Delta Ct Analysis of Candidate Reference Genes

The RefFinder program was used to observe the delta Ct method’s findings [21]. The most stable gene in male nutritive tissues, various leaf developmental phases, and all samples was UBQ, as Figure 7 illustrates. PP2A was the most stable gene in male and female reproductive tissues, high/low carbon treatment leaves. BRCC3 was the most stable gene in female nutritive tissues and high/low temperature treatment leaves. However, the results were different from all upper analysis.

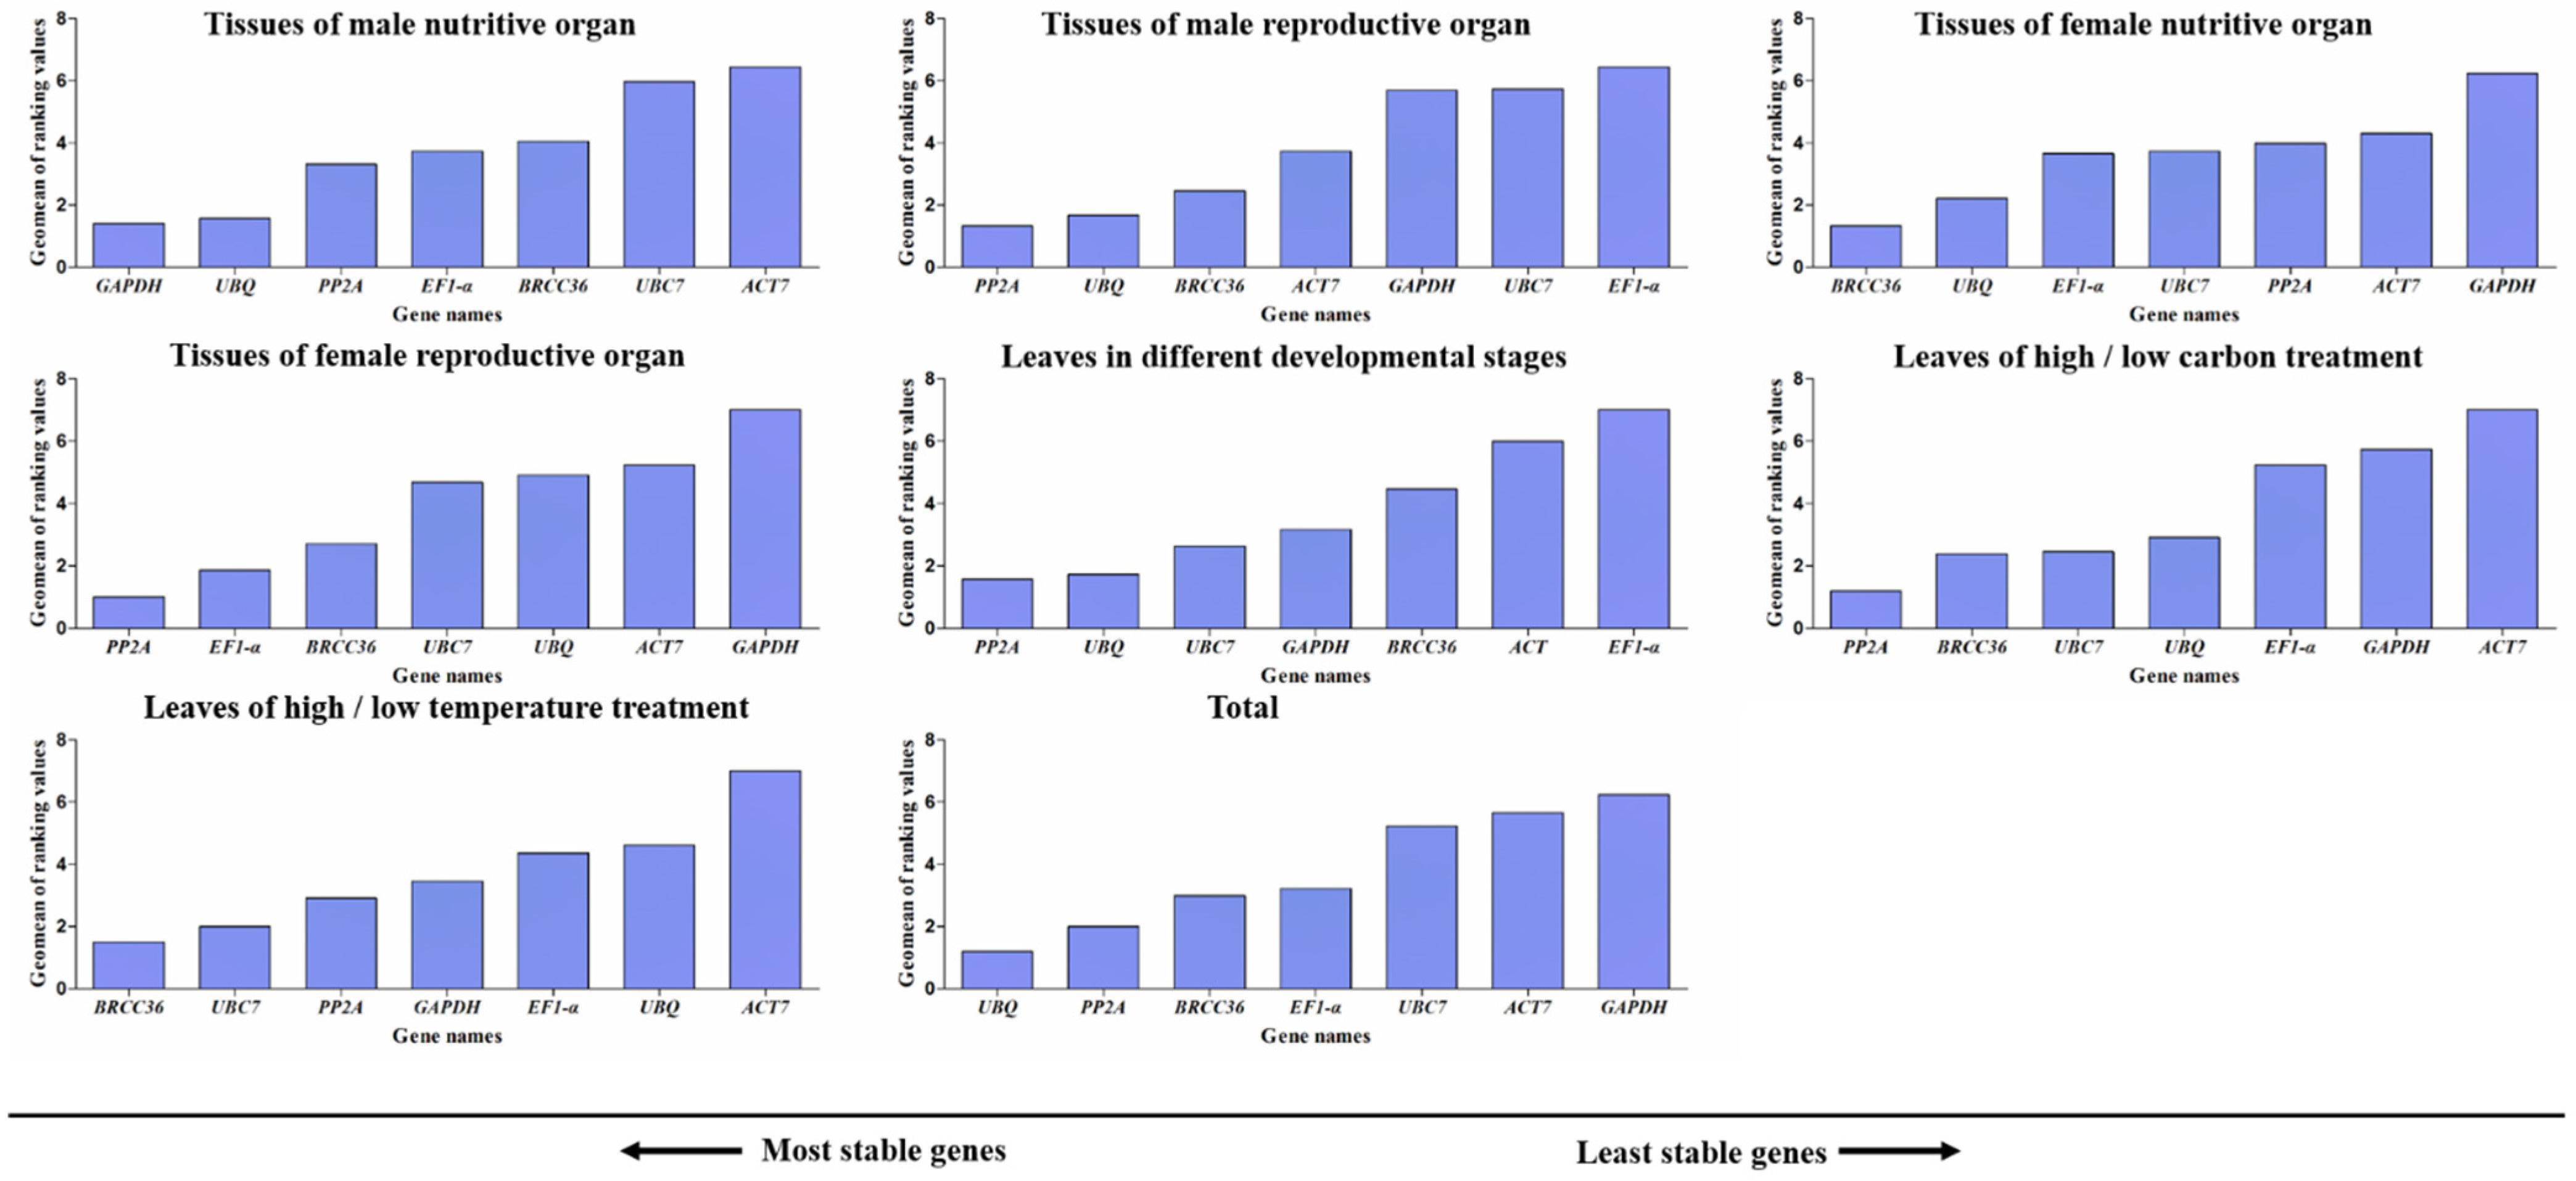
3.8. Comprehensive Analysis

Considering the potential confusion caused by various results obtained from different methods, we adopted comprehensive analysis by ReFinder (http://blooge.cn/RefFinder/) [21,22,23]. Based on the outcomes of each study, it would assign each gene a proper weight. The final overall ranking would then be obtained by computing the geometric mean of all of the weights. When examining male nutritive samples, GAPDH proved to be the most stable reference gene, displayed in Figure 8. BRCC36 was most stable in female nutritive tissues and high/low temperature treatment leaves. PP2A exhibited the highest stability in male reproductive tissues, female reproductive tissues, different developmental stages of leaves, and high/low carbon treatment leaves. Finally, UBQ was the most stable gene in all 47 samples.

3.9. Validation of Reference Genes

To validate the expression stability of the reference genes we obtained, the top two (PP2A, UBQ) and the least stable (GAPDH) were selected. Using qRT-PCR, the relative levels of expression of a crucial gene called pepc2, which is involved in C4 photosynthesis, were assessed in several leaves (Figure 9). As shown in Figure 9A, expression levels of pepc2 exhibited significant disparity between submerged leaves and floating leaves when normalized by PP2A and UBQ, which was consistent with RNA-Seq data. However, it was not significant when normalized by GAPDH. Moreover, the values of the mature stage were overstated when GAPDH was utilized to normalize the expression of pepc2 in the various developmental stages of submerged leaves. Overall, the expression pattern of pepc2 corroborated the findings of comprehensive analysis.

4. Discussion

In this work, seven candidate reference genes were selected from the transcriptome database. Based on FPKM value (File S1), ACT7, EF1_α, GAPDH, BRCC36, PP2A, UBC7, and UBQ were selected. All primer pairs showed single amplification peaks indicating high specificity (Figure 1). In both sexes, EF1_α exhibited the highest range of Ct values (27.17~30.799, 26.47~32.64), while UBC7 displayed the lowest distribution (14.03~18.99, 14.91~19.93) (Figure 2). It was suggested that EF1_α might be more suitable for genes with low expression levels, while UBC7 is more suitable for genes with high expression levels. All genes except ACT7 (18.88~24.32) showed narrower Ct ranges across leaf development stages. EF1_α (19.78~25.75) and UBC7 (11.35~14.52) corresponded to the lowest and highest expression levels, respectively. Under experimental treatments, the trend of Ct was similar, EF1_α (29.41~31.80 for high/low carbon, 29.71~32.09 for high/low temperature) and GAPDH (17.71~19.96 for high/low carbon, 19.67~20.51 for high/low temperature) had the lowest and highest expression levels, respectively. Ct value distribution could serve as a preliminary indicator of gene stability, although it may not be entirely rigorous [24]. Saraiva has assessed the stability of EF1_α family (6 members) in soybean. They all displayed a narrow variation but showed differences in various tissues. In trifoliate, unifoliate leaves and germinating seeds, the EF1_α family were less stable [25]. To minimize such methodological bias, integrated computational validation is required.
GeNorm, normFinder, bestkeeper, and comparative ΔCt were commonly employed to assess the stability of reference genes [18,19,20,21,22,23]. GeNorm relied on the algorithm of average pairwise expression ratios based on 2−ΔΔct method, an M value was ultimately obtained [18]. NormFinder relied on the analysis of ANOVA between groups and within groups based on 2−ΔΔct method, an S value was ultimately obtained [19]. Based on Ct values, bestkeeper evaluated the correlation coefficient and SD [20]. The results of the latter two could be used to correct the result from geNorm. The three approaches used in this investigation yielded varied rankings for the seven potential reference genes (Figure 3, Figure 4, Figure 5 and Figure 6). Comparative ΔCt method evaluates the stability of reference genes by counting the SD of ΔCt values [21]. By geNorm and bestkeeper analysis, PP2A and UBQ were the most stable genes for qRT-PCR normalization in total samples of O. cordata (Figure 3 and Figure 6). By normFinder and comparative ΔCt values analysis, UBQ and BRCC36 were the most stable gene (Figure 5 and Figure 7). This may be due to differences in calculation methods. Similar results were also observed in Dendrobium huoshanense [26], Nitraria tangutorum [27], and Papaver rhoeas [28]. Thus, we adopted a comprehensive analysis approach to calculate the geometric mean of the weights for all genes, thereby deriving the final ranking [3]. Our results indicated that PP2A and UBQ were found to be the top two suitable reference genes for expression studies in all tissues we analyzed in O. cordata (Figure 8). Additionally, it is worth noting that BRCC36, a deubiquitinase extensively studied in animals, has not been explored as a reference gene in other species [29,30]. BRCC36 acts as an oncogene in hepatocellular carcinoma, promoting cancer cell proliferation, migration, invasion, and tumor growth [17]. However, it showed a high specific and stable expression pattern in O. cordata.
Expression patterns of pepc2 were assessed by qRT-PCR in floating leaves, submerged leaves, and different developmental stages of submerged leaves (Figure 9), which is a key gene involved in C4 photosynthesis [7,8]. The top two stable genes (PP2A, UBQ) and the least stable gene (GAPDH) were chosen for Ct value normalization. When a single or a combination of reference genes was utilized as a reference gene, pepc2 expression levels increased dramatically in submerged leaves. This was consistent with the enzymatic activity results we determined earlier [7]. Moreover, the expression level of submerged leaves during the mature stage were overestimated when normalized by GAPDH. In order to avoid computational mistakes, we must select the most appropriate reference genes based on the target genes’ actual expression levels. Those results suggested that PP2A and UBQ were adequate for qRT-PCR analysis of leaf photosynthesis and development in O. cordata, and PP2A was identified as the most stable gene across all tissues.

5. Conclusions

The reference genes for normalizing qRT-PCR data in O. cordata were found in this work. In most samples, PP2A and UBQ were discovered to be the genes with the highest stable expression. The results of this study offer the initial information concerning reference gene identification for O. cordata as well as the first data in Hydrocharitaceae plants. It will make it easier to do more gene function and molecular biology research on O. cordata and other closely related species.

Supplementary Materials

The following supporting information can be downloaded at: https://www.mdpi.com/article/10.3390/horticulturae11030313/s1, Figure S1: Amplification curves of the seven candidate reference genes assessed across 39 developmentally distinct tissues of O. cordata; Figure S2: Agarose gel electrophoresis of the qPCR products. Figure S3: Leaves in different developmental stages. File S1: Sequences and FPKM values of genes in this study.

Author Contributions

L.Y. designed and supervised the research project. P.G. performed the experiments, analyzed the data and wrote the manuscript. R.L. helped with data collection. J.H. revised and edited the manuscript and provided advice on the experiment. L.Y. read and approved the final manuscript. All authors have read and agreed to the published version of the manuscript.

Funding

This research was funded by the National Natural Science Foundation of China [31860101].

Data Availability Statement

All data generated or analyzed during this study are included in this published article and its Supplementary Information Files. Sequence data that support the findings of this study have been deposited in the National Center for Biotechnology Information with the accession number PRJNA1197590.

Conflicts of Interest

The authors declare no conflicts of interest.

References

  1. Gadkar, V.Y.; Filion, M. New developments in quantitative real-time polymerase chain reaction technology. Curr. Issues Mol. Biol. 2014, 16, 1–6. [Google Scholar] [CrossRef] [PubMed]
  2. Guénin, S.; Mauriat, M.; Pelloux, J.; Van Wuytswinkel, O.; Bellini, C.; Gutierrez, L. Normalization of qRT-PCR data: The necessity of adopting a systematic, experimental conditions-specific, validation of references. J. Exp. Bot. 2009, 60, 487–493. [Google Scholar] [CrossRef]
  3. Udvardi, M.K.; Czechowski, T.; Scheible, W.R. Eleven golden rules of quantitative RT-PCR. Plant Cell 2008, 20, 1736–1737. [Google Scholar] [CrossRef] [PubMed]
  4. Zhang, Y.Z.; Yin, L.Y.; Jiang, H.S.; Li, W.; Gontero, B.; Maberly, S.C. Biochemical and biophysical CO2 concentrating mechanisms in two species of freshwater macrophyte within the genus Ottelia (Hydrocharitaceae). Photosynth. Res. 2014, 121, 285–297. [Google Scholar] [CrossRef] [PubMed]
  5. Bowes, G.; Rao, S.K.; Estavillo, G.M.; Reiskind, J.B. C4 mechanisms in aquatic angiosperms: Comparisons with terrestrial C4 systems. Funct. Plant Biol. 2002, 29, 379–392. [Google Scholar] [CrossRef] [PubMed]
  6. Bowes, G. Chapter 5 single-cell C4 photosynthesis in aquatic plants. In C4 Photosynthesis and Related CO2 Concentrating Mechanisms, 2nd ed.; Raghavendra, A., Sage, R., Eds.; Springer: Dordrecht, The Netherlands, 2011; Volume 32, pp. 63–80. [Google Scholar]
  7. Wang, S.; Li, P.; Liao, Z.; Wang, W.; Chen, T.; Yin, L.; Jiang, H.S.; Li, W. Adaptation of inorganic carbon utilization strategies in submerged and floating leaves of heteroblastic plant Ottelia cordata. Environ. Exp. Bot. 2022, 196, 104818. [Google Scholar] [CrossRef]
  8. Huang, W.; Han, S.; Xing, Z.; Li, W. Responses of leaf anatomy and CO2 concentrating mechanisms of the aquatic plant Ottelia cordata to variable CO2. Front. Plant Sci. 2020, 11, 1261. [Google Scholar] [CrossRef] [PubMed]
  9. Iversen, L.L.; Winkel, A.; Baastrup-Spohr, L.; Hinke, A.B.; Alahuhta, J.; Baattrup-Pedersen, A.; Birk, S.; Brodersen, P.; Chambers, P.A.; Ecke, F.; et al. Catchment properties and the photosynthetic trait composition of freshwater plant communities. Science 2019, 366, 878–881. [Google Scholar] [CrossRef]
  10. Maberly, S.C.; Gontero, B. Ecological imperatives for aquatic CO2-concentrating mechanisms. J. Exp. Bot. 2017, 68, 3797–3814. [Google Scholar] [CrossRef]
  11. Pedersen, O.; Colmer, T.D.; Sand-Jensen, K. Underwater photosynthesis of submerged plants—Recent advances and methods. Front. Plant Sci. 2013, 4, 140. [Google Scholar] [CrossRef]
  12. Yuan, G.; Li, Z.; Deng, J.; Pacheco, J.P.; Fu, H. Editorial: The performance and adaptation of aquatic plants under global changes. Front. Plant Sci. 2024, 15, 1380921. [Google Scholar] [CrossRef] [PubMed]
  13. Fuchs, G. Alternative pathways of carbon dioxide fixation: Insights into the early evolution of life? Annu. Rev. Microbiol. 2011, 65, 631–658. [Google Scholar] [CrossRef] [PubMed]
  14. Von Caemmerer, S.; Ghannoum, O.; Furbank, R.T. C4 photosynthesis: 50 years of discovery and innovation. J. Exp. Bot. 2017, 68, 97–102. [Google Scholar] [CrossRef]
  15. Hang, H.; Wu, Y. Quantification of photosynthetic inorganic carbon utilisation via a bidirectional stable carbon isotope tracer. Acta Geochim. 2016, 35, 130–137. [Google Scholar] [CrossRef]
  16. Bustin, S.A.; Benes, V.; Garson, J.A.; Hellemans, J.; Huggett, J.; Kubista, M.; Mueller, R.; Nolan, T.; Pfaffl, M.W.; Shipley, G.L.; et al. The MIQE guidelines: Minimum information for publication of quantitative real-time PCR experiments. Clin. Chem. 2009, 55, 611–622. [Google Scholar] [CrossRef]
  17. Wang, H.; Shu, L.; Lv, C.; Liu, N.; Long, Y.; Peng, X.; Ling, H.; Tao, T.; Tang, J.; Cheng, Y.; et al. BRCC36 deubiquitinates HMGCR to regulate the interplay between ferroptosis and pyroptosis. Adv. Sci. 2024, 11, e2304263. [Google Scholar] [CrossRef]
  18. Vandesompele, J.; De Preter, K.; Pattyn, F.; Poppe, B.; Van Roy, N.; De Paepe, A.; Speleman, F. Accurate normalization of real-time quantitative RT-PCR data by geometric averaging of multiple internal control genes. Genome Biol. 2002, 3, RESEARCH0034. [Google Scholar] [CrossRef]
  19. Sundaram, V.; Sampathkumar, N.; Massaad, C.; Grenier, J. Optimal use of statistical methods to validate reference gene stability in longitudinal studies. PLoS ONE 2019, 14, e0219440. [Google Scholar] [CrossRef]
  20. Chan, O.; Keng, B.; Ling, M. Correlation and variation-based method for identifying reference genes from large datasets. Electron. Physician 2014, 6, 719–727. [Google Scholar]
  21. Curis, E.; Nepost, C.; Laroche, G.; Courtin, C.; Laplanche, J.; Étain, B.; Marie-Claire, C. Selecting reference genes in RT-qPCR based on equivalence tests: A network based approach. Sci. Rep. 2019, 9, 16231. [Google Scholar] [CrossRef]
  22. Xie, F.; Xiao, P.; Chen, D.; Xu, L.; Zhang, B. miRDeepFinder: A miRNA analysis tool for deep sequencing of plant small RNAs. Plant Mol. Biol. 2012, 80, 75–84. [Google Scholar] [CrossRef] [PubMed]
  23. Xie, F.; Wang, J.; Zhang, B. RefFinder: A web-based tool for comprehensively analyzing and identifying reference genes. Funct. Integr. Genom. 2023, 15, 23, 125. [Google Scholar] [CrossRef]
  24. Ling, D.; Salvaterra, P. Robust RT-qPCR data normalization: Validation and selection of internal reference genes during post-experimental data analysis. PLoS ONE 2011, 6, e17762. [Google Scholar] [CrossRef] [PubMed]
  25. Saraiva, K.D.; Fernandes de Melo, D.; Morais, V.D.; Vasconcelos, I.M.; Costa, J.H. Selection of suitable soybean EF1_α genes as internal controls for real-time PCR analyses of tissues during plant development and under stress conditions. Plant Cell Rep. 2014, 33, 1453–1465. [Google Scholar] [CrossRef] [PubMed]
  26. Yi, S.; Lu, H.; Tian, C.; Xu, T.; Song, C.; Wang, W.; Wei, P.; Gu, F.; Liu, D.; Cai, Y.; et al. Selection of suitable reference genes for gene expression normalization studies in Dendrobium huoshanense. Genes 2022, 13, 1486. [Google Scholar] [CrossRef]
  27. Wang, B.; Duan, H.; Chong, P.; Su, S.; Shan, L.; Yi, D.; Wang, L.; Li, Y. Systematic selection and validation of suitable reference genes for quantitative real-time PCR normalization studies of gene expression in Nitraria tangutorum. Sci. Rep. 2020, 10, 15891. [Google Scholar] [CrossRef]
  28. Scarabel, L.; Milani, A.; Panozzo, S.; Rasori, A. Suitable reference genes for accurate gene expression analysis in Papaver rhoeas under 2,4-D herbicide stress. Pestic. Biochem. Physiol. 2017, 143, 66–72. [Google Scholar] [CrossRef]
  29. Zeqiraj, E.; Tian, L.; Piggott, C.A.; Pillon, M.C.; Duffy, N.M.; Ceccarelli, D.F.; Keszei, A.F.; Lorenzen, K.; Kurinov, I.; Orlicky, S.; et al. Higher-order assembly of BRCC36-KIAA0157 is required for DUB activity and biological function. Mol. Cell 2015, 59, 970–983. [Google Scholar] [CrossRef]
  30. Rabl, J.; Bunker, R.D.; Schenk, A.D.; Cavadini, S.; Gill, M.E.; Abdulrahman, W.; Andrés-Pons, A.; Luijsterburg, M.S.; Ibrahim, A.F.M.; Branigan, E.; et al. Structural basis of BRCC36 function in DNA repair and immune regulation. Mol. Cell 2019, 75, 483–497. [Google Scholar] [CrossRef]
Figure 1. Specificity verification by melt curve analysis of the seven candidate reference genes assessed across 39 developmentally distinct tissues of O. cordata. Each primer pair displayed a single peak at a specific annealing temperature. The (-Rn) value represents the raw fluorescence (F) versus temperature (T) values. Identical colours indicate reactions arranged in the same column of wells.
Horticulturae 11 00313 g001
Figure 2. Ct values of the seven candidate reference genes across 14 male plant tissues: root, submerged leaf, submerged petiole, floating leaf, floating petiole, flower petiole, flower stalk, sepal, petals, spathe, filament, anther, stamen, and bract; 13 female plant tissues: root, submerged leaf, submerged petiole, floating leaf, floating petiole, flower petiole, female sepal, female petals, female spathe, stigma, ovary, pistil, and style; different developmental leaves, low/high carbon treatment leaves, and low/high temperature treatment leaves of O. cordata. The box represents three biological replicates (±SD). Different letters indicate significant difference in the expression of the target gene based on three biological replications.
Horticulturae 11 00313 g002
Figure 3. Average expression stability values (M) of the seven candidate reference genes using the geNorm algorithm. “Total” represents a comparison across all leaves/tissues. The direction of the arrow represents the increase or decrease in gene stability; pointing left indicates decreasing stability, and pointing right indicates increasing stability.
Horticulturae 11 00313 g003
Figure 4. Pairwise variation (V) analyses of the seven candidate reference genes using geNorm algorithm. “Total” represents a comparison across all leaves/tissues.
Horticulturae 11 00313 g004
Figure 5. Expression stability values and ranking of the seven candidate reference genes using normFinder algorithm. “Total” represents a comparison across all leaves/tissues. The direction of the arrow represents the increase or decrease in gene stability; pointing left indicates decreasing stability, and pointing right indicates increasing stability.
Horticulturae 11 00313 g005
Figure 6. Expression stability values and ranking of the seven candidate reference genes using the bestKeeper algorithm. “Total” represents a comparison across all leaves/tissues. The direction of the arrow represents the increase or decrease in gene stability; pointing left indicates decreasing stability, and pointing right indicates increasing stability.
Horticulturae 11 00313 g006
Figure 7. Expression stability values and ranking of the seven candidate reference genes by delta Ct method. “Total” represents a comparison across all leaves/tissues. The direction of the arrow represents the increase or decrease in gene stability; pointing left indicates decreasing stability, and pointing right indicates increasing stability.
Horticulturae 11 00313 g007
Figure 8. Expression stability values and ranking of the seven candidate reference genes by comprehensive analysis. “Total” represents a comparison across all leaves/tissues. The direction of the arrow represents the increase or decrease in gene stability; pointing left indicates decreasing stability, and pointing right indicates increasing stability.
Horticulturae 11 00313 g008
Figure 9. Normalizing expression level of pepc2 in floating/submerged leaves (A) and different developmental stages of submerged leaves (B). Different letters indicate significant difference in the expression of the target gene based on three biological replications [p < 0.05, t-test (A), one-way ANOVA (B); n = 3]. (***, p < 0.001; ns, p > 0.05. t test).
Horticulturae 11 00313 g009
Table 1. Primers sequences and amplicons characteristics of candidate reference genes.
GenesGene DescriptionForward Primer (5′-3′)Reverse Primer (5′-3′)Length (bp)Efficiency (%)R2
ACT7actin 7CCCTTTGGAGCATTCGGCCCTCGGAGCATCAT136103.30.997
EF1_αelongation factor 1-alphaGAAGCACTGCCAAAGGGGAAGCAACGGAAGAT13794.20.990
BRCC36lys-63-specific deubiquitinase BRCC36CCACCGAGACCGAAGACCAGATTAGAGCGACAGG8396.70.993
PP2Aserine/threonine protein phosphatase 2AGCAGTCCAGAGCCTAACACTCCAGCCGCTTCCAAAT14899.90.999
GAPDHglyceraldehyde-3-phosphate dehydrogenaseAGGTCACCGTCTTTGGAAACGAACATGGGAGCAT179103.20.999
UBC7ubiquitin-conjugating enzyme E2 7AGATAGGCGGGATGAGTTTGACCTGCTTTACATTAGACA17690.10.999
UBQE3 ubiquitin-protein ligase RNF167GCGTCTTCGCATTCAGTTCACAAGCCAACAGC270101.30.998
Disclaimer/Publisher’s Note: The statements, opinions and data contained in all publications are solely those of the individual author(s) and contributor(s) and not of MDPI and/or the editor(s). MDPI and/or the editor(s) disclaim responsibility for any injury to people or property resulting from any ideas, methods, instructions or products referred to in the content.

