1. Introduction
Watermelon selection places individuals under pressure due to an inability to taste a slice in advance. Consequently, watermelon quality is often inspected by its outer characteristics, patterns, and audible perceptions. Common intuitive methods include inspecting the strips, color, sound, shape, size, surface defects, and tail characteristics. The patterns derived by using these characteristics are occasionally proven to identify a watermelon’s quality. Nevertheless, tiny details, day-to-day mood, or sensation characteristics may often prevent the selection of a high-quality watermelon.
In the literature, two views were featured to inspect the characteristics of watermelon: the internal quality and external quality. The size, color, texture, and surface flaws are among the attributes used to assess the exterior quality of watermelons [
1]. In the meantime, indices, including soluble solids, sugar, acidity, sweetness, and firmness, are frequently used to evaluate internal quality. It is customary to use the visual inspection method with a personal form to detect the exterior qualities, but this approach is expensive, time-consuming, and non-standard [
2]. Refractometry, a Potentiometric reference method, high-performance liquid chromatography, and Magness–Taylor penetration [
3] are the methods used to measure the soluble solids content (SSC), total acid content (TAC), sugar content, and firmness, respectively. At the moment, these techniques are the accepted way to gauge internal quality. Nevertheless, the conventional methods of detection are localized, labor-intensive, and damaging. According to Menezes Ayres et al. [
4], fruit ripeness is the most important all-encompassing quality measure for growers, retailers, and consumers, as it is associated with both internal and external quality traits.
While traditional methods for selecting high-quality watermelons remain common, several researchers have pioneered the use of image analysis techniques in conjunction with these methods. These scholars have applied these techniques in three distinct areas: machine vision (MV), visible/near-infrared spectroscopy (Vis/NIRS), and hyperspectral imaging (HSI).
MV is particularly effective for assessing the exterior quality of watermelons due to its ability to capture rich phenotypic information, such as shape, color, and texture [
5]. A typical MV detection system comprises a computer, a light source, a tray, and a camera. The light source can be either strip lighting or bulbs, which are symmetrically positioned around a dark box to minimize shadows. The advantages of MV technology include its low cost, user-friendly operation, and rapid data processing speed, making it an excellent choice for developing an online fruit quality detection system.
A number of researchers have investigated the possible use of Vis/NIRS in the quality detection of watermelons. A composite measure that has raised issues is ripeness. Jie et al. [
6] tested a novel method called the peak ratio for the four-class ripeness (unripe, medium-ripe, ripe, and overripe) classification of watermelons, which included the peak intensity ratio and the normalized difference intensity of peaks. They discovered that the Vis/NIR transmission spectra of watermelons with different ripeness had two prominent peaks at around 730 and 803 nm. The best results were obtained with a classification accuracy for prediction (ACC
P) of 88.10% when the peak intensity ratio was optimized using a correction factor based on the categorization boundary. To evaluate the watermelon’s ripeness, Lazim et al. [
7] and Vega-Castellote et al. [
8] used support vector machine (SVM) and partial least squares discriminant analysis (PLS-DA) models, respectively. The texture attribute is one of the main ripeness assessment indices. In order to maximize feature extraction, Khurnpoon and Sirisomboon [
9] conducted a study to identify the texture attributes (initial firmness, rupture force, average firmness, rupture distance, toughness, average penetrating force, and penetrating energy) of netted muskmelons using PLS.
In the 400–1100 nm spectral range, studies employing HSI with a diffuse reflection mode typically provide good performances. Previous research by Ma et al. [
10] looked at the use of HSI to measure the SSC and hardness of Hami melons. According to the prediction results, firmness and the SSC had a coefficient of determination for prediction (R
2P)s of 0.42 and 0.50 for the PLS models without spectral feature extraction, respectively. These values were initiatory and not acceptable. The HSI data are massive and include unrelated information. The best wavelengths must be chosen in order to reduce superfluous data and enhance model performance. Sun et al. [
11] looked at the PLS to identify the internal quality of Hami melons and the genetic algorithm, successive projections algorithm (SPA), and competitive adaptive reweighted sampling (CARS) for choosing the best wavelengths. The CARS-PLS model performed the best, according to the data, with an R
2P s of 0.92 for the SSC, 0.83 for TAC, and 0.75 for firmness. Furthermore, Jing-tao et al. [
12] conducted a study to determine the quality of Hami melons. They found that CARS-SPA-SVM produced the best R
2P values of 0.88 and 0.68 for the SSC and firmness prediction, respectively, and that CARS-PCA-SVM produced a good model with an ACC
P of 94.00% for ripeness.
The majority of research has been on using conventional machine learning models—which have already proven effective in the quality detection of watermelons—to analyze spectra, photos, and acoustic vibration signals. However, the drawback of these approaches is that they rely on human labor and past expertise for feature engineering. Comprehensive deep learning algorithms offer a proficient approach to analyzing the data produced by optical and acoustic vibration sensors, as demonstrated by their effectiveness in some MV and Vis/NIRS investigations. Furthermore, the ability to generalize presents another difficulty for the widespread use of conventional machine learning models in practice. Guo et al. [
13] suggested using auto-encoder neural networks in conjunction with the Internet of Things to transfer the NIR model for identifying an apple’s SSC and enhancing model portability. The outcomes offered a point of reference for enhancing the quality detection models for watermelon’s generalization. While deep learning models have been applied to the analysis of acoustic vibration signals from fruit, including oranges [
14] and apples [
15,
16], more research is needed to fully explore the potential of these models for acoustic vibration-based watermelon quality detection. Furthermore, it is mentioned that using deep learning for the quality identification of watermelons still presents challenges due to the need for huge datasets and interpretable models. It is challenging to gather a significant amount of information about the acoustic and optical vibrations of various samples in a single experiment. Data augmentation techniques, like the Imgaug data enhancement library [
17] for creating images of Hami melon surface defects and deep convolutional generative adversarial networks [
18] for creating shortwave infrared spectra of pesticide residues on the Hami melon’s surface, have been proposed as solutions to this problem. For data-driven deep learning models, it is important to pay more attention to how to guarantee that the generated data are accurate and close to reality.
The selection of watermelons and the determination of certain standards affects both buyers and sellers from different perspectives. Buyers usually judge the quality of the watermelon according to the criteria of juiciness, crispiness, sweetness, and freshness. Therefore, they want to buy the optimal average watermelon that takes all the characteristics into account. Sellers, on the other hand, focus on maximizing their profits and the highest sales volume. From both points of view, it is important to determine the quality of the watermelon more precisely based on various quality-related characteristics without damaging the fruit.
There are numerous non-destructive methods, as mentioned earlier, such as acoustic analysis, optics, X-ray imaging, ultrasonics, near-infrared spectroscopy, Raman spectroscopy, hyperspectral imaging, magnetic resonance imaging, and optical coherence tomography to determine the optimal harvest time for watermelon [
19]. However, these laboratory and production line quality estimation methods cannot be applicable by customers to make a real-time decision at the market level.
Therefore, this study aims to test and determine novel, non-destructive, generative artificial intelligence (AI)-based tools for selecting high-quality watermelons by analyzing the photos of customers that were taken at the retail shelf using prompt engineering principles. The following hypotheses were formulated to test whether the intended objectives were met. (1) ChatGPT GPT-4o version can accurately assess the ripeness and quality of watermelons from smartphone photos, and (2) there is a significant correlation between selection by ChatGPT and consumer perception.
The remainder of this paper is structured as follows:
Section 2 presents the materials and methods, followed by
Section 3, which outlines the results.
Section 4 provides a detailed discussion of the findings, and
Section 5 concludes the study.
2. Materials and Methods
2.1. Experimental Materials and Selection Methodology
The images were taken with basic smartphones owned by the partners in natural lighting conditions on the shelf as though they were from a usual customer’s point of view. The smartphone model used was the Samsung Galaxy A50 (Seoul, Republic of Korea), and it has 3 cameras on the back side, which have 25 MP, 8 MP, and 5 MP resolutions. The apertures for the cameras are F1.7, F2.2, and F2.2. The first camera was the main camera for the photograph, while the second camera offered an extra wide angle, and the third camera offered depth perception. The photographs were captured in the afternoon under optimal sunlight conditions, ensuring the best illumination to highlight the watermelon’s features. Three pictures were taken per shelf, positioned at the top, middle, and bottom, taking into account the following considerations: capturing pictures during daylight hours, focusing on as many watermelons as possible, avoiding an immediate movement of the camera after capturing the picture, and positioning the camera so that sunlight does not shine directly on it. For this study, images representing a diverse real scenario, ensuring no blurriness or distortion according to the Variance of the Laplacian method, were selected, capturing different positions of the camera, featuring different varieties, using the screen to reveal hidden watermelons, and capturing objects resembling watermelons.
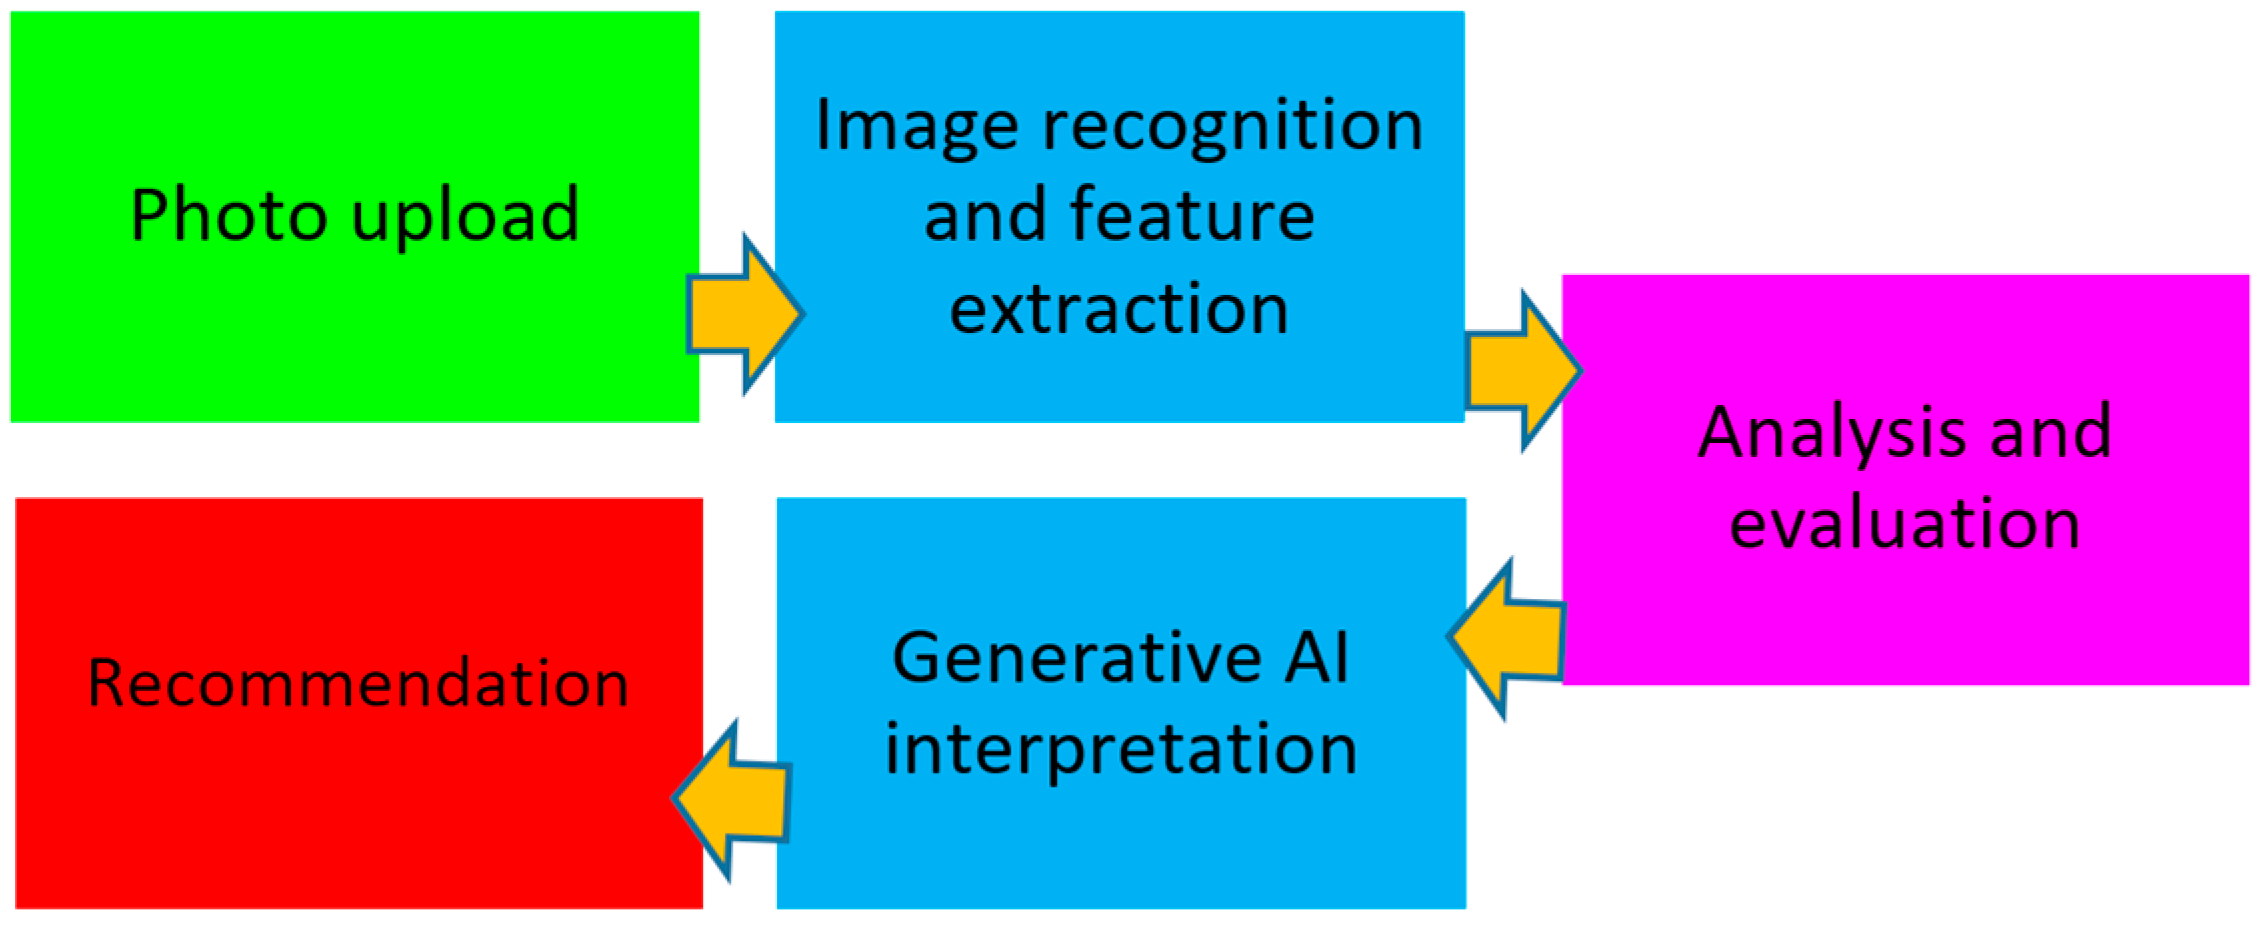
This study used the most pervasive and pioneer generative AI tool, named ChatGPT, in its GPT-4o version. Although it started as merely a chatbot tool, ChatGPT added image and video recognition tools, as well [
20]. This study investigates the accuracy of image recognition tools in watermelon cases. There are five steps taken to investigate the quality of watermelons in ChatGPT: photo uploading, image recognition and feature extraction, analysis and evaluation, generative AI interpretation, and user feedback. The flowchart of processes in ChatGPT is shown in
Figure 1.
When a photo is uploaded, it starts the image analysis process. This involves recognizing and extracting features from the image, such as the color, shape, size, texture, and patterns. The extracted features are then analyzed based on predefined criteria involving the color, shape, size, texture, and patterns. A generative AI interprets the results, integrates the findings, and generates output in the form of text and a score. Finally, feedback is generated for the user based on the output.
The image recognition model architecture in ChatGPT relies on convolutional neural network (CNN) architecture. The CNN consists of the input layer, convolutional layers, pooling layers, fully connected layers (dense layers), and an output layer. In the input layer, the image is resized (e.g., 224 × 224 pixels) and normalized. On the other hand, the convolutional layer consists of filters that scan the image to detect the edges, colors, and textures. The early convolutional layers detect low-level features like color patches and texture, while deeper convolutional layers detect high-level features like shape, symmetry, and field spots. The pooling layers reduce dimensionality while preserving key features. Fully connected layers classify images into categories as good or bad watermelon by using softmax activation probability scores. Lastly, the output layer produces a classification label as either best or worst and highlights the watermelon in the image. The parameters that affect the model performance are the kernel size, stride, activation functions, number of layers, and dropout rate.
- -
Select best watermelon. Give coordinate. (Attached photograph);
- -
Select worst watermelon. Give coordinate. (Attached photograph).
The AI evaluates the color by analyzing the pixel distributions and hue variations, detecting ripeness indicators, such as deep green rinds or yellow ground spots, and aligning with human assessments, where deeper yellow spots suggest longer ripening periods. Shape and size recognition rely on comparing the geometric properties to identify uniformity and symmetry, as irregular shapes can indicate uneven ripening or internal defects. The texture is inferred through surface pattern recognition, where the generative AI analyzes fine-grained details such as vein networks, surface smoothness, or rough patches using edge detection and contrast analysis. In human sensory evaluation, rough or overly shiny surfaces may be associated with under or overripeness. Pattern recognition enables the model to assess striping intensity and uniformity, which often indicate variety-specific ripeness, with well-defined and evenly distributed stripes suggesting optimal growth conditions.
2.2. Sensory Evaluation
The experts used for the watermelon quality assessment were selected in terms of their experience in farming and selling watermelons in the past. The watermelons, both of high quality and low quality, were selected from photographs taken of the store uploaded to ChatGPT.
The taste panel conducted sensory tests that were performed according to ISO 13299 standards by two different groups: Case Study I and Case Study II consisted of 20 and 39 selected panelists from students and faculty members, and each member of the panel was informed about the experiment and trained according to the standard after they agreed to conduct it [
21]. The selected watermelon from the best and least groups was sliced into small pieces, and the panelist assessed the quality of the watermelon based on the crispiness [
22], juiciness [
23], sweetness [
24], and freshness [
23] characteristics. The panelists randomly tasted watermelon from two selected groups and were informed of the scoring procedure prior to the test, and all scores were based on the strongest sensation they had ever felt; according to ISO 8589, ratings from 0 to 5 for all attributes indicate an increase in the intensity of consumer perception of the attribute [
25].
2.3. Data Analysis
All variable sizes are equal, and there are two groups. This study used Shapiro–Wilk’s W test in order to check the normality of the samples. For those variables that had a normal distribution, a paired t-test was applied; for others, the Wilcoxon signed rank test was conducted. The level of significance was determined as 0.05.
4. Discussion
The findings of this experimental study implicate that the watermelon selection on quality characteristics can be guided by novel generative AI tools such as ChatGPT. This study found that the generative AI senses using only outside characteristics such as shape, size, color, texture, and patterns are adequate to decide the inner quality. The experts from two case studies graded, from their perspectives, the crispiness, juiciness, sweetness, and freshness characteristics. The experts’ comparison between the best watermelon and the worst watermelon selected by ChatGPT is also compatible.
On the other hand, since the watermelons are already preselected before being placed on the shelf, the variations are low among the quality levels of watermelons. It is usually expected that shelves are organized to allure potential customers with the best-looking and highest-quality goods in the store. Therefore, the possibility of being exposed to rotten watermelons is quite low in a store. The results also show that the overall grades of best-selected and least good selected watermelons are close to each other. When the tips are taken into account for watermelon selection, such as shape, size, color, and acoustics, the human inspection of all the watermelons gives similar results to each other with minor differences.
Although image processing applications can be used to select the best watermelon, they are advanced solutions that require scientific knowledge. However, customers and sellers often do not have artificial intelligence solutions knowledge and they want to select in the least amount of time. In November 2022, OpenAI published ChatGPT, a large language model (LLM) designed to have a conversation with a user that is human-like. With only human language prompting, ChatGPT can perform remarkable characteristics for a wide range of activities at a previously unheard-of level [
27]. Beyond ChatGPT, there has been an active investigation into the possibilities of LLM applications for particular contexts in science, technology, and society, such as agriculture [
28] and plant science [
29]. Therefore, the integration of generative AI technology into plant science would provide a competitive advantage to watermelon merchants and accurate estimation for purchasers.
The results also indicate that although ChatGPT favored one watermelon, some experts gave low points in terms of their evaluation. This phenomenon was observed in both case studies. However, on average, significantly, the best watermelon was selected by the experts. The experts’ mood could explain this concept regarding their sense of sweetness, juiciness, crispiness, and freshness criterion, as well as their perception of the watermelon’s quality and low visual variations in the watermelons on the store shelf.
Subtle differences in the results between the two experiments could stem from several distinct factors. Sensory perception varied among the evaluators due to individual differences in taste sensitivity, experience, and biases. Since different panels of experts were used in each experiment, their subjective judgments might have influenced the statistical results, leading to discrepancies in the significance levels. Furthermore, the way the tests were conducted—such as the differences in timing, order of evaluation, or even slight variations in instructions—could contribute to inconsistencies in the results. In addition, statistical variability plays a role; while both experiments used the Wilcoxon rank sum and paired t-tests, small differences in sample sizes, distribution characteristics, or the way data were processed could influence whether significance was detected. Another point is the randomness in human perception and response variability, which can introduce inconsistencies, even when following the same methodology, leading to slight but notable differences in the statistical outcomes.
This study was conducted by way of two experiments with 20 and 39 experts, respectively, and the results are limited to their perceptions. Furthermore, the Crimson Sweet watermelon type was used in both experiments in order to ensure consistency. Crimson Sweet is the world’s most widely cultivated and consumed watermelon, prized for its exceptional taste and popularity among growers and consumers alike. The evaluation of watermelon was conducted in only ChatGPT and the watermelon quality results may change in other generative AI tools. In addition, the accuracy of the generative AI outputs is constrained by the quality of the image and the specific type of watermelon that has to be captured in the store. Another limitation is related to AI misjudgments. The model’s selection process is likely influenced by the visual features it was trained to recognize. While AI can detect external characteristics such as color, texture, shape, and surface imperfections, it lacks direct access to internal qualities like sweetness and crispiness, which require sensory input beyond visual analysis. This could lead to instances where AI selects a watermelon that appears ideal but does not meet taste expectations. Additionally, AI relies on pre-trained datasets and patterns from previous images, which may not perfectly align with real-world variabilities in watermelon quality. Factors such as lighting conditions, image resolution, and the angle of photography may also impact AI predictions, leading to occasional misjudgments. In the future, the results of this study can be extended and further compared to other fruits and vegetables.


