Article

Magnetic-Water-Enhanced Tomato Yield and Antioxidant Response Under Arid Conditions of South Tunisia

1
Regional Center for Agricultural Research of Sidi Bouzid (CRRA) PB 357, Sidi Bouzid 9100, Tunisia
2
Department of Horticultural Sciences and Vegetable Crops, High Institute of Agronomy of Chott Mariem, University of Sousse, Sousse 4042, Tunisia
3
Laboratory of Legumes and Sustainable Agrosystems, Center of Biotechnology of Borj-Cedria, (L2AD, CBBC), PB 901, Hammam-Lif 2050, Tunisia
4
National Institute of Agronomy of Tunisia, Tunis 1082, Tunisia
*
Author to whom correspondence should be addressed.
Horticulturae 2025, 11(3), 301; https://doi.org/10.3390/horticulturae11030301
Submission received: 9 December 2024 / Revised: 9 January 2025 / Accepted: 24 January 2025 / Published: 10 March 2025
(This article belongs to the Section Biotic and Abiotic Stress)

Abstract

:
The current applied research evaluated the impact of magnetic water on agronomic and physiologic responses of tomatoes. The field experiment consisted of the irrigation of a 1000 m2 tomato plot with two water treatments (NMW = non-magnetized water; MW = magnetized water) and three tomato varieties (Dorra, Ercole, and Gladys). Biomass accumulation, yield, physicochemical quality traits, osmoticums, antioxidant enzymes, and the transcript level of defense-related genes were analyzed. Results showed that MW treatment showed 32%, 53%, and 57% yield increase in Dorra, Ercole, and Gladys, respectively. Dorra and Gladys were, respectively, the highest and the lowest yielding varieties. MW was effective in enhancing the irrigation water use efficiency (IWUE) and irrigation water productivity (IWP). Plants grown under MW had less catalase (CAT), guaiacol peroxidase (GPOX), super oxide dismutase (SOD), and ascorbate peroxidase (APX) activities, and hydrogen peroxide (H2O2) level. The reducedproline and soluble sugar content (SSC) accumulation in MW treatment indicate a reduced osmotic reaction. The upregulation of SlAPX in Gladys and SlSOD in Dorra and Ercole with MW had positive impacts on growth regulation and reduction in oxidative damage. The results clarified the roles of MW and its rule mechanisms in tomato, giving more theoretical foundation for physical water treatment in the agricultural sector.

1. Introduction

Tomato (Solanum lycopersicum L.), is the second most produced vegetable fruit crop in the world, with 177 million metric tons of global production [1].Tomatoes have relevant participation in human diet, and they are consumed fresh and processed into a wide range of manufactured products [2]. In Tunisia, tomatoes are cultivated year-round, and occupy 37% of the vegetable crops [3]. Tomato crops cover around 25,000 ha, with 1.3 million tons/year of production according to FAOSTAT [4], thus placing Tunisia among the top ten tomato-producing countries (from June to October) [3]. However, water constitutes the main limiting constraint for crop development in arid and semi-arid areas, as is most of Tunisia. Yacoubi et al. [5] reported that the optimization of water use efficiency is becoming a pivotal issue for increasing agricultural productivity, improving food security, and ensuring the sustainability of water resources.
It is recognized that tomato fruit quality attributes, interrelated to other growth, antioxidant, and osmotic adjustment mechanisms, vary greatly with the level and quality of irrigation water [6,7,8,9]. Furthermore, pomological attributes like fruit firmness, pH, titratable acidity, soluble solids, and the level ofproline, vitamin C, and lycopene, are dependent of the cultivar [10]. Additional factors influencing those variables are environmental conditions, water supply, water usage efficiency, fertilization, and soil quality [11].
In the areas where the amount and distribution of rainfall are not sufficient to sustain crop growth and development, farmers frequently increase the amount of irrigation water, which leads to wastewater and disturbance of the balance between water supply and water demand [10,12]. Indeed, the overload of water in irrigation increases nitrogen leaching and soil salinization [13]. Xiukang et al. [14] advanced that an excess of water promotes excessive accumulation of biomass in tomato plants, reducing therefore the yield. On the other hand, water deficit causes nutrient deficiency and hampers biomass accumulation and yield [15]. Likewise, improving water productivity and usage efficiency constitute main strategies for crop improvement in arid and semi-arid areas [7]. Halimi and Tefera [16] stated that the adoption of alternative approaches to satisfy crop water requirements via irrigation is very much required. Recent reports are further oriented towards judicious application of irrigation water, which controls different aspects of water supply [11,17]. Analogous reports focusing on water irrigation argued that effective estimation of crop water requirements and suitable determination of irrigation scheduling and evapotranspiration are key elements of sustainable water management [7,13]. Oke et al. [18] proved that an appropriate irrigation frequency can balance soil moisture content and oxygen concentration within the root zone. This enables better plant development, higher yield, and enhanced water use efficiency (WUE).
Computer-based simulation models are being used at a high frequency in the agricultural sector [7,8,16]. It was proved that these models increase the efficiency of decision making, optimize irrigation water management, allow combined assessment of various factors affecting the crop yield, and find optimal irrigation in different climatic scenarios [17,19]. CROPWAT 8.0 is a decision-support program for the calculation of crop water requirements and irrigation supplies based on soil, climate, and crop data, developed by the Land and Water Development Division of FAO [20]. CROPWAT software could be used to evaluate irrigation practices and crop productivity [21], and to calculate crop evapotranspiration in different climatic conditions [22].
Further reports cope with efficient ecofriendly technologies for improving water quality and crop productivity without harming the environment. Magnetic water treatment is one such area. A review of the literature demonstrates that water can be magnetized when exposed to magnetic fields [23,24]. Magnetic field applications have been shown for centuries to have several benefits on water [25], plants [26], and soil [27]. Water magnetization has also advanced in diverse fields, including irrigation, plant growth [28,29], wastewater treatment [30], saline water treatment [23], root growth [31,32], and plant productivity [24]. The impacts of magnetically treated irrigation water have also been reported on improving maize seed germination under different salinity levels [31]. Apart from these findings, a decrease in soil electrical conductivity [33], nutrient mobility [34], and water holding capacity of soil [35], and reduction in water viscosity [36], were observed. Tomato seeds irrigated with magnetized water and magnetized seeds irrigated with magnetized water treatments have been shown to mitigate water deficit effects on tomato growth, water relations, proline accumulation, and photosynthetic pigments [37]. Likewise, the negative effects of magnetic fields on the root growth of various plant species were also noticed [38,39]. Gabrielli et al. [40] reported that the influence of magnetically treated water depends upon the plant species, the pathway length in the magnetic field, and the flow rate.
Different reports have focused on the effect of magnetic water and irrigation frequency in tomato crop, although both approaches were studied disjointedly. In order to obtain enhanced tomato yield and fruit quality, with effective irrigation scheduling and better water quality in the arid regions of Tunisia, the usage of physical water treatment method coupled to efficient model estimating tomato water requirements would be desirable. This study aims to find an optimal irrigation schedule for tomato crop, which balances production, fruit quality, and water use efficiency with magnetic-treated water, as an alternative irrigation management.
It is foreseen that the results will support decision makers to update their knowledge on irrigation water quality classification and help local famers to increase their income by adopting efficient and sustainable irrigation practices.

2. Materials and Methods

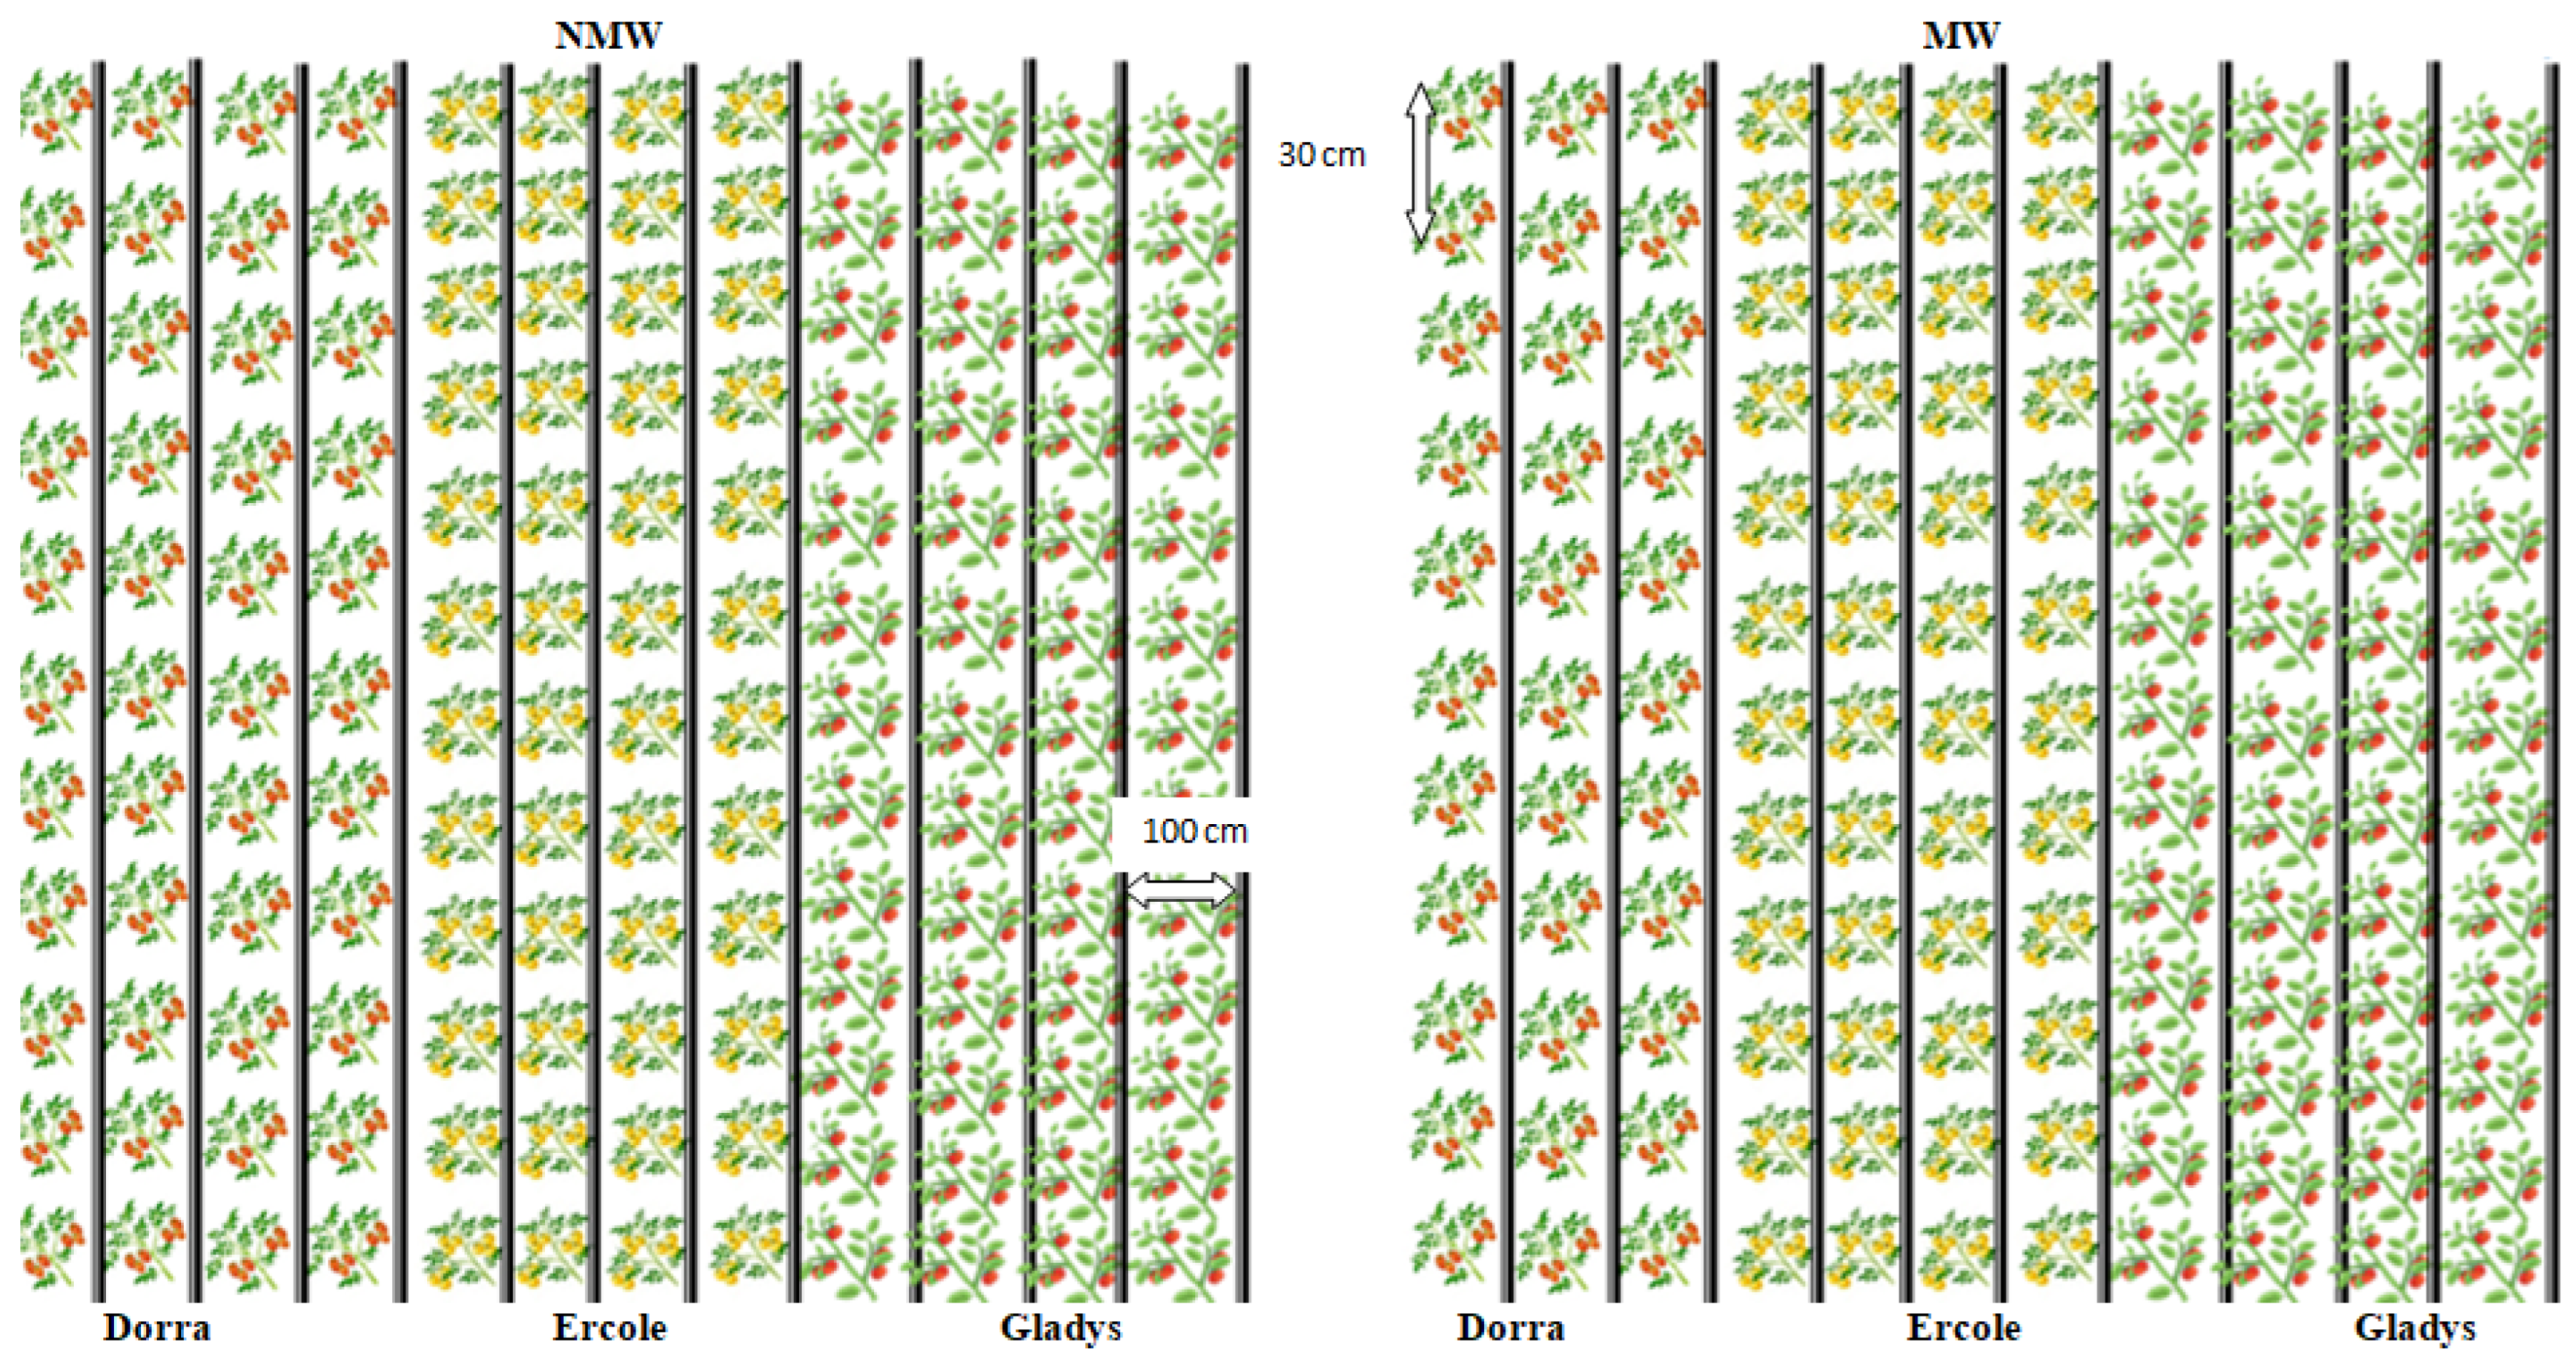
2.1. Study Area, Experimental Design, and Treatments

The experimental site (510 m2) is located in Elfja Agricultural Training Center, which is situated in the southern part of Tunisia (10°38′21.27″ E Longitude, 33°29′49.92″ N Latitude). The region has an arid climate, with the hot season extending from March to September. The average maximum temperature is about 37 °C, and the minimum temperature does not fall below 10 °C during the tomato growing season. Rainfall is mainly concentrated in April (19 mm) and quite absent in June and July. The average wind speed of the prevailing wind is 10.79 km h−1 from north to east. A trial was conducted in the spring–summer season (Planting: 6 March—Harvest: 28 July), during 2023–2024, with three tomato varieties (Dorra, Ercole, and Gladys). The experimental area was composed of two main plots corresponding to each irrigation treatment (NMW: non-magnetized water; MW: magnetized water). Each plot was divided into three subplots, one for each assessed variety. Each subplot comprised 4 rows of 52 plants, with 30 cm plant-to-plant spacing and 100 cm row-to-row spacing (Figure 1).
The crop water requirement (ETc) was determined using CROPWAT 8.0 software. The CROPWAT model requires three basic data including climate variables (maximum temperature (°C), minimum temperature (°C), average temperature (°C), relative humidity (%), wind speed (km day−1), sunshine hours (h), and rainfall (mm)), soil characteristics, and tomato crop coefficient (Kc). The climate data required for the study were obtained using CLIMWAT 2.0 software, which includes the climatic variables measured from the local meteorology station of Djerba. The monthly reference evapotranspiration (ET0) values calculated with the CROPWAT model using Djerba climate data are given in Table 1. Four different periods of tomato crops were taken into account: (i) the vegetative growth period (0.60), (ii), the blooming period (1.03),(iii) the fruit setting(1.48), and (iv) the stage when the crop growth is completed and matured (0.8). The irrigation schedule of tomatoes was programmed using CROPWAT while considering irrigation time, irrigation at 100% critical depletion, irrigation at set intervals per stage, irrigation application type, and soil moisture content to 100% field capacity [41] (Figure 2). The physicochemical characteristics of irrigation water are shown in Table 2.

2.2. Magnetic Treatment and Device

The magnetic treatment of irrigation water was performed using a permanent magnet, model GMX 8000, with a PEHD DN 80 secondary line 1 l s−1 flow rate. Two pairs of MWT devices with north and south faces facing each other were associated with a PVC tube. In this configuration, the magnetic induction was perpendicular to the water flow. The dimensions of the permanent magnet GMX 8000 were L: 0.127 m × W: 0.127 m × H: 0.120 m, and the device weight and the magnetic field strength were, respectively, 3.62 kg and 0.8 T (tesla). The temperature of the circulating water was in the 0–149 °C range.

2.3. Vegetative Growth and Yield Traits

At the fruit ripening period, tomato plants were harvested and divided into aerial part and fruits. We used three replications per treatment with five plants for each one. The fresh weight of the aerial part (APFW) and the fresh weight of the fruits (FFW) were determined and expressed per g. Tomato yield (TY) per area (t ha−1) was also determined at final harvest. The fruits were categorized into marketable fruit (MF) and non-marketable fruit (NMF) groups, based on predominant reasons of non-commercializable tomatoes (blossom-end rot, cracks, misshapen, sunburn, insect damage, colored, and too-small fruits typically with a diameter ≤ 2 cm) [42]. The TY was used to determine the irrigation water use efficiency (IWUE), which represents the ratio of TY by the amount of water used for irrigation. Irrigation water productivity (IWP) was identified as the ratio of MF to the amount of applied irrigation water [43]. The subsequent quality measurements were taken from twenty tomatoes randomly selected from the MF.

2.4. Physicochemical Quality Parameters

Tomato fruits designed for physical and chemical quality measurements were washed with tap water and air-dried at room temperature. Firmness was determined with an FT 327 fruit pressure tester and results were expressed in g cm2. Total soluble solids (TSS) were analyzed from tomato juice with a digital refractometer ATAGO PAL-1, by addition of one to two drops of juice on the prism surface and results were expressed with °Brix. The titrable acidity (TA) was measured by the method defined by [44]. A 10 ml measure of juice samples were titrated with 0.1 N sodium hydroxide solution after addition of two to three drops of phenolphthalein indicator and the results were calculated as percentage (%).

2.5. Hydrogen Peroxide and Antioxidant Enzymes

Leaf hydrogen peroxide (H2O2) levels were determined as described by [45]. Fresh leaves (0.25 g) were homogenized with 1 mL 0.1% (w/v) TCA and the mixture was centrifuged at 12,000× g for 15 min at 4 °C. Aliquots of 100 μL from each sample were added to 50 μL of 10 mM potassium phosphate buffer (pH 7.0) and 100 μL of 1 M KI. After incubation for 30 min at room temperature, readings were taken at 390 nm.
Prior to catalase (CAT), guaiacol peroxidase (GPOX), superoxide dismutase (SOD),and ascorbate peroxidase (APX) antioxidant enzyme analyses, the leaves of mature plants were mixed with 100 mM potassium phosphate buffer (pH 7.5) containing 1 Mm ethylene diamine tetraacetic acid, 3 mM DL-dithiothreitol, and 5% (w/v) polyvinyl polypyrrolidone [46]. The mixture was afterward centrifuged at 10,000× g for 30 min, and the supernatants were stored at −80 °C until analysis.
CAT activity was analyzed spectrophotometrically in a reaction mixture containing 1 mL of 100 mM cold phosphate buffer (pH 7.5) with 2.5 µL H2O2 (30%). The reaction was initiated by the addition of 15 µL of leaf extract. The activity of CAT was estimated using the method reported by [47], while monitoring the removal of H2O2 at 240 nm per min against a plant extract-free blank.
GPOX activity was determined as described by [47]. One enzyme activity unit (U) of GPOX corresponds to an increase of 0.001 in absorbance per min per mg protein. The reaction medium, containing 250 µL phosphate–citrate buffer (sodium phosphate dibasic 0.2 M/citric acid 0.1 M, pH 5.0), 150 µL enzyme extract, and 25 µL guaiacol (0.5%), was shaken and incubated at 30 °C for 15 min. Before addition of sodium metabisulphide (2%), the reaction was stopped by fast cooling in an ice water bath. Finally, the GPOX activity was evaluated by monitoring the absorbance at 450 nm.
SOD activity was determined following the method in [48]. One unit of SOD activity was defined as the amount of enzyme required to inhibit 50% nitro blue tetrazolium (NBT). The SOD activity was expressed as unit per milligram of protein (U mg prot−1).
APX analysis was carried out following the method performed by [49]. Solutions containing 1.3 mL phosphate buffer 0.05 mM (pH 7.8) and 0.1 Mm Sodium EDAT were reacted with 10 µL supernatant samples, 800 µL H2O2 3%. The formed solution was then incubated for 1 min. The activity of the APX enzyme was known from the decrease in absorbance observed for 3 min (1 min intervals).

2.6. Malondialdehyde and Osmoticum Determination

Membrane lipid peroxidation was determined by estimating the content of malondialdehyde (MDA) following the method of Hodges et al. [50]. The content of MDA equivalents was calculated using the following formula:
M D A n m o l g 1   l e a f f r e s h m a t t e r = A 532 A 600 155 × 100
where A532 and A600 are, respectively, the absorbance at 532 and 600 nm.
Proline content was determined following the sulfosalicylic acid method reported by [51]. Leaf samples (50 mg) were homogenized with 5-sulfosalicylic acid (3% w/v) and centrifuged for 15 min at 12,000 × 9 g, 4 °C. Readings were taken at 520 nm.
The soluble sugar content (SSC) was determined using the phenol-sulfuric acid method [52], where 1 mL of leaf methanolic extracts were shaken with 1 mL of 5% phenol and 5 mL of concentrated sulfuric acid. After cooling, the absorbance was determined at 640 nm.

2.7. RNA Isolation and Quantitative RT-qPCR Analysis

RNA was isolated from tomato leaves according to the protocol in [53]. The quantity and quality of total RNA were assessed on a NanoDrop Spectrophotometer and by electrophoresis in a 1.2% agarose gel. For real-time qRT-PCR, cDNA was synthesized from 5 μg of total RNA using 200 U Turbo-I reverse transcriptase (Biomatik, Kitchener, ON, Canada) according to the manufacturers’ instructions. The gene-specific primer pairs for SlAPX, SlSOD, SlWRKY, SlCAT, SlNHX, SlHKT, and SlERF genes used in this study were designed using Primer 3 Input (version 0.4.0) software [54], with default criteria of the software and with amplified products ranging from 80 to 150 bp and 60 °C Tm. Actin was used as a control to normalize the samples [54]. The primer sequences are listed in Table 3.
RT-qPCR was performed in a 7300 Real-Time PCR System (Applied Biosystems, Waltham, MA, USA) using the Maxima SYBR Green/ROX qPCR Master Mix (2X) kit (Biomatik, Cambridge, ON, Canada) [55]. Each 20 μL reaction mixture contained 10 μL Maxima SYBR Green/ROX qPCR Master Mix (2X), 1 μL of each primer at 10 μM, 6 μL dd H2O, and 2 μL cDNA (50 ng). The reactions were performed in triplicate with the following settings: initial denaturation at 95 °C for 5 min followed by 40 cycles at 95 °C for 30 s and 60 °C for 1 min. The specificity of the PCR amplification was verified with a melt curve analysis (from 55°C to 94°C) following the final cycle of the PCR. All reactions were performed in triplicate. The relative expression levels were analyzed using the 2−ΔΔCT method, as described by Schmittgen and Livak [56].

2.8. Statistical Analysis

All data were subjected to one- or two-way analysis of variance (ANOVA) to test the effect of water treatment and variety, using SPSS Statistics 20.0 for Windows. Means were compared using the LSD multiple range test at the 5% significance level.

3. Results

3.1. Yield Characteristics

MW treatment increased TY, APFW, FFW, MF, IWUE, and IWP and decreased NMF vs. control of the three assessed varieties (Table 4). The increases induced in TY, APFW, FFW, MF, IWUE, and IWP in magnetically treated irrigation water were, respectively, 32%, 61%, 32%, 40%, 32%,and 40% in the Dorra variety, 53%, 69%, 67%, 77%, 68%, and 6% in the Ercole variety, and 57%, 50%,69%, 80%, and 80% in the Gladys variety. The Dorra and Ercole varieties recorded the higher yield data for IWUE and IWP, while the lowest was noticed in Gladys. With respect to APFW, the obtained values do not show significant difference among varieties, as revealed by the ANOVA results (p ≥ 0.05) for the effect of variety (V) factor. Meanwhile, APFW was affected positively by the treatment (T) factor, and was increased by 61%, 40%, and 50% in Dorra, Ercole, and Gladys, respectively.

3.2. Physicochemical Quality Parameters

As shown in Table 5, the factors T and V, and the interaction T × V, had no significant influence on TSSs in tomato juice. The TA of analyzed tomatoes was in the range 6.93 °Brix–6.16 °Brix, with the maximum and minimum values, respectively, found in MW-irrigated plants from the Gladys and Dorra varieties. On the other hand, MW irrigation treatment and the interaction T×V had a significant effect on TA data. Ercole had its TA increased significantly under MW. However, Dorra and Gladys TA were not changed by MW. The maximum TA (0.60 mg AC 100 g−1FW) was recorded for Ercoleunder MW, while the minimum TA (0.29) was found in Ercole under NMW. Results also revealed that V and the V × T interaction had no significant influence on tomato firmness during the study. Fortunately, tomato firmness was significantly enhanced by MW irrigation in the Gladys variety.

3.3. Hydrogen Peroxide and Antioxidant Enzyme Activity

In the leaves of the three assessed varieties, MW irrigation treatment induced a lower level of H2O2 relative to control (Dorra: 30%, Ercole: 37%, Gladys: 14%). Analysis of CAT activity clearly showed that MW induced decreases in activity in the three tested varieties (Table 6). A similar response was noticed for APX and GPOX. However, SOD activity in Dorra leaves was not changed by water treatments. The CAT, SOD, and GPOX values appeared to maintain a high level of activity in the Gladys variety as compared to Dorra and Ercole, similarly in NMW and MW treatments. A significant effect of the V factor was found on enzyme capacity. Similarly, H2O2 values were clearly elevated in Gladys compared to Dorra and Ercole, as revealed by ANOVA analysis (p ≤ 0.05 significance for the V factor).

3.4. Malondialdehyde and Osmoticum Accumulation

The effects of MW irrigation treatment on MDA level and osmoticum accumulation in tomato leaves are shown in Table 7. MW treatment decreased MDA, proline, and SS contents in the Dorra, Ercole, and Gladys plants. The MDA level showed significant difference among varieties, and was highest in Gladys compared to Dorra and Ercole. The highest values of proline (11.07) and SSC (46.65) were, respectively, found in the Dorra and Ercole varieties watered with NMW.

3.5. Correlation Analysis

The relationships among the measured traits in the three tomatoes were studied separately per variety (Table 8, Table 9 and Table 10). TY was correlated with MF, IWUE, and IWP in the Dorra variety and with FFW, IWUE, and IWP in Ercole and Gladys. None of F, TSSs, or TA correlated significantly with TY in the Dorra and Ercole varieties. However, TA data plotted vs. TY in Gladys showed a significant positive relationship. All the antioxidant enzymes showed significant negative correlation with TY. Interestingly, the MDA content correlated positively with CAT (p 0.05), APX (p 0.001), SOD, and GPOX in Ercole but not in Dorra and Gladys. Negative significant correlations were noticed for MDA with IWUE and IWP in the three tomato varieties. When IWUE and IWP were plotted vs. all the physicochemical and biochemical parameters except F, significant negative correlations were found in all tomatoes (p 0.001), which indicates that plant response is largely influenced by water usage. A similar response occurred for H2O2 against IWUE and IWP, for which significant negative correlations were found for Dorra and Gladys, revealing an oxidative stress unclenching effect with water deficit conditions. The same did not occur for Ercole, which demonstrated a positive correlation vs. IWP. The osmoticum values plotted against antioxidant enzymes highlighted significant positive correlations with the CAT, APX, and GPOX enzymes. However, no significant relationship was described for SOD against proline and SS in Dorra. SOD had significant inverse correlation vs. proline and SS with Ercole and Gladys. When proline and SS were plotted with TY, this also revealed a differential response among varieties. Hence, they revealed significant positive correlations in Dorra and negative correlations with Ercole and Gladys.

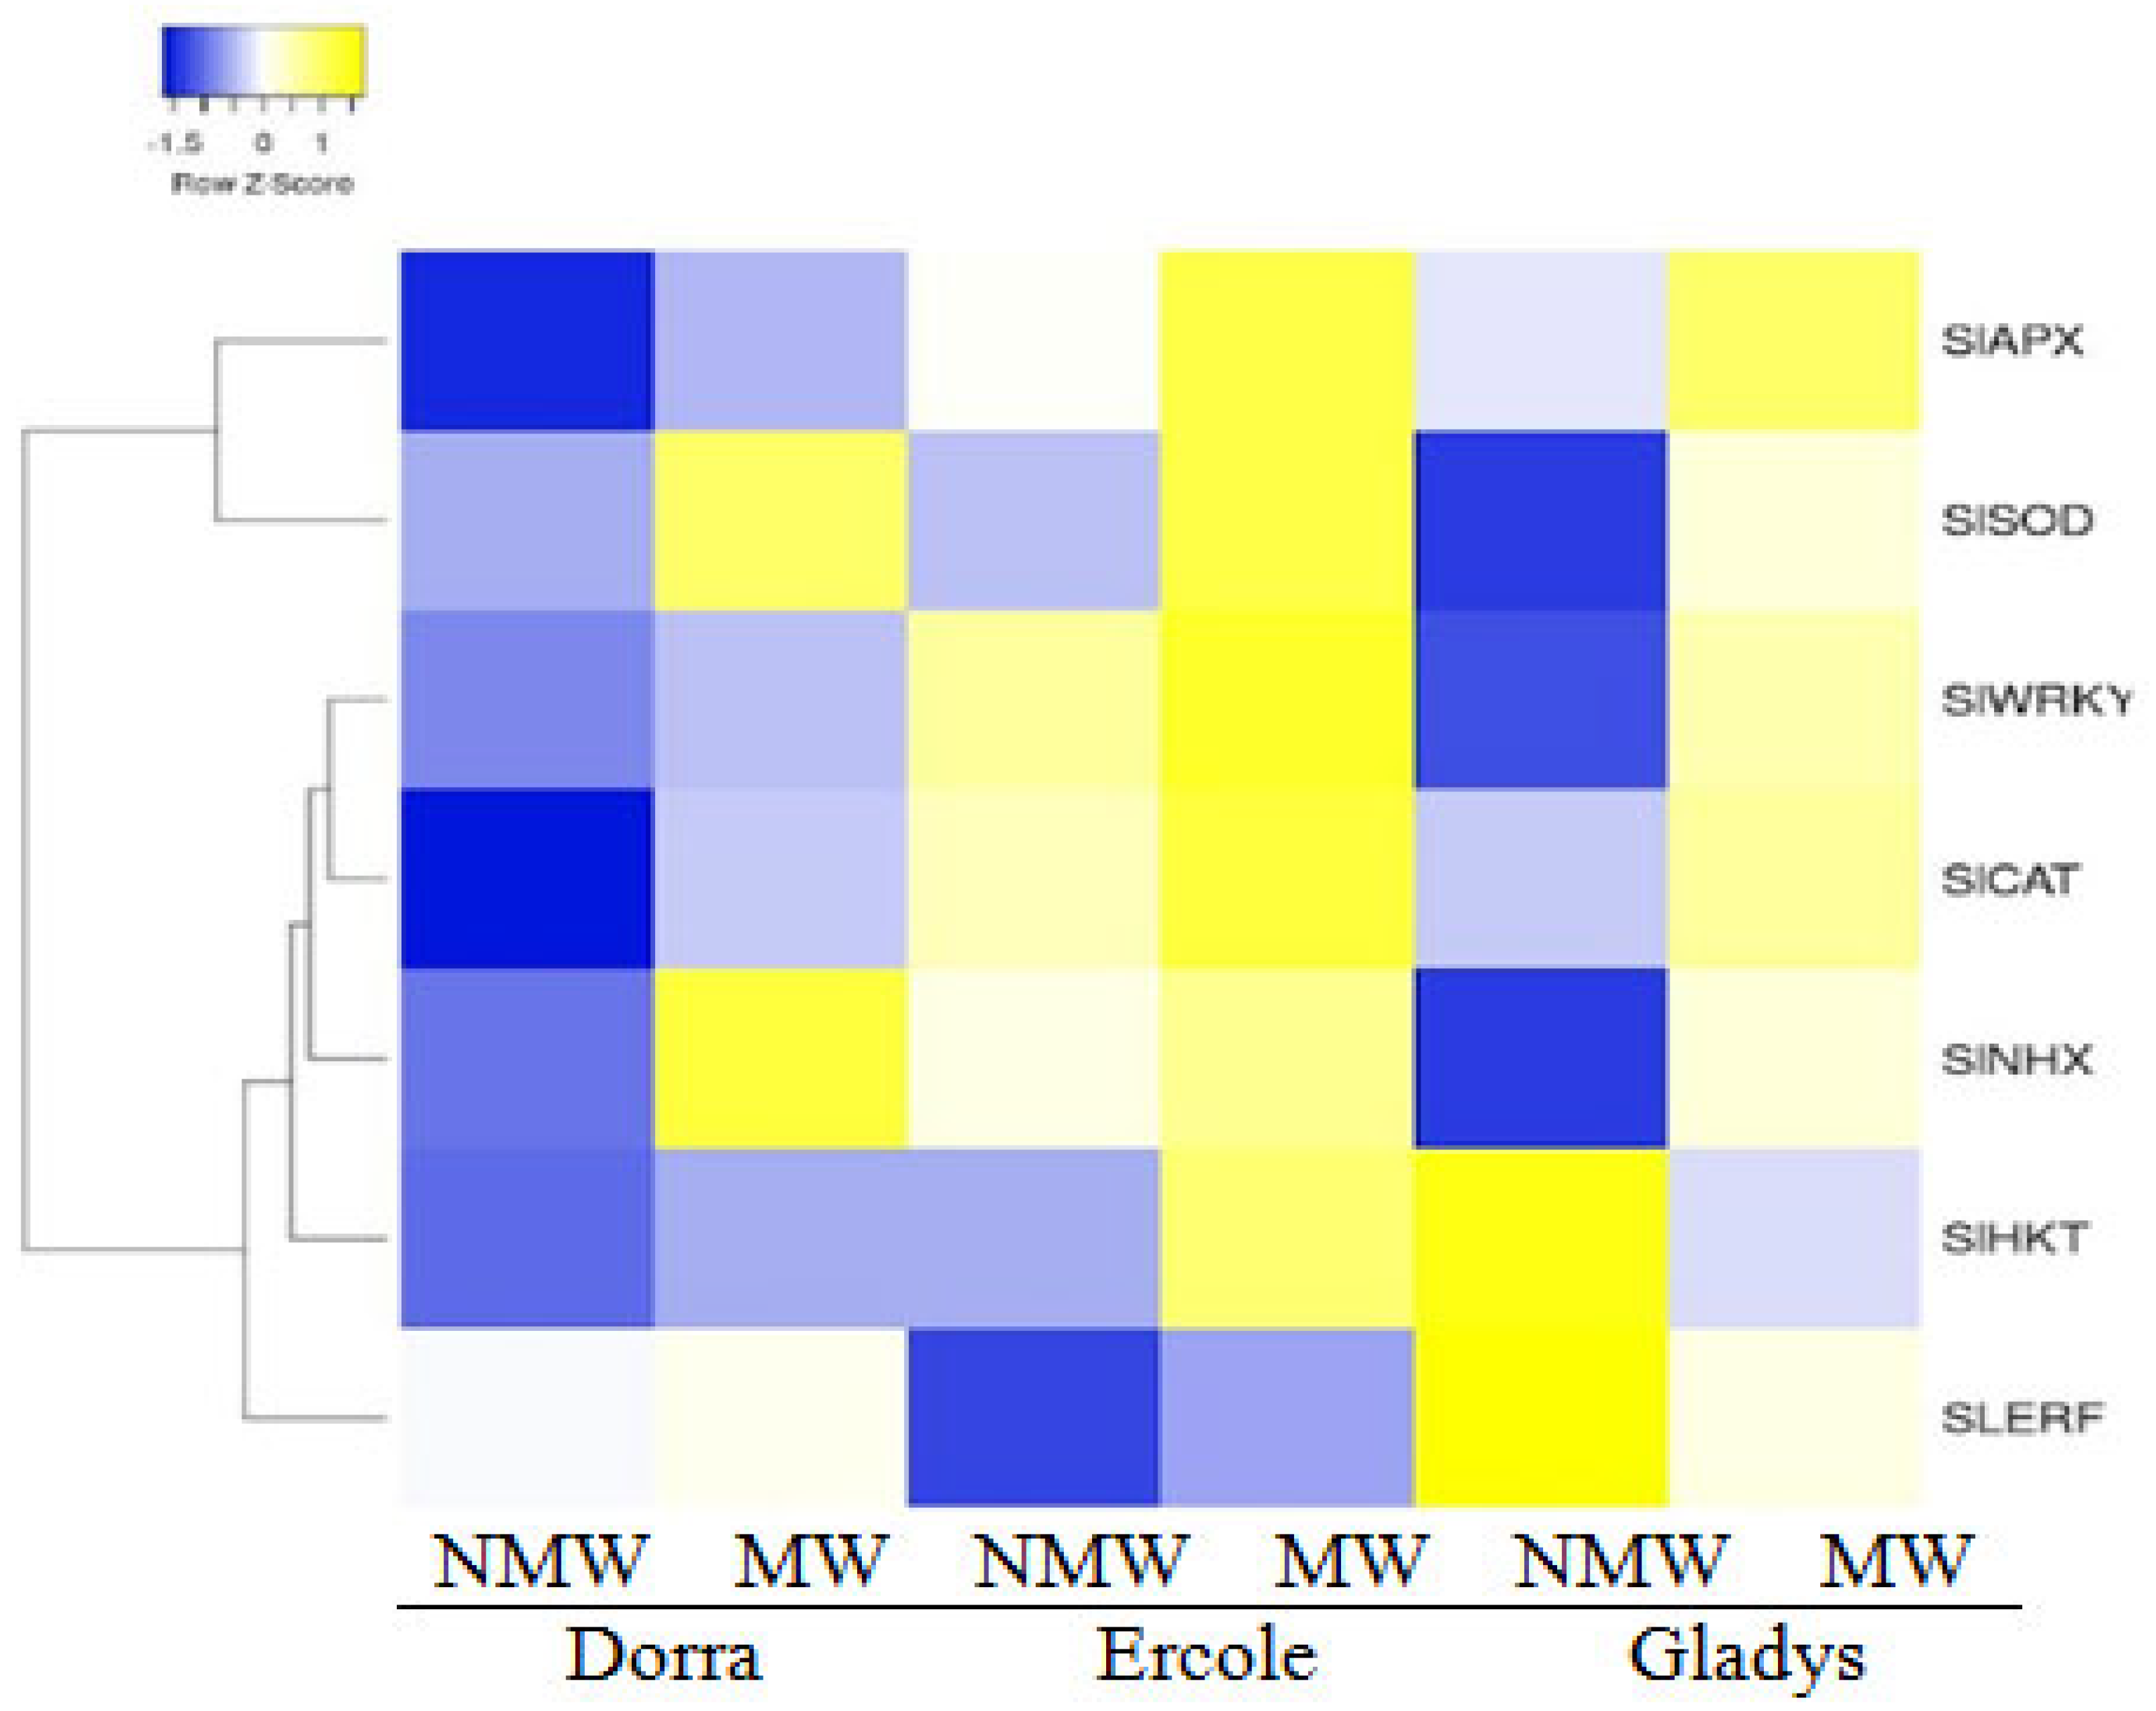
3.6. Different Expressed Gene Patterns

Hierarchical clustering analysis and expression patterns of the assessed genes are presented in Figure 3 and Figure 4. Results revealed that the most upregulated genes, SlAPX, SlSOD, SlWRKY, SlCAT, SlNHX, and SlHKT, were found in the Ercole variety under MW treatment.A different expression pattern of SlERF and SlHKT was identified in Gladys. In fact, these genes were more upregulated in plants watered with NMW. Fortunately, Gladys showed clear upregulation of SlAPX under MW. However, a low expression pattern was noticed for SlSOD, SlWRKY, and SlCAT under MW treatment. This was concomitant to higher APX, SOD, and CAT activities in the Gladys variety as compared to Dorra and Ercole. This observation implies that Ercole response to MW may involve fast mechanisms. Gladys was less responsive to MW and low expression levels of genes were found. Meanwhile, Dorra plants revealed clear expression of SlSOD and SlNHX under MW. All the assessed genes were found to be down regulated in Dorra leaves under NMW irrigation treatment.

4. Discussion

Severe droughts often happen in arid irrigated areas such as the south of Tunisia, and limit the sustainable development of agriculture. Thus, the adoption of suitable management methods for enhancing water quality and accessibility to plants could be of prime importance to conserve water resources and have minimum impacts on soil.
The current study confirmed that irrigation with magnetic water increased aerial biomass accumulation, TY, FFW, and MF in tomatoes. It is likely that such results are linked to changes induced by magnetic fields in water hydrogen bonding and increased ion mobility, which accentuate biological activity in plants and consequently enhance plant growth [57]. Furthermore, magnetic fields may result in faster activations of phyto hormones during the growth process which have an important role in raising the mobilization and transportation of nutrients [33,57]. Meanwhile, lower biomass accumulation under NMW may be due to less water accessibility under this treatment as compared to MW. Ogunlela and Yusuf [58] indicated that magnetic treatment of water softens the water and increases mineral dissolvability and hence provides adequate supply of water and minerals to plants. Further, Zhai et al. [6] explained that insufficient water limits tomato vegetative growth.
The enhancement in yield with magnetic water irrigation was consistent with earlier studies [23,57]. The reason may be the enhanced enzyme activities, the higher mobility of water molecules, or the better accessibility of nutrient molecules which might be responsible for improved growth and therefore yield parameters [57,59]. Other studies showed an increase in root growth with magnetic-treated water, raising therefore plants’ ability to absorb water and nutrients efficiently [57]. This may confirm the improvement in IWUE and IWP found in this study. The results suggest the usefulness of magnetic water in agriculture to enable the extraction of water from soil layers. Ogunlela and Yusuf [58] reported that magnetic treatment of water had significant effects on chemical properties of water by increasing the cation precipitation rate as well as the water flow and accessibility. Magnetic treatment of water is commonly regarded as an efficient treatment to increase water accessibility to plants [57]. Indeed, Akrimi et al. [23] noted that magnetic water effects were related to soil moisture enhancement and water use efficiency. Further, Hozayn and Abdul Qados [34] demonstrated that magnetic water effects are linked to increased mobility of nutrients from soil and fertilizers.
In our study, the tomato yield was negatively related to the antioxidant enzyme capacity. Such results may indicate that the lower tomato yield under NMW may be due to the high energy expended by plants to optimize the antioxidant enzyme system [60]. In addition, Li et al. [61] reported that a reduction in yield could result from decreased inflow of water into fruits and loss of cell wall elasticity. In fact, an elevated MDA level has been demonstrated to denote cell membrane damage, with negative impacts on plant growth and yield [62]. The results of this study revealed negative significant correlations of MDA with IWUE and IWP in the three studied tomato varieties. This suggests the effective role of MW in reducing MDA and therefore cell wall damage and enhanced yield [63]. The negative significant correlation of MDA vs. APFW in the Gladys and Ercole varieties suggests that MDA may alter their growth compared to Dorra. This also reveals the tolerance of the Dorra variety to arid conditions. Furthermore, the high level of osmoregulation substances such as proline and SSC in control conditions (NMW) was probably because tomatoes adjusted initiatively to adapt to arid conditions [64]. Other authors reported that proline accumulates in plants as a symptom rather than an adaptive mechanism to stress [62,65]. Additionally, Lu [66] indicated that increased sugar concentrations in tomatoes might be due to the enhanced activity of sucrose invertase. These same authors explained the increase in organic contents by the enhancement of cell wall synthesis and fruit development under water deficit situations.
On the other hand, the study revealed no significant effects of MW on some quality indexes, namely, TSSs in Dorra and Ercole and TA in the fruits of Dorra and Gladys. This also reveals a different varietal response to magnetic water irrigation as found previously in Akrimi et al. [23,29]. In fact, the increases in TY, FFW, and MF induced by MW were more pronounced in Ercole (67%, 67%, 77%) and Gladys (80%, 69%, 80%) as compared to Dorra (32%, 32%, 40%). Notwithstanding, Dorra and Gladys represent, respectively, the highest and lowest yielding varieties. Low responsiveness of the highest yielding variety, Dorra, to MW irrigation may in turn reveal its greater aptitude to maintain normal functions under low water dispensability conditions [67]. Moreover, the lower TA of tomato fruits in this study might be due to more utilization of organic acids in the respiration process in the high temperature conditions of the south of Tunisia [68,69].
Regarding the impact on antioxidant enzymes, results revealed that MW attenuated the activities of CAT, APX, and GPOX in all the assessed tomatoes. These same antioxidant enzymes were kept higher under NMW irrigation, associated with increased MDA and H2O2 contents. Such a response was adopted by tomatoes to counterbalance the deteriorative effects of ROS through their detoxification [62]. Similarly, a decrease in CAT and SOD antioxidant enzymes was found in response to irrigation with magnetic water [70]. In the present study, SOD was the only enzyme to not be correlated with IWUE and IWP. The negative significant correlations between CAT, APX, and GPOX vs. IWUE and IWP may be due to lower ROS production under MW irrigation. Patanè et al. [62] reported that lower levels of MDA in tomatoes alongside CAT levels denote high ability to tolerate long-lasting drought stress for survival. In this research, H2O2 was highest in Gladys, which probably altered its growth more [71].
The upregulation of SlAPX in the tomato variety Gladys under MW seems to have an important role in protecting the plant from oxidative stress damage and maintaining its growth [72]. In fact, the upregulation of APX gene had positive effects on plant growth [71,73]. Moreover, Guo et al. [74] reported that APX plays an important role in protecting plants from oxidative stress and enhancing stress responses through the enzymatic conversion of H2O2 into H2O.Meanwhile, the overexpression of SlHKT gene in Gladys under NMW may explain the pivotal role of these genes in facilitating the osmotic adjustment process, as revealed by the high osmoticum levels under NMW treatment [75]. Additionally, the overexpression of SlERF in Gladys watered with NMW indicates the susceptibility of tomatoes to microbial pathogens under NMW [55,76]. Fortunately, SlERF was not induced under MW in the three assessed varieties, suggesting that MW treatment may enhance tomato response against pathogens. On the other hand, the upregulation of SlSOD in Dorra and Ercole under MW had a significant effect in reducing oxidative damage, as revealed by the lower MDA level of these two varieties. Feng et al. [77] indicated that the overexpression of the SOD gene family in tomato improved tolerance to oxidative stress. Furthermore, high NHX expression in Dorra under MW evidenced their role in regulating ionic homeostasis [78].

5. Conclusions

To conclude, the results showed that irrigation with magnetic water (MW) along with adequate estimation of tomato water requirements led to an improvement in tomato growth, yield, and fruit quality over the control. MW treatment enhanced water usage (IWP: irrigation water productivity; IWUE: irrigation water use efficiency) in arid climatic conditions. The data highlight the capacity of MW to withstand the impact of arid conditions on tomatoes by affecting antioxidant enzymes, osmotic compounds, and genes transcript levels. Therefore, water management through magnetic treatment andwith adequate water scheduling may be suggested to enhance tomato productivity. The results of the current study imply that magnetized water can be utilized for agriculture under arid conditions.

Author Contributions

All authors contributed to the study conception and design; methodology, I.N. and M.M.; software, I.N. and M.M.; validation, I.N. and M.M.; formal analysis, G.A. and H.E.; investigation, I.N. and M.M.; resources, I.N.; data curation, I.N., M.M. and R.A.; writing—original draft preparation, R.A.; writing—review and editing, I.N., M.M. and R.A.; visualization, I.N.; supervision, I.N. and M.M.; project administration, I.N.; funding acquisition, I.N. All authors have read and agreed to the published version of the manuscript.

Funding

This work was supported by the TALANOA-WATER project, funded by the PRIMA program of the European commission (EC).

Data Availability Statement

The datasets generated and/or analyzed during the current study are available from the corresponding author on reasonable request.

Acknowledgments

This study was supported by the TALANOA-WATER project. The authors thank the professional training center for agriculture (CFPA) El Fjè for the technical assistance and support.

Conflicts of Interest

The authors declare no conflicts of interest.

References

  1. Norbert, S.; Kaka, Y.; Gona, A. Analysis of Tomato (Solanum lycopersicum L) Value Chain in Kebbi State, Nigeria. Direct Res. J. Agri. Food Sci. 2023, 11, 217–223. [Google Scholar] [CrossRef]
  2. Hong, Y.X.X.; Jiang, X.L.; Xu, H.; Yu, C. The impacts of China’s dual carbon policy on green innovation: Evidence from Chinese heavy-polluting enterprises. J. Environ. Manag. 2023, 350, 119620. [Google Scholar] [CrossRef] [PubMed]
  3. CheikhRouhou, M.; Souhir, A.; Hager, A.; Anne, L.; Guadalupe, V.M.; Christine, R.; Dorra, G. Pilot scale production of dietary fibers from Tunisian tomato and red pepper by-products. Sust. Chem. Pharm. 2024, 39, 101521. [Google Scholar] [CrossRef]
  4. FAOSTAT. Available online: https://www.fao.org/faostat/en/#search/Pistachios%2C%20in%20shell (accessed on 23 January 2025).
  5. Yacoubi, S.; Slatnia, A.; Azzib, R.; Oueslati, T. Impact of deficit irrigation strategies on water use and productivity of vegetable crops in a semi-arid context of Tunisia. Desal. Water Treat. 2022, 263, 109–115. [Google Scholar] [CrossRef]
  6. Zhai, Y.; Yang, Q.; Wu, Y. Soil Salt Distribution and Tomato Response to Saline Water Irrigation under Straw Mulching. PLoS ONE 2016, 11, e0165985. [Google Scholar] [CrossRef]
  7. Grancharova, N.E.; Elenov, B.; Janevska, E. Quantitative prediction of tomato irrigation needs using Cropwat model. J. Agri. Food Environ. Sci. 2022, 76, 46–51. [Google Scholar] [CrossRef]
  8. Kanzari, S.; Šimůnek, J.; Daghari, I.; Younes, A.; Ali, K.B.; Mariem, S.B.; Ghannem, S. Modeling Irrigation of Tomatoes with Saline Water in Semi-Arid Conditions Using Hydrus-1D. Land 2024, 13, 739. [Google Scholar] [CrossRef]
  9. Dominguez, G.; Wilkins, G.; Thiemens, M.H. Isotope fractionation in silicate melts. Nature 2011, 473, 70–73.e1. [Google Scholar] [CrossRef]
  10. Corbari, C.; Ben Charfi, I.; Mancini, M. Optimizing Irrigation Water Use Efficiency for Tomato and Maize Fields across Italy Combining Remote Sensing Data and the AquaCrop Model. Hydrology 2021, 8, 39. [Google Scholar] [CrossRef]
  11. Ullah, I.; Mao, H.; Rasool, G.; Gao, H.; Javed, Q.; Sarwar, A.; Khan, M.I. Effect of Deficit Irrigation and Reduced N Fertilization on Plant Growth, Root Morphology, and Water Use Efficiency of Tomato Grown in Soilless Culture. Agronomy 2021, 11, 228. [Google Scholar] [CrossRef]
  12. Li, Y.; Sun, Y.; Liao, S.; Zou, G.; Zhao, T.; Chen, Y.; Yang, J.; Zhang, L. Effects of two slow-release nitrogen fertilizers and irrigation on yield, quality, and water-fertilizer productivity of greenhouse tomato. Agric. Water Manag. 2017, 186, 139–146. [Google Scholar] [CrossRef]
  13. Colimba-Limaico, J.E.; Zubelzu-Minguez, S.; Rodríguez-Sinobas, L. Optimal Irrigation Scheduling for Greenhouse Tomato Crop (Solanum lycopersicum L.) in Ecuador. Agronomy 2022, 12, 1020. [Google Scholar] [CrossRef]
  14. Wang, X.; Xing, Y. Evaluation of the effect of irrigation and fertilization by drip fertigation on tomato yield and water use efficiency in greenhouse. Int. J. Agron. 2016, 2016, 3961903. [Google Scholar] [CrossRef]
  15. Kuscu, H.; Turhan, A.; Ozmen, N.; Aydinol, P.; Demir, A.O. Optimizing levels of water and nitrogen applied through drip irrigation for yield, quality, and water productivity of processing tomato (Lycopersicon esculentum Mill.). Hortic. Environ. Biotechnol. 2014, 55, 103–114. [Google Scholar] [CrossRef]
  16. Halimi, A.H.; Tefera, A.H. Application of Cropwat Model for Estimation of Irrigation Scheduling of Tomato in Changing Climate of Eastern Europe: The Case Study of Godollo, Hungary. Intern. J. Agri. Environ. Sci. 2019, 6, 1–11. [Google Scholar]
  17. Adamtie, T.F.; Mitku, D.T.; Hassen, A. Validations of CROPWAT Based Irrigation Practice for Tomato Productivity in Lowland Hot Humid Area of Ethiopia. Am. J. Life Sci. Innov. 2022, 1, 27–35. [Google Scholar] [CrossRef]
  18. Oke, O.S.; Oyaniyi, T.; Adewumi, O.T.; Bamigboye, O.T.; Lawah, M.O.; Jatto, K.A.; Adara, C.T.; Marizu, J.T.; Ogunbela, A.A. Economic, nutritional and medicinal values of african walnut (Tetracarpidium conophorum) in Nigeria (Hutch. & Dalziel): A Review. J. Res. For. Wildl. Environ. 2020, 12. [Google Scholar]
  19. Xiang, W.; Tan, M.; Yang, X.; Li, H. The impact of cropland spatial shift on irrigation water use in China. Environ. Impact Assess. Rev. 2022, 97, 106904. [Google Scholar] [CrossRef]
  20. Smith, M. CROPWAT A computer program for irrigation planning and management. In Rome FAO Irrigation and Drainage Paper; FAO: Rome, Italy, 1992; p. 46. [Google Scholar]
  21. Solangi, G.S.; Shah, S.A.; Alharbi, R.S.; Panhwar, S.; Keerio, H.A.; Kim, T.-W.; Memon, J.A.; Bughio, A.D. Investigation of Irrigation Water Requirements for Major Crops Using CROPWAT Model Based on Climate Data. Water 2022, 14, 2578. [Google Scholar] [CrossRef]
  22. Aydın, Y. Quantification of water requirement of some major crops under semi-arid climate in Turkey. Peer J. 2022, 10, e13696. [Google Scholar] [CrossRef]
  23. Akrimi, R.; Hajlaoui, H.; Batelli, G.; Ruggiero, A.; Badri, M.; Grillo, S.; Mhamdi, M. Changes in potato metabolism and agro-physiological attributes in response to saline irrigation. J. Agron. Crop Sci. 2021, 207, 44–58. [Google Scholar] [CrossRef]
  24. Kishorea, G.; Singha, R.K.; Saxenaa, C.K.; Al-Ansari, N.; Vishwakarma, D.K.; Heddamd, S. Magnetic treatment of irrigation water and its effect on Frenchbean (Phaseolus vulgaris). Water Reuse 2023, 13, 545. [Google Scholar] [CrossRef]
  25. Colic, M.; Morse, D. The elusive mechanism of the magnetic ‘memory’ of water. Colloids Surf. Physicoch. Eng. Aspects 1999, 154, 167–174. [Google Scholar] [CrossRef]
  26. Samarah, N.H.; Bany Hani, M.M.I.; Makhadmeh, I.M. Effect of Magnetic Treatment of Water or Seeds on Germination and Productivity of Tomato Plants under Salinity Stress. Horticulturae 2021, 7, 220. [Google Scholar] [CrossRef]
  27. Khaskhoussy, K.; Mohamed, B.; Mariem, D.; Mohamed, H. Performance of different magnetic and electromagnetic water treatment devices on soil and two tomato cultivars. Sci. Hort. 2023, 322, 112437. [Google Scholar] [CrossRef]
  28. Teixeira da Silva, J.A.; Dobránszki, J. Impact of magnetic water on plant growth. Environ. Exper. Biol. 2014, 12, 137–142. [Google Scholar]
  29. Akrimi, R.; Hajlaoui, H.; Mhamdi, M. Effects of electromagnetic treated saline water on potatoes (Solanum tuberosum L.) physiological and nutritional characteristics. J. Hortic. Postharvest Res. 2023, 6, 247–260. [Google Scholar] [CrossRef]
  30. Zaidi, N.S.; Sohaili, J.; Muda, K.; Sillanpää, M. Magnetic field application and its potential in water and wastewater treatment systems. Separ. Purif. Rev. 2014, 43, 206–240. [Google Scholar] [CrossRef]
  31. Abedinpour, M.; Rohani, E. Effects of magnetized water application on soil and maize growth indices under different amounts of salt in the water. J. Water Reuse Desal. 2017, 7, 319–325. [Google Scholar] [CrossRef]
  32. Zhao, G.; Mu, Y.; Wang, Y.; Wang, L. Magnetization and oxidation of irrigation water to improve winter wheat (Triticumaestivum L.) production and water-use efficiency. Agri. Water Manag. 2022, 259, 107254. [Google Scholar] [CrossRef]
  33. Maheshwari, B.L.; Grewal, H.S. Magnetic treatment of irrigation water: Its effects on vegetable crop yield and water productivity. Agric. Water Manag. 2009, 96, 1229–1236. [Google Scholar] [CrossRef]
  34. Hozayn, M.; Abdul Qados, A.M. Irrigation with magnetized water enhances growth, chemical constituent and yield of chick pea (Cicerarietinum L.). Agric. Biol. J. North Am. 2010, 1, 671–676. [Google Scholar]
  35. Al-Khazan, M.; Abdullatif, B.M.; Al-Assaf, N. Effects of magnetically treated water on water status, chlorophyll pigments and some elements content of jojoba (Simmondsia chinensis L.) at different growth stages. Afr. J. Environ. Sci. Technol. 2011, 5, 722–731. [Google Scholar]
  36. Chang, K.T.; Weng, C.I. The effect of an external magnetic field on the structure of liquid water using molecular dynamics simulation. J. Appl. Phys. 2006, 100, 043917. [Google Scholar] [CrossRef]
  37. Selim, A.F.; El-Nady, M. Physio-anatomical responses of drought stressed tomato plants to magnetic field. Acta Astronaut. 2011, 69, 387–396. [Google Scholar] [CrossRef]
  38. Belyavskaya, N.A. Biological effects due to weak magnetic field on plants. Adv. Space Res. 2004, 34, 1566–1574. [Google Scholar] [CrossRef]
  39. Turker, M.; Temirci, C.; Battal, P.; Erez, M.E. The Effects of an Artificial and Static Magnetic Field on Plant Growth, Chlorophyll and Phytohormone Levels in Maize and Sunflower Plants. Phyton Ann. Rei Bot 2007, 46, 271–284. [Google Scholar]
  40. Gabrielli, C.; Jaouhari, R.; Maurin, G.; Keddam, M. Magnetic water treatment for scale prevention. Water Res. 2001, 35, 3249–3259. [Google Scholar] [CrossRef]
  41. Surendran, U.; Sandeep, O.; George, M.; Joseph, E.J. A Novel technique of magnetic treatment of saline and hard water for irrigation and its impact on cow pea growth and water properties. Int. J. Agric. Environ. Biotech. 2013, 6, 85–92. [Google Scholar]
  42. Kahn, B.A.; Damicone, J.P. Kaolin particle film product applications before harvest begins may not improve marketable yields of fresh tomatoes. Hort. Technol. 2008, 42, 1010. [Google Scholar] [CrossRef]
  43. Nangare, D.D.; Singh, Y.; Kumar, P.S.; Minhas, P.S. Growth, fruit yield and quality of tomato (Lycopersicun esculentum Mill) as affected by deficit irrigation regulated on phonological basis. Agri. Water Manag. 2016, 171, 73–79. [Google Scholar] [CrossRef]
  44. Dashti, N.H.; Montasser, M.S.; Ali, N.Y.; Cherian, V.M. Influence of plant growth promoting rhizobacteria on fruit yield, pomological characteristics and chemical contents in cucumber mosaic virus-infected tomato plants. Kuwait J. Sci. 2014, 41. [Google Scholar]
  45. Murshed, R.; Lopez-Lauri, F.; Keller, C.; Monnet, F.; Sallanon, H. Acclimation to drought stress enhances oxidative stress tolerance in Solanum lycopersicum L. Fruits Plant Stress 2008, 2, 145–151. [Google Scholar]
  46. Azevedo, R.A.; Alas, R.M.; Smith, R.J.; Lea, P.J. Response of antioxidant enzymes to transfer from elevated carbon dioxide to air and ozone fumigation, in the leaves and roots of wild-type and a catalase deficient mutant of barley. Physiol. Plant. 1998, 104, 280–292. [Google Scholar] [CrossRef]
  47. Gomes-Junior, R.A.; Gratão, P.L.; Gaziola, S.A.; Mazzafera, P.; Lea, P.J.; Azevedo, R.A. Selenium-induced oxidative stress in coffee cell suspension cultures. Funct. Plant Biol. 2007, 34, 449–456. [Google Scholar] [CrossRef] [PubMed]
  48. Fan, W.; Zhang, M.; Zhang, H.; Zhang, P. Improved tolerance to various abiotic stresses in transgenic sweet potato (Ipomoea batatas) expressing spanichbetaine aldehyde dehydrogenase. PLoS ONE 2012, 7, e37344. [Google Scholar] [CrossRef]
  49. Nakano, Y.; Asada, K. Hydrogen peroxide is scavenged by ascorbate-specific peroxidase in spanich chloroplasts. Plant Cell Physiol. 1981, 22, 867–880. [Google Scholar]
  50. Hodges, D.M.; De Long, J.M.; Forney, C.F.; Prange, R.K. Improving the thiobarbituric acid-reactive substances assay for estimating lipid peroxidtion in plant tissues containing anthocynin and other interfering compounds. Planta 1999, 207, 604–611. [Google Scholar] [CrossRef]
  51. Man, P.; Griffiths, P.G.; Chinnery, P.F. Mitochondrial optic neuropathies—Disease mechanisms and therapeutic strategies. Prog. Retin Eye Res. 2011, 30, 81–114. [Google Scholar] [CrossRef]
  52. Robyt, J.F.; White, B.J. Biochemical Techniques-Theory and Practice; Books/Cole Publishing Company: Monterey, CA, USA, 1987; Volume XVI, pp. 267–275. [Google Scholar]
  53. Chang, S.; Puryear, J.; Cairney, J. A simple and efficient method for isolating RNA from pine trees. Plant Mol. Biol. Rep. 1993, 11, 113–116. [Google Scholar] [CrossRef]
  54. Livak, K.J.; Schmittgen, T.D. Analysis of relative gene expression data using real-time quantitative PCR and the 2−ΔΔCT method. Methods 2001, 25, 402–408. [Google Scholar] [CrossRef] [PubMed]
  55. Kalleli, F.; Abid, G.; Ben Salem, I.; Boughalleb, N.; M’hamdi, M. Essential oil from fen nel seeds (Foeniculum vulgare) reduces Fusarium wilt of tomato (Solanum lycopersicon). Phytopathol. Medi Terranea 2020, 59, 63–76. [Google Scholar] [CrossRef]
  56. Schmittgen, T.D.; Livak, K.J. Analyzing real-time PCR data by the comparative CT method. Nat. Protoc. 2008, 3, 1101–1108. [Google Scholar] [CrossRef]
  57. Surendran, U.; Sandeep, O.; Joseph, E.J. The impacts of magnetic treatment of irrigation water on plant, water and soil characteristics. Agri. Water Manag. 2016, 178, 21–29. [Google Scholar] [CrossRef]
  58. Ogunlela, A.O.; Yusuf, K.O. Effect of magnetic treatment of water treatment of water on chemical properties of water and sodium adsorption ration. J. Resear Forest Wildl. Environ. 2016, 8, 73–79. [Google Scholar]
  59. Vashisth, A.; Nagarajan, S. Effect on germination and early growth characteristics in sunflower (Helianthus annuus) seeds exposed to static magnetic field. J. Plant Physiol. 2010, 167, 149–156. [Google Scholar] [CrossRef]
  60. Yue, K.; Li, L.; Xie, J.; Fudjoe, S.K.; Zhang, R.; Luo, Z.; Anwar, S. Nitrogen Supply Affects Grain Yield by Regulating Antioxidant Enzyme Activity and Photosynthetic Capacity of Maize Plant in the Loess Plateau. Agronomy 2021, 11, 1094. [Google Scholar] [CrossRef]
  61. Li, Y.L.; Stanghellini, C.; Challa, H. Response of tomato plants to a step-change in root-zone salinity under two different transpiration regimes. Sci. Hort. 2002, 93, 26779. [Google Scholar] [CrossRef]
  62. Patanè, C.; Cosentino, S.L.; Romano, D.; Toscano, S. Relative Water Content, Proline, and Antioxidant Enzymes in Leaves of Long Shelf-Life Tomatoes under Drought Stress and Rewatering. Plants 2022, 11, 3045. [Google Scholar] [CrossRef]
  63. Raziq, A.; Wang, Y.; MohiUd Din, A.; Sun, J.; Shu, S.; Guo, S.A. Comprehensive evaluation of salt tolerance in tomato (var. Ailsa Craig): Responses of physiological and transcriptional changes in RBOH’s and ABA biosynthesis and signalling genes. Int. J. Mol. Sci. 2022, 23, 1603. [Google Scholar] [CrossRef]
  64. Jensen, C.R.; Battilani, A.; Plauborg, F.; Psarras, G.; Chartzoulakis, K.; Janowiak, F. Deficit irrigation based on drought tolerance and root signalling in potatoes and tomatoes. Agri. Water Manag. 2010, 98, 403–413. [Google Scholar] [CrossRef]
  65. Alian, A.; Altman, A.; Heuer, B. Genotypic difference in salinity and water stress tolerance of fresh market tomato genotypes. Plant Sci. 2000, 152, 59–65. [Google Scholar] [CrossRef]
  66. Lu, S. Effects of salt stress on sugar content and sucrose metabolism in tomato fruit. China Veg. 2012, 20, 56–61. [Google Scholar]
  67. Blum, A. Drought resistance water-use efficiency, and yield potential-are they compatible, dissonant, or mutually exclusive? Aust. J. Agric. Res 2005, 56, 1159–1168. [Google Scholar] [CrossRef]
  68. Samira, B.; Chandrappa, K.G.; Sharifah, B.A.H. Generation of Hematite Nanoparticles via Sol-Gel Method. Res. J. Chem. Sci. 2013, 3, 62–68. [Google Scholar]
  69. Parasad, B.; Dimir, D.C.; Bora, L. Effect of pre-harvest foliar spray of calcium and potassium on fruit quality of pear cv. Pathernakh. Sci. Resear. Essays 2015, 10, 376–380. [Google Scholar] [CrossRef]
  70. Akrimi, R.; Hajlaoui, H.; Rizzo, V.; Muratore, G.; Mhamdi, M. Agronomical traits, phenolic compounds and antioxidant activity in raw and cooked potato tubers growing under saline conditions. J. Sci. Food Agri 2020, 100, 3719–3728. [Google Scholar] [CrossRef]
  71. Pnueli, L.; Liang, H.; Rozenberg, M.; Mittler, R. Growth suppression, altered stomatal responses, and augmented induction of heat shock proteins in cytosolic ascorbate peroxidase (Apx1)-deficient Arabidopsis plants. Plant J. 2003, 34, 187–203. [Google Scholar] [CrossRef]
  72. Do, J.H.; Park, S.Y.; Park, S.H.; Kim, H.M.; Ma, S.H.; Mai, T.D.; Shim, J.S.; Joung, Y.H. Development of a Genome-Edited Tomato with High Ascorbate Content During Later Stage of Fruit Ripening Through Mutation of SlAPX4. Front. Plant Sci. 2022, 13, 836916. [Google Scholar] [CrossRef]
  73. Locato, V.; Cimini, S.; Gara, L.D. Strategies to increase vitamin C in plants: From plant defense perspective to food biofortification. Front. Plant Sci. 2013, 4, 152. [Google Scholar] [CrossRef]
  74. Guo, K.; Li, Z.; Tian, H.; Du, X.; Liu, Z.; Huang, H. Cytosolic ascorbate peroxidases plays a critical role in photosynthesis by modulating reactive oxygen species level in stomatal guard cell. Front. Plant Sci. 2020, 11, 446. [Google Scholar] [CrossRef] [PubMed]
  75. Pardo, J.M.; Rubio, F. Na+ and K+ transporters in plant signalling. In Transporters and Pumps in Plant Signaling; Geisler, M., Venema, K., Eds.; Springer: Berlin/Heidelberg, Germany, 2011; pp. 65–99. [Google Scholar]
  76. Zuo, K.J.; Qin, J.; Zhao, J.Y.; Ling, H.; Zhang, L.D.; Tang, K.X. Over-expression GbERF2 transcription factor in tobacco enhances brown spots disease resistance by activating expression of downstream genes. Gene 2007, 391, 80–90. [Google Scholar] [CrossRef] [PubMed]
  77. Feng, Y.; Backues, S.K.; Baba, M.; Heo, J.M.; Harper, J.W.; Klionsky, D.J. Phosphorylation of Atg9 regulates movement to the phagophore assembly site and the rate of autophagosome formation. Autophagy 2016, 12, 648–658. [Google Scholar] [CrossRef] [PubMed]
  78. Asins, M.J.; Irene, V.; Mohamed, M.A.; Raquel, O.; Paz Álvarez, D.M.R.S.; Jun, L.; Noelia, J.P.; Rosario, H.; Veronica, R.; Emiliona, C.; et al. Two closely linked tomato HKT coding genes are positional candidates for the major tomato QTL involved in Na+/K+ homeostasis. Plant Cell Environ. 2013, 36, 1171–1191. [Google Scholar] [CrossRef]
Figure 1. Layout of the experimental design in the tomato growing season.
Horticulturae 11 00301 g001
Figure 2. The irrigation schedules of tomato. RAM: readily available moisture; TAM: total available moisture.
Horticulturae 11 00301 g002
Figure 3. Heatmap showing different expressed genes under two water treatments (NMW, MW) in different time series data. Color is determined by z-score, ranging from −1.5 (blue) to 1.5 (yellow). Yellow color in the heatmap denotes upregulation and blue color denotes down regulation. The Y-axis denotes the different expressed genes. MW: magnetized water; NMW: non-magnetized water.
Horticulturae 11 00301 g003
Figure 4. Relative gene expression of three tomato varieties (Dorra, Ercole, and Gladys) under two water treatments (NMW: non-magnetic water, MW: magnetic water), different lower case letters indicate significant (p ≤ 0.05) difference among water treatments, different upper case letters indicate significant (p ≤ 0.05) difference among varieties according to LSD test.
Horticulturae 11 00301 g004
Table 1. Climate characteristics, reference evapotranspiration (ET0), crop evapotranspiration (ETc), and irrigation requirement (Irr. Req) of the experimental area using the CLIMWAT tool attached to CROPWAT software.
MonthMin Temp (°C)Max Temp (°C)Humidity (%)Wind (km/Day)Sun HoursRad MJ/m2/DayET0 mm/DayRain (mm)Eff rain (mm)ETc (mm)Irr. Req (mm)
March10.021.6732857.116.63.1120.019.450.5034.6
April13.825.5633117.619.84.6214.013.7106.9093.4
May16.630.0632859.724.15.757.06.9204.0197.0
June20.54.3582779.924.86.881.01.0241.4240.4
July21.637.75422511.326.57.470.00.0205.1205.1
Eff rain: effective rainfall; Max Temp: maximum temperature; Min Temp: minimum temperature; Rad: solar radiation.
Table 2. Physicochemical properties of irrigation water.
pHEC (mS cm−1)TDR (mg L−1)Ca2+
(meq L−1)
Mg2+
(meq L−1)
Na+
(meq L−1)
HCO3
(meq L−1)
Cl
(meq L−1)
SO42−
(meq L−1)
P (mg L−1)K+ (mg L−1)NO3
(mg L−1)
SAR
7.207.995647.0022.0318.7935.192.6055.9035.9520432.900.807.79
SAR: sodium absorption ratio; TDR: total dry residue.
Table 3. List of primers used for qPCR analysis.
Gene NamesAccession NumberPrimers
SlCATKU933832.1F:GGCTCCCAAGTGTGGTCATCA
R:GGATCAAACCTCGAGGGCAA
SlSODX14040.1F:AGGGAGGACATGAGCTCAGT
R: ACAGACACCACCGCTAGTTG
SlAPXDQ096286.1F:GTTTCCCACCCTCTCCCATG
R: CTCTCTGCCAGGGTGAAAGG
SlWRKYXM_026029062.1F: CCGGAAAGCCTCCATTGTCT
R: CCGGAAGATCCCACTGCACTT
SlERFXM_004251654.4F: ATCGTCGTCGTTGTATCGGG
R: TAGCAGTTTTTCCGGCGTA
SlNHXNM_001246987.1F: CCCTTCCCAGGCACTTAGTG
R: AATCTCGCCACAGCATCCAA
SlHKTHE962483.1F: TGTTTTGTGCTTTGGAGTGGA
R: TGGGGGTGAAAGAGTGGAGA
Table 4. Variation in aerial part fresh weight (APFW) and yield components of three tomato varieties (Dorra, Ercole, Gladys) under two irrigation water treatments (non-magnetized water: NMW; magnetized water: MW).
TY
(t ha−1)
APFW
(g Plant−1)
FFW
(g Plant−1)
MF
(g Plant−1)
NMF
(g Plant−1)
IWUE
(kg ha mm−1)
IWP
(kg ha mm−1)
DorraNMW50.70 ± 1.41 bA434.00 ± 48.38 bA1696.6 ± 0.03 aA1570 ± 0.03 bA126.6 ± 0.00 aA3.38 ± 0.33 bA0.10 ± 0.00 bA
MW67.20 ± 3.15 aA700.66 ± 65.27 aA2240.0 ± 0.07 bB2200 ± 0.04 aA40.0 ± 0.00 bB4.48 ± 0.10 aA0.15 ± 0.00 aA
ErcoleNMW39.60 ± 0.90 bB382.00 ± 36.38 aA1320.0 ± 0.02 aA1180.66 ± 0.0 bB138.33 ± 0.00 aA2.64 ± 0.09 bB0.08 ± 0.00 bB
MW60.90 ± 1.73 aA538.33 ± 126.50 aA2233.3 ± 0.04 aA2100 ± 0.07 aA133.33 ± 0.00 aB4.66 ± 0.73 aA0.14 ± 0.00 aA
GladysNMW27.20 ± 0.51 bC423.66 ± 76.32 bA740.0 ± 0.12 aB673.33 ± 0.1 bC66.60 ± 0.01 aB1.48 ± 0.05 bC0.04 ± 0.00 bC
MW42.90 ± 2.16 aB638.00 ± 31.82 aA1430.0 ± 0.05 aB1370 ± 0.03 aB60 ± 0.00 aB2.86 ± 0.20 aB0.09 ± 0.00 aB
ANOVAV*ns******
T********
V × T*ns*****
Means followed by the same letter(s) are not significantly different according to LSD test at p ≤ 0.05. ns: not significant, * p < 0.05, ** p < 0.01. FFW: fruit fresh weight; IWP: irrigation water productivity; IWUE: irrigation water use efficiency; MF: marketable fruit; NMF: non-marketable fruit; TY: tomato yield.
Table 5. Changes in firmness, total soluble solids (TSSs), and titrable acidity (TA) of the tomato varieties (Dorra, Ercole, Gladys) under two irrigation water qualities (non-magnetized water: NMW; magnetized water: MW).
FirmnessTSSs (°Brix)TA (mg AC 100 g−1 FW)
DorraNMW0.60 ± 0.01 aA6.26 ± 0.04 aB0.55 ± 0.00 Aa
MW0.86 ± 0.04 aA6.16 ± 0.07 aB0.58 ± 0.06 aA
ErcoleNMW0.60 ± 0.01 aA6.40 ± 0.28 aB0.29 ± 0.01 bC
MW0.87 ± 0.03 aA6.30 ± 0.18 aB0.60 ± 0.00 aA
GladysNMW0.45 ± 0.03 aB6.30 ± 0.07 bB0.42 ± 0.01 aB
MW0.86 ± 0.02 aA6.93 ± 0.10 aA0.41 ± 0.01 aB
ANOVAT*nsns
Vnsnsns
T × Vnsnsns
Means followed by the same letter(s) are not significantly different according to LSD test at p ≤ 0.05. ns: not significant, * p < 0.05. TA: titrable acidity; T: Treatment; TSSs: total soluble solids; V: variety.
Table 6. Changes in leaf hydrogen peroxide (H2O2) and antioxidant enzyme activity of three tomato varieties (Dorra, Ercole, Gladys) under two irrigation water qualities (NMW: non-magnetized water; MW: magnetized water).
H2O2
(µmol g−1 FW)
CAT
(µmol mg−1 Prot)
APX
(µmol mg−1 Prot)
SOD
(U mg−1 Prot)
GPOX
(µmol mg−1 Prot)
DorraNMW6.30 ± 0.01 aB19.68 ± 0.87 aC46.91 ± 1.00 aB52.53 ± 1.93 aB45.22 ± 1.41 aB
MW4.40 ± 0.03 bB10.16 ± 1.14 bC17.53 ± 0.45 bB43.27 ± 3.19 aB36.28 ± 1.41 bB
ErcoleNMW5.47 ± 0.03 aC28.21 ± 0.69 aB60.96 ± 1.40 aA46.38 ± 2.27 aB75.61 ± 0.68 aA
MW3.44 ± 0.00 bC12.41 ± 1.06 bB22.93 ± 1.13 bA28.93 ± 3.63 bC65.04 ± 1.01 bA
GladysNMW6.82 ± 0.03 aA32.69 ± 0.70 aA36.30 ± 0.74 aC106.89 ± 4.57 aA74.53 ± 1.76 aA
MW5.89 ± 0.01 bA17.05 ± 1.06 bA23.25 ± 1.34 bA53.66 ± 1.92 bA22.11 ± 1.90 bB
ANOVAT*******
Vns****
T × Vns****
Means followed by the same letter(s) are not significantly different according to LSD test at p ≤ 0.05. ns: not significant, * p < 0.05, ** p < 0.01. APX: ascorbate peroxidase; CAT: catalase; GPOX: guaiacol peroxidase; SOD: superoxide dismutase; T: treatment; V: variety.
Table 7. Changes in leaf malondialdehyde (MDA), proline, and soluble sugar content (SSC) of three tomato varieties (Dorra, Ercole, Gladys) under two irrigation water qualities (NMW: non-magnetic water; MW: magnetic water).
MDA
(µmol g−1 FW)
Proline
(µmol mg−1 Prot)
SSC
(µmol mg−1 Prot)
DorraNMW9.31 ± 0.20 aB11.06 ± 0.10 aA29.97 ± 0.37 aC
MW6.88 ± 0.46 bB6.33 ± 0.14 bA23.50 ± 0.78 bC
ErcoleNMW8.96 ± 0.18 aC8.24 ± 0.08 aB46.65 ± 0.92 aA
MW6.92 ± 0.02 bB5.18 ± 0.07 bC39.26 ± 0.53 bA
GladysNMW10.90 ± 0.16 aA10.71 ± 0.10 aA41.46 ± 0.67 aB
MW7.95 ± 0.06 bA7.28 ± 0.07 bB30.21 ± 0.62 bB
ANOVAT****
V***
T × Vns**
Means followed by the same letter(s) are not significantly different according to LSD test at p ≤ 0.05. ns: not significant, * p < 0.05, ** p < 0.01. T: treatment; V: variety.
Table 8. Pearson’s correlation test among the assessed traits of the tomato variety Dorra. Significant at p ≤ 0.05 (*), p ≤ 0.01 (**), and not significant (ns).
APFWFFWMFNMFIWUEIWPFTSSsTAH2O2CATAPXSODGPOXMDAProlineSSC
TY 0.08 ns−0.99 **0.42 ns−1.0 **−1.0 **0.15 ns0.18 ns0.46 ns0.75 ns0.97 **0.99 **−0.21 ns0.94 **−0.04 ns0.09 **0.97 **
APFW10.04 ns0.10 ns0.04 ns0.1 ns0.04 ns0.32 ns0.08 ns0.1 ns0.05 ns0.09 ns0.20 ns0.01 ns0.07 ns−0.10 ns0.12 ns0.80 ns
FFW 1−0.17 ns0.48 ns1.00 **1.00 **0.66 ns0.42 ns−0.32 ns−0.31 ns0.12 ns0.06 ns−0.12 ns0.31 ns0.04 ns0.07 ns0.07 ns
MF 1−4750.02 ns1.00 ns0.17 ns0.2 ns0.12 ns0.16 ns0.84 ns0.09 ns0.52 ns0.06 ns0.32 ns0.41 ns
NMF 1−1.0 **−1.0 **0.38 ns−0.27 ns0.48 ns−0.14 ns0.40 ns0.43 ns0.42 ns0.48 ns−0.23 ns0.39 ns0.53 ns
IWUE 11.0 **1.0 **−1.0 **−1.0 **−0.78 *−1.0 **−1.0 **−1.0 **−1.0 **−1.0 **−1.0 **−1.0 **
IWP 11.0 **−1.0 **−1.0 **−1.0 **−1.0 **−1.0 **−1.0 **−1.0 **−1.0 **−1.0 **−1.0 **
F 1−0.12 ns−0.03 ns−0.69 ns−0.34 ns−0.29 ns0.07 ns−0.12 ns−0.44 ns−0.26 ns−0.21 ns
TSSs 1−0.78 ns0.46 ns0.34 ns0.18 ns−0.23 ns0.20 ns0.12 ns0.22 ns0.00 ns
TA 10.05 ns0.29 ns0.46 ns0.01 ns0.42 ns−0.12 ns0.43 ns0.61 ns
H2O2 10.81 *0.76 ns−0.15 ns0.57 ns0.01 ns0.77 ns0.63 ns
CAT 10.97 **−0.12 ns0.90 *−0.01 ns0.97 **0.92 **
APX 1−0.18 ns0.93 **−0.02 ns0.99 **0.97 **
SOD 1−0.38 ns−0.58 ns−0.20 ns−0.19 ns
GPOX 10.17 ns0.92 **0.94 **
MDA 1−0.07 ns0.21 ns
Proline 10.96 **
APFM: aerial part fresh weight; APX: ascorbate peroxidase; CAT: catalase; F: firmness; FFW: fruit fresh weight; GPOX: guaiacol peroxidase; H2O2: hydrogen peroxide; IWP: irrigation water productivity; IWUE: irrigation water use efficiency; MDA: malondialdehyde; MF: marketable fruit; NMF: non-marketable fruit; SOD: superoxide dismutase; SSC: soluble sugar content; TA: titrable acidity; TSSs: total soluble solids; TY: tomato yield.
Table 9. Pearson’s correlation test among the assessed traits of the tomato variety Ercole. Significant at p ≤ 0.05 (*), p ≤ 0.01 (**), and not significant (ns).
APFWFFWMFNMFIWUEIWPFTSSsTAH2O2CATAPXSODGPOXMDAProlineSSC
TY0.12 ns−0.99 **−0.68 ns−0.93 **−1.0 **−1.00 **0.20 ns0.47 ns−0.01 ns0.11 ns−0.99 **−0.99 **0.92 **−0.98 **−0.98 **−0.99 **−0.97 **
APFW10.81 ns0.42 ns0.02 ns0.51 ns0.22 ns0.03 ns0.07 ns0.32 ns0.04 ns0.11 ns0.96 ns0.05 ns0.80 ns−0.21 *0.22 ns0.17 ns
FFW 10.70 ns0.93 **−1.0 **−1.00 **0.40 ns−0.47 ns0.04 ns−0.13 ns0.99 **0.99 **−0.91 *0.98 **0.99 **0.99 **0.97 **
MF 10.86 *−1.0 **−1.00 **0.22 ns−0.64 ns0.61 ns−0.60 ns0.67 ns0.63 ns−0.44 ns0.72 ns0.69 ns0.68 ns0.65 ns
NMF 1−1.0 **−1.00 **0.39 ns−0.70 ns0.21 ns−0.41 ns0.93 **0.90 *−0.83 *0.94 **0.90 *0.92 **0.87 *
IWUE 11.00 **1.0 **1.0 **0.30 ns0.64 ns−1.0 **−1.0 **1.0 **−1.0 **−1.0 **−1.0 **−1.0 ns
IWP 11.0 **1.0 **0.02 ns1.0 **−1.0 **−1.0 **1.0 **−1.0 **−1.0 **−1.0 **−1.0 **
F 1−0.18 ns0.29 ns0.29 ns0.42 ns0.43 ns−0.51 ns0.37 ns0.38 ns0.42 ns0.33 ns
TSSs 10.31 ns0.46 ns0.52 ns0.43 ns0.50 ns−0.47 ns−0.36 ns−0.43 ns−0.29 ns
TA 1−0.23 ns−0.03 ns−0.05 ns0.27 ns0.0 ns0.03 ns−0.01 ns0.01 ns
H2 O2 1−0.15 ns−0.08 ns0.01 ns−0.25 ns−0.12 ns−0.13 ns0.10 ns
CAT 10.99 **−0.95 **0.98 **0.97 **0.99 **0.957 **
APX 1−0.94 **0.97 **0.98 **0.99 **0.97 **
SOD 1−0.89 *−0.87 *−0.92 **−0.86 *
GPOX 10.98 **0.98 **0.97 **
MDA 10.99 **0.99 **
Proline 10.98 **
APFM:aerial part fresh weight; APX: ascorbate peroxidase; CAT: catalase; F: firmness; FFW: fruit fresh weight; GPOX: guaiacol peroxidase; H2O2: hydrogen peroxide; IWP: irrigation water productivity; IWUE: irrigation water use efficiency; MDA: malondialdehyde; MF: marketable fruit; NMF: non-marketable fruit; SOD: superoxide dismutase; SSC: soluble sugar content; TA: titrable acidity; TSSs: total soluble solids; TY: tomato yield.
Table 10. Pearson’s correlation test among the assessed traits of the tomato variety Gladys. Significant at p ≤ 0.05 (*), p ≤ 0.01 (**), and not significant (ns).
FFWMFNMFIWUEIWPFTSSsTAH2O2CATAPXSODGPOXMDAProlineSSC
TY0.99 **0.32 ns0.00 ns−1.00 **−1.00 **−0.14 ns0.67 ns0.94 **−0.05 ns−0.99 **−0.98 **0.98 **−0.99 **0.34 ns−0.99 **−0.99 **
APFW0.12 ns0.61 ns0.10 ns0.32 ns0.55 ns−0.36 ns0.11 ns0.25 ns−0.07 ns−0.33 ns0.22 ns0.17 ns−0.12 ns−0.02 *0.05 ns−0.10 ns
FFW10.340.111.00 **1.00 **−0.02 ns0.67 ns0.92 **0.03 ns−0.99 **−0.95 **0.97 **−0.98 **0.24 ns−0.99 **−0.99 **
MF 10.371.00 **1.00 **−0.39 ns0.27 ns0.070.27 ns−0.28 ns−0.31 ns0.26 ns−0.32 ns0.52 ns−0.34 ns−0.38
NMF 1−1.00 **−1.00 **0.32 ns0.00 ns−0.170.65 ns−0.06 ns0.13 ns−0.02 ns0.05 ns−0.56−0.04 ns−0.08
IWUE 11.00 **−1.00 **1.00 **1.00 **1.00 **−1.00 **−1.00 **1.00 **−1.00 **1.00 **−1.00 **−1.00 **
IWP 1−1.00 **1.00 **1.00 **1.00 **−1.00 **−1.00 **1.00 **−1.00 **1.00 **−1.00 **−1.00 **
F 1−0.63 ns0.08 ns−0.34 ns−0.03 ns0.11 ns−0.11 ns0.14 ns−0.65 ns0.05 ns−0.05
TSSs 10.52 ns0.51 ns−0.62 ns−0.61 ns0.70 ns−0.71 ns0.28 ns−0.66 ns−0.60
TA 1−0.29 ns−0.94 **−0.96 **0.95 **−0.94 **0.29 ns−0.94 **−0.93 **
H2O2 10.03 ns0.20 ns−0.04 ns0.04 ns−0.37 ns0.03 ns0.06
CAT 10.95 **−0.96 **0.97 **−0.23 ns0.98 **0.98 **
APX 1−0.97 **0.98 **−0.47 ns0.97 **0.97 **
SOD 1−0.99 **0.34 ns−0.98 **−0.97 **
GPOX 1−0.38 ns0.99 **0.97 **
MDA 1−0.32 ns0.72 ns
Proline 10.99 **
APFM: aerial part fresh weight; APX: ascorbate peroxidase; CAT: catalase; F: firmness; FFW: fruit fresh weight; GPOX: guaiacol peroxidase; H2O2: hydrogen peroxide; IWP: irrigation water productivity; IWUE: irrigation water use efficiency; MDA: malondialdehyde; MF: marketable fruit; NMF: non-marketable fruit; SOD: superoxide dismutase; SSC: soluble sugar content; TA: titrable acidity; TSSs: total soluble solids; TY: tomato yield.
Disclaimer/Publisher’s Note: The statements, opinions and data contained in all publications are solely those of the individual author(s) and contributor(s) and not of MDPI and/or the editor(s). MDPI and/or the editor(s) disclaim responsibility for any injury to people or property resulting from any ideas, methods, instructions or products referred to in the content.

