Article

Quality Characteristics and Metabolomics Analysis of Two New Varieties of Tremella fuciformis

1
College of Life Sciences, Fujian Agriculture and Forestry University, Fuzhou 350002, China
2
Gutian Edible Fungi Research Institute, Fujian Agriculture and Forestry University, Ningde 352200, China
3
Fujian Edible Fungi Industry Technology Innovation Research Institute, Fuzhou 350002, China
*
Author to whom correspondence should be addressed.
These authors contributed equally to this work.
Horticulturae 2025, 11(3), 273; https://doi.org/10.3390/horticulturae11030273
Submission received: 8 February 2025 / Revised: 27 February 2025 / Accepted: 28 February 2025 / Published: 3 March 2025
(This article belongs to the Special Issue Edible Mushrooms: Genetics, Genomics, and Breeding)

Abstract

:
Tremella fuciformis Berk., also known as white fungus and snow fungus, is one of the important edible and medicinal mushrooms in China. The quality characteristics and metabolites of different T. fuciformis varieties directly affect the stability of their processed products. In this study, two new varieties of Tremella fuciformis, namely ’TYH-SD1’ (yellow) and ’TWH-SD2’ (white), which were obtained by the team through single-spore crossbreeding and its control varieties Tr21 (yellow) and Tr01 (white), were used as test materials. The characteristics and nutritional quality of the four varieties of substrates were comparatively analyzed, while metabolomics was employed to investigate the differences in flavor substances. The results demonstrate that TYH-SD1 and TWH-SD2 had a higher rehydration rate and faster rehydration speed compared with the control strains Tr21 and Tr01, with a smaller stem and higher yield. Notably, TWH-SD2 had a 29.06% increase in its rehydration rate and it had higher contents of crude polysaccharide and vitamin D3. The surface of TYH-SD1 ear pieces exhibited a porous structure with a larger pore size and the surface of TWH-SD2 ear pieces displayed a surface characterized by connected gully-like protrusions and fewer indentations, which were significantly different from that of Tr21 and Tr01 ear pieces. The textural analysis shows that TYH-SD1 and TWH-SD2 ear pieces were softer and more elastic, with greater cohesion and recovery, indicating that they had high tensile and deformation recovery ability. Metabolomics analysis revealed that the relative content of aldehydes in the volatile flavor substances TYH-SD1 and TWH-SD2 was high in n-alpha-aldehyde, nonanaldehyde, and n-pentanal. The relative content of alkanes in TYH-SD1 was second only to that of aldehydes, with decane having the highest content, contributing to its more almond aroma, fruity aroma, and fat aroma. TWH-SD2 exhibited the highest concentration of alcohols, accounting for 43.57%, which may result in a clear, mushroom, and lipid odor. The above results will provide theoretical basis for the further production, processing, and application of the new varieties.

1. Introduction

Fungi including mushrooms have been proven to be an important biosource of numerous metabolites, having a huge variety of chemical structures and diverse bioactivities. Tremella fuciformis Berk. is a traditional edible fungus in China with significant medicinal value [1,2,3,4,5]. It has a smooth and gelatinous texture, a refreshing and hydrating taste, and is rich in nutrients, including carbohydrates, dietary fiber, amino acids, vitamins, and trace elements [6]. T. fuciformis contains various bioactive compounds, such as Tremella polysaccharides, which exhibit immune-regulating, anti-tumor, antioxidant, hypoglycemic, hypolipidemic, and memory-enhancing properties [7,8,9]. With the development of society and growing awareness of health, T. fuciformis, both in its natural form and as a processed product, has attracted considerable attention from scholars both domestically and internationally, presenting substantial market potential and prospects for further development. As agricultural products gradually transition from primary to deep processing, T. fuciformis, as a natural food material, holds significant potential for the development of prepared foods, natural food additives, food replacements, meal substitutes, and even new emergency disaster foods. Its development prospects are considerable [10,11,12]. Particularly in the context of flavor compound production [13], T. fuciformis plays a vital role. Flavor is not only a key indicator for assessing the quality of edible mushrooms, but also a crucial factor influencing consumer preferences.
Currently, the varieties of T. fuciformis available have similar production traits and quality, with relatively low yields. These varieties are unable to meet the growing demand for products requiring advanced processing, such as freeze-dried T. fuciformis soup and sliced T. fuciformis. There is a lack of specialized varieties suited for such processing needs [14]. Such knowledge would enable the extraction of flavor compounds from a particular region of the mushroom, which is safer for consumption compared to alternatives such as synthetic flavoring agents. In this study, the two new varieties of T. fuciformis (TYH-SD1 and TWH-SD2) were obtained by single-spore crossbreeding. The characteristics and nutritional quality of the four varieties of substrates were comparatively analyzed, and the differences in flavor substances were analyzed by metabolomics. The results provide a crucial foundation for the development of various T. fuciformis products and offer valuable insights for further research into the production of high-quality flavor compounds.

2. Materials and Methods

2.1. Materials

As shown in Figure 1, ”Fuyin Yellow Fungus” (No. TYH-SD1) and ”Fuyin Snow Fungus” (No. TWH-SD2) are two new T. fuciformis varieties developed by our laboratory through single-spore crossbreeding. The parental strains used for these varieties were Tr21, TWW01-AX and Tr01, and TWW01-AX, respectively. “Fuyin Yellow Fungus” (No. TYH-SD1), a yellow variety, was cultivated using Tr21 as the control strain and holds the non-major crop variety identification code Min. ID 2022007. It is preserved at the China Center for Type Culture Collection (CCTCC) with the preservation number CCTCC NO: M 2023494. “Fuyin Snow Fungus” (No. TWH-SD2), a white variety, was cultivated using Tr01 as the control strain and carries the non-major crop variety identification code Min. ID 2022006. It is preserved at CCTCC with the preservation number CCTCC NO: M 2023495. The associated fungus Annulohypoxylon stygium, used in the cultivation of T. fuciformis TYH-SD1, TWH-SD2, Tr01, and Tr21, is consistent and preserved at the Gutian Edible Fungi Research Institute, Fujian Agriculture and Forestry University (Ningde, Fujian Province, China). The cultivation material formula consisted of 84% cottonseed hulls, 15% bran, 1% gypsum powder, and a moisture content of 55–60%. The entire cultivation period (42 days) should be maintained at an environmental temperature of 20 °C to 25 °C and a relative humidity of 80% to 90%.

2.2. Evaluation of Production Performance and Agronomic Traits

A T. fuciformis cultivation room was divided into three areas (front, middle, and back) and harvested when the T. fuciformis fruiting bodies were mature. Five fungus packets were randomly selected from each area, as well as 15 fungus packets of each variety containing 45 T. fuciformis fruiting bodies. The indices (fresh weight, dry weight, rehydration efficiency, rehydration rate, remove pedicle weight, radicle weight, fruiting body elevation, biological efficiency, contamination rate) of a single packet were measured [15]. Biological efficiency was calculated as (average fresh weight of single T. fuciformis packet/dry weight of cultivation material of single packet) × 100%, where the dry weight of a single rod of the cultivation material was 0.8 kg.

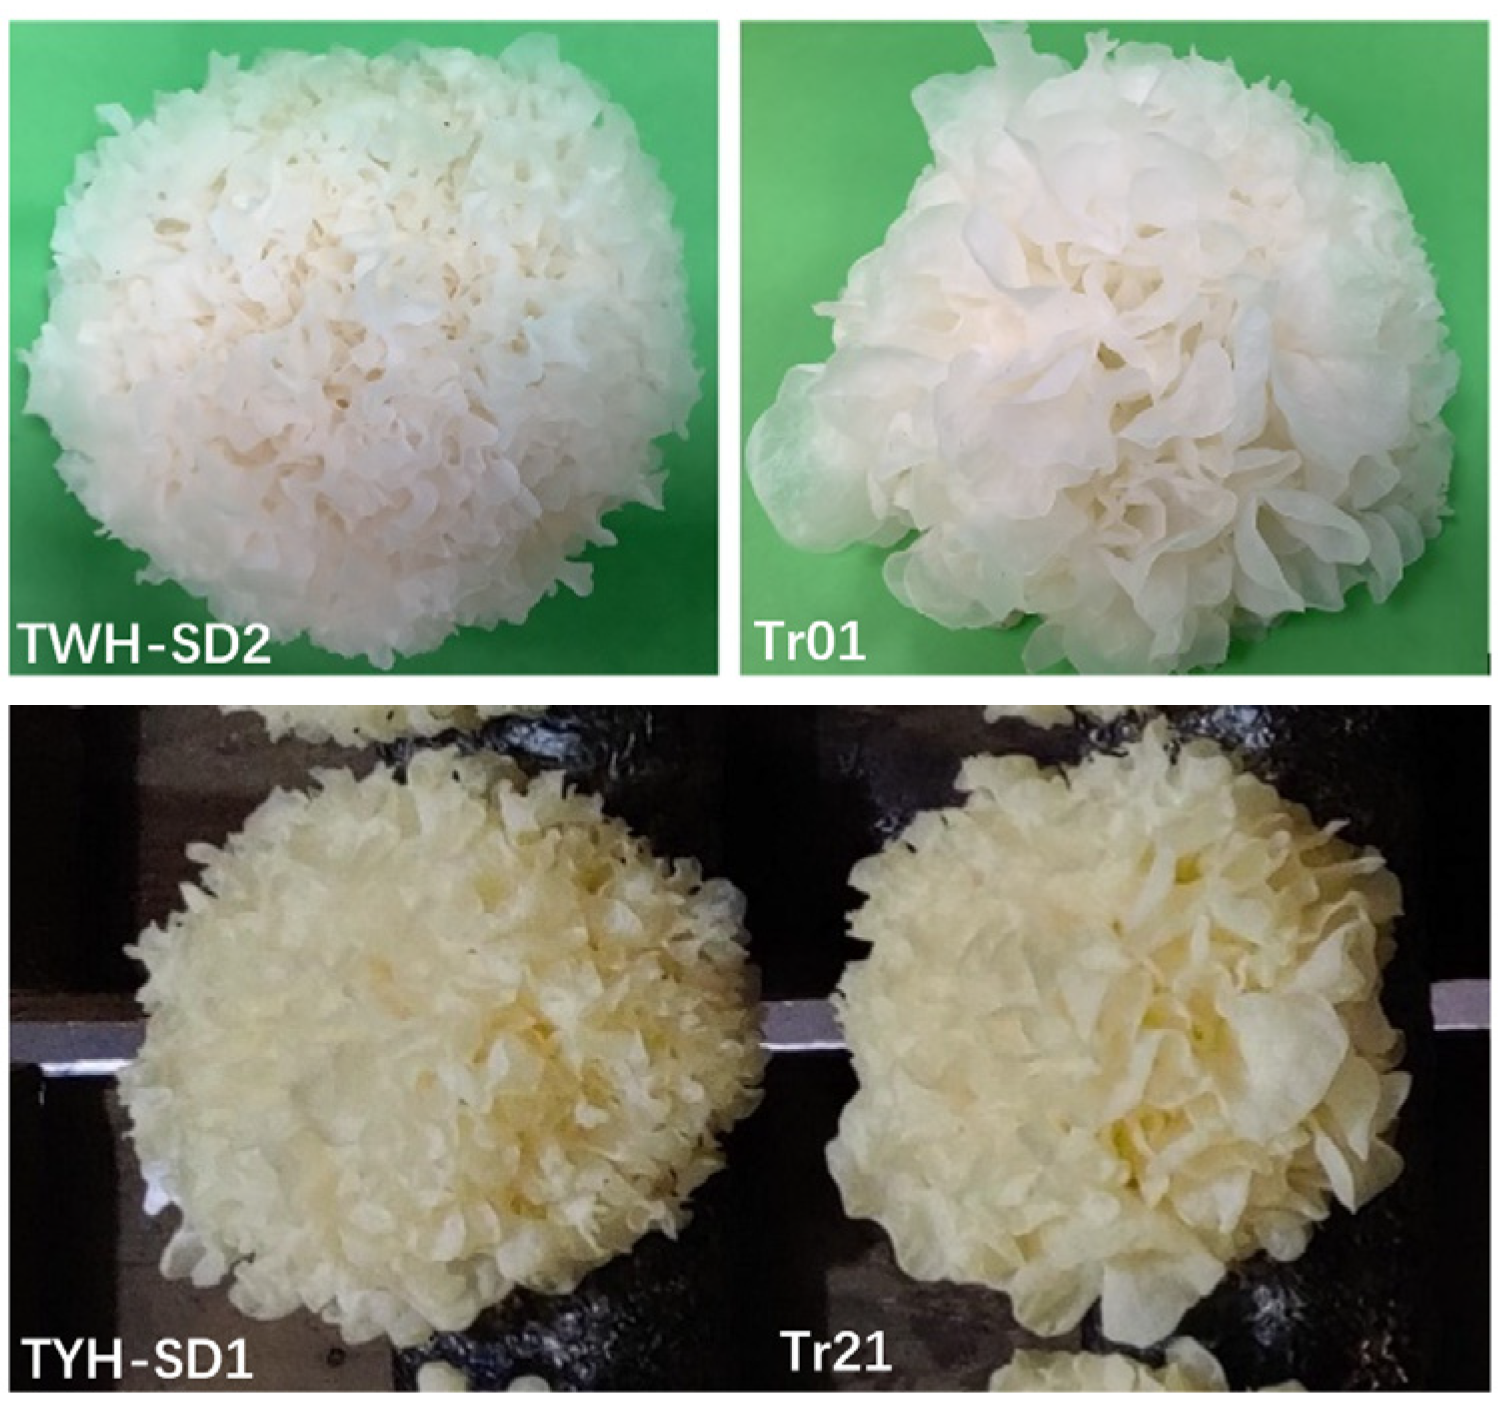
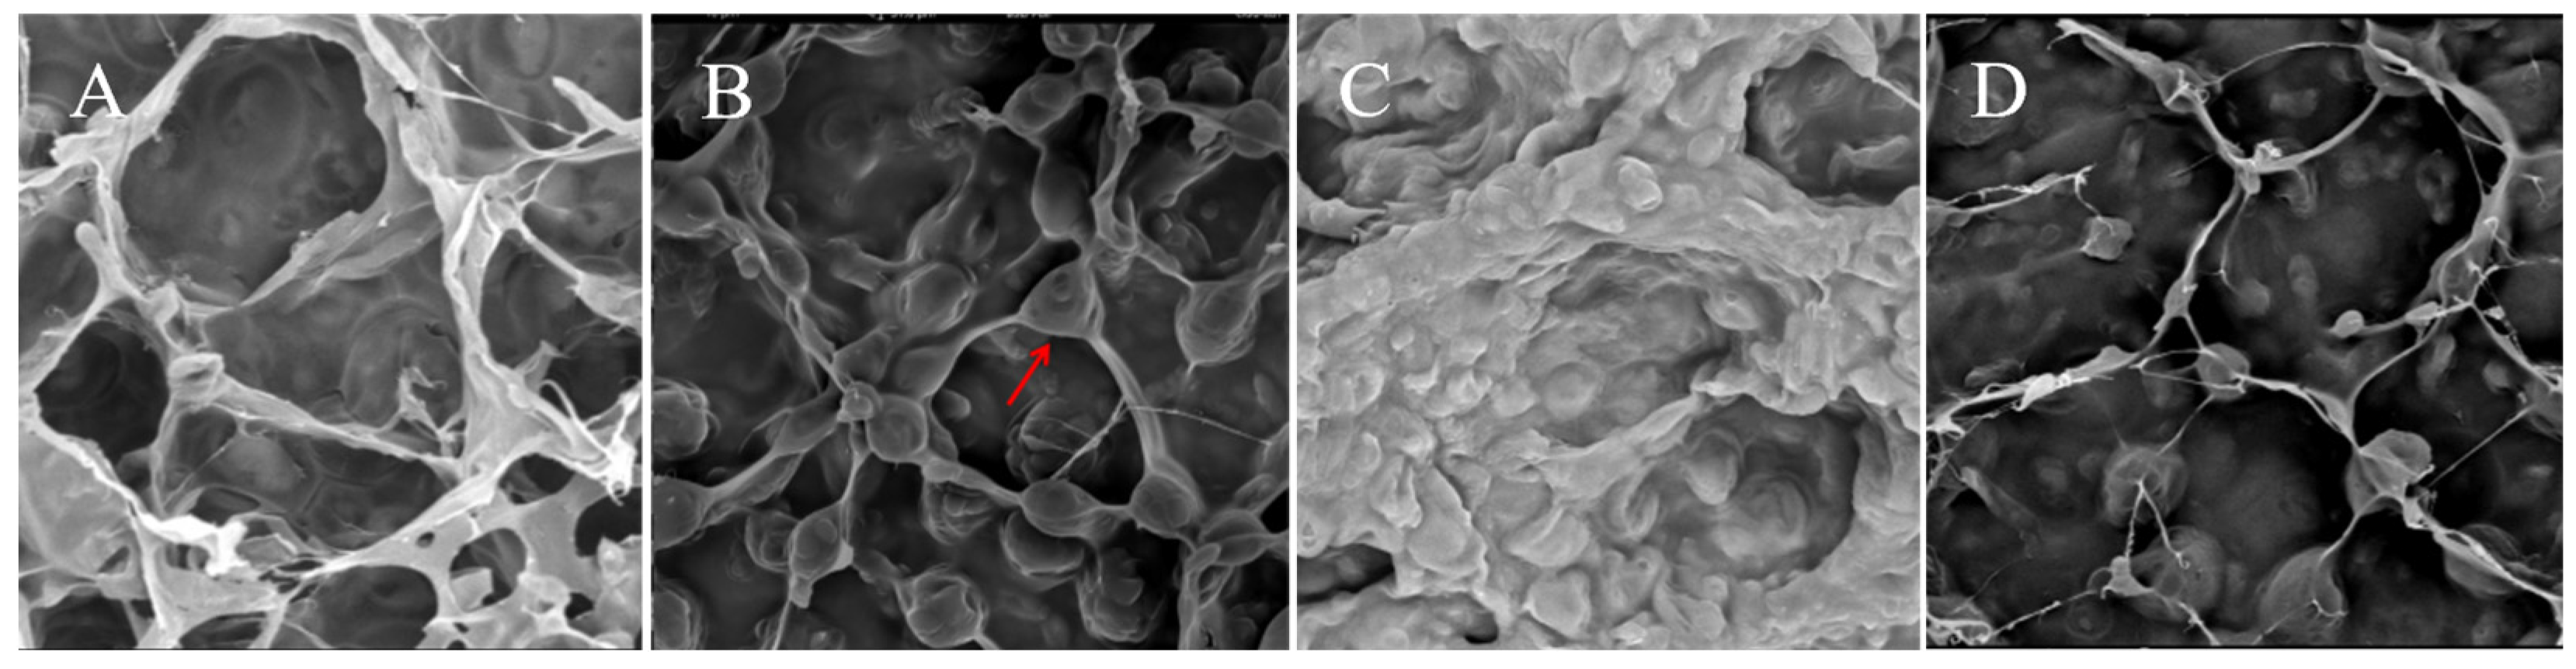
2.3. Observation of the Morphological Characteristics of Fruiting Bodies and Ear Pieces

The outer ear slices of the fruiting bodies were carefully extracted, and the slices were dried using a vacuum freeze dryer, and then the micro-morphological characteristics of the surfaces of the ear slices of TYH-SD1, Tr21, TWH-SD2, and Tr01 were observed using a scanning electron microscope (SEM) provided by the Phenom Scientific Instruments Co., Ltd. (Shanghai, China), while the micro morphologies were obtained under a magnification of 5200×.

2.4. Determination of Nutrient Composition

The ash was determined according to GB 5009.4-2016 “National Food Safety Standard—Determination of Ash in Foods” [16]. The crude protein was determined according to GB 5009.5-2016 “National Food Safety Standard—Determination of Protein in Foods” [17]. The crude fat was determined according to GB 5009.6-2016 “National Food Safety Standard—Determination of Fat in Foods” [18]. The crude fiber determination based on GB/T 5009.10-2003 “ Determination of Crude Fiber in Vegetable Foods” [19]. The crude polysaccharide determination based on NY/T 1676-2008 “Determination of Crude Mushroom Polysaccharides” [20]. The vitamin D3, vitamin B2, and vitamin C determination based on GB 5009.82-2016 “National Food Safety Standard—Determination of Vitamins A, D and E in Foods”, GB 5009.85-2016 “National Food Safety Standard—Determination of Vitamin B2 in Foods”, and GB 5009.86-2016 “National Food Safety Standard—Determination of Ascorbic Acid in Foods”, respectively [21,22,23].

2.5. Measurement of Texture Characteristics

The textural properties of four different varieties of T. fuciformis substrates, TYH-SD1, TWH-SD2, Tr21, and Tr01, were analyzed by using a Rapid TA+ texture meter from the Tengba Instrument Technology Co., Ltd. (Shanghai, China) to determine a total of five indices, including hardness, elasticity, chewing, cohesion, and repulsiveness. A total of 15 grams of ear slices were extracted from each of the four different varieties of fresh T. fuciformis fruiting bodies, TYH-SD1, TWH-SD2, Tr21, and Tr01, and the textural properties were determined.
The testing conditions were as follows: a cylindrical probe of P/36 was used, the full mass structure test mode was selected, the test type was a downward compression, the target distance was 30 mm, the interval between two downward compressions was 3 s, the test speed was 1 mm/s, the trigger point type was force, and the trigger force was 10 gf. Hardness is the maximum force value in the first downward compression zone in gf, which is manifested as the sample’s resistance [24]; elasticity is the ratio of the time taken for the second compression to the time taken for the first compression, i.e., T2/T1; chewability = (A2/A1) × hardness × elasticity; A1 and A2 are the area of the upper part of the horizontal axis contained in the curved portion of the graphs of the first and second downward compression, respectively, which is an indication of the sample’s sustained resistance to chewing; cohesion = A2/A1; reversionability = A5/A4, with A4 and A5 being the area of the region shown in the first downward pressure plot.

2.6. Determination of Volatile Flavor Substances

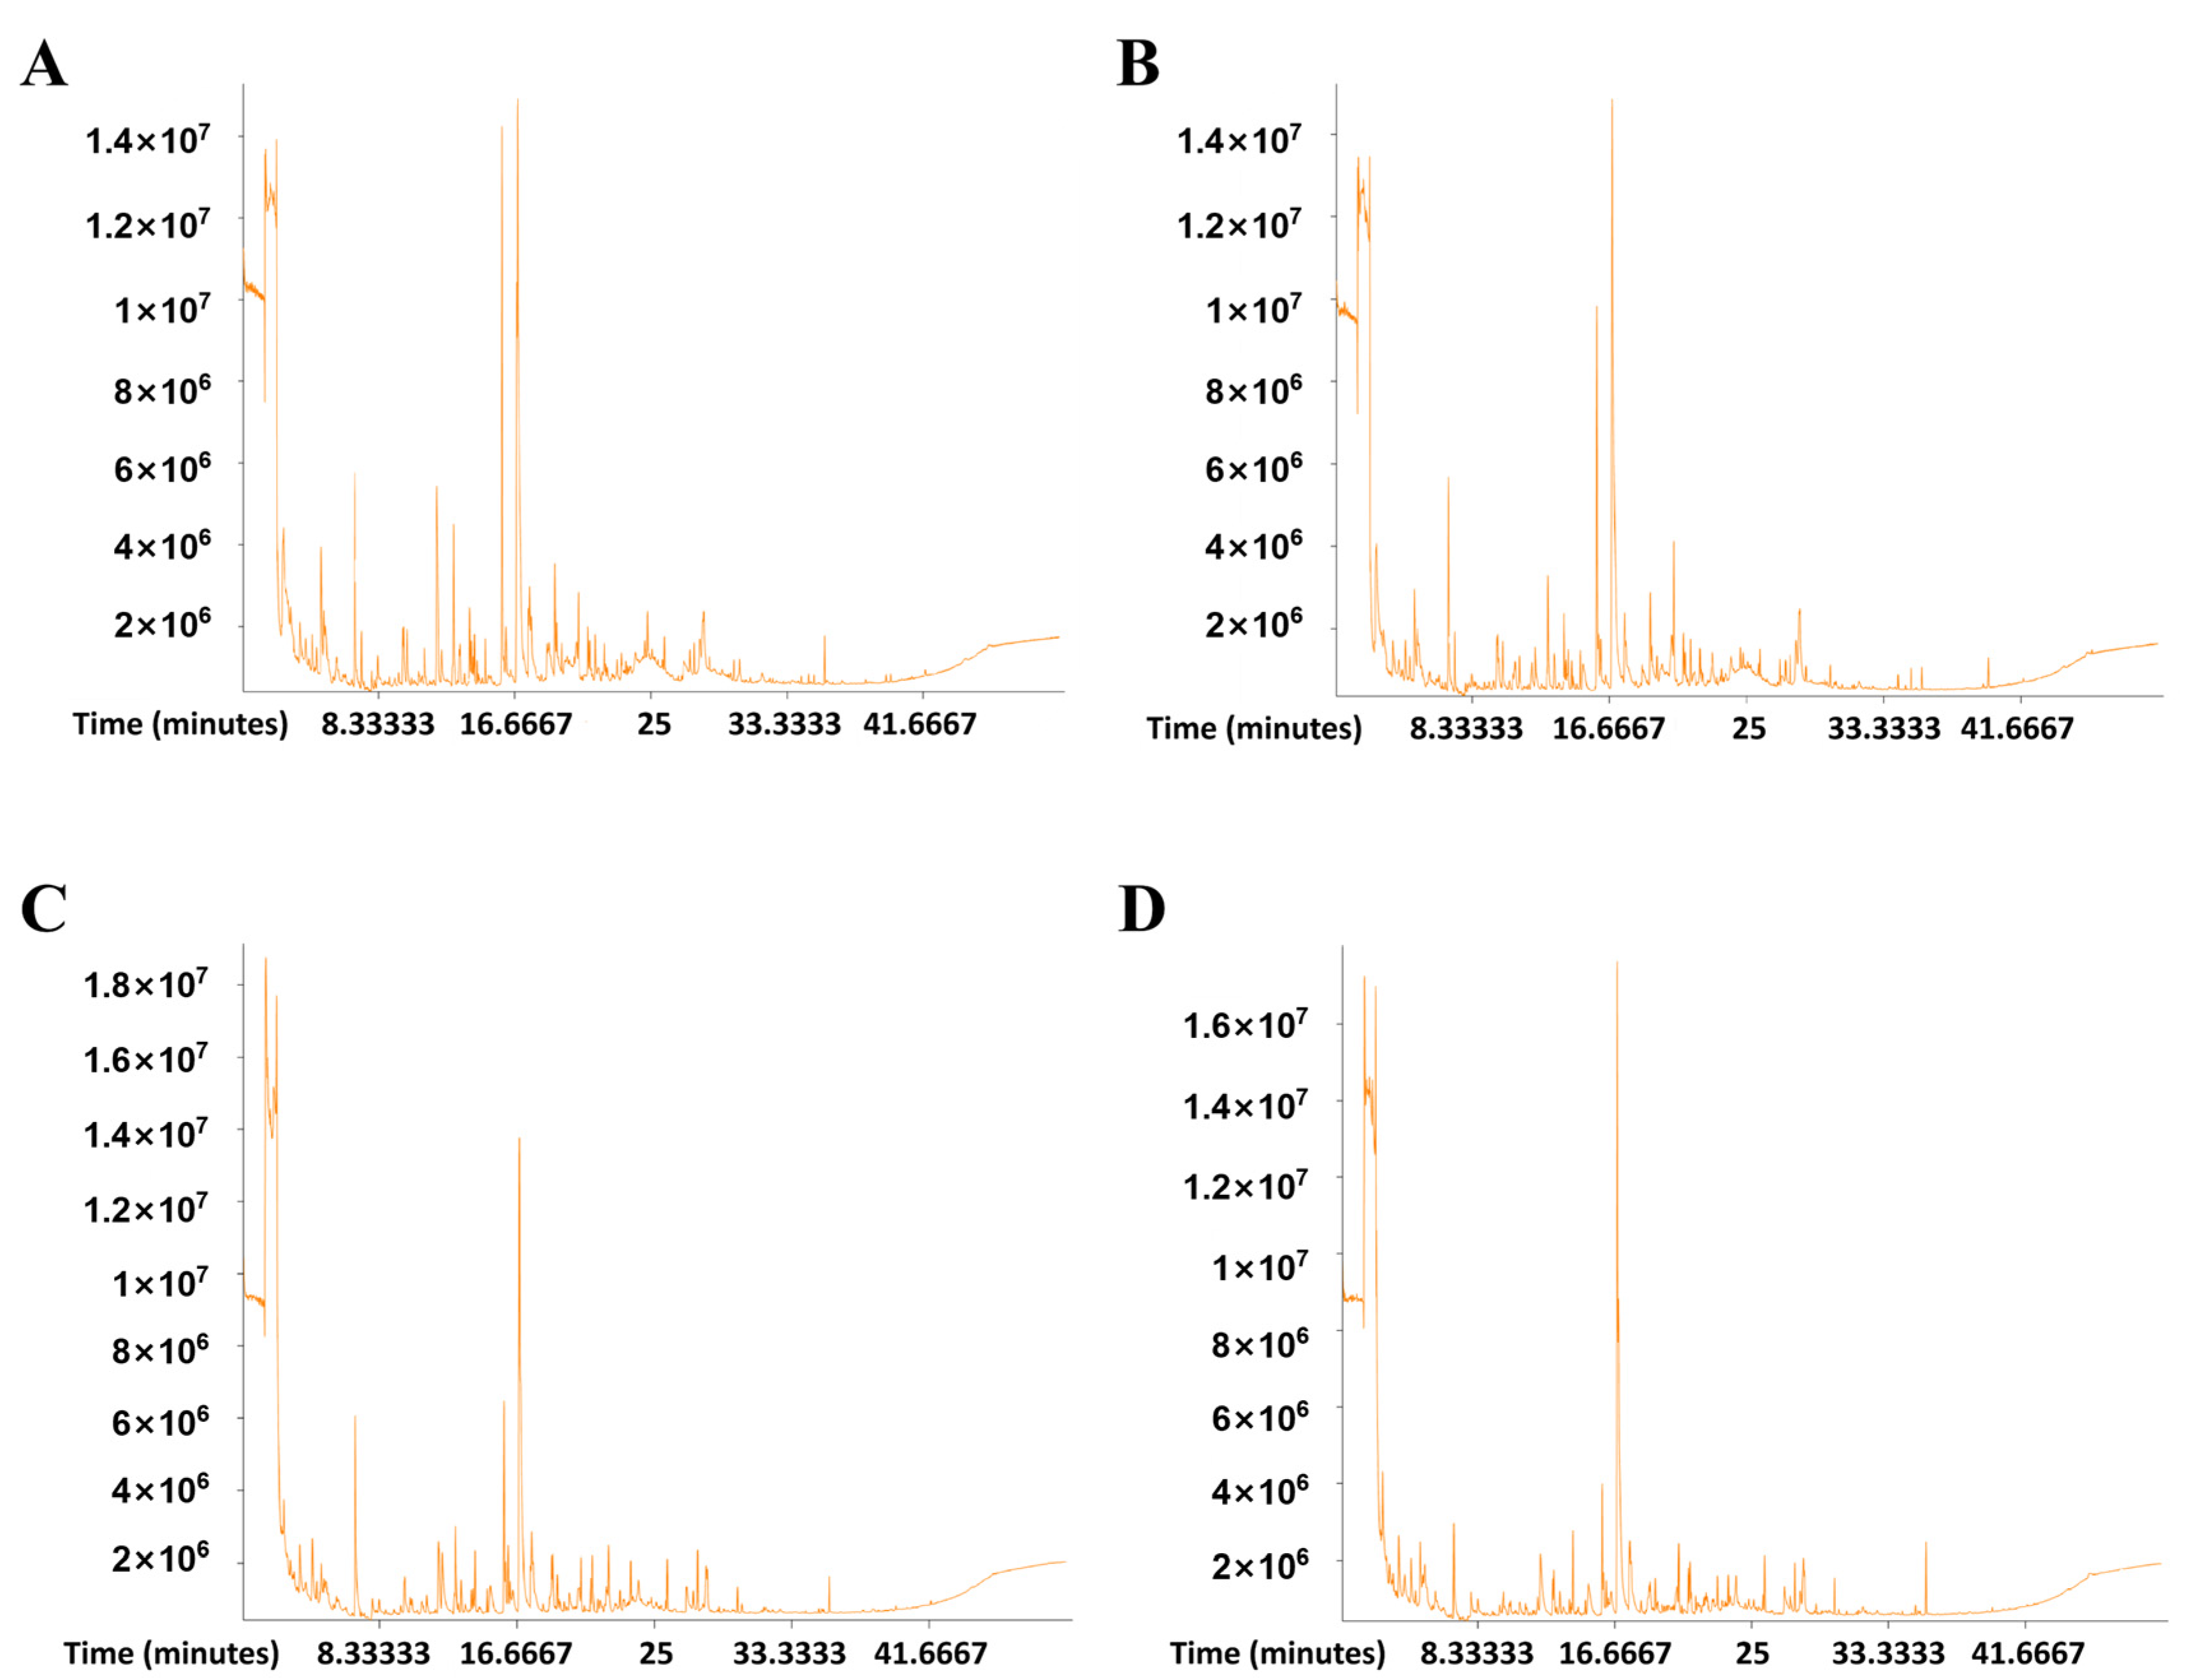
2.6.1. Sample Pretreatment and Headspace Solid Phase Microextraction Gas Chromatography (HS-SPME-GC-MS) Conditions

About 700 mg of TYH-SD1, Tr21, TWH-SD2, and Tr01 fresh T. fuciformis ear slices were weighed into a 20 mL headspace vial, and 10 μL of 2-octanol was added as the internal standard, while a solid phase microextraction head was applied to extract the samples for 30 min at 60 °C for the volatile substance enrichment; the samples were then desorbed at 250 °C for 4 min in the GC-MS inlet. Six repetitions were conducted for each variety.
Gas chromatography (7890B,.Agilent Technologies Inc., Santa Clara, CA, USA) conditions: DB-Wax (30 m × 250 μm × 0.25 μm) capillary column; non-split injection at the inlet port; inlet port temperature of 250 °C; column chamber warming program: initial temperature of 40 °C, maintained for 4 min, and then 5 °C/min to 245 °C and maintained for 5 min; the carrier gas was helium, and the column flow rate was 1.0 mL/min.
Mass spectra (5977B, Agilent Technologies Inc., Santa Clara, CA, USA) were acquired with a Bruker microTOF-QII ESI-MS Spectroscopy (Bruker Daltonics, Bremen, Germany). The analysis conditions are electron bombardment (EI) ionization source; ionization voltage −70 eV; transfer line temperature 250 °C; ion source temperature 230 °C; quadrupole temperature 150 °C; interface temperature 250 °C; scanning range 20~400 m/z.

2.6.2. Characterization and Quantification of Volatile Compounds

The qualitative and quantitative analysis based on the total ion flow chromatogram (TIC) obtained, the NIST database was used, which was then combined with the retention time, mass spectrometry quantitative data, and the degree of match to preliminarily determine the material composition of the volatile compounds. The relative content of each volatile compound (each peak) in T. fuciformis was detected by the normalization method of the peak area.

2.6.3. Screening of Flavor Compounds and Analysis of Variance

Principal component analysis (PCA) and orthogonal partial least squares-discriminant analysis (OPLS-DA) were performed by SIMCA software (V16.0.2, Sartorius Stedim Data Analytics AB, Umea, Sweden). Meanwhile, in order to verify the quality of the OPLS-DA model, seven-fold cross validation was used; then the model validity was judged by an R2Y (model interpretability for categorical variable Y) and Q (model predictability) obtained after cross-validation; finally, the model validity was further assessed by a permutation test (PCA). Finally, the model validity was further assessed by a permutation test.
At the same time, the screening thresholds of different volatile compounds were obtained by using p < 0.05 for a Student’s t-test in univariate statistical analysis and VIP > 1 for the projected significance of the variables in the first principal component of the OPLS-DA model in multivariate statistical analysis. Meanwhile, the information on differential volatile compounds between TYH-SD1 and Tr21, TWH-SD2, and Tr01 was further screened to obtain volatile compounds with accurate flavor information according to the FooDB (accessed on 30 September 2022) database, and the accumulation of differential volatile compounds and differential flavor compounds between the two varieties was demonstrated by plotting volcano diagrams and clustered heat maps.

2.7. Data Statistics and Analysis

The data of each group were statistically analyzed using IBM SPSS Statistics 20 software, and one-way ANOVA (one-way ANOVA) was used to assess the significant differences between the results of the samples of different groups, while a Duncan’s test was used for multiple comparisons between the groups. Excel software was used to make graphs. All tests were conducted in at least triplicate and the results presented as mean ± standard deviation.

3. Results

3.1. Analysis of Agronomic Traits and Production Performance of New Varieties of T. fuciformis

The results of the agronomic traits and production performance indices of the four varieties of mature fruiting bodies are shown in Table 1. TYH-SD1 mature fruiting bodies had a single fresh weight of 134 ± 14.1 g and a single dry weight of 34.1 ± 2.1 g, which increased the dry weight yield of TYH-SD1 by 16.38% and the rehydration rate by 2.6% compared to that of Tr21. The fresh weight of TWH-SD2 mature fruiting bodies had a single fresh weight of 125 ± 14.9 g and a single dry weight of 17.86 ± 1.69 g, which increased the fresh weight yield by 5.65% compared to that of Tr01. The rehydration rate and rehydration speed of the single TWH-SD2 dry fruiting body increased 8.54% and 29.06%, respectively, while there was a significant reduction in the weight of the stem (the harder part at the bottom), thus indicating processability; the weight of the edible part was increased. The appearance of the two new varieties was observed to be fluffier, and the rate of green mold contamination was reduced by 17.78% and 16%, respectively, with strong resistance to contamination.

3.2. Microscopic Observation of TYH-SD1 and TWH-SD2 Ear Pieces

The results of scanning electron microscopy observation are shown in Figure 2; the micro-morphology of the ear pieces of TYH-SD1 and TWH-SD2 have large differences compared with Tr21 and Tr01, respectively. As can be seen from Figure 2A, the surface of TYH-SD1 lugs was filled with micrometer-sized honeycomb structures, while the surface of Tr21 lugs was also connected with honeycomb structures, but there were ellipsoidal pimples at the joints (marked with the red arrow), which made the microporous gaps on the surface of the dried lugs slightly reduced (Figure 2B). In addition, the difference in the degree of brightness and darkness of the SEM images also reflected the higher surface topography of the TYH-SD1 ear pieces [25]. The surface morphology of freeze-dried TWH-SD2 ear pieces differed greatly from that of Tr01, with more connected groove-like protrusions and fewer invaginated structures on the surface of TWH-SD2 ear pieces (Figure 2C), whereas the surface morphology of Tr01 ear pieces was dominated by depressions and an irregular thin filamentous mesh structure; Tr01, meanwhile, also had ellipsoidal bumps similar to the filamentous mesh structure on the Tr21 ear pieces (Figure 2D).

3.3. Nutrient Composition Determination

As shown in Table 2, the crude protein, crude fat, and crude polysaccharide contents of the two new varieties TYH-SD1 and TWH-SD2 were comparable to those of the control, while TWH-SD2 had higher vitamin D3 contents, which were 6.44, 4.35, and 2.13 times higher than those of TYH-SD1, Tr21, and Tr01, respectively; the results also indicated that the polysaccharide contents of the white T. fuciformis varieties TWH-SD2 and Tr01 were higher than those of the yellow T. fuciformis varieties TYH-SD1 and Tr21.

3.4. Analysis of Textural Characteristics of Two New Varieties of T. fuciformis Ear Pieces

The texture determination results of four different varieties of fresh T. fuciformis ear pieces are shown in Table 3. The hardness of the ear pieces of the four varieties of T. fuciformis were as follows: Tr21 > TYH-SD1 > Tr01 > TWH-SD2, and the hardness of the ear pieces of the yellow varieties TYH-SD1 and Tr21 was greater than that of the white varieties TWH-SD2 and Tr01. The ear pieces of TYH-SD1 and TWH-SD2 were softer than those of Tr21 and Tr01. The springiness of ear pieces was TYH-SD1 > TWH-SD2 > Tr21 > Tr01, and the chewiness was TYH-SD1 > Tr21 > TWH-SD2 > Tr01, which indicated that TYH-SD1 and TWH-SD2 were more elastic and tough in taste than those of Tr21 and Tr01, respectively. In addition, the TYH-SD1 and TWH-SD2 ear pieces had greater cohesion and resilience.
In the comparison above, the ear pieces of TYH-SD1 and TWH-SD2 exhibited a soft and resilient texture, offering improved chewability, silky smoothness, and elasticity, leading to higher overall texture quality. They were more resistant to stretching and deformation, providing a more Q-bouncy texture and better resilience against deformation caused by external mechanical pressure during the transportation or storage of T. fuciformis.

3.5. Analysis of Flavor Compositions of Two New Varieties

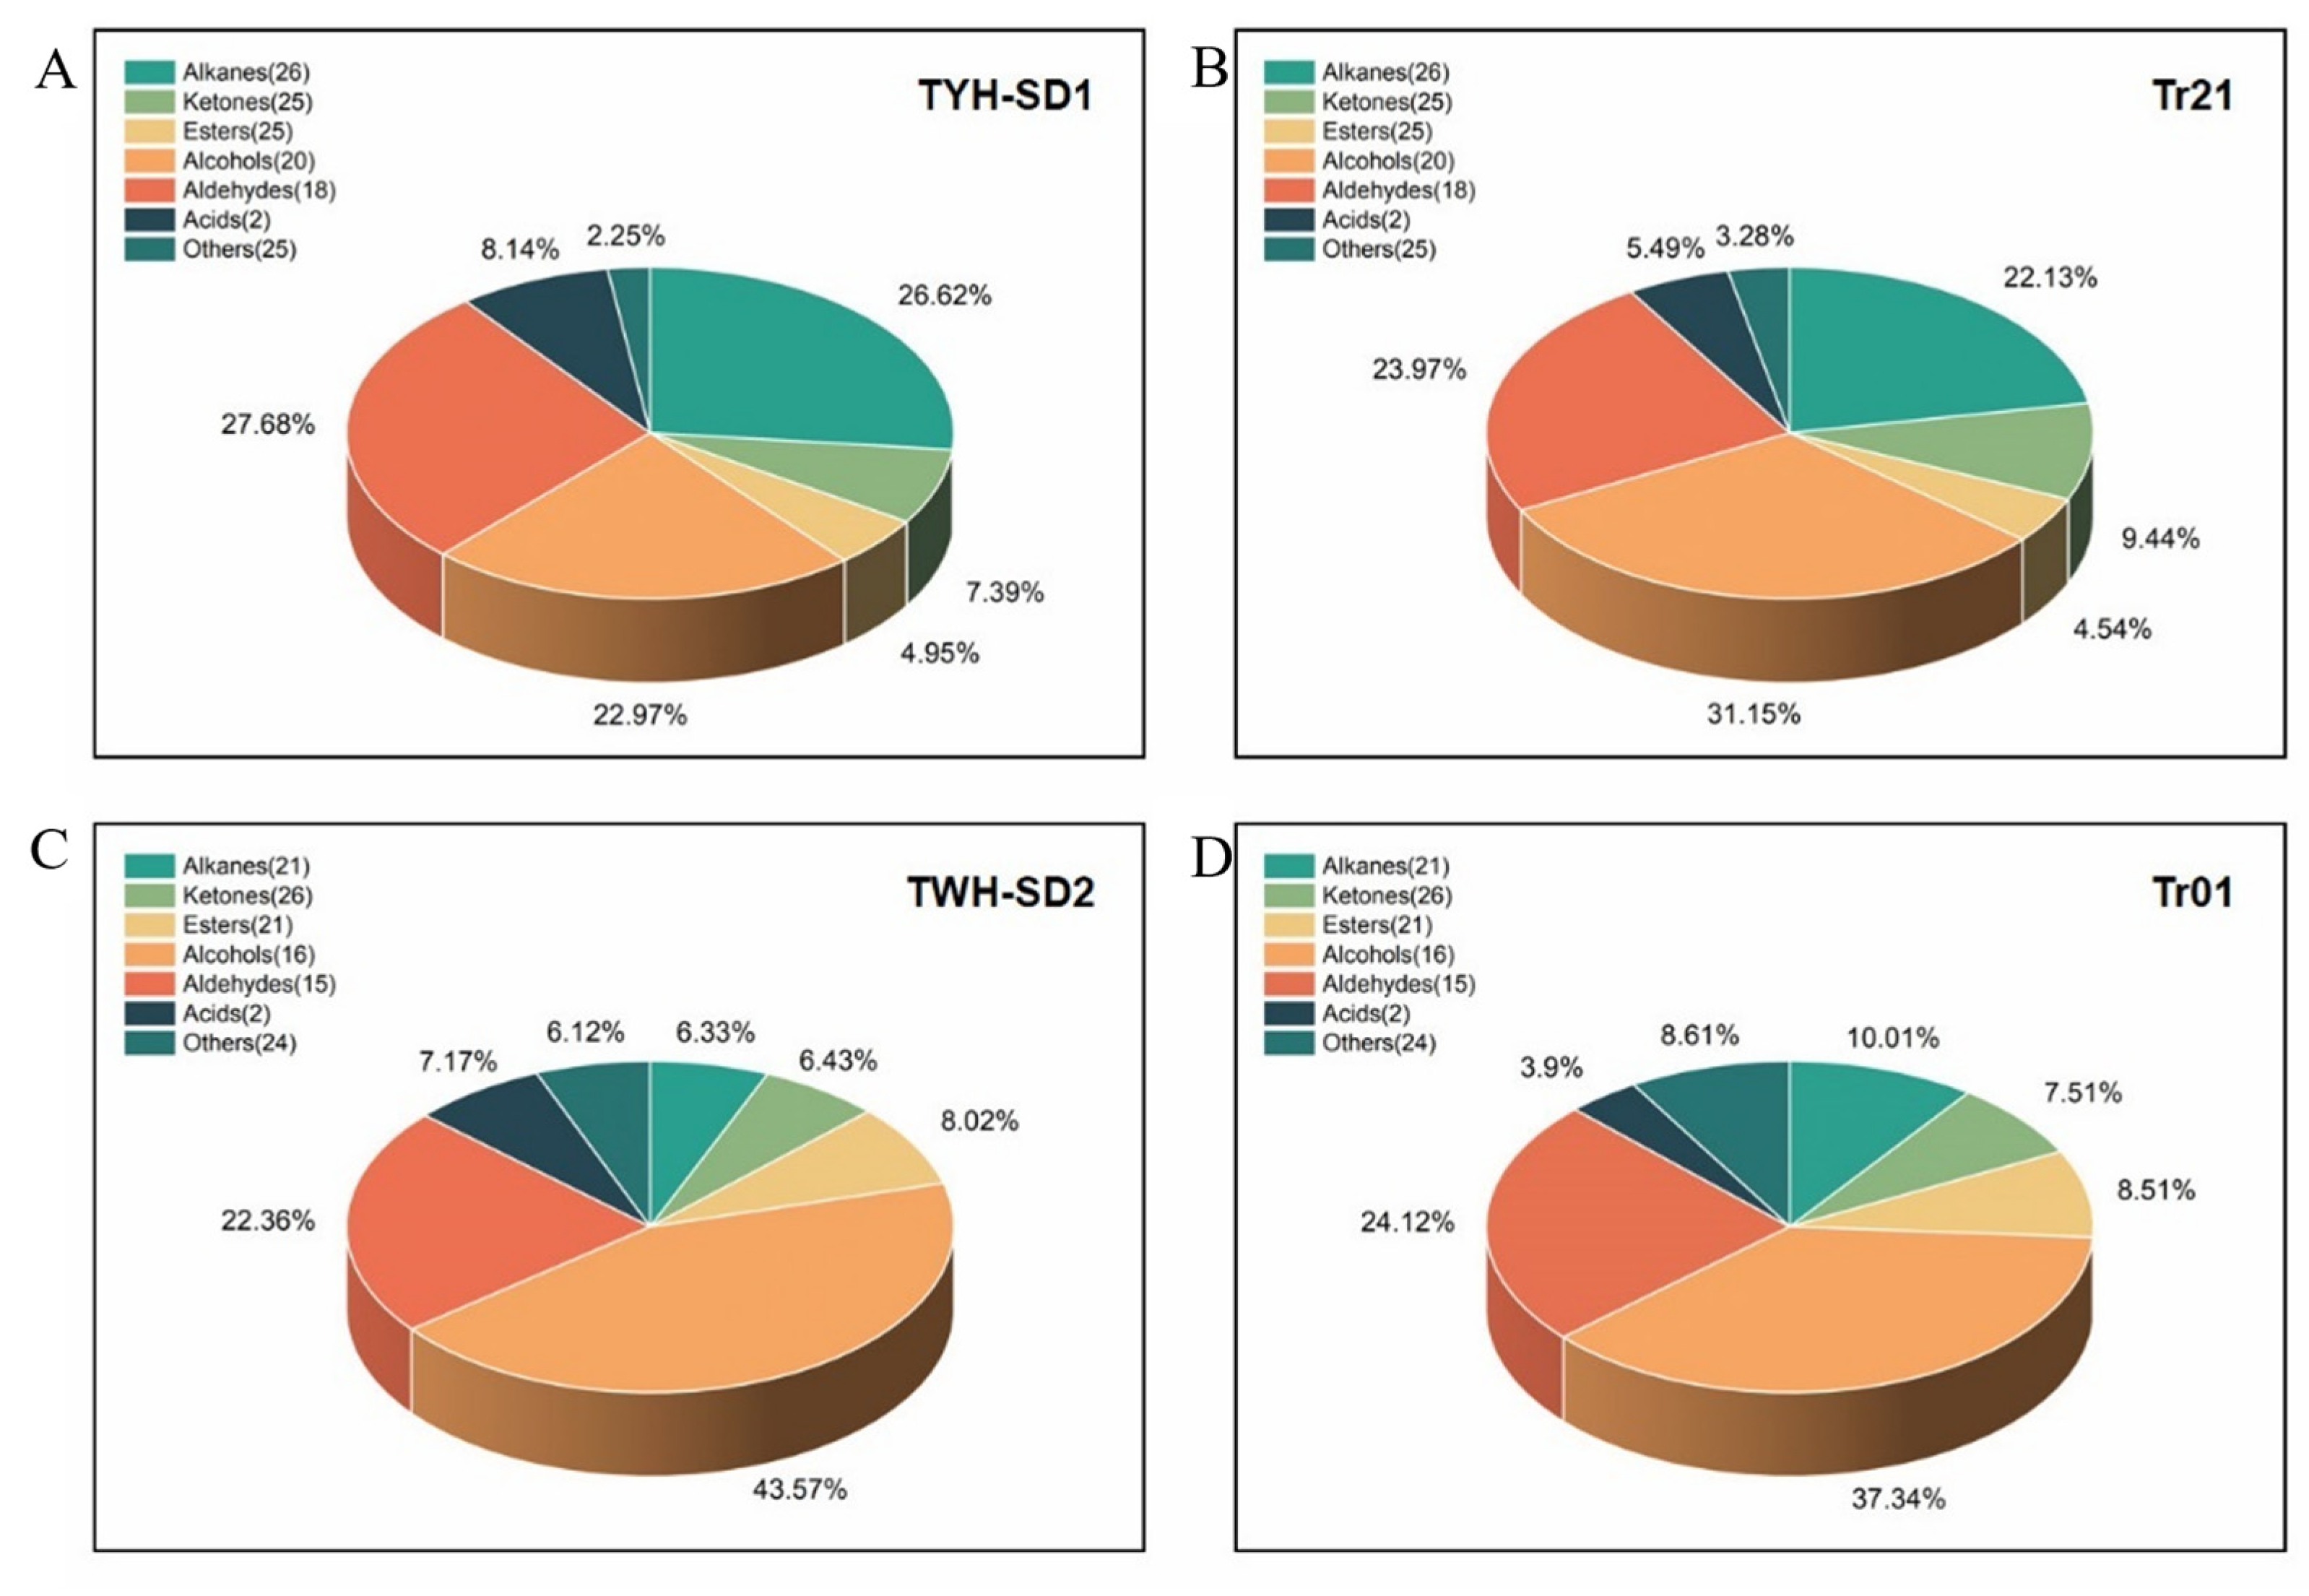
3.5.1. Analysis of Volatile Compounds Composition and Relative Contents

The volatile compounds of TYH-SD1, TWH-SD2, Tr21, and Tr01 substrates were determined by the HS-SPME-GC-MS technique, and the total ion flow chromatogram was obtained (Figure 3). According to the peak appearance, it can be seen that the maximum peak appearance time and peak height of TYH-SD1 and TWH-SD2 were similar to those of Tr21 and Tr01, respectively, but in the remaining volatile compounds there were some differences in type and content, and in terms of the abundance of peaks, TYH-SD1 was higher than that of Tr21. After data processing, a total of 141 substances such as alcohols, esters, aldehydes, ketones, alkanes, etc. were identified in TYH-SD1 and Tr21, of which the numbers of main substance compositions and their proportions were 26 alkanes, 25 ketones, 25 esters, 20 alcohols, and 18 aldehydes. A total of 125 volatile compounds were obtained from TWH-SD2 and Tr01, which mainly consisted of 26 ketones, 21 esters, 21 alkanes, 16 alcohols, and 15 aldehydes (Figure 4).
Aldehydes are important volatile flavor substances in T. fuciformis, and the relative contents of aldehydes in TYH-SD1, Tr21, TWH-SD2, and Tr01 were 27.68%, 23.97%, 22.36%, and 24.12%, respectively (Figure 4). The relative contents of n-hexanal, nonanal, and n-pentanal were the largest among the aldehydes in TYH-SD1 and TWH-SD2, and they were the important volatile flavor substances of TYH-SD1 and TWH-SD2 substrates. The relative content of alkanes in TYH-SD1 was second only to that of aldehydes, with decane having the largest relative content. Alcohols are also one of the main components of the flavor substances of T. fuciformis. The relative content of alcohols in TWH-SD2 was the highest, with a percentage of 43.57%, of which ethanol, 1-octen-3-ol, and 1-pentanol were the alcohols with the largest relative content.

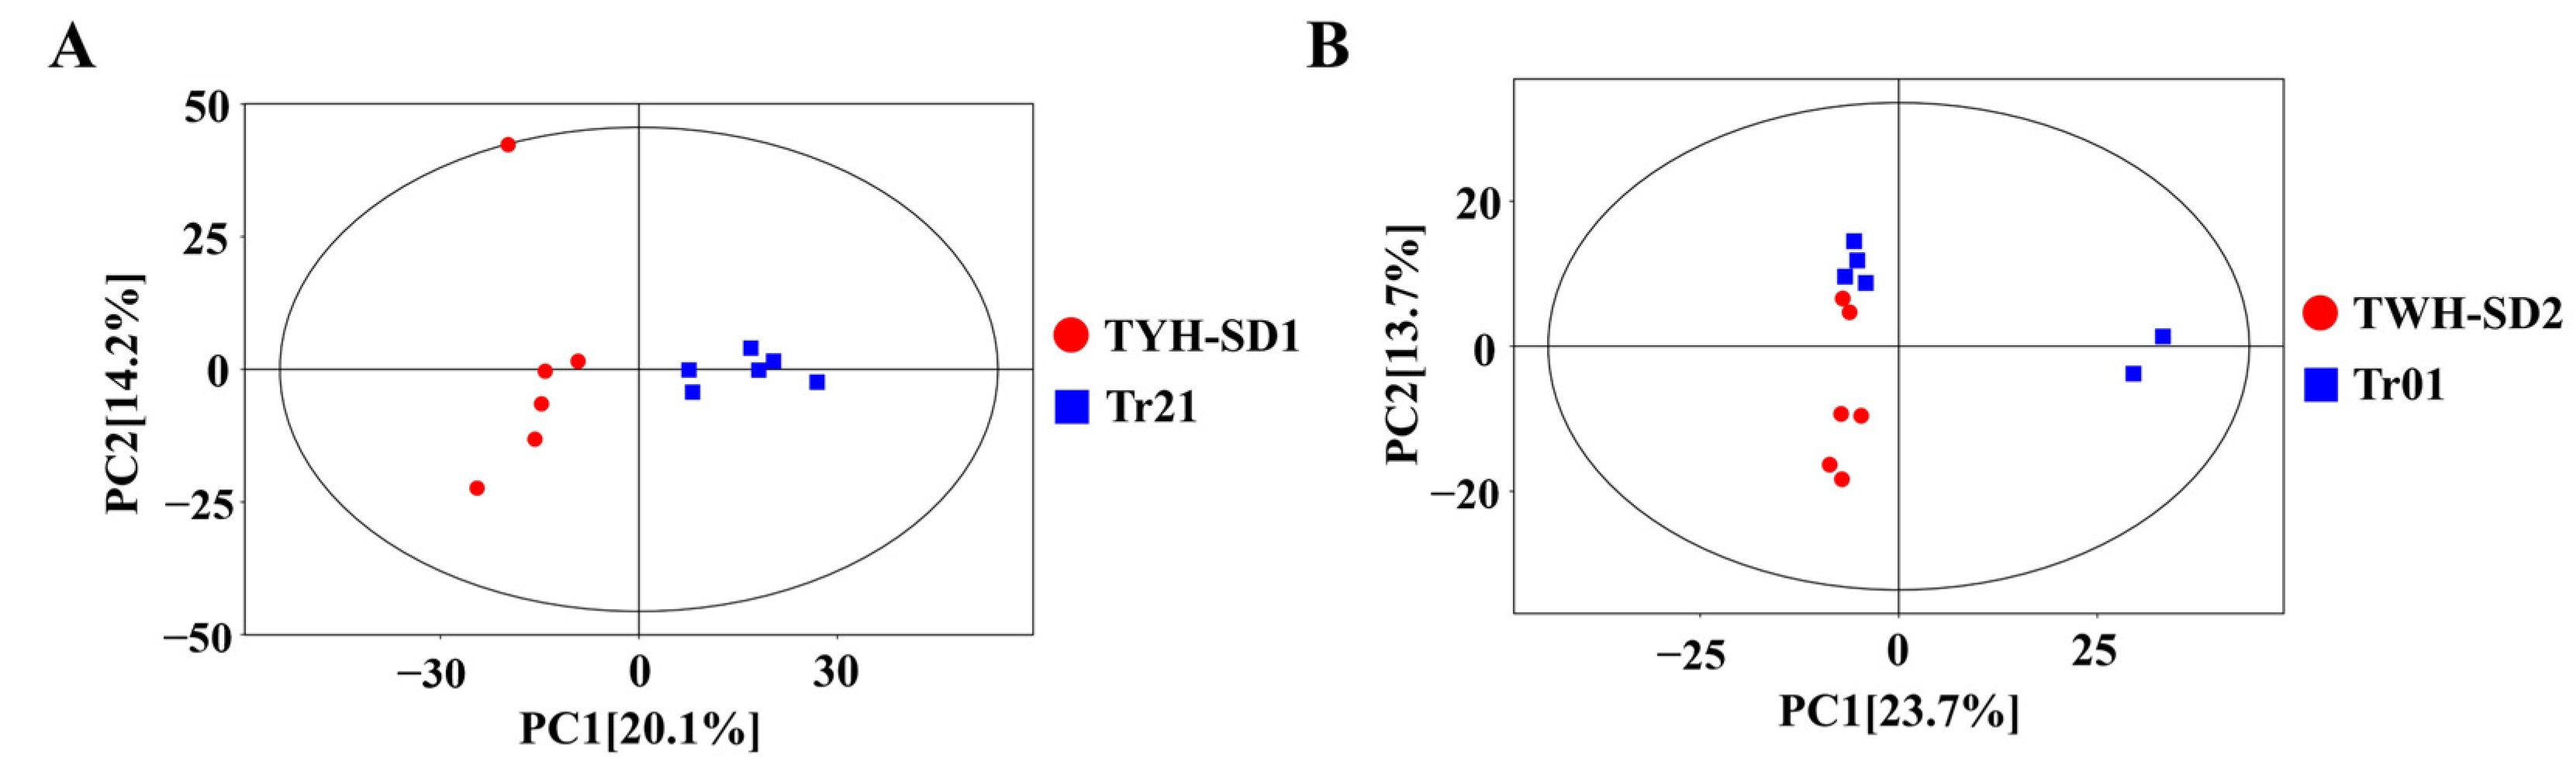
3.5.2. Principal Component Analysis

The principal component analysis of the volatile compound data of the four varieties is shown in Figure 5. From Figure 5A, it can be seen that the TYH-SD1 and Tr21 T. fuciformis samples were basically distributed in the 95% confidence intervals, and the contribution rates of PC1 and PC2 were 20.1% and 14.2%, respectively, with a cumulative variance contribution rate of 34.3%, which indicates that the PCA results were more effective; from the first principal component, it can be seen that TYH-SD1 and Tr21 psyllium samples were distributed in different quadrants, indicating that the differences between them were large, and the PCA results could distinguish TYH-SD1 and Tr21 samples well; the point aggregation of psyllium samples within the groups of TYH-SD1 and Tr21 was better, which indicates that the consistency of the composition of volatile compounds between psyllium samples of the same varieties was stronger. The principal component analysis of volatile compounds in TWH-SD2 and Tr01 indicates that samples were all distributed in 95% and 14% of the quadrants, showing that the PCA results were more effective. The analysis reveals that the samples were distributed within 95% confidence intervals, with contribution rates of 23.7% and 13.7% for PC1 and PC2, respectively, and a cumulative variance contribution rate of 37.4%, which made the PCA model more plausible. The differences between some of the samples of Tr01, in terms of the first principal component, and TWH-SD2, were smaller, and in general, the aggregation of sample points was better within the TWH-SD2 group (Figure 5B).

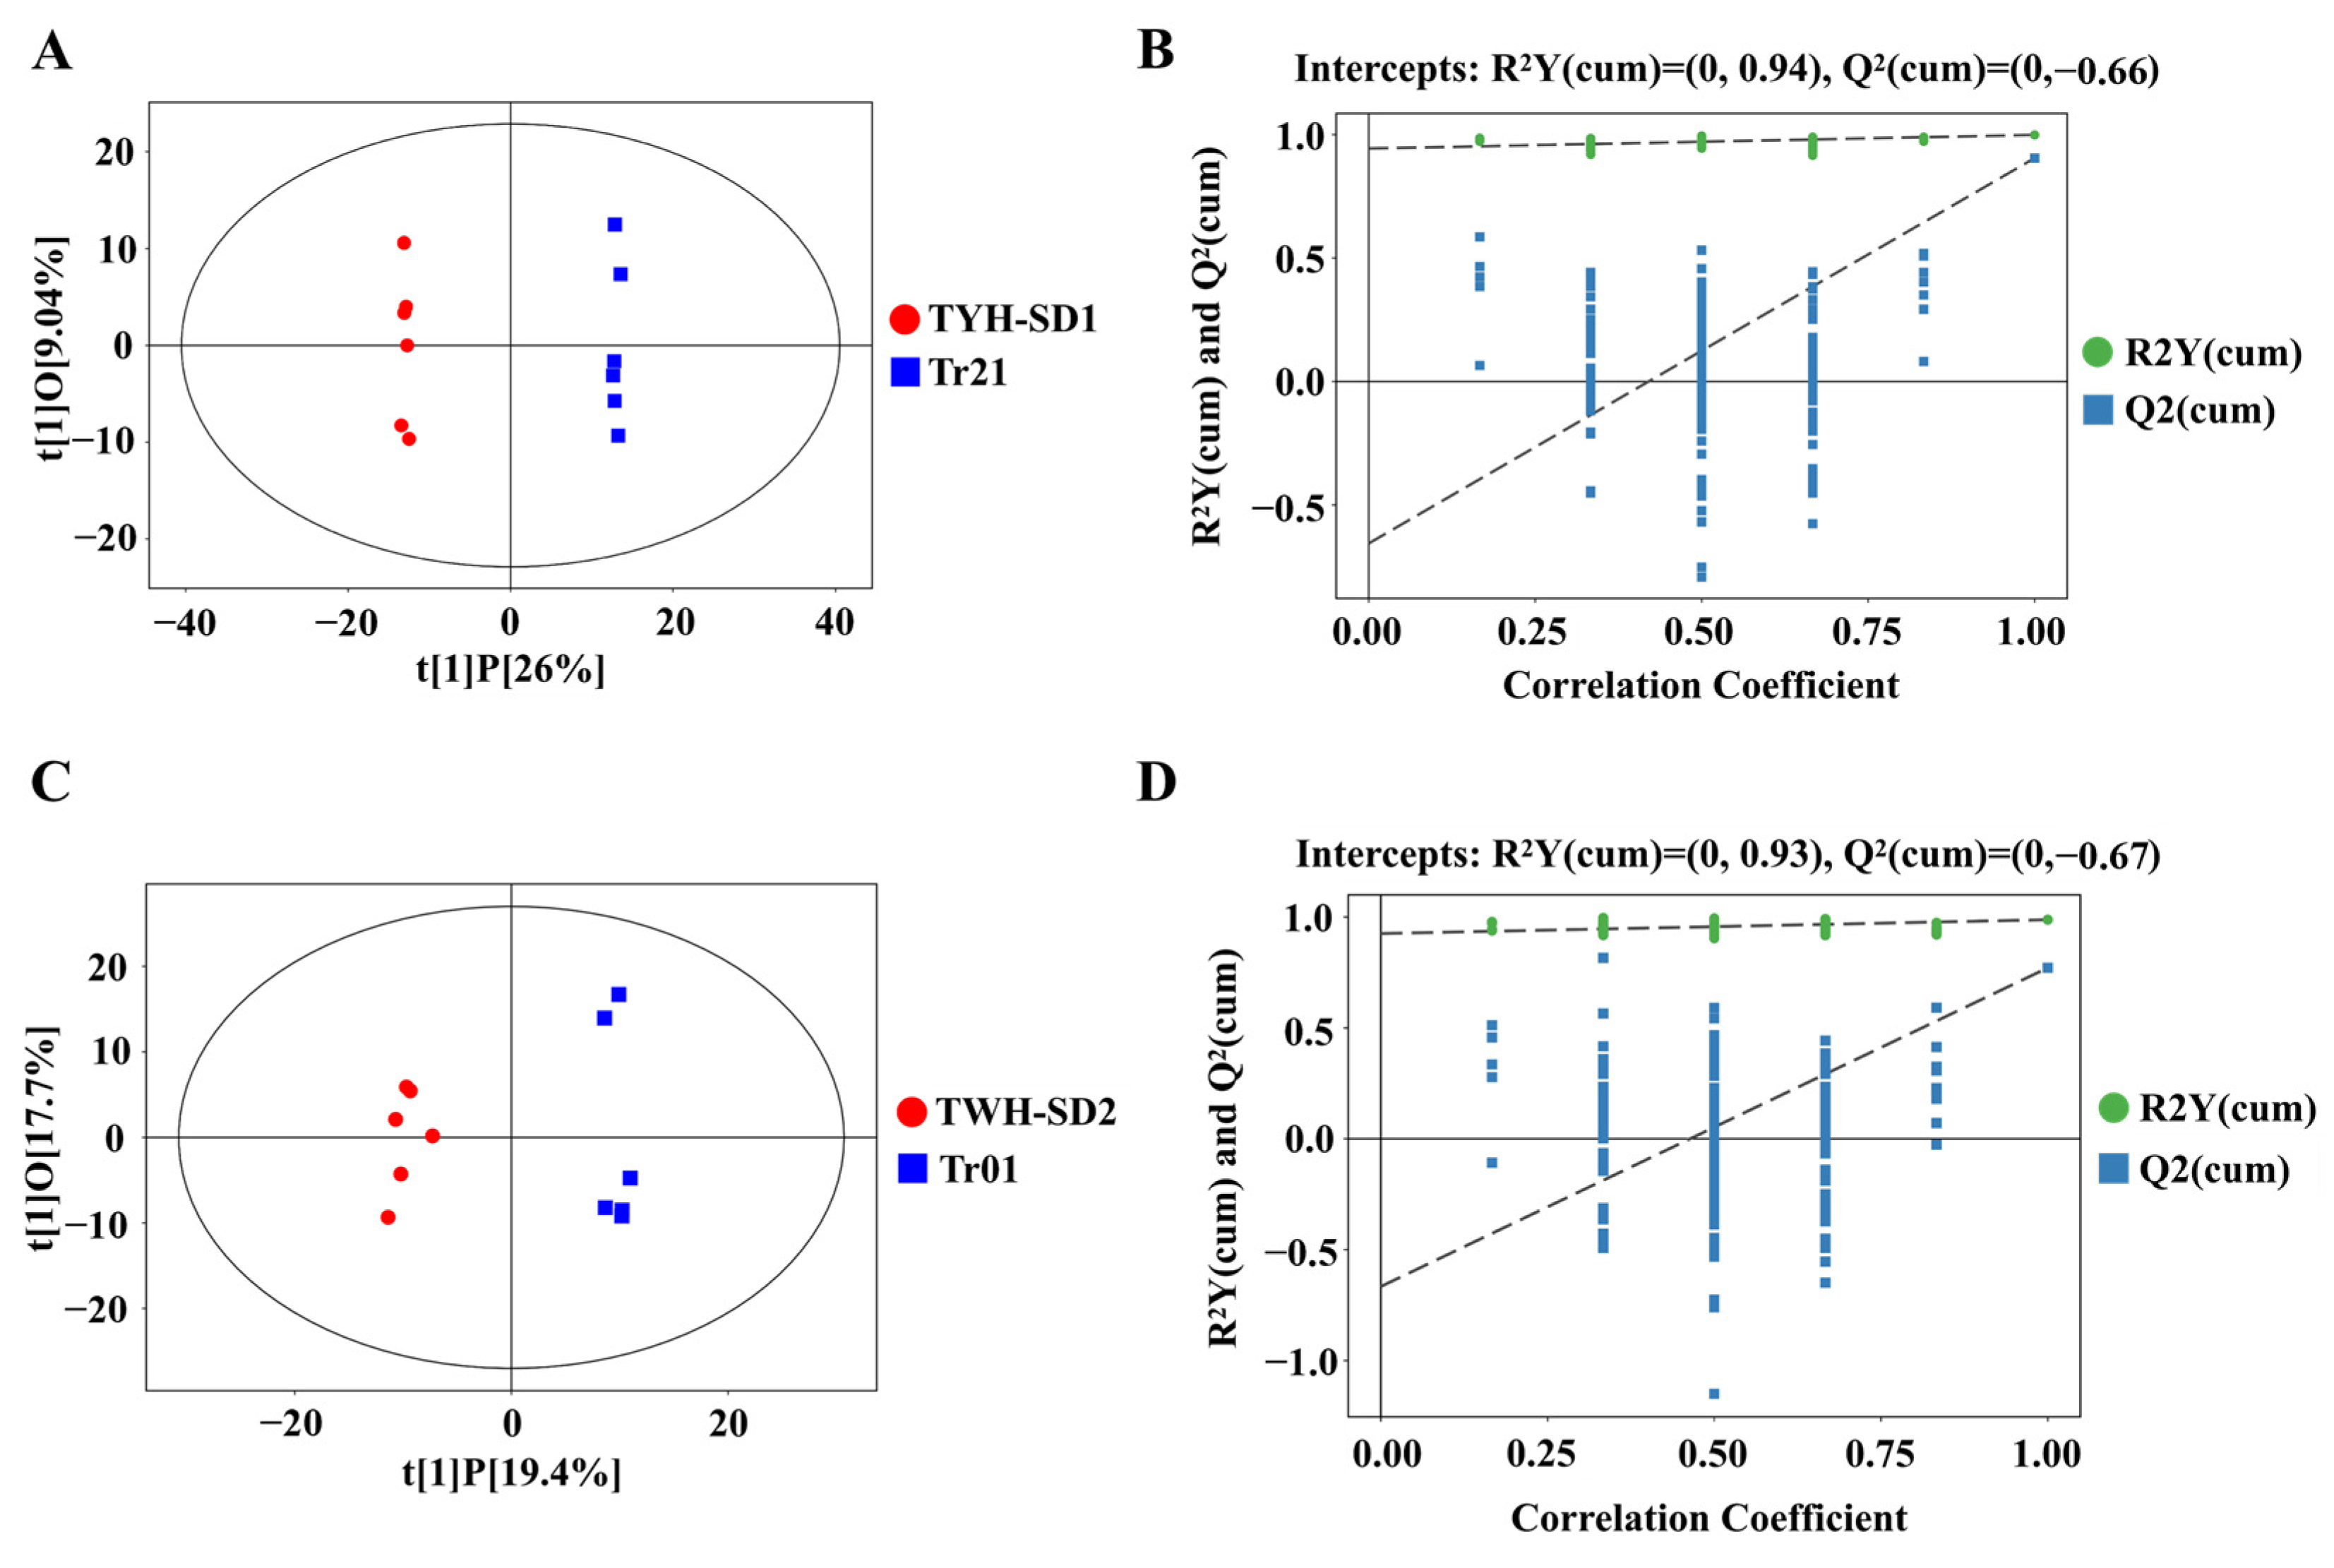
3.5.3. Orthogonal Partial Least Squares Discriminant Analysis

In order to more accurately extract the difference information on volatile compounds in the samples of different varieties of T. fuciformis, the volatile compounds in the two groups of T. fuciformis, TYH-SD1 vs. Tr21 and TWH-SD2 vs. Tr01, were further analyzed by the OPLS-DA method, respectively, and the OPLS-DA model based on the relative abundance of each substance is shown in Figure 6.
As can be seen from Figure 6A,C, the sample points of TYH-SD1 and Tr21, and TWH-SD2 and Tr01 samples were distributed in different areas and clearly divided into two clusters, further indicating that there were obvious differences in volatile compounds between the samples. Meanwhile, the results of the replacement test of the OPLS-DA model for 200 cycles are shown in Figure 6B and Figure 6D, while the R2Y values of the original model were 0.94 and 0.93, respectively, which were both greater than 0.5. This indicates that the constructed model was more in line with the real situation of the sample data, and the Q2 values of the stochastic model for the replacement test were all smaller than those of the original model, while the intercepts of the Q2 regression straight line with the y-axis were less than zero, and the above fitting parameters indicated that the constructed model was more consistent with the true situation of the sample data. The above fitting parameters indicate that the established OPLS-DA model is stable and reliable, there is no overfitting phenomenon, and the VIP values obtained from the model can be used for the subsequent screening of differentially volatile compounds.

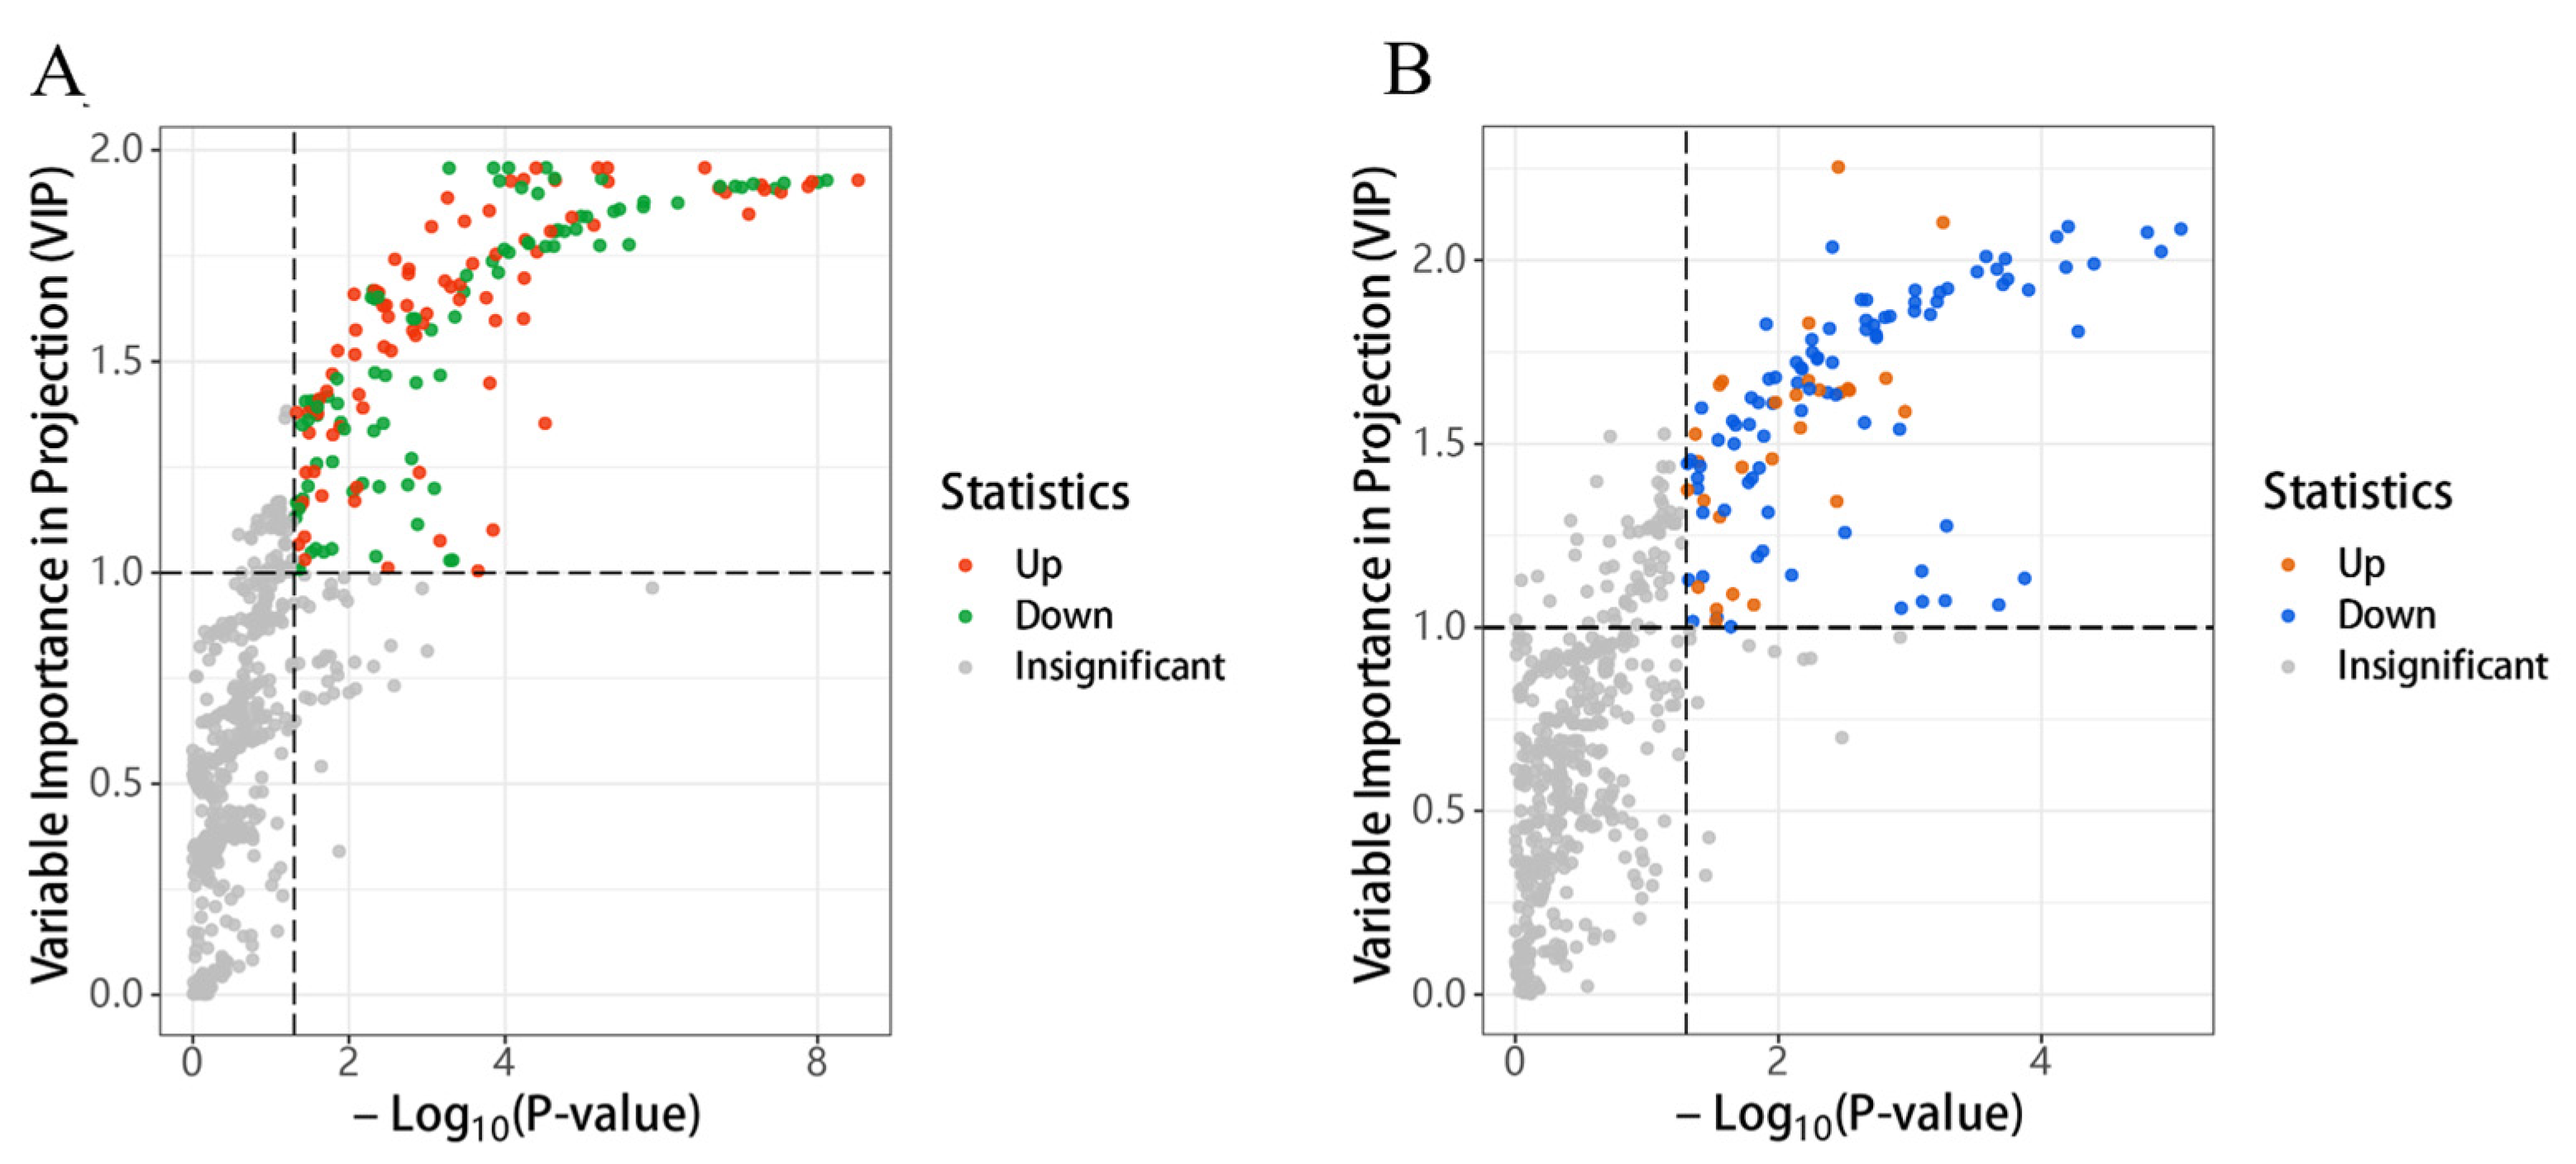
3.5.4. Screening and Analysis of Differential Flavor Compounds

The screening results of differential volatile compounds based on the two threshold conditions of p < 0.05 and VIP > 1 are shown in Volcano Figure 7. The 163 and 101 differential volatile compounds were screened among the volatile flavor substances obtained from TYH-SD1 vs. Tr21 and TWH-SD2 vs. Tr01, respectively. The 81 volatile compounds were differentially up-regulated and 90 differentially down-regulated in TYH-SD1 vs. Tr21, and 25 volatile compounds were differentially up-regulated and 81 differentially down-regulated in TWH-SD2 vs. Tr01. The clustering heat maps of the differentially volatile compounds are shown in Figures S1 and S2.
After the differential volatile compounds obtained by the above screening were imported into the fooDB database for the identification of flavor substances, 33 and 26 differential flavor compounds of TYH-SD1 vs. Tr21 and TWH-SD2 vs. Tr01 were obtained, respectively (Tables S1 and S2). As shown in Figure 8A, the flavor compound compositions of TYH-SD1 and TWH-SD2 indicate significant differential changes compared with those of Tr21 and Tr01, respectively, and that there were 14 differentially up-regulated flavor compounds in TYH-SD1 relative to Tr21, with a relative content of about 36.14% of the total differentially flavored compounds, of which 5 (11.05%) were aldehydes, 4 (4.83%) were esters, 2 phenols (1.14%), 2 aromatics (4.55%), and 1 thiazole (0.35%), and 19 down-regulated flavor compounds, including 11 esters (28.96%), 4 alcohols (28.17%), 2 aldehydes (6.68%), 1 pyrazine (0.02%), and 1 indole (0.02%). Most of the aldehydes had lower flavor thresholds and contributed more to flavor [26], and the five differentially up-regulated aldehydes (phenylacetaldehyde, tetra decanal trimer, nonanal, furfural, and n-octanal) in TYH-SD1 conferred more amygdaloid, fruity, and fatty aromas, etc., to TYH-SD1 subunits (Table S1), of which nonanal and n-octanal are considered to be the key flavor constituents of T. fuciformis [27], and nonanal has a very low sensory threshold, which can give a pleasant sensation and can also be used as an odor-masking agent [28]. The esters are formed by esterification of alcohols and acids, and have sweet, fruity, herbal, and honeyed odor characteristics [29], while the multiplicity of differences of furfuryl acetate, methyl nicotinate, methyl phenylacetate, and methyl butyrate were more advanced among the differentially up-regulated flavor substances, and these four esters may provide sweet, fruity, tobacco, and cheese aromas to the TYH-SD1 substrate. In addition, the four alcohols, 1-pentanol, phenylethanol, n-alpha-alpha-alpha-alpha, and phenoxyethanol, which mainly play a modifying role in the aroma composition of edible mushrooms, were low in TYH-SD1 [30].
Relative to Tr01, there were nine differentially up-regulated flavor compounds in TWH-SD2, whose relative contents accounted for about 44.82% of the total differentially flavored compounds, including five esters (3.39%), two acids (37.70%), one ether (0.73%), and one alkane (3.00%), and 17 down-regulated flavor compounds: six esters (29.21%), three aromatic (17.80%), two ketones (2.02%), two aldehydes (0.64%), one thiazole (0.58%), one alkane (4.43%), one phenol (0.05%), and one alcohol (0.34%) (Figure 8B). The largest percentage of the relative content of acids was found in the up-regulated flavor compounds of TWH-SD2. TWH-SD2 contained less methyl 2-furoate, γ-alpha-alpha-lactone, 6-alpha-lactone, methyl 3-hydroxyalpha-alpha-lactone, isoamyl caproate, and methyl benzoate, with a large percentage of relative content of methyl 2-furoate, which has sweet, fruity, and fungal flavors (Table S2).

4. Discussion

A comparative analysis was performed of the characteristics of the fruiting bodies, nutrients, textural characteristics, and flavor composition of the new varieties of T. fuciformis TYH-SD1 and TWH-SD2, with those of the main cultivars Tr21 and Tr01. TYH-SD1 and TWH-SD2 were superior to the main cultivar in yield, anti-pollution ability, biological efficiency, and rehydration rate, with a porous structure with a larger pore size on the surface of ear pieces microscopic morphology, a structure which may be correlated with its higher rehydration rate [31]. The higher ear pieces yield of TWH-SD2 increased its edible and processable part of the substrate proportion, which is more suitable for the processing of flaked T. fuciformis products and further meets the processing demands of new T. fuciformis products. Meanwhile, the higher rehydration performance of TYH-SD1 and TWH-SD2 will make them the preferred raw materials for brewed T. fuciformis products.
The vitamin D3 content in TWH-SD2 was significantly higher, primarily derived from seafood, animal offal, egg yolks, and nuts [32]. Vitamin D3 in humans is mainly synthesized endogenously or obtained from animal-based foods, and the elevated vitamin D3 levels in TWH-SD2 make it suitable for supplementation by vegetarians. In terms of amino acid content, no significant differences were observed between TYH-SD1, TWH-SD2, and Tr21 or Tr01. Additionally, the amino acid composition of these varieties meets the FAO/WHO standards for high-quality proteins (with an essential amino acid/total amino acid ratio of approximately 40%), indicating their potential as a source of high-quality protein [33].
Food texture is an important property index of food in addition to color, aroma and taste; the essence is the sensory embodiment of the structure and material properties of food, affected by the composition, structure, and state of the food itself, and plays a critical role in the consumer’s sensory evaluation of food [34]. The textural properties are important indicators for evaluating the traits of substrates [35], and the textural analysis shows that the ear pieces of TYH-SD1 and TWH-SD2 were softer and more elastic, and the chewing texture was silky smooth with toughness, and at the same time, the greater cohesion and resilience allowed TYH-SD1 and TWH-SD2 to better resist the external mechanical pressure brought about by the deformation of the substrate in the process of transportation or storage deformation.
Previous research on T. fuciformis has predominantly focused on its nutritional composition, cultivation characteristics, and culinary and medicinal value [6], while studies on its flavor properties have been relatively scarce. The volatile aroma substances in fruiting bodies affect the flavor of T. fuciformis, and it is important to study the composition of volatile substances in TYH-SD1 and TWH-SD2 to understand their quality characteristics. In this study, a total of 141 volatile components were detected in TYH-SD1, mainly including alkanes, ketones, esters, alcohols, and aldehydes, and 125 volatile components were detected in TWH-SD2, mainly including ketones, esters, alkanes, alcohols, and aldehydes, which was similar to that of the study by Li et al. [22]. TYH-SD1 contained the highest proportion of aldehydes, with n-hexanal, nonanal, and n-pentanal as the main components, which are important flavor components of the TYH-SD1 substrate, and TWH-SD2 contained the largest proportion of alcohols, dominated by ethanol, 1-octen-3-ol and 1-pentanol, which exhibited a lower sensory threshold, more influenced by the formation of alternative flavors in TWH-SD2, with a pronounced aroma and mushroom aroma and lipid odor [36]. The highest relative content of aldehydes was found in the up-regulated differential flavor components of TYH-SD1, which conferred more almond, fruity, and lipid aroma to TYH-SD1. In addition, the down-regulated differential flavor components of TYH-SD1 were mainly esters and alcohol compounds, and most of the esters had the aroma of fruits and stale wines, which contributed a lot to the flavors [37], whereas the alcohols compounds mostly only play a modifying role in the aroma composition of edible mushrooms [30]. Among the differential flavor components up-regulated by TWH-SD2, the relative content of acids accounted for the largest proportion, including acetic acid and butyric acid, which are generally foul-smelling and have a bad effect on the overall flavor [38], and the largest proportion of differentially down-regulated flavor compounds was esters, represented by methyl 2-furoate. Methyl 2-furoate has a sweet, fruity, and fungal flavor and is not reported among the flavor components of edible mushrooms. The unique flavors of edible mushrooms are produced by the interaction of many flavor components, and in order to more accurately analyze the flavors and identify the characteristic flavor substances in TYH-SD1 and TWH-SD2, further in-depth studies should be conducted by combining the techniques and analytical methods such as electronic nose and odor activity value (OAV). Currently, processing based on the volatile flavor compounds of the material itself is mainly applied to various beverages, such as Tieguanyin oolong tea [39], Longjing tea [40], and osmanthus black tea [41]. The above results provide a theoretical basis for the processing and development of TYH-SD1- and TWH-SD2-related products.

5. Conclusions

In this study, the characteristics and nutritional quality of different varieties of T. fuciformis were comparatively analyzed, and the differences in flavor substances were also investigated by metabolomics. The results show that there were significant differences in the rehydration rate, surface structure, crude polysaccharide and vitamin D3 contents between two new varieties (TYH-SD1 and TWH-SD2) and the control varieties Tr21 and Tr01. The new varieties exhibited outstanding physical and chemical properties, and nutritional quality. At the same time, metabolomics analysis revealed that the relative content of aldehydes in the volatile flavor substances TYH-SD1 and TWH-SD2 was high in n-alpha-aldehyde, nonanaldehyde, and n-pentanal. These findings are of great significance for accelerating the germplasm development and quality evaluation of new T. fuciformis varieties, thus promoting the healthy and sustainable development of the T. fuciformis industry.

Supplementary Materials

The following supporting information can be downloaded at: https://www.mdpi.com/article/10.3390/horticulturae11030273/s1, Figure S1 Heat map of differential volatile substances of TYH-SD1 vs. Tr21; Figure S2 Heat map of differential volatile substances of TWH-SD2 vs. Tr01; Table S1 Differential flavor substances in TYH-SD1 vs. Tr21 [30,42,43]; Table S2 Differential flavor substances in TWH-SD2 vs. Tr01.

Author Contributions

Conceptualization, methodology, formal analysis, investigation, validation, writing—original draft, writing—review and editing, J.C. and L.W.; data curation, software, J.X.; writing—review and editing, Y.Z. and J.J.; funding acquisition, writing—review and editing, L.C. and S.S. All authors have read and agreed to the published version of the manuscript.

Funding

This work was supported by the Project of the Modern Agricultural Industrial Technology System of Edible Fungi in Fujian Province and the Breeding and Industrialized Development of Edible Fungi Featured in Seed Industry Engineering in Fujian Province Project (Grant No. zycxny2021011), as well as the Application Programme Guiding Project in Fujian Province (2024N0055).

Institutional Review Board Statement

Not applicable.

Informed Consent Statement

Not applicable.

Data Availability Statement

The original contributions presented in this study are included in the article/Supplementary Materials. Further inquiries can be directed to the corresponding author(s).

Conflicts of Interest

There are no competing financial interests that could have appeared to influence the work reported in this paper.

References

  1. Wen, L.; Gao, Q.; Ma, C.-W.; Ge, Y.; You, L.; Liu, R.H.; Fu, X.; Liu, D. Effect of polysaccharides from Tremella fuciformis on UV-induced photoaging. J. Funct. Foods 2016, 20, 400–410. [Google Scholar] [CrossRef]
  2. Xiao, H.; Li, H.; Wen, Y.; Jiang, D.; Zhu, S.; He, X.; Xiong, Q.; Gao, J.; Hou, S.; Huang, S.; et al. Tremella fuciformis polysaccharides ameliorated ulcerative colitis via inhibiting inflammation and enhancing intestinal epithelial barrier function. Int. J. Biol. Macromol. 2021, 180, 633–642. [Google Scholar] [CrossRef] [PubMed]
  3. Zhang, Z.; Wang, X.; Zhao, M.; Qi, H. Free-radical degradation by Fe2+/Vc/H2O2 and antioxidant activity of polysaccharide from Tremella fuciformis. Carbohydr. Polym. 2014, 112, 578–582. [Google Scholar] [CrossRef] [PubMed]
  4. Zhao, Y.; Wang, D.; Xu, J.; Tu, D.; Zhuang, W.; Tian, Y. Effect of polysaccharide concentration on heat-induced Tremella fuciformis polysaccharide-soy protein isolation gels: Gel properties and interactions. Int. J. Biol. Macromol. 2024, 262, 129782. [Google Scholar] [CrossRef] [PubMed]
  5. Zhang, L.; Wang, M. Polyethylene glycol-based ultrasound-assisted extraction and ultrafiltration separation of polysaccharides from Tremella fuciformis (snow fungus). Food Bioprod. Process. 2016, 100, 464–468. [Google Scholar] [CrossRef]
  6. Huang, S.; Zou, Y.; Ye, Z.; Chen, J.; Luo, J.; Lan, Y.; Guo, L.; Lin, J.; Zheng, Q. A comparative study on the physio-chemical properties, antioxidant and immuno-stimulating activities of two national geographical indication products of Tremella fuciformis in China. Int. J. Food Sci. Technol. 2021, 56, 2904–2914. [Google Scholar] [CrossRef]
  7. Chen, B. Optimization of extraction of Tremella fuciformis polysaccharides and its antioxidant and antitumour activities in vitro. Carbohydr. Polym. 2010, 81, 420–424. [Google Scholar] [CrossRef]
  8. Li, Y.; Zhan, G.; Tu, M.; Wang, Y.; Cao, J.; Sun, S. A chromosome-scale genome and proteome draft of Tremella fuciformis. Int. J. Biol. Macromol. 2023, 247, 125749. [Google Scholar] [CrossRef]
  9. Yuan, H.; Dong, L.; Zhang, Z.; He, Y.; Ma, X. Production, structure, and bioactivity of polysaccharide isolated from Tremella fuciformis. Food Sci. Hum. Well. 2022, 11, 1010–1017. [Google Scholar] [CrossRef]
  10. Iijima, M.; Ma, S.; Asano-Oritani, M.; Hatakeyama, T. Thermal studies on Tremella fuciformis polysaccharide-water interaction. Thermochim. Acta 2024, 732, 179657. [Google Scholar] [CrossRef]
  11. Wang, C.; Lin, M.; Li, Y.; Guo, Z. Improvement of soluble dietary fiber quality in Tremella fuciformis stem by steam explosion technology: An evaluation of structure and function. Food Chem. 2024, 437, 137867. [Google Scholar] [CrossRef]
  12. Zhang, L.; Chen, J.; Xu, F.; Han, R.; Quan, M.; Wang, L. Effect of Tremella fuciformis on dough structure and rheology, noodle flavor, and quality characteristics. LWT-Food Sci. Technol. 2022, 172, 114180. [Google Scholar] [CrossRef]
  13. Fu, L.; Tian, J.; Liu, L.; Ma, Y.; Zhang, X.; Ma, C.; Kang, W.; Sun, Y. Analysis of volatile components in Tremella fuciformis by electronic nose combined with GC-MS. J. Food Qual. 2022, 2022, 9904213. [Google Scholar] [CrossRef]
  14. Li, Y.; Li, J.; Fan, L. Effects of combined drying methods on physicochemical and rheological properties of instant Tremella fuciformis soup. Food Chem. 2022, 396, 133644. [Google Scholar] [CrossRef]
  15. Kong, X.; Liu, T.; LIU, Y.; Xu, X.; Chen, J.; Liu, Y.; Sun, S. Comparison on physiological and agronomic traits of Tremella fuciformis strains Tr01 and Tr21 in Gutian. Acta Edulis Fungi 2019, 26, 39–49. [Google Scholar]
  16. GB 5009.4-2016; National Food Safety Standard—Determination of Ash in Foods. Standardization Administration of China: Beijing, China, 2016.
  17. GB 5009.5-2016; National Food Safety Standard—Determination of Protein in Foods. Standardization Administration of China: Beijing, China, 2016.
  18. GB 5009.6-2016; National Food Safety Standard—Determination of Fat in Foods. Standardization Administration of China: Beijing, China, 2016.
  19. GB/T 5009.10-2003; Determination of Crude Fiber in Vegetable Foods. Standardization Administration of China: Beijing, China, 2003.
  20. NY/T 1676-2008; Determination of Crude Mushroom Polysaccharides. Ministry of Agriculture of the People’s Republic of China: Beijing, China, 2008.
  21. GB 5009.82-2016; National Food Safety Standard—Determination of Vitamins A, D and E in Foods. Standardization Administration of China: Beijing, China, 2016.
  22. GB 5009.85-2016; National Food Safety Standard—Determination of Vitamin B2 in Foods. Standardization Administration of China: Beijing, China, 2016.
  23. GB 5009.86-2016; National Food Safety Standard—Determination of Ascorbic Acid in Foods. Standardization Administration of China: Beijing, China, 2016.
  24. Tu, K.; Zhao, Y.; Hong, Y.; Pan, L. Evaluation of properties of different cheeses with texture profile analysis. China Dairy Ind. 2004, 32, 16–18. [Google Scholar]
  25. Goldstein, J.I.; Newbury, D.E.; Echlin, P.; Joy, D.C.; Fiori, C.; Lifshin, E. Scanning Electron Microscopy and X-Ray Microanalysis; Springer: Boston, MA, USA, 1981; ISBN 978-1-4613-3275-6. [Google Scholar]
  26. Yao, Q.; Yan, S.; Chen, M.; Huang, M.; Lin, Q. Basic nutrition analysis and evaluation of major cultivars of Tremella fuciformis in Gutian. J. Food Saf. Qual. 2019, 10, 1896–1902. [Google Scholar]
  27. Li, X.; Xu, H.; Deng, J.; Wang, Q.; Ling, Y.; Wang, J.; Wu, D.; Tang, Y.; Liu, D. HS-SPME/GC-MS analysis on volatile components of Tilia Tremella with different cultivation methods. Edible Fungi China 2019, 38, 45–50+63. [Google Scholar]
  28. Yang, W.; Bai, Z.; Zou, M.; Wang, X.; Xie, J.; Zhang, F. The full-length transcriptome sequencing and identification of related genes involved in secondary metabolism biosynthesis for Monochasma savatieri. J. Jiangxi Norm. Univ. 2023, 1, 99–110. [Google Scholar]
  29. Liu, H.; Wang, J.; Xu, J.; Guo, S.; Chen, Y.; Zhu, Y.; Li, H. Review on volatile flavor components of oil-tea Camellia seed oil. China Oils Fats 2023, 48, 42–47. [Google Scholar]
  30. Yin, C.; Fan, X.; Fan, Z.; Shi, D.; Gao, H. Analysis of volatile flavor compounds in different Pleurotus species using HS-SPME-GC-MS. Food Sci. 2018, 39, 240–246. [Google Scholar]
  31. Harnkarnsujarit, N.; Charoenrein, S.; Roos, Y.H. Microstructure formation of maltodextrin and sugar matrices in freeze-dried systems. Carbohydr. Polym. 2012, 88, 734–742. [Google Scholar] [CrossRef]
  32. Ramasamy, I. Vitamin D metabolism and guidelines for Vitamin D supplementation. Clin. Biochem. Rev. 2020, 41, 103–126. [Google Scholar] [CrossRef] [PubMed]
  33. Joint FAO/WHO Ad Hoc Expert Committee on Energy & Protein Requirements. Energy and Protein Requirements: Report of a Joint FAO-WHO Ad Hoc Expert Committee, Rome, 22 March–2 April 1971; World Health Organization Technical Report Series; Food and Agriculture Organization: Rome, Italy, 1973; Volume 522, pp. 1–118. [Google Scholar]
  34. Chen, W.; Chen, J. Food texture and properties. J. Chin. Inst. Food Sci. Technol. 2021, 01, 377–384. [Google Scholar]
  35. Yu, C.; Li, Z.; Zha, L.; Zhao, Y.; Chen, M.; Hou, L.; Guo, Q. Effects of light quality on mycelial growth and fruiting body characteristics of Volvariella volvacea. Acta Edulis Fungi 2021, 37, 72–77. [Google Scholar]
  36. Van Gemert, L.J. Compendium of Olfactory Thresholds for Compounds; Science Press: Beijing, China, 2018; ISBN 978-7-03-058320-8. [Google Scholar]
  37. Jové, P.; Pareras, A.; De Nadal, R.; Verdum, M. Development and optimization of a quantitative analysis of main odorants causing off flavours in cork stoppers using headspace solid-phase microextraction gas chromatography tandem mass spectrometry. J. Mass Spectrom. 2021, 56, e4728. [Google Scholar] [CrossRef]
  38. Sun, B.; Chen, H. Food Flavoring Technique; Chemical Industry Press: Beijing, China, 2020; ISBN 978-7-122-30764-4. [Google Scholar]
  39. Wu, L.; Chen, X.; Lin, J.; Lin, H.; Liao, N.; Li, C.; Hu, Y.; Sun, Y. Study on dynamic alterations of volatile organic compounds reveals aroma development over enzymatic-catalyzed process of Tieguanyin oolong tea production. Food Chem. Mol. Sci. 2024, 9, 100227. [Google Scholar] [CrossRef]
  40. Zhang, H.; Zhang, J.; Liu, S.; Li, T.; Wei, Y.; Gu, Z.; Su, Z.; Ning, J.; Wang, Y.; Hou, Z. Characterization of the key volatile compounds in longjing tea (Camellia sinensis) with different aroma types at different steeping temperatures by GC-MS and GC-IMS. LWT-Food Sci. Technol. 2024, 200, 116183. [Google Scholar] [CrossRef]
  41. Meng, X.; Wang, F.; Fu, C.-H.; Zeng, L.; Chen, Z.-H.; Du, Q.; Feng, Z.-H.; Yin, J.-F.; Xu, Y.-Q. Effect of osmanthus hydrolat on the aroma quality and volatile components of osmanthus black tea. Food Chem. X 2024, 23, 101564. [Google Scholar] [CrossRef]
  42. Yin, C.; Li, Y.; Fan, X.; Shi, D.; Yao, F.; Cheng, W.; Gao, H. Effect of different culture substrates on flavor compounds in fruiting body of six Pleurotus edible mushrooms. J. Nucl. Agric. Sci. China 2022, 36, 1984–1995. [Google Scholar]
  43. Li, R.; Yang, Y.; Liu, X.; Chen, W.; Li, W. Research progress on influential factorsand evaluation of edible fungi flavor. Acta Edulis Fungi China 2020, 27, 202–214. [Google Scholar]
Figure 1. A morphological photograph of the varieties of T. fuciformis.
Horticulturae 11 00273 g001
Figure 2. The surface microstructure at a magnification of 5200× of T. fuciformis ear pieces. (A): TYH-SD1. (B): Tr21. (C): TWH-SD2. (D): Tr01.
Horticulturae 11 00273 g002
Figure 3. Ion-flow graph of the volatile components from T. fuciformis. (A): TYH-SD1. (B): Tr21. (C): TWH-SD2. (D): Tr01.
Horticulturae 11 00273 g003
Figure 4. Relative content of volatile substances in fruiting body. (A): TYH-SD1. (B): Tr21. (C): TWH-SD2. (D): Tr01.
Horticulturae 11 00273 g004
Figure 5. PCA of volatile components. (A): TYH-SD1 and Tr21. (B): TWH-SD2 and Tr01.
Horticulturae 11 00273 g005
Figure 6. OPLS-DA and modeling tests for volatile components. (A,B): TYH-SD1 and Tr21; (C,D): TWH-SD2 and Tr01.
Horticulturae 11 00273 g006
Figure 7. Volcano plots of differential volatile substances. (A): TYH-SD1 vs. Tr21. (B): TWH-SD2 vs. Tr01.
Horticulturae 11 00273 g007
Figure 8. Heat map of different flavor substances clustering. (A): TYH-SD1 vs. Tr21. (B): TWH-SD2 vs. Tr01.
Horticulturae 11 00273 g008
Table 1. Agronomic traits and production performance parameters.
SamplesMain Agronomic Traits and Production Performances
Fresh Weight (g)Dry Weight (g)Rehydration Efficiency
(%)
Rehydration Rate (g/min)Remove Pedicle Weight (g)Pedicle Weight
(g)
Fruiting Body
Elevation (cm)
Biological Efficiency (%)Contamination Rate (%)
TYH-SD1134 ± 14.134.1 ± 2.1 **829 ± 17.9 *29.77 ± 1.93128 ± 146.0 ± 1.36.4 ± 0.6 **54.1513.33
Tr21130 ± 17.029.3 ± 3.2808 ± 20.827.91 ± 3.67123 ± 178.0 ± 2.06.1 ± 0.652.6131.11
TWH-SD2125.2 ± 14.9 *17.86 ± 1.691042 ± 38.1 **24.87 ± 3.00 **122 ± 12 **3.2 ± 1.46.0 ± 0.647.011
Tr01118.5 ± 10.215.65 ± 2.14960 ± 8.919.27 ± 2.45107 ± 1011.5 ± 2.9 **5.7 ± 0.544.427
Note: “*” means there is a difference at the p < 0.05 level, “**” means there is a difference at the p < 0.01 level.
Table 2. Main nutritional components of dried fruiting body.
SamplesMain Nutrient Compositions
Ash
Content (g/100 g)
Crude
Protein
(g/100 g)
Crude
Fat
(g/100 g)
Crude
Fiber
(%)
Crude
Polysaccharide
(g/100 g)
Vitamin D3
(μg/100 g)
Vitamin B2
(mg/100 g)
TYH-SD16.3 ± 0.188.88 ± 0.261.6 ± 0.051.3 ± 0.0112.9 ± 0.397.16 ± 0.210.1 ± 0.003
TWH-SD26.9 ± 0.208.5 ± 0.251.6 ± 0.041.5 ± 0.0119.7 ± 0.6046.1 ± 1.380.08 ± 0.002
Tr216.9 ± 0.208.77 ± 0.261.6 ± 0.051.7 ± 0.0114.2 ± 0.4310.6 ± 0.320.15 ± 0.004
Tr017.1 ± 0.218.96 ± 0.271.6 ± 0.041.6 ± 0.0121.2 ± 0.6421.6 ± 0.650.1 ± 0.003
Table 3. The texture determination of fruiting body of TYH-SD1, TWH-SD2, Tr21, and Tr01.
SamplesHardness (gf)SpringinessChewiness (gf)CohesivenessResilience
TYH-SD1198.20 ± 15.32 b0.83 ± 0.02 a143.28 ± 1.22 a0.87 ± 0.01 a0.45
Tr21240.10 ± 18.34 a0.69 ± 0.01 c129.41 ± 0.22 b0.78 ± 0.01 b0.33
TWH-SD2125.10 ± 15.42 d0.77 ± 0.01 b77.13 ± 0.13 c0.80 ± 0.02 b0.31
Tr01163.00 ± 14.57 c0.64 ± 0.01 d76.89 ± 0.08 d0.74 ± 0.01 c0.29
Note: Different lowercase letters indicate there is a difference at the p < 0.05 level.
Disclaimer/Publisher’s Note: The statements, opinions and data contained in all publications are solely those of the individual author(s) and contributor(s) and not of MDPI and/or the editor(s). MDPI and/or the editor(s) disclaim responsibility for any injury to people or property resulting from any ideas, methods, instructions or products referred to in the content.

