Abstract
The use of extended light spectra, including UV-A, green, and far-red, has been scarcely explored in vertical farming. This study evaluated the effects of full spectra under two intensities (90 and 180 µmol m−2 s−1) on the growth and antioxidant properties of green and purple leaf lettuce. Three light spectra were tested: Blue-White (BW), Red-White (RW), and Red-Blue (RB). Fresh weight (FW), dry weight percentage (DWP), chlorophyll concentration (NDVI), and antioxidant parameters (total phenolic content (TPC), antioxidant capacity by DPPH and FRAP and total flavonoid content (TFC)) were assessed. Spectrum-intensity interactions significantly influenced FW, with RW-180 µmol m−2 s−1 yielding the highest FW (78.2 g plant−1 in green and 48.5 g plant−1 in purple lettuce). BW-90 µmol m−2 s−1 maximized DWP in green lettuce, while PAR intensity of 180 µmol m−2 s−1 favored DWP in purple lettuce. Chlorophyll concentration increased under PAR intensity of 180 µmol m−2 s−1, and leaf color varied with spectrum, with RW producing lighter leaves. Antioxidant parameters declined over time, but a PAR intensity of 180 µmol m−2 s−1, particularly under RW, boosted TPC and TFC contents in both lettuce cultivars during early stages (days 0 and 15). Conversely, a lower PAR intensity of 90 µmol m−2 s−1, mainly under RW, enhanced antioxidant capacity by FRAP at 15 days and by the end of the cycle for both cultivars. Overall, RW-180 µmol m−2 s−1 interactions promoted the best characteristics in lettuce. Nonetheless, the findings emphasize the significance of fine-tuning both light spectrum and intensity to enhance lettuce growth and quality in vertical farming systems considering the cultivar, time and variable to be evaluated.
1. Introduction
The demand for food is rising due to the continuous increase in the global population, which poses a significant challenge for agriculture, particularly amid decreasing arable land, resource scarcity, and the need for sustainable production [1]. According to Alexandratos and Bruinsma [2], the world population is expected to increase by more than one-third (2.3 billion people) between 2009 and 2050, driving a growing demand for food. Faced with this challenge, innovative alternatives have emerged that integrate agriculture, engineering, and architecture, creating vertical types of agriculture in cities [3], thereby optimizing the use of space, energy, and water.
Vertical farming has grown rapidly, combined with indoor farming production technologies such as hydroponics. This method produces a crop in water with nutrients, which offers numerous advantages, such as high yield, good quality, continuous production, and efficient use of resources, among others [4]. Among the most common crops in these systems are short-cycle, single-crop green leafy vegetables, such as lettuce [5]. This crop is notable for its rapid growth, short growing cycle, high planting density, and low energy demand [6,7,8].
Climatic conditions in vertical cultivation systems are highly dependent on energy consumption, with lighting being the main vector, responsible for 65–85% of total energy expenditure [9]. Increasing light intensity, for example, from 250 to 700 µmol m−2 s−1, dramatically increases energy consumption [9,10,11], raising the need to optimize intensities to meet both plant photosynthetic demands and system energy efficiency.
Light provides energy for photosynthesis and regulates plant growth and development based on its intensity and spectral quality [12,13]. Photosynthetic pigments preferentially absorb light in the blue (430–453 nm) and red (642–663 nm) ranges, optimizing photon conversion and activating key metabolic pathways [14,15,16,17,18]. In particular, red and blue spectra are the most efficient for plant growth and development due to their impact on photosynthesis and regulation of physiological processes [19,20,21,22].
In addition to red and blue spectra, other light ranges, such as ultraviolet (UV), green, and far-red (FR), can induce specific responses in plants. For example, adding UV-A light can affect dry weight and leaf area, depending on the exact wavelength employed [23]. Low-intensity white light (55 µmol m−2 s−1) has promoted an increase in fresh weight and leaf length in lettuce seedlings [24], while the combination of red and far-red light (R:FR in a 3:2 ratio) and intensities of 300 µmol m−2 s−1 significantly increased leaf area, fresh weight and gas exchange [25].
The light spectrum also influences the accumulation of phytochemicals. Blue and red light have increased compounds such as polyphenols and anthocyanins in lettuce [26,27]. For example, UV or green light supplementation over a basal spectrum (blue + red + FR) has increased the production of antioxidants and pigments such as α-carotene and anthocyanins [27]. Similarly, adding FR to red light has improved vitamin C and soluble sugar content [25]. However, lights with a high red fraction (150 µmol m−2 s−1) have reduced chlorophyll and carotenoid levels in arugula and lamb’s lettuce [28]. In comparison, spectra with high red:blue ratios (7.5:1) and intensities between 216 and 376 µmol m−2 s−1 have a reduced phenolic content in green lettuce [29].
Light intensity also regulates growth and nutritional quality. In microgreens, intensities of 120 and 160 µmol m−2 s−1 (23% blue + 75% red + 2% FR) showed enhanced yield compared to higher intensities (220 µmol m−2 s−1) [30]. In lettuce, intensities of 250 µmol m−2 s−1 have promoted higher fresh biomass than low intensities of 60 µmol m−2 s−1 [31]. Furthermore, intensities between 350 and 450 µmol m−2 s−1 combined with red and blue spectra (R:B = 2:1) and concentrated nutrient solutions significantly improved polyphenol and anthocyanin levels [32]. Additionally, studies suggest that intensities between 150 and 300 µmol m−2 s−1 under blue and red light increase antioxidants, phenols, and sugars in species such as lettuce, cabbage, cucumber, and spinach [13].
The lower intensity of 60 µmol m−2 s−1 can also promote higher antioxidant capacity in lettuce when red + blue spectra with different R:B ratios were used [31]. Hernandez-Adasme et al. [30] showed that an intensity of 120 µmol m−2 s−1 under the spectrum of 23% blue + 75% red + 2% far-red and a photoperiod of 16 h of light promoted betalain accumulation in beet microgreens compared to 220 µmol m−2 s−1 by 35% and a photoperiod of 12 h of light by 96.8%.
Therefore, incorporating additional wavelengths to the blue and red spectrum, which amplifies the spectral quality of lighting, is a promising strategy to maximize vegetative growth, morphological development, and the antioxidant profile of vegetables. Although several studies have demonstrated the beneficial effects of blue and red light on crops like lettuce, the impact of more complete spectra that include ultraviolet (UV-A), green, and far-red (FR) light, in combination with varying light intensities, remains largely unexplored. Furthermore, previous studies have not sufficiently addressed the interaction between spectral quality and light intensity on agronomic parameters and functional quality in leafy vegetables grown in vertical hydroponic systems.
This study was set out with the aim of evaluating the interaction between complete light spectra and different light intensities on the morphological characteristics and antioxidant properties of green and purple leafy lettuce grown in vertical hydroponic systems. It is hypothesized that the combination of full light spectra, integrating ultraviolet (UV-A) or far-red (FR) light, at moderate intensities improves the fresh weight and antioxidant quality of lettuce grown in vertical hydroponic systems.
2. Materials and Methods
2.1. Plant Material and Growth Conditions
This study was conducted in a vertical farm system set up in adapted 3.5 × 4.0 × 6.0 m cold chambers at the Post-harvest Study Center (CEPOC) at the University of Chile (33°34′ S, 70°38′ W). Five 1.7 × 1.8 × 0.45 m metal shelves were arranged inside the chamber, with three levels per shelf. LED lamps for each light treatment were mounted on each level (Table 1). Dividers made of opaque, non-translucent material were placed between the experimental units to avoid overlapping between light treatments. This design ensured effective isolation, preventing light transmission between adjacent treatments and guaranteeing the independence of the evaluated light conditions.

Table 1.
Treatments applied to green ‘Bartimer’ and purple ‘Soltero’ lettuces grown hydroponically in a vertical farm.
Lettuce seeds (Lactuca sativa L.) of green and purple loose leaf type Lollo ‘Bartimer’ and ‘Soltero’, respectively, (Nuhmens, BASF) were used. The Bartimer variety is characterized by its bright green color, tender texture, vigorous growth, and high leaf quality [33]. ‘Soltero’, in contrast, is characterized by its reddish color and a high content of antioxidant compounds, in addition to showing positive results in using hydroponic crops [34].
Sowing was carried out in 105-cell plastic trays with a single seed allocated to each cell at the time of sowing. The substrate used was a mixture of DSM2 W R0632 peat (Kekkilä, Vantaa, Finland) and A6 perlite (Harborlite, Santiago, Chile) in a 1:2 (v:v) ratio. The sown trays were placed under each light treatment in the vertical cultivation system. Once the seedlings reached a 5 to 6 cm root length and three to four true leaves, they were transplanted to the floating root system and maintained until harvest (45 days after transplant). The floating root system consisted of plastic trays (0.40 × 0.30 × 0.06 m) on which a white acrylic sheet (0.45 × 0.35 × 0.07 m) with 14 perforations was placed. The nutrient solution (4 L per tray) was changed weekly in each tray, and its composition was mentioned in the studies by Hernández-Adasme et al. [24] and Lara et al. [35]. The nutrient solution was oxygenated by supplying air through 4 mm diameter silicone hoses connected to an air compressor (SOBO Electrical Appliance Co., Ltd., SB-748, Guangzhou, China), achieving a concentration that ranged between 8 and 10 mg L−1 in each tray. The pH of the nutrient solution was measured with a potentiometer (Hi99301, Hanna Instruments, Woonsocket, RI, USA), maintained between 5.8 and 6.0 and adjustments were made with an acid solution (1.2% phosphoric acid + 3.8% nitric acid + 95% water) when appropriate. The electrical conductivity was measured with a conductivity meter (Hi99301, Hanna Instruments, Woonsocket, RI, USA), maintained around 2.0 mS cm−1 by the addition of fertilizers to compensate for any variations in nutrient concentrations. Both parameters (pH and EC) were measured weekly at each solution change. The ambient temperature and relative humidity during crop growth were 22 ± 2 °C and 70–80%, respectively. Neither variable varied significantly during lettuce cultivation. The thermal energy emitted by the LED lamps was minimal (±2 °C), and the humidity variations were slight, not exceeding 5% between light and dark periods.
2.2. Light Treatments
The light treatments consisted of three different light spectra under two intensities, 90 and 180 µmol m−2 s−1. A TG-14 plug-in analog timer (ManHua Electric Co., Ltd., Wenzhou, China) was used to program the 12-h photoperiod to save energy. The Blue-White (BW) treatment was given by a panel with a 32.5 × 19.5 cm dimmer (Samsung, LM301h Quantum LED, Suwon, Republic of Korea). The Red-White (RW) treatment consisted of two LED tubes 1.2 m long (Sonneteck Technology Co., Ltd., GL-TL040P12BF-01, Xiamen, China). Finally, Red-Blue (RB) was achieved with 36 × 30 cm LED lamps (ASYCAR, Santiago, Chile). Each treatment was initiated on the day of sowing.
2.3. Agronomic Characteristics
Agronomic characteristics were evaluated at harvest, i.e., 45 days after transplanting.
2.3.1. Fresh Weight (FW)
The fresh weight of the aerial part of three lettuce plants obtained from each replicate was measured at harvest. The result was expressed in grams per plant (g plant−1).
2.3.2. Dry Weight Percentage (DWP)
The dry weight percentage was measured by drying the aerial part of the same three plants per replicate obtained for fresh weight. Drying was performed in an LFO-250F oven (LabTech, Gyeonggi-do, Republic of Korea) at 60 °C until the sample maintained a constant weight. The weight was obtained from a CMN3000-1 semi-analytical balance (Kern & Sohn GmbH, Balingen, Germany), and the result was presented as a percentage using the equation proposed by Hernández-Adasme et al. [26]:
where FW and DW correspond to fresh and dried weight, respectively.
DWP = (DW/FW) × 100
2.3.3. Leaf Number
The total number of leaves of three independent plants for each repetition and treatment was counted at harvest time.
2.3.4. Color
Lightness (L*), chroma (C*), and hue (h*) were measured on the adaxial side of all extended leaves of three plants per replicate. Three measurements were taken for each leaf using a compact tristimulus colorimeter minolta chroma meter model CM-2500d (Konica Minolta INC., Osaka, Japan).
2.3.5. Normalized Difference Vegetation Index (NDVI) as a Relative Index of Chlorophyll Concentration
This measurement was performed on two leaves from each of the three plants chosen per replicate in each treatment. Measurements were performed using a reflectance-based device (PlantPen NDVI 300, Photon Systems Instruments (PSI), Drásov, Czech Republic).
2.4. Antioxidant Parameters
Antioxidant parameters were evaluated at three harvest stages, at transplanting (day 0), 15 and 45 days after transplanting; each phenological stage was analyzed independently.
2.4.1. Total Phenolic Content (TPC)
Total phenolic content was determined according to the method proposed by Singleton and Rossi [36] and the modifications indicated by Hernández-Adasme et al. [29]. A calibration curve performed with gallic acid was used to obtain the total phenol concentration. The results were expressed as mg gallic acid equivalent (GAE) 100 g−1 FW.
2.4.2. Antioxidant Capacity
The FRAP (ferric reducing/antioxidant power) protocol was carried out according to the methods proposed by Benzie and Strain [37] following the modifications proposed by Hernández-Adasme et al. [30]. The method monitors the reaction of a ferric-TPTZ (2,4,6-tripyridyl-s-triazine) solution, which changes from a ferric to a ferrous form through contact with the antioxidant compounds. This reduced the total antioxidant compounds in the reaction, changing the absorbance ratios at 593 nm. The antioxidant capacity by FRAP was calculated through a calibration curve performed with Trolox. The results were expressed as mg Trolox equivalent (TE) 100 g−1 FW.
The measurement of antioxidant capacity by DPPH was carried out according to the method proposed by Brand-Williams et al. [38] and following the modifications used by Hernández-Adasme et al. [30]. To 250 µL of plant extract, 1 mL of 0.1 mM DPPH solution was added and incubated for 20 min. Subsequently, 200 µL of the mixture (extract and DPPH reagent) was taken and transferred to a spectrophotometer multi-cell plate (ASYS UVM340 Biochrom, Cambridge, UK), and readings were taken at 517 nm. After 2 h of incubation, the absorbance of the reaction was measured again. The antioxidant capacity was calculated using a calibration curve based on a Trolox stock solution. The results were expressed as mg Trolox equivalent (TE) 100 g−1 FW.
2.4.3. Total Flavonoid Content (TFC)
Total flavonoid content was determined with aluminum chloride as described by Flores et al. [39]. 100 µL of 5% NaNO2 were added to 100 µL of the extract, and after 5 min, 10% AlCl3 was added. After standing for 6 min at room temperature, 670 µL of 1 M NaOH were added. Finally, the reaction absorbance was measured at 510 nm using a spectrophotometer multi-cell plate (ASYS UVM340, UK). The results were expressed as milligrams of Rutin equivalent (RE) 100 g−1 FW.
2.5. Experimental Design and Statistical Analysis
The experiment was designed as a completely randomized 3 × 2 factorial structure, with three repetitions per treatment, with each repetition consisting of three plants. The first factor was the light spectrum, with three levels (Blue-White (BW; R:B = 2.2:1), Red-White (RW; R:B = 3.1:1), and Red-Blue (RB; R:B = 5:1). The second factor was the intensity, with two levels (90 and 180 µmol m−2 s−1). The data were analyzed using linear mixed models for each variable evaluated and each lettuce cultivar independently. Finally, the differences between means were compared using Fisher’s LSD test for the interaction of factors or independent factors when they corresponded with a significance level of 5% (α = 0.05). Statistical analyses were performed with the InfoStat software (version 2020e) and R programming language (i386 3.6.3) version 2020 [40].
3. Results
3.1. Agronomic Characteristics
3.1.1. Fresh Weight
A significant interaction between light intensity and spectrum on FW was observed in both cultivars (Figure 1a, b). In green lettuce ‘Bartimer’, the highest fresh weights were recorded with RW-180 (78.2 g plant−1) and BW-180 µmol m−2 s−1 (64.5 g plant−1). For both cases, the increase in PAR intensity determined a 37% rise in FW in BW and RW whereas no differences were observed in RB treatments (Figure 1a). In purple ‘Soltero’ lettuce, the highest values were achieved with the treatments RW-180 (48.5 g plant−1), BW-180 (46.1 g plant−1), and BW-90 µmol m−2 s−1 (45.7 g plant−1). In particular, increasing PAR intensity resulted in 41.4% more FW in RW while no significant differences were observed under BW and RB. On the other hand, these fresh weights were lower than those obtained by the green ‘Bartimer’ lettuce (Figure 1b).
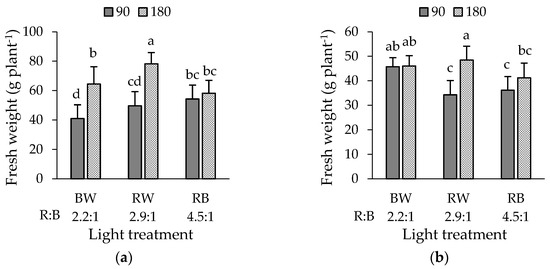
Figure 1.
Fresh weight of (a) green ‘Bartimer’ and (b) purple ‘Soltero’ lettuces grown hydroponically in a vertical farm exposed to different light spectra and PAR intensities (µmol m−2 s−1) at 45 days post-transplanting. Different letters indicate significant differences in the factor or the interaction between factors (Fisher’s test, p ≤ 0.05).
3.1.2. Dry Weight Percentage (DWP)
In green ‘Bartimer’ lettuce, a significant interaction between light intensity and spectrum on DWP was observed (Figure 2a). Treatments BW, RW, and RB-90 µmol m−2 s−1 showed the highest values; in particular, BW-90 µmol m−2 s−1 showed the highest value of 11.2%. Thus, the lower PAR intensity improved the DWP by 95.3, 93.8 and 69.1% under RW, BW and RB, respectively (Figure 2a). In purple ‘Soltero’ lettuce, significant differences were observed in the intensity factor only, with 180 µmol m−2 s−1 being the highest value (7.8%) compared to 90 µmol m−2 s−1 (6.9%) which meant a 13.0% increase in DWP (Figure 2b).
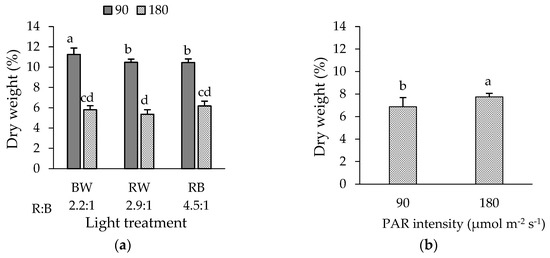
Figure 2.
Dry weight percentage of (a) green ‘Bartimer’ and (b) purple ‘Soltero’ lettuces grown hydroponically in a vertical farm exposed to different light spectra and PAR intensities (µmol m−2 s−1) at 45 days post-transplanting. Different letters indicate significant differences in the factor or the interaction between factors (Fisher’s test, p ≤ 0.05).
3.1.3. Number of Leaves per Plant
The number of leaves per plant of both cultivars showed significant differences in spectrum and intensity factors independently. In green ‘Bartimer’ lettuce, the highest values were observed under the RW treatment (25.0 leaves per plant). Specifically, the number of leaves increased significantly under RW versus RB by 6.4%, while no significant differences were found between BW and the other light spectra (RW and RB) (Table 2). On the other hand, PAR intensity of 180 µmol m−2 s−1 reached 25.6 leaves per plant, a significant increase of 12.8% compared to low PAR intensity (90 µmol m−2 s−1) (Table 2). Similarly, in purple ‘Soltero’ lettuce, the maximum value was recorded under BW (22.0 leaves per plant). Thus, BW determined a 7.3% rise in the number of leaves compared to RB. In contrast, no differences were observed between BW and RW, and RW and RB (Table 2). Likewise, PAR intensity of 180 µmol m−2 s−1 significantly enhanced the number of leaves (22.6 leaves per plant) compared to low PAR intensity (90 µmol m−2 s−1) by 13.0% (Table 2).
Table 2.
Leaf number and NDVI (Normalized Difference Vegetation Index) of green ‘Bartimer’ and purple ‘Soltero’ lettuces grown hydroponically in a vertical farm exposed to different light spectra and PAR intensities (µmol m−2 s−1) at 45 days post-transplanting.
3.1.4. NDVI (Normalized Difference Vegetation Index)
Significant differences were observed only for the intensity factor in both cultivars, with the highest values being found at 180 µmol m−2 s−1 (Table 2). Green ‘Bartimer’ and purple ‘Soltero’ lettuces reached an NDVI of 11.8% and 17.5% higher than the PAR intensity of 90 µmol m−2 s−1, respectively (Table 2).
3.1.5. Color
The spectrum was the only factor significantly affecting lightness in green ‘Bartimer’ lettuce. In particular, the RW treatment significantly enhanced lightness, surpassing BW and RB by 3.1% and 8.6%, respectively (Table 3 and Figure 3). Conversely, no significant differences were detected in chroma or hue in this cultivar (Table 3). In purple ‘Soltero’ lettuce, significant differences were evident across all evaluated parameters—lightness, chroma, and hue—exclusively for the spectrum factor (Table 3). Specifically, RW (49) significantly increased lightness compared to RB (46) and BW (45) by 6.5% and 8.9%, respectively. Likewise, the chroma showed a notable rise under RW, exceeding RB and BW by 42.8% and 48.7%, respectively. Additionally, hue values were significantly higher in RW (117°) than RB (113°) and BW (112°). These findings suggest that purple ‘Soltero’ lettuce grown under RW conditions exhibited a greener and lighter appearance (Table 3 and Figure 4).
Table 3.
Lightness (L*), Chroma (C*), and Hue (H°) of green ‘Bartimer’ and purple ‘Soltero’ lettuces grown hydroponically in a vertical farm exposed to different light spectra and PAR intensities (µmol m−2 s−1) at 45 days post-transplanting.
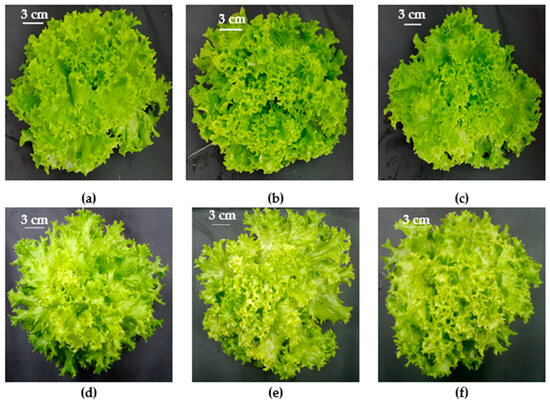
Figure 3.
Green ‘Bartimer’ lettuce grown hydroponically in a vertical farm exposed to (a) BW-90 µmol m−2 s−1; (b) RW-90 µmol m−2 s−1; (c) RB-90 µmol m−2 s−1; (d) BW-180 µmol m−2 s−1; (e) RW-180 µmol m−2 s−1; (f) RB-180 µmol m−2 s−1 at 45 days post-transplanting.
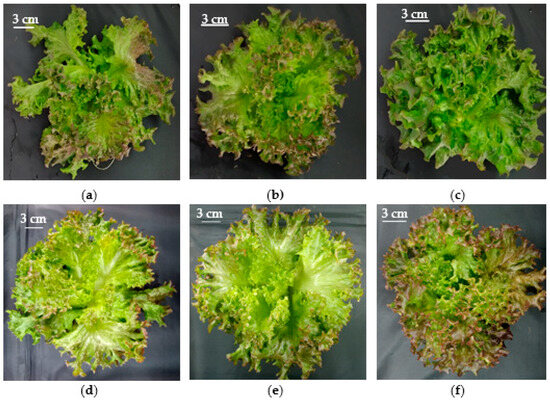
Figure 4.
Purple ‘Soltero’ lettuce grown hydroponically in a vertical farm exposed to (a) BW-90 µmol m−2 s−1; (b) RW-90 µmol m−2 s−1; (c) RB-90 µmol m−2 s−1; (d) BW-180 µmol m−2 s−1; (e) RW-180 µmol m−2 s−1; (f) RB-180 µmol m−2 s−1 at 45 days post-transplanting.
3.2. Antioxidant Parameters
3.2.1. Total Phenolic Content (TPC)
In the initial evaluation (day 0), a significant interaction between the evaluated factors was observed in both cultivars. In green ‘Bartimer’ lettuce, the highest values were recorded in the treatments RW-180 µmol m−2 s−1 (351 mg GAE 100 g−1 FW), BW-180 µmol m−2 s−1 (321 mg GAE 100 g−1 FW), and RB-180 µmol m−2 s−1 (317 mg GAE 100 g−1 FW). Thus, increasing the PAR intensity promoted a 268.6, 191.8 and 112.7% increase in TPC in RB, BW and RW, respectively (Table 4). In purple ‘Soltero’ lettuce, the highest value was recorded under the RW-180 µmol m−2 s−1, reaching 315 mg GAE 100 g−1 FW. Specifically, the enhancement of PAR intensity resulted in 164.7 and 50.0% rise in TPC under RW and RB, respectively, while no differences were observed in BW treatment (Table 5).
Table 4.
Antioxidant parameters of green ‘Bartimer’ lettuce grown hydroponically in a vertical farm exposed to different light spectra and PAR intensities (µmol m−2 s−1) at transplanting (day 0), 15, and 45 days post-transplanting.
Table 5.
Antioxidant parameters of purple ‘Soltero’ lettuce grown hydroponically in a vertical farm exposed to different light spectra and PAR intensities (µmol m−2 s−1) at transplanting (day 0), 15, and 45 days post-transplanting.
At 15 days post-transplant, both cultivars continued to exhibit a significant interaction between factors. In green ‘Bartimer’ lettuce, the RW-180 µmol m−2 s−1 recorded the highest value at 431 mg GAE 100 g−1 FW. Likewise, the rise in PAR intensity determined a 455.9, 367.4 and 226.5% increase in TPC in BW, RB and RW, respectively (Table 4). In addition, TPC values under 180 µmol m−2 s−1 were higher than in the previous evaluation (Table 4). For purple ‘Soltero’ lettuce, the RW-180 µmol m−2 s−1 and BW-180 µmol m−2 s−1 treatments delivered the highest TPC levels, reaching 488 and 459 mg GAE 100 g−1 FW, respectively. Overall, the enhancement of PAR intensity improved in 415.7, 299.1 and 108.6% the TPC under BW, RB and RW, respectively. Notably, the application of 180 µmol m−2 s−1 yielded values up to five times greater than the PAR intensity of 90 µmol m−2 s−1 and higher values than the previous evaluation (Table 5).
By 45 days post-transplant, TPC levels had significantly decreased in all green ‘Bartimer’ lettuce treatments and those with a light intensity of 180 µmol m−2 s−1 in the purple ‘Soltero’ lettuce. In green ‘Bartimer’ lettuce, the BW-180 µmol m−2 s−1 and RW-90 µmol m−2 s−1 emerged as the top performers, reaching 93 and 87 mg GAE 100 g−1 FW, respectively (Table 4). Particularly, the increase in PAR intensity caused an 82.4% and 21.9% improvement in TPC under BW and RB, respectively. On the contrary, the decrease in PAR intensity determined a 17.6% rise in TPC under RW (Table 4). Meanwhile, differences in purple ‘Soltero’ lettuce were primarily linked to the light spectrum factor, with BW and RW achieving the highest levels at 172 and 169 mg GAE 100 g−1 FW, respectively. Specifically, the TPC under BW and RW increased compared to RB by 13.9% and 11.9%, respectively (Table 5).
3.2.2. Antioxidant Capacity
Antioxidant Capacity by FRAP Assay
The antioxidant capacity showed a significant interaction between factors in both cultivars at the different harvest times (Table 4 and Table 5). On day 0, the RW-180 µmol m−2 s−1 significantly increased antioxidant capacity compared to the other treatments, reaching 511 mg TE 100 g−1 FW in green ‘Bartimer’ lettuce. On the other hand, the increase in PAR intensity determined a 951.4, 845.5 and 213.5% rise in antioxidant capacity in BW, RB and RW, respectively (Table 4). Similarly, in purple ‘Soltero’ lettuce, this same treatment (RW-180 µmol m−2 s−1) resulted in the highest value, with 748 mg TE 100 g−1 FW. Furthermore, moderate PAR intensity (180 µmol m−2 s−1) resulted in a 221.0, 180.3 and 144.0% enhancement of antioxidant capacity under RW, BW and RB, respectively, compared to lowest PAR intensity (90 µmol m−2 s−1) (Table 5). Moreover, on day 0, the intensity of 180 µmol m−2 s−1 under the different spectra was associated with the greatest antioxidant capacity values by FRAP compared to 90 µmol m−2 s−1 in both cultivars (Table 4 and Table 5).
At 15 and 45 days post-transplant, the highest antioxidant capacity was observed under the RW-90 µmol m−2 s−1 compared to the other treatments in both cultivars. In particular, in green ‘Bartimer’ lettuce, RW-90 µmol m−2 s−1 recorded 307 and 70 TE 100 g−1 FW on days 15 and 45, respectively. Thus, raising PAR intensity caused increases of 859.4, 580.0 and 377.8% of antioxidant capacity in RW, RB and BW, respectively, at day 15, whereas enhancing PAR intensity prompted the antioxidant capacity under RW, BW and RB by 1330.0, 300.0 and 266.7%, respectively at day 45 (Table 4). On the other hand, the highest antioxidant capacity of purple ‘Soltero’ lettuce was observed under RW-90 µmol m−2 s−1, reaching 345 and 181 mg TE 100 g−1 FW at days 15 and 45, respectively. Overall, the lower PAR intensity (90 µmol m−2 s−1) induced an increase in antioxidant capacity of 741.5, 251.2 and 169.2 at day 15 and 1408.2, 1140.0 and 892.3 at day 45 under RW, RB and BW, respectively (Table 5). Finally, at 180 µmol m−2 s−1, a progressive decrease in antioxidant capacity was noted in both cultivars over time (Table 4 and Table 5).
Antioxidant Capacity by DPPH Assay
The antioxidant capacity exhibited distinct patterns in both lettuce cultivars across the different evaluation stages. In the initial analysis (day 0), a significant interaction between factors was observed in green ‘Bartimer’ lettuce. Thus, RW-90 µmol m−2 s−1 achieving the highest TFC values (1420 mg TE 100 g−1 FW), i.e., the lower PAR intensity under RW increased antioxidant capacity compared to RW-180 µmol m−2 s−1 by 10.2%, meanwhile no differences were found between BW and RB spectra under the different intensities (Table 4). In contrast, the antioxidant capacity showed significant differences in each factor independently in the purple ‘Soltero’ lettuce. Specifically, the intensity of 90 µmol m−2 s−1 increased antioxidant capacity compared to 180 µmol m−2 s−1 by 16.4%. Additionally, the RW significantly enhanced antioxidant activity relative to BW by 23.2% while no differences were observed between RW and RB (Table 5).
At 15 days post-transplant, a significant interaction between factors persisted in green ‘Bartimer’ lettuce. The highest values were observed under RW- and RB-180 µmol m−2 s−1, reaching 1317 and 1306 mg TE 100 g−1 FW, respectively. Thus, the rise in PAR intensity improved the antioxidant capacity under RB, BW and RW by 14.9, 11.0 and 6.6%, respectively (Table 4). In purple ‘Soltero’ lettuce, significant differences continued to occur independently for each factor. The PAR intensity of 180 µmol m−2 s−1 significantly increased the antioxidant capacity by DPPH compared to 90 µmol m−2 s−1 by 7.8%. Conversely, RW provided higher values compared to RB and BW by 6.0% and 10.4%, respectively (Table 5).
After 45 days post-transplant, a significant interaction between factors was again observed in green ‘Bartimer’ lettuce. In particular, RB-90 µmol m−2 s−1 recorded the highest antioxidant capacity (1063 mg TE 100 g−1 FW). Thus, PAR intensity of 180 µmol m−2 s−1 resulted in an 8.4 and 6.3% increase in antioxidant capacity under RB and RW, respectively, compared to lowest PAR intensity (90 µmol m−2 s−1), whereas no differences were found in BW treatment (Table 4). In purple ‘Soltero’ lettuce, significant differences were maintained for each factor independently. The intensity of 90 µmol m−2 s−1 significantly raised antioxidant capacity compared to 180 µmol m−2 s−1 by 7.1%. Likewise, RW increased antioxidant capacity compared to both RB and BW by 5.8% (Table 5).
3.2.3. Total Flavonoid Content (TFC)
The TFC was significantly influenced by the interaction between the evaluated factors at all harvest stages in both green ‘Bartimer’ and purple ‘Soltero’ lettuces (Table 4 and Table 5). Overall, a decreasing trend in TFC values was observed over time (Table 4 and Table 5). On day 0, the RW-180 µmol m−2 s−1, RB-180 µmol m−2 s−1, and BW-180 µmol m−2 s−1 treatments in ‘Bartimer’ lettuce exhibited the highest TFC levels, reaching 839, 816, and 710 mg RE 100 g−1 FW, respectively. Therefore, increasing PAR intensity resulted in 1320.0, 1195.2 and 269.6% improved TFC in BW, RB and RW, respectively (Table 4). In purple ‘Soltero’ lettuce, the RW-180 µmol m−2 s−1 treatment exhibited the highest value, reaching 1098 mg RE 100 g−1 FW. On the other hand, PAR intensity of 180 µmol m−2 s−1 determined an increase of 315.9, 284.5, and 195.4% of TFC under RW, BW and RB, respectively (Table 5). In both cultivars, treatments under 180 µmol m−2 s−1 significantly increased TFC levels, proving to be the most effective compared to 90 µmol m−2 s−1 (Table 4 and Table 5).
On day 15, the RW-180 µmol m−2 s−1 and RB-180 µmol m−2 s−1 showed the highest values in the TFC content in green ‘Bartimer’ lettuce, reaching 798 and 740 mg RE 100 g−1 FW, respectively. In addition, the increase in PAR intensity caused an increase of 1221.4, 950.0 and 781.2% in TFC under RB, RW and BW, respectively (Table 4). On the other hand, a decrease in TFC was recorded in the same lettuce cultivar under the spectra with an intensity of 180 µmol m−2 s−1 compared to the evaluation on day 0. Similarly, in purple ‘Soltero’ lettuce, a decrease in TFC was identified across all treatments compared to the assessment on day 0. In addition, RB-180 µmol m−2 s−1 (662 mg RE 100 g−1 FW) and RW-180 µmol m−2 s−1 (642 mg RE 100 g−1 FW) showed the highest TFC levels. Likewise, enhancing PAR intensity improved TFC under BW, RW and RB by 219.6, 336.7 and 967.7%, respectively (Table 5). In both lettuce cultivars, the intensity of 180 µmol m−2 s−1 under the different spectra positively influenced TFC accumulation, resulting in significantly higher values compared to 90 µmol m−2 s−1 (Table 4 and Table 5).
Finally, on day 45 post-transplant, TFC was significantly affected by the interaction between the factors in green ‘Bartimer’ lettuce. In detail, RW 90 µmol m−2 s−1 treatment recorded the highest TFC, with a value of 60 mg RE 100 g−1 FW. On the other hand, the lower PAR intensity increased TFC in RW and RB by 57.9 and 36.7%, respectively. In contrast, PAR intensity of 180 µmol m−2 s−1 in BW significantly elevated TCF compared to lower intensity (90 µmol m−2 s−1) by 168.8% (Table 4). Moreover, TFC levels in this cultivar decreased further compared to day 15. In purple ‘Soltero’ lettuce, no significant differences were found among the treatments (Table 5).
4. Discussion
4.1. Agronomic Characteristics
The results showed that the interaction between spectrum and intensity affected fresh weight (FW) in both lettuce cultivars and dry weight (DWP) in green ‘Bartimer’ lettuce. The RW-180 µmol m−2 s−1 treatment promoted the highest FW in both cultivars (Figure 1a,b), characterized by a UVA:B:G:R:FR spectrum = 1:17:25:49:8 and an R:B ratio of 2.9:1.0. This treatment also presented the highest proportion of far-red (FR, 8%) and the lowest R:FR ratio (6.1:1). Previous studies have reported that FR supplementation can increase biomass in lettuce plants [25,41,42,43]. Additionally, Tan et al. [44] pointed out that FR can regulate the photosynthetic capacity, facilitating biomass accumulation [45]. Then, the increase in FW under RW-180 µmol m−2 s−1 could be associated with the elevated proportion of FR in the spectrum.
In this study, BW, RW and RB spectra at low PAR intensity (90 µmol m−2 s−1) favored the increase in the percentage of dry weight in green ‘Bartimer’ lettuce (Figure 2a). According to Ghorbanzadeh et al. [46] a lower PAR intensity (75 µmol m−2 s−1) tends to develop a larger specific leaf area (cm−2 g−1), i.e., thinner and wider leaves, which may improve light penetration and utilization within the canopy, resulting in higher dry weight accumulation. In contrast, the lowest DWP was observed at RW-180 µmol m−2 s−1 in ‘Bartimer’ (Figure 2a), indicating that the higher FW could be attributed to a higher water content. Furthermore, the number of leaves per plant increased significantly under RW-180 µmol m−2 s−1 (Table 2), which could also explain the increase in FW due to higher leaf production under FR treatments [42]. In purple lettuce ‘Soltero’, light intensity significantly impacted DWP, with higher values under 180 µmol m−2 s−1 (Figure 2b). Jin et al. [47] indicated that light intensity influences dry weight and is a key factor in determining photosynthesis [48]. This process converts light energy into chemical energy [49], mainly carbohydrates contributing to DWP [50]. Therefore, the higher intensity applied in this study probably promoted a greater accumulation of carbohydrates in purple ‘Soltero’ lettuce, increasing DWP. Thus, each cultivar responds differentially to the imposed light conditions, indicating that the effect of the light factors and/or their interaction on DWP is cultivar dependent.
Normalized difference vegetation index (NDVI) sensors equipped with red and NIR light detectors can estimate chlorophyll content by measuring light transmitted through leaves [51]. Alsiņa et al. [52] found that NDVI showed the best correlations for estimating chlorophyll in different species, including loose-leaf lettuce. In this study, higher light PAR intensity (180 µmol m−2 s−1) increased chlorophyll concentration in green and purple lettuces, reflected in higher NDVI values compared to lower PAR intensity (90 µmol m−2 s−1) (Table 2). These results align with those of Zhou et al. [53] and Pennisi et al. [54], who reported that a PAR intensity between 150 and 200 µmol m−2 s−1 enhances chlorophyll content in lettuce plants compared to 100 µmol m−2 s−1. However, higher intensities can further increase chlorophyll content, with 250 µmol m−2 s−1 being the threshold beyond which no significant differences are observed [54]. Furthermore, Chen et al. [51] pointed out that a higher chlorophyll concentration reduces red light transmission, increasing absorption and generating higher NDVI values. In this study, NDVI responded significantly only to the light intensity factor in both cultivars; however, other studies, like that regarding Batavia cv. Blackhawk, showed that NDVI did not vary under different intensities (130–389 µmol m−2 s−1) in a blue-red spectrum [20]. This discrepancy suggests that the effect of light intensity on NDVI might depend on the specific analyzed lettuce cultivar.
Leaf color is a key phenotypic characteristic in horticultural crops [55], affecting consumers’ perception and choice of vegetables [56]. In this study, the light spectrum influenced lettuce leaf color. The RW spectrum produced a lighter color in the green ‘Bartimer’ lettuce by significantly increasing luminosity (Table 3). Similarly, in the purple ‘Soltero’ lettuce, the RW spectrum promoted higher luminosity, chroma, and hue (Table 3), generating greener and lighter leaves. Meanwhile, the BW and RB spectra induced more yellow and less green colors (Table 3). These effects could be due to the higher proportion of far-red (FR) in RW (8%), which is consistent with Carotti et al. [57], who found that increasing FR in RB light increased lightness and hue in red lettuce var. Canasta. However, the addition of FR showed a reduction in red coloration in other varieties, as reported by Meng et al. [58] and Meng and Runkle [59], who noted lower anthocyanin levels in ‘Cherokee’ and ‘Rouxai’ under similar conditions. In this study, the spectra used promoted low anthocyanins accumulation in ‘Soltero’ lettuce (Figure 4), possibly due to the low light intensities used.
4.2. Antioxidant Parameters
Lettuce is an important vegetable due to its high content of phytochemicals, such as phenolic acids [60,61,62], flavonoids [60,61,62,63], and anthocyanins [60,63], which provide essential antioxidant properties in the human diet. The biosynthesis and accumulation of these compounds are closely regulated by environmental factors such as light quality, intensity, and duration [62]. In this study, the interaction between light spectrum and intensity significantly influenced the antioxidant parameters. An intensity of 180 µmol m−2 s−1 promoted an increase in total phenolic (TPC) and flavonoid (TFC) content on days 0 and 15 in both cultivars, while at the final evaluation (day 45), a lower PAR intensity (90 µmol m−2 s−1) favored these compounds in the green lettuce ‘Bartimer’.
This differential effect may be attributed to the activation of specific metabolic pathways induced by the characteristics of the RW spectrum (UVA:B:G:R:FR = 1:17:25:49:8; R:B = 2.9:1.0), characterized by a high proportion of UV-A and far-red (FR). UV-A light has been shown to induce the expression of the phenylalanine ammonia-lyase (PAL) gene, a key point in the phenylpropanoid pathway, facilitating the synthesis of phenolic compounds and antioxidants [64]. Additionally, far-red (FR) is associated with increased photosynthetic capacity and biomass accumulation [41,44], which indirectly favors the synthesis of secondary metabolites such as flavonoids and anthocyanins.
In particular, the increase in TPC and TFC during the first 15 days under 180 µmol m−2 s−1 could be linked to the ability of light to induce the expression of key genes such as chalcone synthase (CHS), flavonoid 3-hydroxylase (F3H), and UDP-glucose:flavonoid 3-O-glucosyltransferase (UFGT), involved in the biosynthesis of flavonoids and phenols under blue and red light [65]. Reducing the intensity to 90 µmol m−2 s−1 at the final stages (day 45) might also have made it possible to preserve and stabilize antioxidant production by reducing light stress, as suggested by previous studies in lettuce grown under different light conditions [39,61].
Antioxidant capacity, as measured by FRAP and DPPH, showed a less clear but more prominent pattern under RW, especially at 90 µmol m−2 s−1 at day 45, suggesting that moderate intensities initially favor the activation of biosynthetic pathways. In contrast, lower intensities at later stages promote sustained antioxidant accumulation. Flores et al. [39] supported this observation by showing that intensities of 100 µmol m−2 s−1 significantly increased TPC and antioxidant capacity in green lettuce ‘Romana Long Blonde Galaica’ compared to lower intensities. Similarly, Song et al. [32] found that FRAP and DPPH were enhanced at irradiances between 350 and 450 µmol m−2 s−1 in contrast to lower irradiances (150–250 µmol m−2 s−1). Furthermore, Hernández-Adasme et al. [29] indicated that low R:B ratios (0.4–1.6:1.0) increased TPC in green lettuce, while Naznin et al. [66] reported the opposite, with increases in antioxidants under higher R:B ratios (4.9:1.0). These findings suggest that the R:B ratio of 2.9:1.0 in this study may have optimized a balance between red and blue light, favoring the accumulation of antioxidant compounds in the first days of cultivation, while the intensity reduction to 90 µmol m−2 s−1 preserved these levels in later stages.
Regarding flavonoid content, the intensity of 180 µmol m−2 s−1 was effective in the first days (0 and 15) for both cultivars, especially under the RW spectrum, rich in UV-A and FR. This result agrees with studies highlighting the role of blue light in regulating biosynthetic genes such as CHS and F3H in lettuce plants [67], which drives flavonoid accumulation. On the other hand, Van Brenk et al. [42] showed that flavonoid content increased linearly with increasing blue in the R:B ratio (1.5:1.0 to 7.0:1.0). However, some studies, such as Naznin et al. [66], also pointed out that higher intensities may inhibit certain antioxidants, thereby necessitating a reduction in intensity to 90 µmol m−2 s−1 at later stages.
This behavior could also be related to differential gene activation under light intensities. Kitazaki et al. [65] revealed that blue and red wavelengths enhance the expression of genes such as PAL, CHS, and DFR, which are involved in flavonoid and phenolic metabolic pathways. Specifically, Hernández-Adasme et al. [26] observed enrichment in C3H expression under low R:B ratios (0.5:1.0), while other authors, such as Karami et al. [68] and Ouzounis et al. [69], highlighted that blue light increases flavonoid production, but with a greater effect on red lettuces.
The results suggest that the combination of a RW spectrum, rich in FR and UV-A, together with an initial intensity of 180 µmol m−2 s−1 followed by 90 µmol m−2 s−1, optimizes the biosynthesis of antioxidants and flavonoids in green ‘Bartimer’ and purple ‘Soltero’ lettuces. This effect can be attributed to light-induced enzymatic and gene regulation, such as the activation of PAL, CHS, and UFGT, supported by previous studies on metabolic pathways under different spectra and intensities [70,71,72]. Therefore, this lighting strategy represents an effective tool to improve the nutritional value of lettuce through the precise management of light spectra and intensities.
5. Conclusions
Spectrum and light intensity significantly influence various growth characteristics and chemical quality of lettuce plants independently or by the interaction of both factors. Overall, RW spectrum (UV:B:G:R:FR = 1:17:25:49:8; R:B = 2.9:1.0) in combination with 180 µmol m−2 s−1 (RW-180 µmol m−2 s−1) improved FW in both lettuce cultivars, although the effect was greater in ‘Bartimer’ green lettuce, indicating that the effect was cultivar-dependent. Independently, RW and 180 µmol m−2 s−1 positively promoted leaf number. Whereas, only the intensity of 180 µmol m−2 s−1 improved chlorophyll content in both lettuce cultivars. Thus, RW and the intensity of 180 µmol m−2 s−1 would be the most favorable factors to achieve better growth in lettuce plants. Regarding antioxidant parameters, the intensity of 180 µmol m−2 s−1, especially under the RW spectrum, favored the content of total phenols (TPC) and flavonoids (TFC) in early stages (days 0 and 15) of green ‘Bartimer’ and purple ‘Soltero’ lettuce. While lower PAR intensity (90 µmol m−2 s−1), mainly under RW, optimized antioxidant capacity only by FRAP at 15 days and at the end of the cycle (day 45), both in green ‘Bartimer’ and purple ‘Soltero’ lettuce. Thus, the effect on antioxidant parameters varied according to variable, time and cultivar. Finally, these results highlight the importance of optimizing both light spectrum and light intensity to maximize lettuce production and quality in vertical growing systems.
Author Contributions
Conceptualization, C.H.-A., M.J.G. and M.A.F.-B.; methodology, C.H.-A., M.J.G., M.A.F.-B. and V.M.; formal analysis, C.H.-A., R.N., D.D., C.S.-P.; investigation, C.H.-A., M.J.G. and M.A.F.-B.; data curation, C.H.-A. and M.A.F.-B.; writing—original draft preparation, C.H.-A., R.N., D.D. and V.M.; writing—review and editing, C.H.-A., R.N., D.D., C.S.-P., B.S., X.Y. and V.H.E.; supervision, C.H.-A. and V.H.E.; project administration, V.H.E.; funding acquisition, V.H.E. All authors have read and agreed to the published version of the manuscript.
Funding
This research was funded by FONDECYT REGULAR (ANID, Chile), number 1230703.
Data Availability Statement
No new data were created or analyzed in this study. Data sharing does not apply to this article.
Conflicts of Interest
The authors declare no conflicts of interest.
References
- Wang, M.; Wan, D.; Xie, X.; Bai, Z.; Wang, R.; Zhang, X.; Yi-Zhou, G.; Zhiliang, T.; Yin, Y. Crop-livestock integration: Implications for food security, resource efficiency and greenhouse gas mitigation. Innov. Life 2024, 2, 100103-1. [Google Scholar] [CrossRef]
- Alexandratos, N.; Bruinsma, J. World Agriculture Towards 2030/2050: The 2012 Revision; Food and Agriculture Organization of the United Nations: Rome, Italy, 2024; p. 147. [Google Scholar]
- Soares, L.L.; Priore, R. Fazenda vertical como modelo sustentável de agricultura urbana. Rev. Gest. Sustentabilidade Ambient. 2023, 12, 1–15. [Google Scholar]
- Li, J.; Wu, T.; Huang, K.; Liu, Y.; Liu, M.; Wang, J. Effect of LED spectrum on the quality and nitrogen metabolism of lettuce under recycled hydroponics. Front. Plant Sci. 2021, 12, 678197. [Google Scholar] [CrossRef]
- Boros, I.F.; Székely, G.; Balázs, L.; Csambalik, L.; Sipos, L. Effects of LED lighting environments on lettuce (Lactuca sativa L.) in PFAL systems—A review. Sci. Hortic. 2023, 321, 112351. [Google Scholar] [CrossRef]
- Bantis, F.; Smirnakou, S.; Ouzounis, T.; Koukounaras, A.; Ntagkas, N.; Radoglou, K. Current status and recent achievements in the field of horticulture with the use of light-emitting diodes (LEDs). Sci. Hortic. 2018, 235, 437–451. [Google Scholar] [CrossRef]
- Zhang, X.; He, D.; Niu, G.; Yan, Z.; Song, J. Effects of environment lighting on the growth, photosynthesis, and quality of hydroponic lettuce in a plant factory. Int. J. Agric. Biol. Eng. 2018, 11, 33–40. [Google Scholar] [CrossRef]
- Ahmed, H.A.; Yu-Xin, T.; Qi-Chang, Y. Optimal control of environmental conditions affecting lettuce plant growth in a controlled environment with artificial lighting: A review. S. Afr. J. Bot. 2020, 130, 75–89. [Google Scholar] [CrossRef]
- Arcasi, A.; Mauro, A.W.; Napoli, G.; Tariello, F.; Vanoli, G.P. Energy and cost analysis for a crop production in a vertical farm. Appl. Therm. Eng. 2024, 239, 122129. [Google Scholar] [CrossRef]
- Cui, J.; Song, S.; Yu, J.; Liu, H. Effect of daily light integral on cucumber plug seedlings in artificial light plant factory. Horticulturae 2021, 7, 139. [Google Scholar] [CrossRef]
- Stanghellini, C.; Katzin, D. The dark side of lighting: A critical analysis of vertical farms’ environmental impact. J. Clean. Prod. 2024, 458, 142359. [Google Scholar] [CrossRef]
- Nájera, C.; Urrestarazu, M. Effect of the intensity and spectral quality of LED light on yield and nitrate accumulation in vegetables. HortScience 2019, 54, 1745–1750. [Google Scholar] [CrossRef]
- Nájera, C.; Gallegos-Cedillo, V.M.; Ros, M.; Pascual, J.A. LED lighting in vertical farming systems enhances bioactive compounds and productivity of vegetables crops. Biol. Life Sci. Forum 2022, 16, 24. [Google Scholar] [CrossRef]
- Hopkins, W.G.; Huner, N.P.A. Introduction to Plant Physiology, 3rd ed.; Wiley: Hoboken, NJ, USA, 2004; pp. 93–100. [Google Scholar]
- Nelson, J.A.; Bugbee, B. Economic analysis of greenhouse lighting: Light emitting diodes vs. high intensity discharge fixtures. PLoS ONE 2014, 9, e99010. [Google Scholar] [CrossRef] [PubMed]
- Wang, S.; Fang, H.; Xie, J.; Wu, Y.; Tang, Z.; Liu, Z.; Nivel, J.; Yu, J. Physiological responses of cucumber seedlings to different supplemental light duration of red and blue LED. Front. Plant Sci. 2021, 12, 709313. [Google Scholar] [CrossRef]
- Son, K.H.; Oh, M.M. Leaf shape, growth, and antioxidant phenolic compounds of two lettuce cultivars grown under various combinations of blue and red light-emitting diodes. HortScience 2013, 48, 988–995. [Google Scholar] [CrossRef]
- Stutte, G.W.; Edney, S.; Skerritt, T. Photoregulation of bioprotectant content of red leaf lettuce with light-emitting diodes. HortScience 2009, 44, 79–82. [Google Scholar] [CrossRef]
- Lee, J.H.; Kwon, Y.B.; Choi, I.-L.; Yoon, H.S.; Kim, J.; Kim, Y.; Kang, H.-M. Changes in spectral reflectance, photosynthetic performance, chlorophyll fluorescence, and growth of mini green romaine lettuce according to various light qualities in indoor cultivation. Horticulturae 2024, 10, 860. [Google Scholar] [CrossRef]
- Modarelli, G.C.; Paradiso, R.; Arena, C.; De Pascale, S.; Van Labeke, M.-C. High light intensity from blue-red LEDs enhance photosynthetic performance, plant growth, and optical properties of red lettuce in controlled environment. Horticulturae 2022, 8, 114. [Google Scholar] [CrossRef]
- Lee, J.H.; Kwon, Y.B.; Roh, Y.H.; Choi, I.-L.; Kim, J.; Kim, Y.; Yoon, H.S.; Kang, H.-M. Effect of various LED light qualities, including wide red spectrum-LED, on the growth and quality of mini red romaine lettuce (cv. Breen). Plants 2023, 12, 2056. [Google Scholar] [CrossRef]
- Brazaitytė, A.; Vaštakaitė-Kairienė, V.; Sutulienė, R.; Rasiukevičiūtė, N.; Viršilė, A.; Miliauskienė, J.; Laužikė, K.; Valiuškaitė, A.; Dene, L.; Chrapaciené, S.; et al. Phenolic compounds content evaluation of lettuce grown under short-term preharvest daytime or nighttime supplemental LEDs. Plants 2022, 11, 1123. [Google Scholar] [CrossRef]
- Samuolienė, G.; Viršilė, A.; Miliauskienė, J.; Haimi, P.; Laužikė, K.; Jankauskienė, J.; Novičkovas, A.; Kupčinskienė, A.; Brazaitytė, A. The photosynthetic performance of red leaf lettuce under UV-A irradiation. Agronomy 2020, 10, 761. [Google Scholar] [CrossRef]
- Hernández-Adasme, C.; Silva, H.; Escalona, V. In-door germination and seedling growth of green and red lettuce under LED-light spectrum and subsequent effect on baby leaf lettuce. Ital. J. Agron. 2022, 17, 1982. [Google Scholar] [CrossRef]
- Bi, X.; Xu, H.; Yang, C.; Zhang, H.; Li, W.; Su, W.; Zheng, M.; Lei, B. Investigating the influence of varied ratios of red and far-red light on lettuce (Lactuca sativa): Effects on growth, photosynthetic characteristics and chlorophyll fluorescence. Front. Plant Sci. 2024, 15, 1430241. [Google Scholar] [CrossRef]
- Hernández-Adasme, C.; Silva, H.; Peña, Á.; Vargas-Martínez, M.G.; Salazar-Parra, C.; Sun, B.; Escalona Contreras, V. Modifying the ambient light spectrum using LED lamps alters the phenolic profile of hydroponically grown greenhouse lettuce plants without affecting their agronomic characteristics. Plants 2024, 13, 2466. [Google Scholar] [CrossRef]
- Samuolienė, G.; Brazaitytė, A.; Sirtautas, R.; Viršilė, A.; Sakalauskaitė, J.; Sakalauskienė, S.; Duchovskis, P. LED illumination affects bioactive compounds in romaine baby leaf lettuce. J. Sci. Food Agric. 2013, 93, 3286–3291. [Google Scholar] [CrossRef]
- Frutos-Totosa, A.; Hernández-Adasme, C.; Martínez, V.; Mestre, T.; Díaz-Mula, H.M.; Botella, M.A.; Flores, P.; Martínez-Moreno, A. Light spectrum effects on rocket and lamb’s lettuce cultivated in a vertical indoor farming system. Sci. Hortic. 2023, 321, 112221. [Google Scholar] [CrossRef]
- Hernández-Adasme, C.; Silva, H.; Saavedra-Romero, J.; Martínez, V.; Escalona, V. Light supplementation and growing season affect the quality and antioxidant activity of lettuce. Chil. J. Agric. Res. 2023, 83, 320–333. [Google Scholar] [CrossRef]
- Hernández-Adasme, C.; Palma-Dias, R.; Escalona, V.H. The effect of light intensity and photoperiod on the yield and antioxidant activity of beet microgreens produced in an indoor system. Horticulturae 2023, 9, 493. [Google Scholar] [CrossRef]
- Mohamed, S.J.; Rihan, H.Z.; Aljafer, N.; Fuller, M.P. The impact of light spectrum and intensity on the growth, physiology, and antioxidant activity of lettuce (Lactuca sativa L.). Plants 2021, 10, 2162. [Google Scholar] [CrossRef]
- Song, J.; Huang, H.; Hao, Y.; Song, S.; Zhang, Y.; Su, W.; Liu, H. Nutritional quality, mineral and antioxidant content in lettuce afected by interaction of light intensity and nutrient solution concentration. Sci. Rep. 2020, 10, 279. [Google Scholar]
- Tobar, G.; Antúnez, A.; Corradini, F.; Vidal, M. Lettuce. In Technical Aspects of Cultivation, Irrigation and Nutrition in Lettuce, Tomato and Melon for the Central Zone of Chile; Blanco, C., Ed.; Instituto de Investigaciones Agropecuarias: Santiago, Chile, 2019; pp. 7–48. Available online: https://bibliotecadigital.ciren.cl/server/api/core/bitstreams/b9f82a07-65f6-47d8-a0c3-1b66d913d774/content (accessed on 20 November 2024).
- Alucho, P.J.; Patin, Q.A. Agronomic and Productive Behavior of Three Varieties of Lettuce (Lactuca sativa L.), in a Hydroponic System (NFT), with the Application of Two Biostimulants, Under Two Types of Environments, in the Guanujo Parish, Bolívar Province. Bachelor’s Thesis, Bolívar State University, Guaranda, Ecuador, 2023. [Google Scholar]
- Lara, O.A.; Amoros, A.; Tapia, M.L.; Escalona, V.H. Effect of a photoselective filter on the yield and postharvest quality of ‘Viroflay’ baby spinach (Spinacia oleracea L.) leaves cultivated in a hydroponic system. Sci. Hortic. 2021, 277, 109804. [Google Scholar] [CrossRef]
- Singleton, S.; Rossi, A. Colorimetry of total phenolics with phosphomolybdic-phosphotungstic and reagents. Am. J. Enol. Vitic. 1965, 16, 144–157. [Google Scholar] [CrossRef]
- Benzie, I.F.; Strain, J.J. The ferric reducing ability of plasma (FRAP) as a canopy structure in wheat (Triticum aestivum L.) and wild oat (Avena fatua L.) exposed to enhanced ultraviolet-B radiation. Funct. Ecol. 1996, 2, 319–330. [Google Scholar]
- Brand-Williams, W.; Cuvelier, M.E.; Berset, C.L. Use of a free radical method to evaluate antioxidant activity. LWT-Food Sci. Technol. 1995, 28, 25–30. [Google Scholar] [CrossRef]
- Flores, M.; Urrestarazu, M.; Amorós, A.; Escalona, V. High intensity and red enriched LED lights increased growth of lettuce and endive. Ital. J. Agron. 2022, 17, 1915. [Google Scholar] [CrossRef]
- Di Rienzo, J.A.; Casanoves, F.; Balzarini, M.G.; Gonzalez, L.; Tablada, M.; Robledo, C.W. InfoStat, version 2020. InfoStat Group, FCA, National University of Córdoba: Córdoba, Argentina, 2020. Available online: https://www.infostat.com.ar (accessed on 29 October 2024).
- Lee, M.; Xu, J.W.; Wang, W.Q.; Rajashekar, C.B. The effect of supplemental blue, red and rar-red light on the growth and the nutritional quality of red and green leaf lettuce. Am. J. Plant Sci. 2019, 10, 2219–2235. [Google Scholar] [CrossRef]
- Van Brenk, J.B.; Courbier, S.; Kleijweg, C.L.; Verdonk, J.C.; Marcelis, L.F.M. Paradise by the far-red light: Far-red and red:blue ratios independently affect yield, pigments, and carbohydrate production in lettuce, Lactuca sativa. Front. Plant Sci. 2024, 15, 1383100. [Google Scholar]
- Zou, J.; Zhang, Y.; Zhang, Y.; Bian, Z.; Fanourakis, D.; Yang, Q.; Li, T. Morphological and physiological properties of indoor cultivated lettuce in response to additional far-red light. Sci. Hortic. 2019, 257, 108725. [Google Scholar] [CrossRef]
- Tan, T.; Li, S.; Fan, Y.; Wang, Z.; Raza, M.A.; Shafiq, I.; Wang, B.; Wu, X.; Yong, T.; Wang, X.; et al. Far-red light: A regulator of plant morphology and photosynthetic capacity. Crop J. 2022, 10, 300–309. [Google Scholar] [CrossRef]
- Orlando, M.; Trivellini, A.; Incrocci, L.; Ferrante, A.; Mensuali, A. The inclusion of green light in a red and blue light background impact the growth and functional quality of vegetable and flower microgreen species. Horticulturae 2022, 8, 217. [Google Scholar] [CrossRef]
- Ghorbanzadeh, P.; Aliniaeifard, S.; Esmaeili, M.; Mashal, M.; Azadegan, B.; Seifet, M. Dependency of growth, water use efficiency, chlorophyll fluorescence, and stomatal characteristics of lettuce plants to light intensity. J. Plant Growth. Regul. 2021, 40, 2191–2207. [Google Scholar] [CrossRef]
- Jin, W.; Ji, Y.; Larsen, D.H.; Huang, Y.; Heuvelink, E.; Marcelis, L.F.M. Gradually increasing light intensity during the growth period increases dry weight production compared to constant or gradually decreasing light intensity in lettuce. Sci. Hortic. 2023, 311, 111807. [Google Scholar] [CrossRef]
- Wimalasekera, R. Effect of light intensity on photosynthesis. In Photosynthesis, Productivity and Environmental Stres; Ahmad, P., Ahanger, M.A., Alyemeni, M.N., Alam, P., Eds.; Wiley: Hoboken, NJ, USA, 2019; pp. 65–73. [Google Scholar]
- Niu, G. Ligh. In Plant Factory: An Indoor Vertical Farming System for Efficient Quality Food Production, 2nd ed.; Kozai, T., Niu, N., Takagaki, M., Eds.; Academic Press Ltd.: Cambridge, MA, USA, 2020; pp. 115–128. [Google Scholar]
- Brouwer, R. Nutritive influences on the distribution of dry matter in the plant. Neth. J. Agric. Sei. 1962, 10, 399–408. [Google Scholar] [CrossRef]
- Chen, J.-J.; Zhen, S.; Sun, Y. Estimating leaf chlorophyll content of buffaloberry using normalized difference vegetation index sensors. HortTechnology 2021, 31, 297–303. [Google Scholar] [CrossRef]
- Alsiņa, I.; Dūma, M.; Dubova, L.; Šenberga, A.; Daģis, S. Comparison of different chlorophylls determination methods for leafy vegetables. Agron. Res. 2016, 14, 309–316. [Google Scholar]
- Zhou, J.; Li, P.; Wang, J. Effects of light intensity and temperature on the photosynthesis characteristics and yield of lettuce. Horticulturae 2022, 8, 178. [Google Scholar] [CrossRef]
- Pennisi, G.; Pistillo, A.; Orsini, F.; Cellini, A.; Spinelli, F.; Nicola, S.; Fernandez, J.A.; Crepaldi, A.; Gianquinto, G.; Marcelis, L.F.M. Optimal light intensity for sustainable water and energy use in indoor cultivation of lettuce and basil under red and blue LEDs. Sci. Hortic. 2020, 272, 109508. [Google Scholar] [CrossRef]
- Huo, J.; Zhang, N.; Gong, Y.; Bao, Y.; Li, Y.; Zhang, L.; Nie, S. Effects of different light intensity on leaf color changes in a Chinese cabbage yellow cotyledon mutant. Front. Plant Sci. 2024, 15, 1371451. [Google Scholar] [CrossRef]
- Hoppu, U.; Puputti, S.; Sandell, M. Factors related to sensory properties and consumer acceptance of vegetables. Crit. Rev. Food Sci. Nutr. 2021, 61, 1751–1761. [Google Scholar] [CrossRef]
- Carotti, L.; Pistillo, A.; Zauli, I.; Pennisi, G.; Martin, M.; Gianquinto, G.; Orsini, F. Far-red radiation management for lettuce growth: Physiological and morphological features leading to energy optimization in vertical farming. Sci. Hortic. 2024, 334, 113264. [Google Scholar] [CrossRef]
- Meng, Q.; Kelly, N.; Runkle, E.S. Substituting green or far-red radiation for blue radiation induces shade avoidance and promotes growth in lettuce and kale. Environ. Exp. Bot. 2019, 162, 383–391. [Google Scholar] [CrossRef]
- Meng, Q.; Runkle, E.S. Far-red radiation interacts with relative and absolute blue and red photon flux densities to regulate growth, morphology, and pigmentation of lettuce and basil seedlings. Sci. Hortic. 2019, 255, 269–280. [Google Scholar] [CrossRef]
- Hameed, M.K.; Umar, W.; Razzaq, A.; Wei, S.; Niu, Q.; Huang, D.; Chang, L. Quantification of total polyphenols, antioxidants, anthocyanins and secondary metabolites by UPLC VION IMS QTOF MS/MS analysis in green and red lettuce cultivars. Sci. Hortic. 2023, 315, 111994. [Google Scholar] [CrossRef]
- Materska, M.; Olszówka, K.; Chilczuk, B.; Stochmal, A.; Pecio, Ł.; Pacholczyk-Sienicka, B.; Piacente, S.; Pizza, C.; Masullo, M. Polyphenolic profiles in lettuce (Lactuca sativa L.) after CaCl2 treatment and cold storage. Eur. Food Res. Technol. 2019, 245, 733–744. [Google Scholar] [CrossRef]
- Yang, X.; Gil, M.I.; Yang, Q.; Tomás-Barberán, F.A. Bioactive compounds in lettuce: Highlighting the benefits to human health and impacts of preharvest and postharvest practices. Compr. Rev. Food Sci. Food Saf. 2021, 21, 4–45. [Google Scholar] [CrossRef]
- Chen, R.; Wang, Z.; Liu, W.; Ding, Y.; Zhang, Q.; Wang, S. Side lighting of red, blue and green spectral combinations altered the growth, yield and quality of lettuce (Lactuca sativa L. cv. “Yidali”) in plant factory. Plants 2023, 12, 4147. [Google Scholar] [CrossRef]
- Lee, M.-J.; Son, J.E.; Oh, M.-M. Growth and phenolic compounds of Lactuca sativa L. grown in a closed-type plant production system with UV-A, -B, or -C lamp. J. Sci. Food Agric. 2014, 94, 197–204. [Google Scholar] [CrossRef]
- Kitazaki, K.; Fukushima, A.; Nakabayashi, R.; Okazaki, Y.; Kobayashi, M.; Mori, T.; Nishizawa, T.; Reyes-Chin-Wo, S.; Michelmore, R.W.; Saito, K.; et al. Metabolic reprogramming in leaf lettuce grown under different light quality and intensity conditions using narrow-band LEDs. Sci. Rep. 2018, 8, 7914. [Google Scholar] [CrossRef]
- Naznin, M.T.; Lefsrud, M.; Gravel, V.; Azad, M.O.K. Blue light added with red LEDs enhance growth characteristics, pigments content, and antioxidant capacity in lettuce, spinach, kale, basil, and sweet pepper in a controlled environment. Plants 2019, 8, 93. [Google Scholar] [CrossRef]
- Soufi, H.R.; Roosta, H.R.; Stępień, P.; Malekzadeh, K.; Hamidpour, M. Manipulation of light spectrum is an efective tool to regulate biochemical traits and gene expression in lettuce under diferent replacement methods of nutrient solution. Sci. Rep. 2023, 13, 8600. [Google Scholar] [CrossRef]
- Karami, A.; Ansari, N.A.; Hasibi, P. Evaluation of some chemical/biochemical compounds of leaf lettuce (Lactuca sativa L.) to the quality of radiant light in floating system. Sci. Hortic. 2022, 304, 111319. [Google Scholar] [CrossRef]
- Ouzounis, T.; Parjikolaei, B.R.; Fretté, X.; Rosenqvist, E.; Ottosen, C.-O. Predawn and high intensity application of supplemental blue light decreases the quantum yield of PSII and enhances the amount of phenolic acids, flavonoids, and pigments in Lactuca sativa. Front. Plant Sci. 2015, 6, 1–14. [Google Scholar] [CrossRef] [PubMed]
- Koh, M.X.; Singh, A. Effects of LED treatments on the growth and nutritional content of lettuce (Lactuca sativa) in a hydroponic vertical farming system. Mal. J. Nutr. 2024, 30, 257–270. [Google Scholar] [CrossRef]
- Gerhardt, K.E.; Lampi, M.A.; Greenberg, B.M. The effects of far-red light on plant growth and flavonoid accumulation in Brassica napus in the presence of ultraviolet B radiation. J. Photochem. Photobiol. 2008, 84, 1445–1454. [Google Scholar] [CrossRef]
- Vrábl, D.; Nezval, J.; Pech, R.; Volná, A.; Mašková, P.; Pleva, J.; Kuzniciusová, N.; Provazová, M.; Štroch, M.; Špunda, V. Light drives and temperature modulates: Variation of phenolic compounds profile in relation to photosynthesis in spring barley. Int. J. Mol. Sci. 2023, 24, 2427. [Google Scholar] [CrossRef]
Disclaimer/Publisher’s Note: The statements, opinions and data contained in all publications are solely those of the individual author(s) and contributor(s) and not of MDPI and/or the editor(s). MDPI and/or the editor(s) disclaim responsibility for any injury to people or property resulting from any ideas, methods, instructions or products referred to in the content. |
© 2025 by the authors. Licensee MDPI, Basel, Switzerland. This article is an open access article distributed under the terms and conditions of the Creative Commons Attribution (CC BY) license (https://creativecommons.org/licenses/by/4.0/).