Article

Differential Metabolite Analysis of Anthocyanins in Variously Colored Petal Types During Different Developmental Stages of Sophora japonica L.

1
Key Laboratory of National Forestry and Grassland Administration on Conservation and Utilization of Warm Temperate Zone Forest and Grass Germplasm Resources, Shandong Provincial Center of Forest and Grass Germplasm Resources, Jinan 250102, China
2
College of Forestry, Shandong Agricultural University, Tai’an 271018, China
3
Shanxian County Forestry Protection and Development Service Center, Heze 274300, China
4
College of Agriculture and Biology, Liaocheng University, Liaocheng 252000, China
*
Author to whom correspondence should be addressed.
These authors contributed equally to this work.
Horticulturae 2025, 11(2), 143; https://doi.org/10.3390/horticulturae11020143
Submission received: 16 December 2024 / Revised: 19 January 2025 / Accepted: 24 January 2025 / Published: 29 January 2025
(This article belongs to the Special Issue Color Formation and Regulation in Horticultural Plants)

Abstract

:
Flower color serves as a vital ornamental feature of landscape plants; Sophora japonica L. mutant ‘AM’ exhibits the different colors from the common S. japonica. ‘AM’, presenting with a light purple-red wing and keel and yellowish-white flag petals, while common S. japonica is yellow and white. The metabolites contributing to this color specificity in red-flowered S. japonica ‘AM’ are not yet fully understood. In this study, the flag, wing, and keel petals were collected from ‘AM’ at various phases, including the flower bud phase, initial flowering phase, full bloom phase, and final flowering phase, for conducting the metabolic assays targeting anthocyanins. Subsequently, we identified 45 anthocyanin-related metabolites, including nine flavonoids and 36 anthocyanins. Ten major floral chromoside metabolites were found to affect the coloration differences among the petals, where the most abundant anthocyanin was cyanidin-3-O-glucoside (Cy3G), which was much higher in the keel petal (LGB) and wing petal (YB) than in the flag petal (QB), and similarly, during the four periods of different petal types, the Cy3G content was higher in the initial flowering stage (S2), the full bloom stage (S3), and the final flowering stage (S4) than the flower bud stage (S1), which was in accordance with the trend of the observed petal floral color phenotypic difference measurement correlation. This suggested that the Cy3G accumulation was the primary factor driving the distinct coloration of varying types of petals. These findings could contribute to the understanding of the biochemical mechanisms underlying S. japonica petal coloration and may support future efforts in flower color improvement.

1. Introduction

Sophora japonica L., native to China and widely distributed throughout the north and south in China, holds significant economic value for its ornamental, timber, and medicinal uses, making it a popular choice for street and garden trees in gardening and landscaping [1,2]. Moreover, S. japonica provides essential ecological benefits, such as enhancing the microclimate, modulating the temperature and humidity of cultivated areas, and demonstrating resistance to cold, saline, and alkaline conditions [3]. It also plays a crucial role in air quality improvement by absorbing harmful gases [4].
Flower color is a key trait that determines the ornamental value of landscape plants and serves as one of the most adaptive phenotypic traits in plant evolution [5]. Therefore, improving flower color is a significant goal in plant breeding. The pigments influencing plant coloration primarily include flavonoids, carotenoids, and alkaloids, with flavonoids [6], particularly anthocyanins and anthochlor, being the main contributors to flower color formation. The variations in flower color are largely caused by the differences in the concentration and type of anthocyanins. It also contributes to the coloration in petals of primrose (Primula malacoides) [7], chrysanthemum (Chrysanthemum morifolium Ramat.) [8], camellia (Camellia japonica L.) [9], kalanchoe lily (Gloriosa superba L.) [10], and petunia (Petunia hybrida) [11]. Anthocyanins can enhance the petal coloration for attracting pollinators and improve the resistance to abiotic challenges [12]. Additionally, research has indicated that anthocyanins can help prevent chronic diseases, cardiovascular diseases, and cancer [13].
Metabolomics captures the changes in all metabolite species and their quantities in response to genetic, physiological, and environmental alterations, providing insight into gene and protein changes from the perspective of small-molecule compounds. As an omics technology, it directly reflects the phenotypes of organisms [14]. The common metabolomics techniques include gas chromatography–mass spectrometry (GC-MS), capillary electrophoresis–mass spectrometry (CE-MS), liquid chromatography–mass spectrometry (LC-MS), and nuclear magnetic resonance (NMR) [15,16,17,18]. Previous studies have shown that the application of metabolomics in anthocyanin biosynthesis studies has produced beneficial results. For instance, Yue et al. [19] used GC-MS to study the changes in petal volatile metabolites during the flowering process of the spider lily (Lycoris radiata Herb.), while Zhao et al. [20] utilized the targeted metabolomics to explore differential metabolites and regulatory networks involved in flower color formation in sunflowers (Helianthus annuus L.) with different petal colors. Compared with other analytical techniques, ultra-performance liquid chromatography–tandem mass spectrometry (UPLC-MS/MS) has the advantages of ultra resolution, ultra speed, and ultra sensitivity. UPLC-MS/MS can effectively reduce matrix interference in complex samples and improve the accuracy of detection and work efficiency, providing powerful technical support for the rapid multi-component analysis of plants [21,22]. Sobeh et al. [23] analyzed the content and biological activity of anthocyanins and flavonols in red cabbage (Brassica oleracea L. var. capitata f. rubra DC.) at high precision using UPLC-MS/MS technology.
This study utilized UPLC-MS/MS for analyzing the anthocyanin-related metabolites in petals from various petal types at different stages of flower development in ‘AM’, the mutated flower color variant of S. japonica with yellow-white flag petals and light purple-red wing and keel petals; common S. japonica is yellow and white. The main objective was to explore the variation patterns and content differences of anthocyanin components across these petal types and stages, thereby laying a foundation for future research on the biological functions of anthocyanins in S. japonica.

2. Materials and Methods

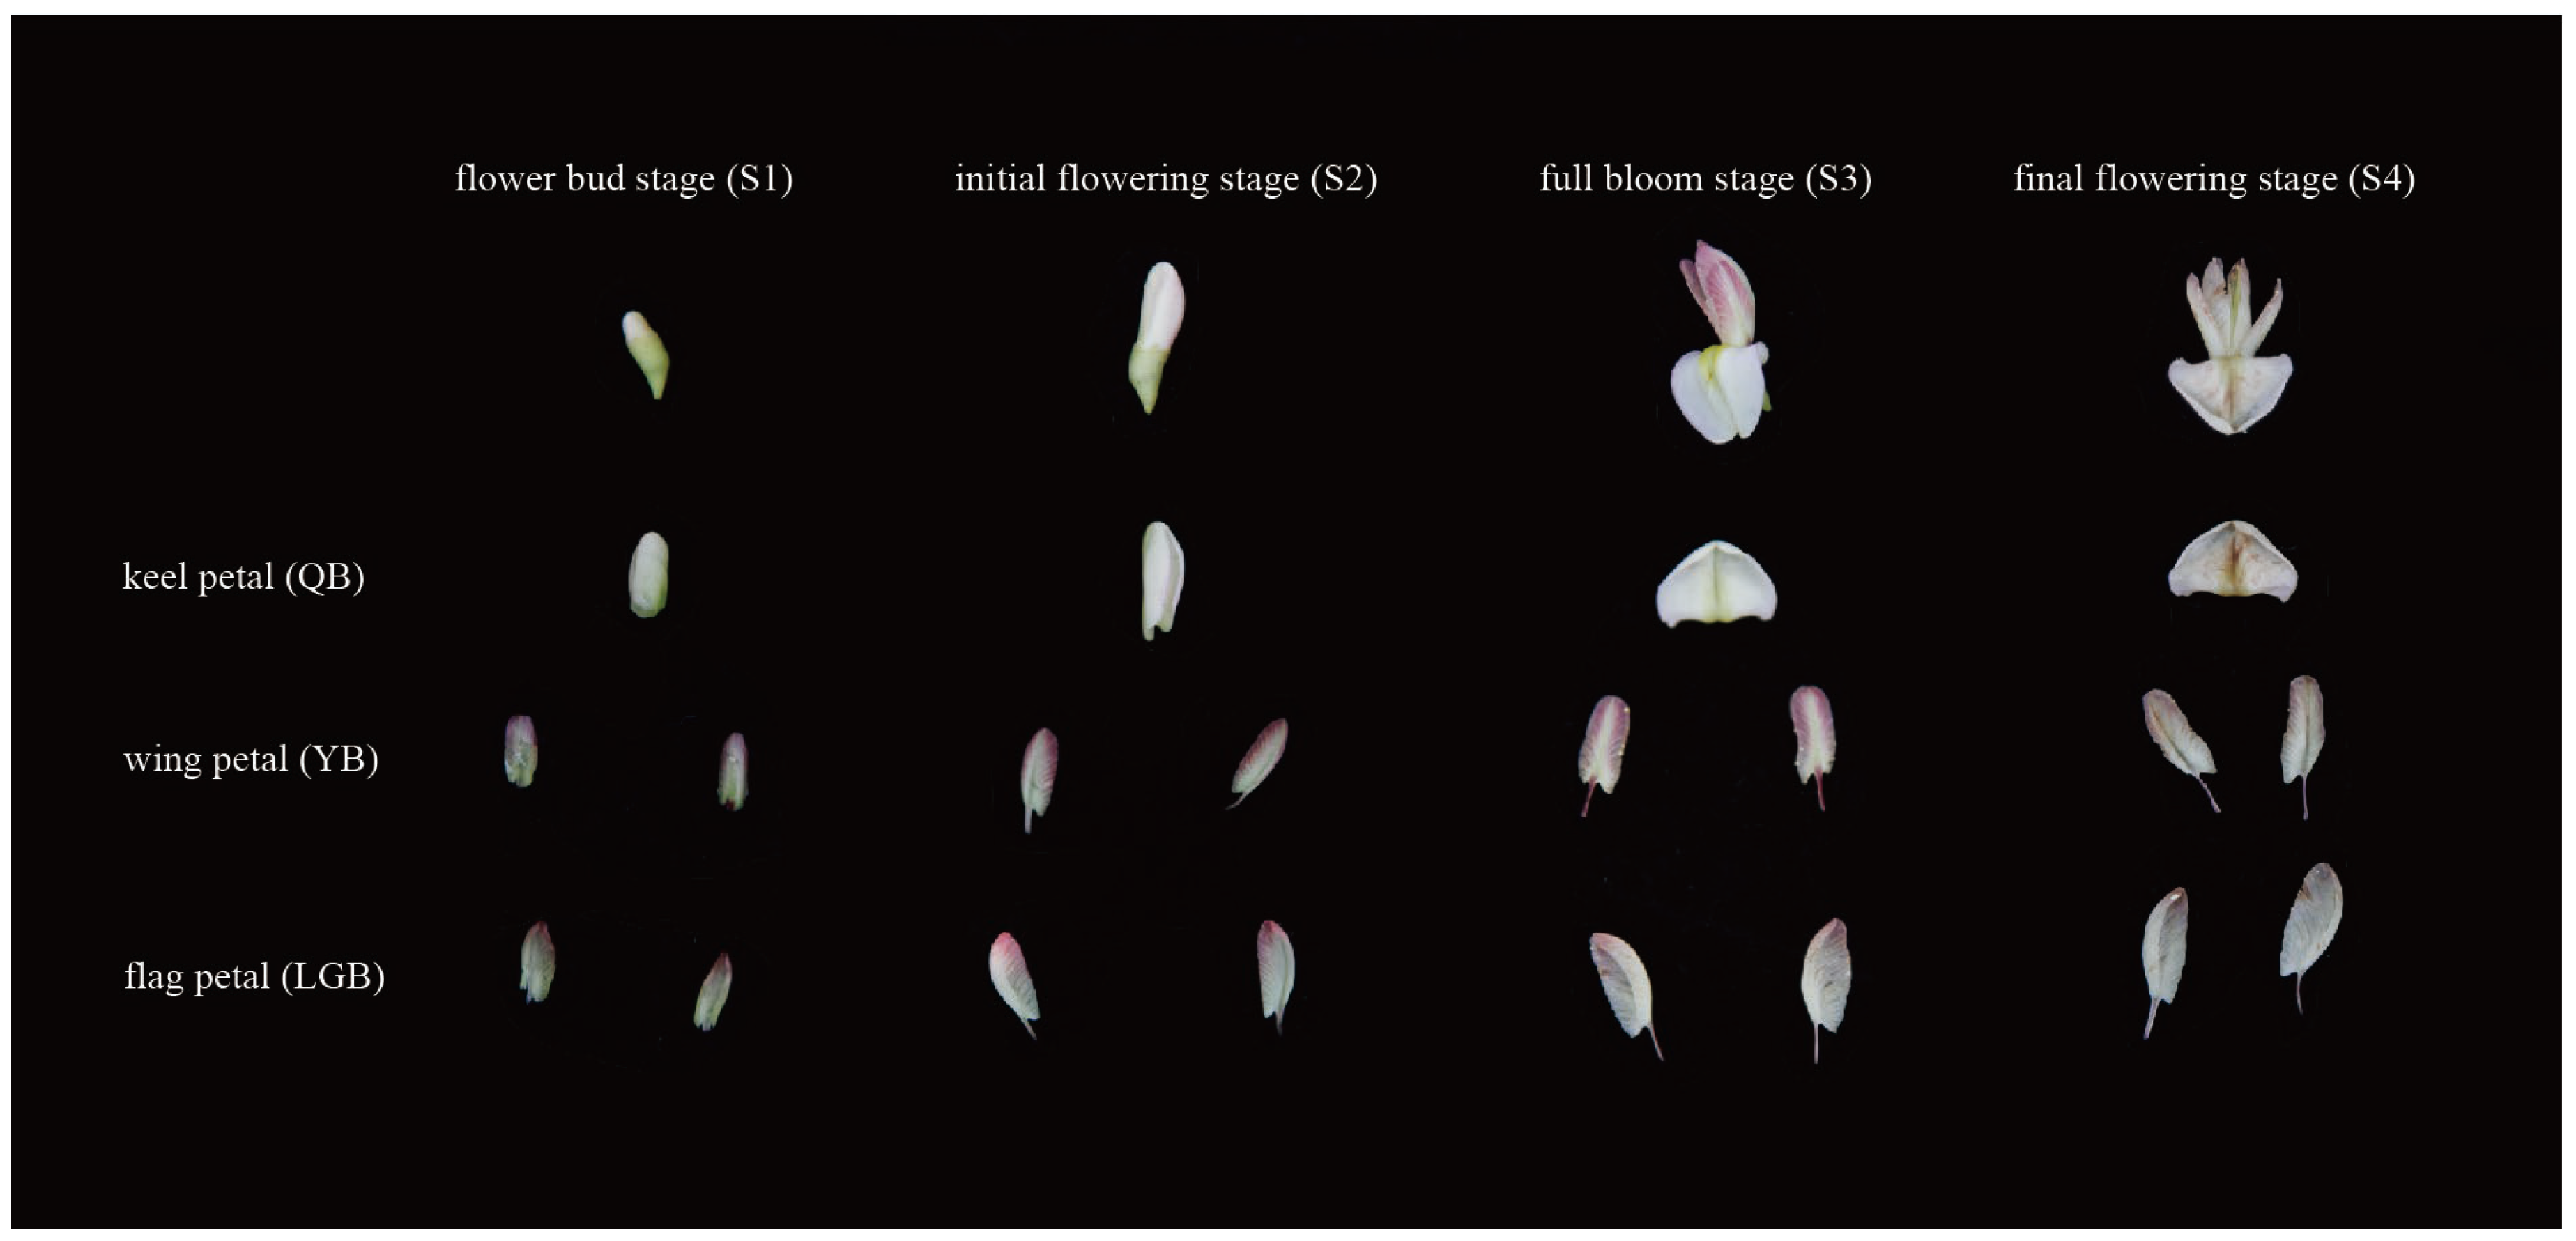
2.1. Growth Conditions and Plant Materials

The flower color mutant S. japonica ‘AM’ (light purplish-red wing and keel petals, and yellow-white flag petals) was fostered at the Zaoyuan Conservation Bank (36°45.3′ N, 117°27′ E), part of the National Forest Germplasm Resource Bank for Rare and Endangered Tree Species of the Warm Temperate Zone, managed by the Shandong Provincial Center of Forest and Grass Germplasm Resources Center in China. The petals from ‘AM’ were collected between 5 July and 20 July 2022, across four phases of flower development: the flower bud stage (S1, 4 d after whitening), the initial flowering stage (S2, flag petal slightly spreading), the full bloom stage (S3, 3 d after petals fully spread), and the final flowering stage (S4, flag petal decaying and wing petal tip slightly yellowing). At each phase, three types of petals were collected, including keel petals (LGB), wing petals (YB), and flag petals (QB), resulting in a total of 12 materials, with 3 biological replicates of each material, amounting to 36 samples (Figure 1).

2.2. Measurement of Petal Color Difference Values

The color variance values, including L* (the brightness value), a* (the redness and greenness), and b* (the yellow-blue degree), across the four phases (S1, S2, S3, and S4) of flower development were measured using a handheld colorimeter (WR-18, FRU, Shenzhen, China) [24]. For each petal type (QB, YB, and LGB), three points were randomly selected, and the measurements were repeated three times during each developmental stage.

2.3. Extraction of S. japonica ‘AM’ Anthocyanin Metabolite

All the types of the sample petals were ground into powder using a Frozen Mixing Ball Mill (MM400, Retsch, Arzberg, Germany). The samples were vortexed for 5 min in a mixture of 50% aqueous methanol having 0.1% hydrochloric acid at a 10:1 liquid-to-powder ratio and then subjected to 5 min sonication within an ultrasonic cleaning device. The supernatant was collected after 3 min centrifugation at 12,000 rpm at 4 °C. After one repetition of the process, the two supernatants were combined and subjected to a 0.22 μm microporous membrane filtering. The filtered samples were then placed in an injection bottle for analysis. The specific workflow of the UPLC-MS/MS system was conducted according to the methods outlined by Yuan et al. [25].

2.4. Conditions of UPLC-MS/MS Analysis

The system of data acquisitions primarily consisted of tandem mass spectrometry (MS/MS) (QTRAP® 6500+, SCIEX, Ma, USA) and ultra-performance liquid chromatography (UPLC) (ExionLC™ AD, SCIEX, Ma, USA).
The liquid phase included the following conditions: The column used was ACQUITY BEH C18 (1.7 µm, 2.1 mm × 100 mm), with ultrapure water (containing 0.1% formic acid) and methanol (containing 0.1% formic acid) as mobile phases A and B, respectively. The elution gradient was set with 5% B-phase initialization, increased to 50%, and peaked at 95% at 0.00 min, 6.00 min, and 12.00 min, respectively. Subsequently, it was subjected to 2 min holding at 95%, decreasing to 5% at 14.00 min, and 2 min equilibrating. The attributes of flow rate, column temperature, and injection volume were 0.35 mL/min, 40 °C, and 2 μL, respectively.
The mass spectrometry included the following conditions, including the initialization of electrospray ionization source (ESI) temperature at 550 °C, the mass spectral voltage in positive ion mode at 5500 V, and the air curtain pressure of 35 psi: using QTRAP® 6500+, the collision energy (CE) and scanning declustering potential (DP) were optimized for the ion-pair detection.

2.5. Quantitative and Qualitative Metabolite Analysis

The mass spectrometry data were subjected to the qualitative analysis utilizing the Metware Database (MWDB) based on the standards. The data were quantitatively analyzed using the Multiple Reaction Monitoring (MRM) mode of triple quadrupole mass spectrometry. Furthermore, the mass spectrometry data were processed by applying Analyst 1.6.3 and MultiQuant 3.0.3 software for the integral correction for chromatographic peaks across different samples and the assessment of the relative metabolite content based on the peak areas of mass spectrometry. For specific qualitative and quantitative analysis of experimental samples and the screening of differential metabolites between samples, refer to Chen et al. [26].

2.6. Data Analysis

The analysis of the measured color difference values was conducted to identify the flower color phenotypic differences using SPSS 27.0, with the mean value used as the color difference value for each petal type at each flower development stage.
The metabolites of different petal types with varying flower colors of ‘AM’ at four flower development phases were compared and recorded as S1QB vs. S1YB, S1QB vs. S1LGB; S2QB vs. S2YB, S2QB vs. S2LGB; S3QB vs. S3YB, S3QB vs. S3LGB; S4QB vs. S4YB; and S4QB vs. S4LGB. Annotation and categorization of DAM was carried out using the KEGG database [27]. The metabolic data were subjected to orthogonal partial least squares discriminant analysis (OPLS-DA), hierarchical cluster analysis (HCA), and principal component analysis (PCA) using the OPLSR.Anal function of the MetaboAnalystR package of the R software program (version 4.3.3) in order to address the differences in metabolite species and content between different colored petals [28]. Heatmaps were generated, and clustering analysis was performed using the ComplexHeatmap package (2.8.0) in R and TB tools (version 2.056). The differential metabolites were initially screened according to the Variable Importance in Projection (VIP) utilizing the multivariate analysis model and were further subjected to the screening by the univariate analysis p-values and fold change values. The criteria for differential metabolites were p-value < 0.05 and VIP ≥ 2, with fold change ≤0.5 or ≥2.

3. Results

3.1. Analysis of Floral Color Phenotypic Differences

The measured color difference values for different flower development stages and petal types (Table 1) indicate that in the four stages of the three petal types, the brightness value (L*) and yellowish-blue value (b*) of QB are significantly higher than those of YB and LGB, while the redness and greenness values (a*) are negative and significantly lower than those of the other two petal types. The degree of redness increased with the a* value in QB, LGB, and YB, showing significant differences. In the measurement of L* across the four stages of the three petal types, significant differences are observed between the four stages of YB and LGB, while QB shows extremely significant differences only between stages S1 and S3 (Figure S1A). For the a* measured across the four stages, it is found that the differences in a* between the stages of QB are not significant (Figure S1B), while the yellow-blue value (b*) shows extremely significant differences across the four stages (Figure S1C). Differential metabolite analyses were further conducted on all the types at four flower developmental stages of red-flowered S. japonica ‘AM’ based on the phenotypic differences in petal floral color.

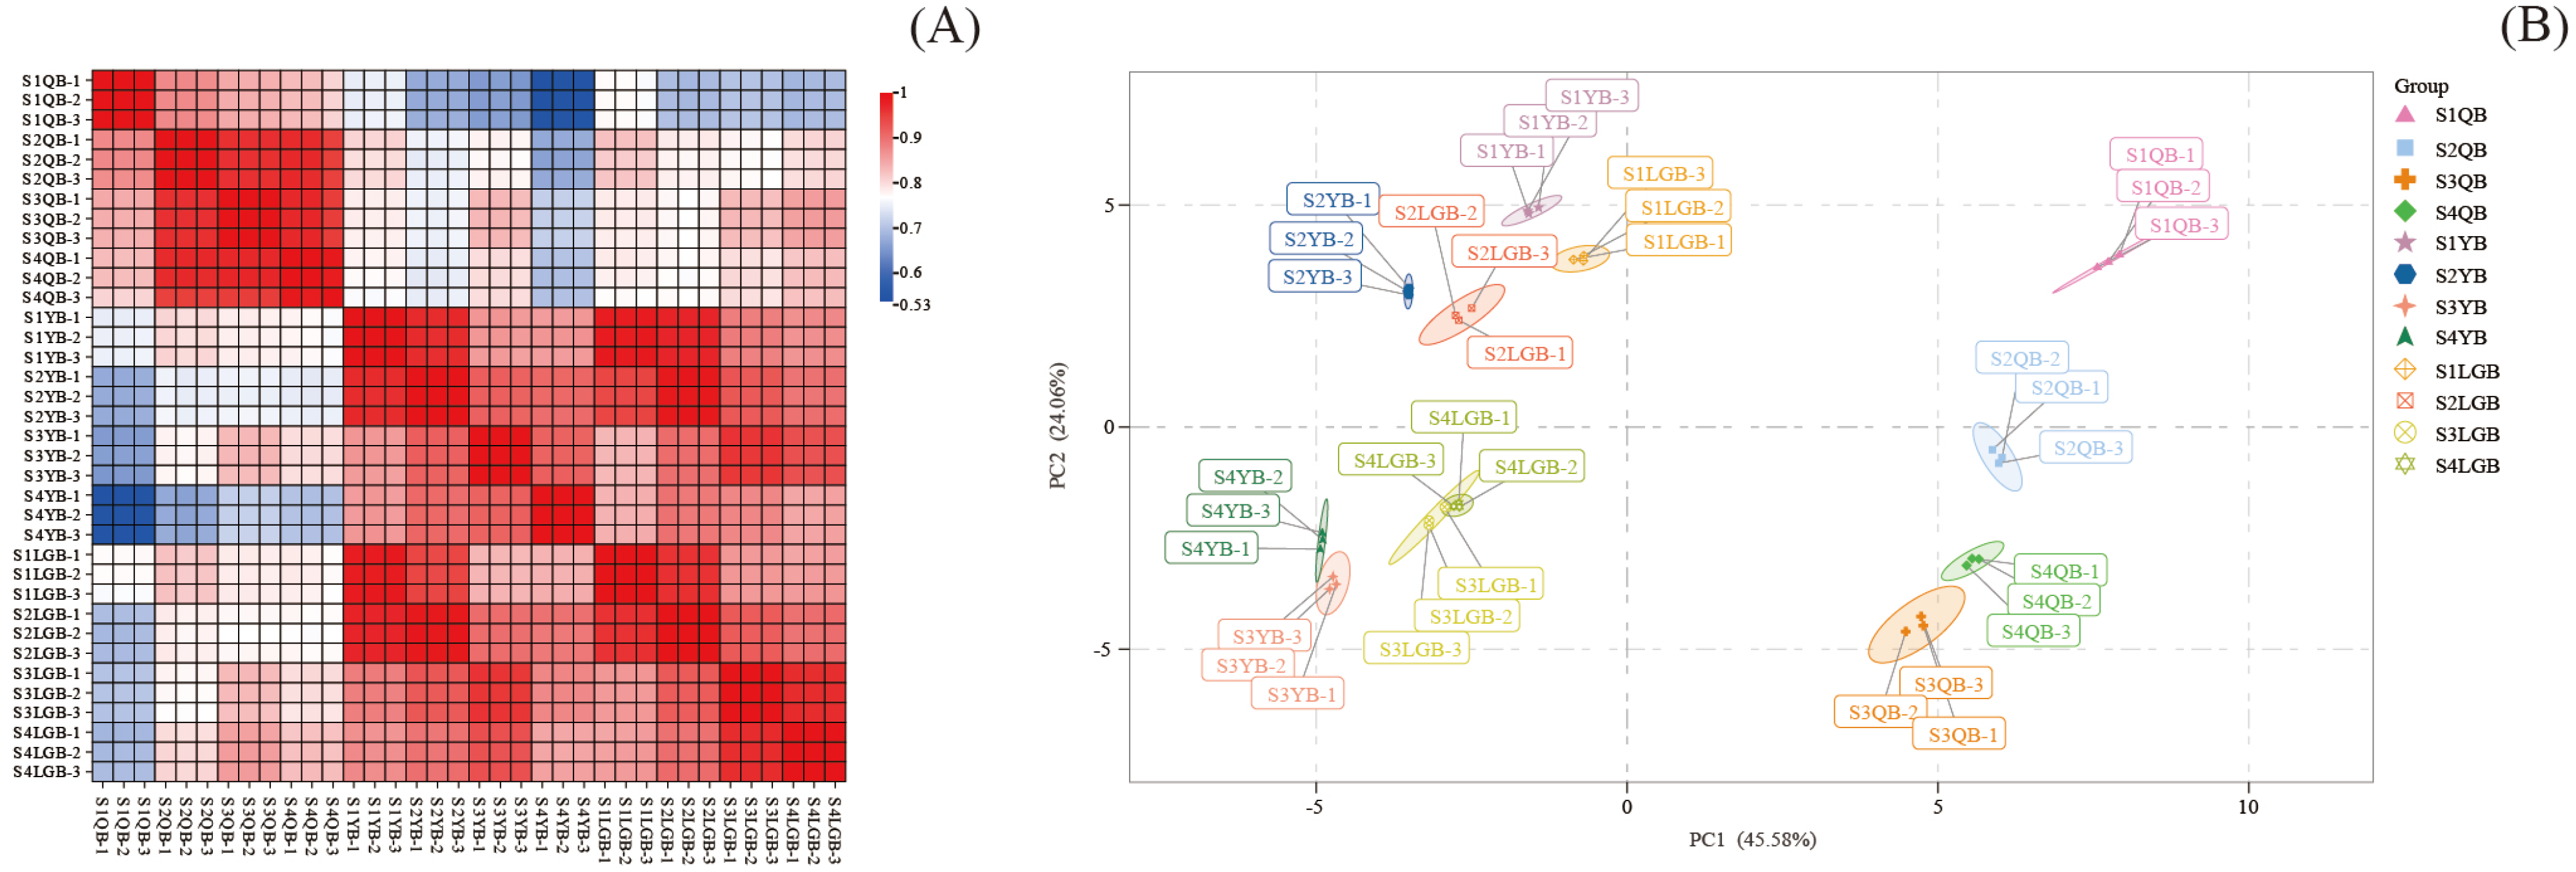
3.2. Analysis of Sample Quality Control

The analysis using Pearson’s coefficient (r) revealed the strongest correlations are found among the three replicates of each sample. The correlations among the four periods of QB, YB, and LGB are stronger than those between YB and LGB, with the correlation between these two petal types significantly exceeding that between QB and the four periods of YB and LGB. (Figure 2A).
PCA was conducted on the samples of all types at four flower development phases. The PCA model, with PC1 and PC2 as the x-axis and y-axis, respectively, demonstrated the contribution rates of 24.06% for PC1 and 45.58%for PC2. As illustrated in Figure 2B, the samples were clearly distinguishable from one another, including the differences among the types at the same phase and among the flowering periods of the same petal type. Furthermore, the distinctions between QB and both YB and LGB are particularly pronounced. This suggests that the types and contents of metabolites vary across different petal types and developmental stages of ‘AM’. Additionally, the small differences among the biological replicates of the same sample treatment suggest excellent reproducibility.

3.3. OPLS-DA

The OPLS-DA model was implemented for analyzing the metabolic data. Figure 3 illustrates that, using QB at each flower development phase of ‘AM’ as a control, the lateral distances between any two samples in the eight combinations of QB vs. YB and QB vs. LGB are substantial, positioned on different sides of the confidence interval, with R2X, R2Y, and Q2 values all exceeding 0.92 (Table S1). Conversely, the lateral distances between any two samples in the four combinations of YB vs. LGB are relatively smaller, with R2X values in these combinations ranging from 0.81 to 0.93. This collectively indicates significant differences in metabolites among different types of petals at the same development stage, with the differences between QB vs. YB and QB vs. LGB being significantly greater than those between YB vs. LGB. A p-value < 0.05 in the model validation confirmed its effectiveness and the reliability for subsequent differential metabolite screening.

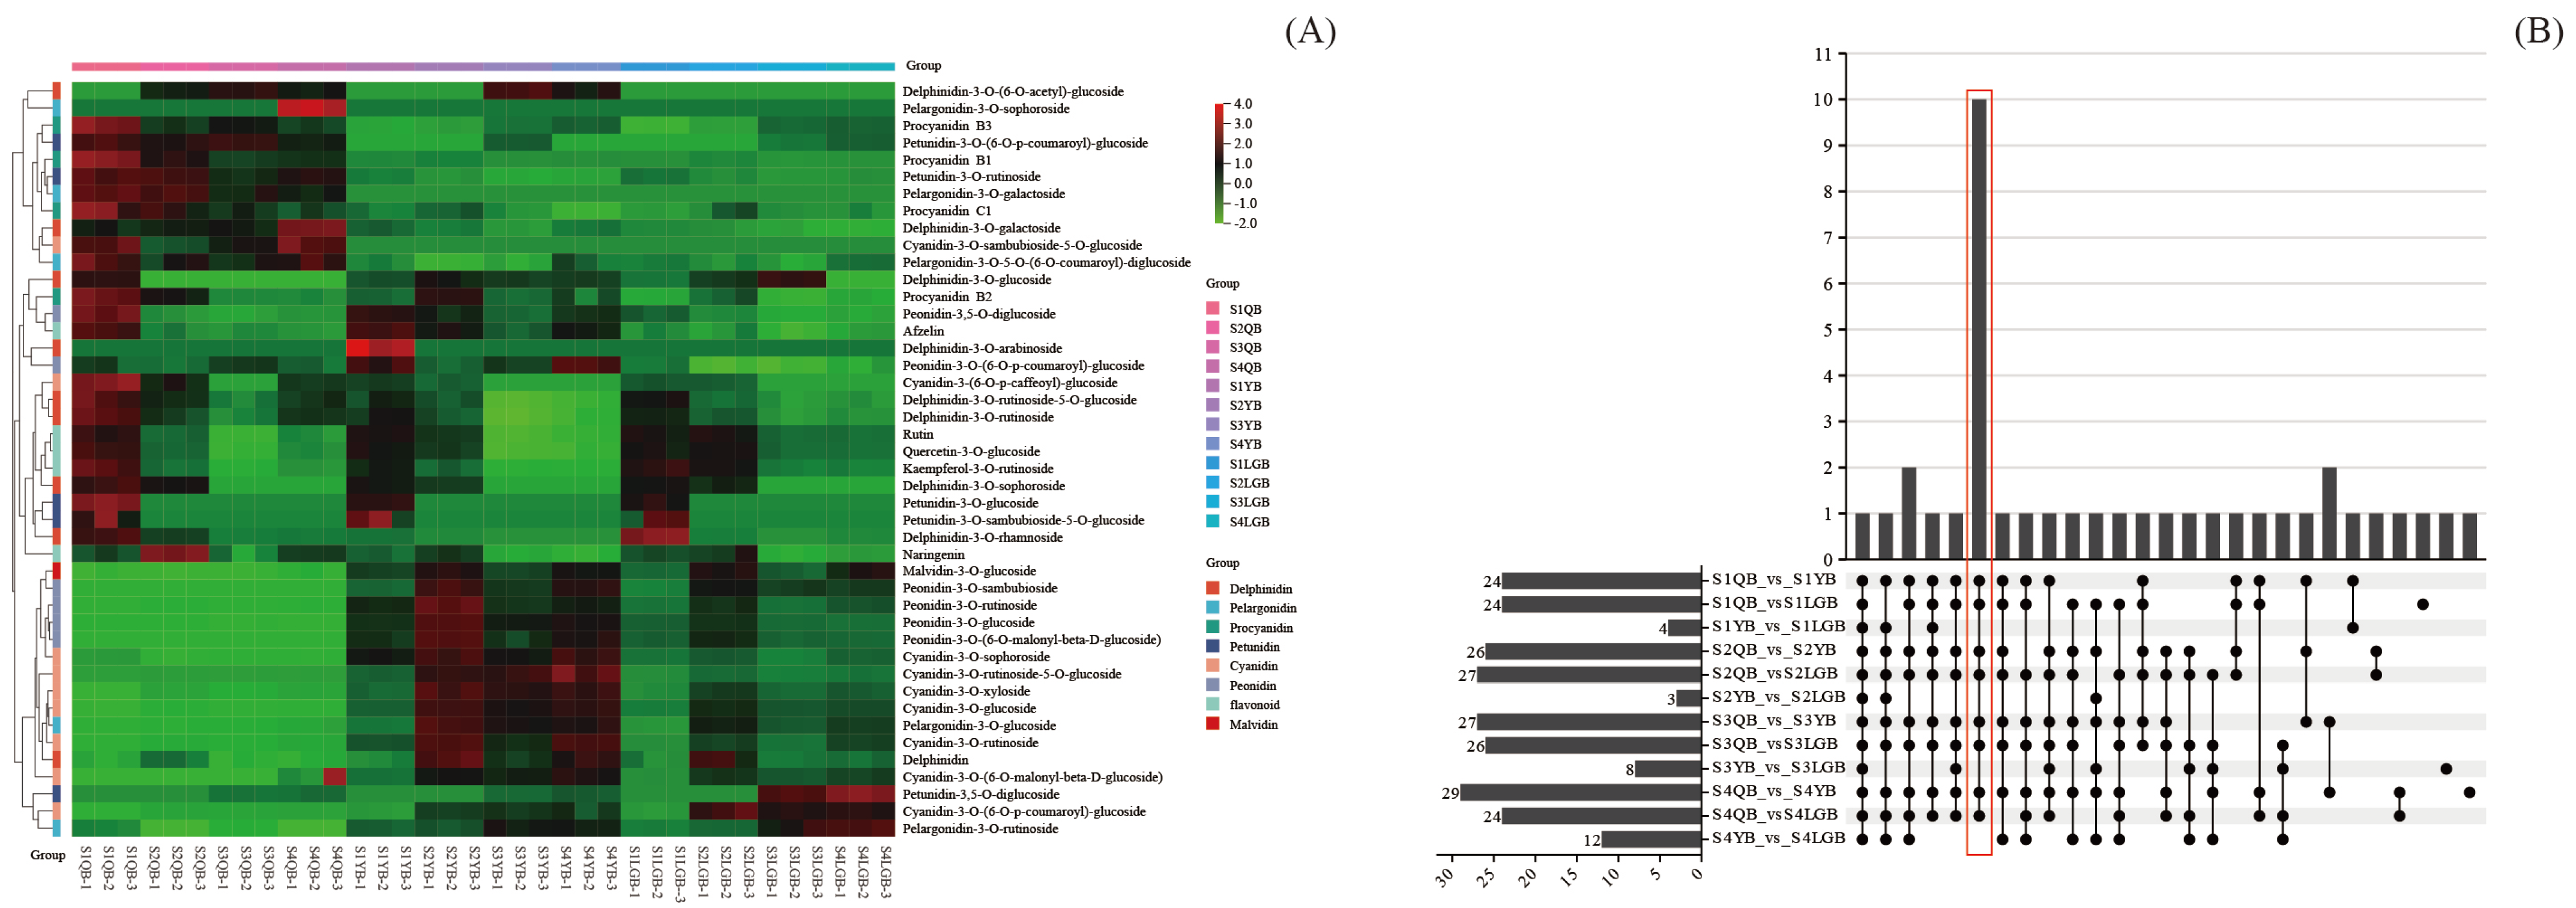
3.4. Cluster Analysis of Anthocyanin-like Metabolites

There were large differences in the total content of anthocyanin in the three petal types at the four flower development stages of S. japonica mutant ‘AM’ (Figure S2). Among them, YB had the highest content, followed by LGB, and QB had the lowest. The highest periods occurred in the initial flowering phase, followed by the final flowering phase and full bloom phase, and the lowest at the flower bud phase.
A targeted metabolomic analysis was performed across the four development stages of all petal types. Through comparative analysis with MWDB, 45 metabolites associated with flower anthocyanins were identified. Among these, cyanidin and delphinidin were the most abundant, each comprising nine compounds that accounted for 20% of the total. Peonidin represented 13.33%, comprising six specific compounds. The remaining metabolites, including pelargonidin, petunidin, procyanidin, and flavonoids, each contained only five compounds, representing 11.11%. Malvidin was identified as a single compound, malvidin-3-O-glucoside, which accounted for 2.22% (Table S2).
Analysis of 45 anthocyanin-related metabolites revealed that most compounds from peonidin and cyanidin, along with pelargonidin’s pelargonidin-3-O-glucoside, pelargonidin-3-O-rutinoside, as well as delphinidin, petunidin-3,5-O-diglucoside, and malvidin-3-O-glucoside, exhibited significantly higher concentrations in LGB and YB compared to QB. Conversely, compounds such as procyanidin B3, procyanidin B1, and procyanidin C1 from procyanidin, along with pelargonidin compounds like pelargonidin-3-O-galactoside, pelargonidin-3-O-sophoroside, pelargonidin-3-O-5-O-(6-O-coumaroyl)-diglucoside; delphinidin’s delphinidin-3-O-galactoside and delphinidin-3-O-(6-O-acetyl)-glucoside; as well as petunidin’s petunidin-3-O-(6-O-p-coumaroyl)-glucoside, petunidin-3-O-rutinoside, and cyanidin-3-O-sambubioside-5-O-glucoside were notably lower in concentration in LGB and YB compared to QB. Additionally, some metabolites showed similar trends across different stages in different petal types. Certain compounds were present at significantly higher levels during the S1 and S2 stages than during the S3 and S4 stages in all three petal types. The most notable of these were flavonoids, such as rutin, kaempferol-3-O-rutinoside, naringenin, and quercetin-3-O-glucoside. A similar pattern was observed for delphinidin compounds like delphinidin-3-O-rutinoside, delphinidin-3-O-rutinoside-5-O-glucoside, delphinidin-3-O-sophoroside, and delphinidin-3-O-rhamnoside. Furthermore, we observed that petunidin-3-O-glucoside and petunidin-3-O-sambubioside-5-O-glucoside in petunidin were significantly higher during the SI stage compared to the other three stages in all three petal types (Figure 4A).

3.5. Screening for Differential Metabolites

Through comparatively analyzing the different petal type combinations for different colors in red-flowered S. japonica ‘AM’, we examined the changes in metabolites related to anthocyanin biosynthesis across various flower developmental stages and petal types. Among the four phases, the amount of differential metabolites within one single type was minimal, without significant differences in the metabolites related to anthocyanin, demonstrating that the metabolites in a single type were relatively stable throughout the phases, maintaining the petal coloration owing to slower degradation. The analysis of the 12 combinations of all the types within a single phase showed that the metabolite composition differences between LGB and YB were minimal, whereas those between QB and YB, as well as between QB and LGB, were substantial (Table S3). Therefore, for subsequent analysis, we used QB as the control and compared the combinations of QB vs. LGB and QB vs. YB at all phases.
The results revealed that the highest number of differential metabolites, totaling 29 species, was found in S4QB vs. S4YB. The number of differential metabolites in QB vs. LGB and QB vs. YB was relatively high across all developmental phases, ranging from 24 to 29 species (Table S3). These numbers were significantly greater than those of the combinations within the single types at different phases, indicating that these metabolites are likely the primary contributors to the coloration differences among petal types in red-flowered S. japonica ‘AM’. Ultimately, we identified ten distinct metabolites that were consistently expressed in LGB and YB but differed from QB (Figure 4B). Among the selected ten metabolites, there are three types of cyanidin (cyanidin-3-O-glucoside, cyanidin-3-O-sambubioside-5-O-glucoside, and cyanidin-3-O-(6-O-p-coumaroyl)-glucoside), two types of pelargonidin (pelargonidin-3-O-glucoside and pelargonidin-3-O-galactoside) and peonidin (peonidin-3-O-rutinoside and peonidin-3-O-sambubioside), one type of malvidin (malvidin-3-O-glucoside) and petunidin (petunidin-3-O-rutinoside), as well as procyanidin B1 (Table S4).

3.6. Specific Analysis of Metabolites Affecting Petal Color in Different Types of S. japonica ‘AM’

We conducted a detailed analysis of ten selected metabolites that could affect the formation of red petals in S. japonica ‘AM’ LGB and YB. The results revealed that cyanidin-3-O-glucoside was significantly higher than the other nine substances across all petal types and stages (Figure S3). A more detailed analysis of these ten metabolites across various petal types and developmental stages indicated that the concentrations of cyanidin-3-O-sambubioside-5-O-glucoside, pelargonidin-3-O-galactoside, petunidin-3-O-rutinoside, and procyanidin B1 were greater in QB than in LGB and YB. Furthermore, cyanidin-3-O-sambubioside-5-O-glucoside and pelargonidin-3-O-galactoside were exclusive to QB, while the concentrations in LGB and YB were measured at 0. The remaining six differential metabolites exhibited significantly higher concentrations in LGB and YB than in QB, with peonidin-3-O-sambubioside being present solely in LGB and YB and not detected in QB (Figure 5, Table S5).

4. Discussion

In S. japonica ‘AM’, the coloration of QB differed from that of YB and LGB, with QB being yellowish-white, and YB and LGB exhibiting light purplish-red hues. The metabolomic analysis offers insights into the molecular biology of plant organ and tissue coloration, thereby providing a scientific foundation for the novel application of S. japonica germplasm resources.
Anthocyanin, as a crucial secondary metabolite in plant growth, participates in various biochemical and physiological processes. Meanwhile, as a key water-soluble pigment, the type and content as well as the specific expression or uneven distribution of anthocyanin are important factors contributing to the various coloration of plant organs in nature. For example, the coloration in leaves of kale (Brassica oleracea L.) [29,30], petals like camellia (Camellia japonica L.) [9], and fruits of blueberry (Vaccinium spp.) [31]. Many studies found a positive correlation between anthocyanin content and depth of color in petals. The total anthocyanin content of petals in the darker color family is eight times higher than that of light-colored petals in hyacinth (Hyacinthus orientalis L.) [32]. The total anthocyanin content of petals in light purplish-red freesia (Freesia hybrida Klatt.) varieties is only 24% of the red [33]. Similarly, the total anthocyanin content in YB and LGB, which were light purplish-red, was significantly higher than that in QB, which was yellowish-white, in S. japonica mutant ‘AM’ in this study. The qualitative and quantitative determination of petal coloring characteristics and coloring substances provides important technical support for the mining of plant germplasm resources and flower color breeding.
Anthocyanins are classified into six categories, including cyanidin, pelargonidin, delphinidin, peonidin, petunidin, and malvidin, each affecting plant coloration differently [31,34]. Cyanidin typically can exhibit a red-pink appearance; peonidin, petunidin, and malvidin can exhibit a purple-red to blue-violet appearance; delphinidin can exhibit a blue to blue-violet appearance; and pelargonidin can exhibit an orange-red to brick-red appearance. Additionally, pH, ambient temperature, and UVB light in vesicles can also be the factors influencing anthocyanin coloration [35,36,37].
In order to reveal the differences in coloration of different petal types in S. japonica ‘AM’, the CIE Lab color system was introduced into the material basis of petal coloration in this study, which is conducive to the enrichment of metabolomic data research methods. The anthocyanin content affects the petal color difference value, which in turn affects the petal color. In this study, the redness and greenness values (a*) of YB and LGB were significantly higher than those of QB. Simultaneous measurement of metabolite contents revealed that the contents of cyanidin and peonidin in YB and LGB were also significantly higher, but procyanidin and pelargonidin were significantly lower than those of QB. It was tentatively inferred that the contents of these anthocyanins may affect the a*. Zan et al. [5] found that cyanidin content significantly affects the a*, which can make the petals of roses (Rosa rugosa Thunb.) appear reddish. Further, the total content of cyanidin and peonidin determines the color intensity of the petals, and the ratio of the two determines the hue of the petal color [28]. Cyanidin was found to be strongly correlated with a* in red-flowered strawberry petals and played a key role in red formation [38]. In ‘AM’, QB had significantly higher brightness value (L*) than YB and LGB, and it had the lowest anthocyanin content. Many studies have also shown that the L* is inversely proportional to the value of anthocyanin content [39].
Owing to its chemical instability, anthocyanidin rarely exists as a monomer and is typically bound to glycosides to form more stable anthocyanins stored in vesicles. In this study, the metabolomic analysis of red-flowered S. japonica ‘AM’ petals from all types across all phases identified 39 anthocyanin metabolites, including six glycosides, mainly in the form of monoglycosides at the 3-hydroxyl position, with diglycosides replacing the 3- and 5-hydroxyl positions, which may contribute to the stability of anthocyanins [40,41]. The key anthocyanin metabolites influencing the coloration differences among petal types LGB, YB, and QB were identified as several dozens of substances such as paeoniflorin-3-O-glucoside, paeoniflorin-3-O-rutinoside, anthocyanin-3-O-rutinoside, and anthocyanin-3-O-glucoside. These anthocyanins presented significantly higher content in the light purplish-red YB and LGB than in the yellowish-white QB, where the most abundant metabolites was cyanidin-3-O-glucoside and the highest concentration was observed at the initial flowering phase, reflecting the petal color differences. This indicated that the cyanidin-3-O-glucoside accumulation was a primary factor in the coloration variation among petal types in ‘AM’, consistent with findings in tea (Camellia sinensis (L.) Kuntze) [42], camellia [43], and cotton (Gossypium hirsutum L.) [44]. Additionally, in other plants, such as Prunus mume Siebold & Zucc. [45], Rhododendron L. [46], and apple (Malus pumila Mill.) [47], cyanidin is also a key contributor to red petal coloration. Furthermore, although the delphinidin-like anthocyanins were more prevalent in QB than in YB and LGB, delphinidin-3-O-arabinoside and delphinidin-3-O-sophoroside were undetectable at the full bloom and final flowering phases, indicating that their synthesis was completed in the earlier phases and no new ones are synthesized with the opening of the flower, but only degraded gradually, which was similar to the findings of Fu et al. [9] on the variation of flower color in R. rugosa ‘Zi zhi’. Furthermore, delphinidin-3-O-rutinoside-5-O-glucoside was observed at all phases in LGB, YB, and QB, but did not influence the petal coloration, suggesting that the effect of delphinidin on petal color in S. japonica may be modulated by other biological conditions or interactions with other metabolites.
In the present study, it was found that the color-presenting substances in the YB and LGB in ‘AM’ may be mainly cyanidin-3-O-glucoside as well as peonidin-3-O-rutinoside. There are some differences between the results of this and those of Guo [48], who concluded that the main color-presenting substances in the petals were cyanidin-3-O-glucoside and cyanidin-3-O-rutinoside in S. japonica pink-flowering mutant ‘PM’. Cyanidin-3-O-rutinoside was the consistent in two studies, and cyanidin-3-O-rutinoside was also detected in ‘AM’, but it was lower. In this study, high content of peonidin-3-O-rutinoside was detected for the first time from the petals of ‘AM’, and its content was second only to cyanidin-3-O-glucoside; their different glycosides can be combined with rutinoside to form anthocyanosides. This might be caused by different genotypes of the red-flowered S. japonica materials in the two studies, which in turn led to some differences in the synthesis pathway of anthocyanin. Further studies are needed to reveal the differences between the two and their formation mechanisms.

5. Conclusions

Metabolomic analyses targeting anthocyanins were conducted on three petal types from four developmental phases in the flower color mutant ‘AM’ of S. japonica to identify the primary metabolites responsible for coloration differences among the petals. Using UPLC-MS/MS, 36 anthocyanins and nine flavonoids were identified in the QB, YB, and LGB petal types at the flower bud phase, initial flowering phase, full bloom phase, and final flowering phase in ‘AM’. Based on petal color phenotypic analysis, OPLS-DA, and differential metabolite enrichment, ten metabolites, including peonidin-3-O-rutinoside, cyanidin-3-O-rutinoside, and cyanidin-3-O-glucoside, were identified as key substances distinguishing the differences of the color between YB and LGB petals compared to QB. These findings could enhance our understanding of the biochemical mechanisms underlying petal coloration in S. japonica and clarify the anthocyanin biosynthetic pathway, aiding the cultivation of new floral color varieties.

Supplementary Materials

The following supporting information can be downloaded at: https://www.mdpi.com/article/10.3390/horticulturae11020143/s1, Figure S1: Flower color differences among petal types at various flowering stages of ‘AM’. L*, a*, and b* values represent the petal brightness, color features on the red axis, and blue axis, respectively; L* represents the brightness (0~100)—the larger the value, the brighter it is; a* ranges from negative to positive (−60~60) and indicates that the color features in the green-red change; the b* negative–positive value ranging (−128~127) indicates that the color feature changes from blue to yellow. “*” indicates that the p-value is less than 0.05 and the result is significant, “**“ indicates that the p-value is less than 0.01 and the result is highly significant, “***” indicates that the p-value is less than 0.001 and the result is highly significant, “****” indicates that the p-value is less than 0.0001 and indicates a highly significant difference, and “ns” indicates that the p-value is greater than 0.05 and the result is not significant. Figure S2: Anthocyanin content in different petal types at different stages of flower development in ‘AM’. Figure S3: Differential metabolite content stacking charts. Table S1: Parameters of OPLS-DA model for different petal types at the same stage of flower development in ‘AM’. Table S2: Statistical table of metabolites related to ‘AM’ anthocyanin synthesis. Table S3: Comparison of differential metabolites. Table S4: Statistical table of differential metabolites. Table S5: Statistical table of differential metabolite content.

Author Contributions

Writing—original draft, L.G. and X.L.; formal analysis, L.G., Y.M., S.Z. and C.S.; investigation, L.G., T.S., Y.M. and Y.W.; data management, L.G., T.S. and S.Z.; writing—review and editing of the initial manuscript, X.J. and Y.L.; supervision, X.J. and T.S.; validation, Y.W. and C.S.; software, Y.H. and X.L.; methodology, Y.H. and Y.L.; funding acquisition, Y.S. and Y.L.; project administration, Y.S.; visualization, X.L.; resources, K.X. and Y.L. All authors have read and agreed to the published version of the manuscript.

Funding

This study was financially supported by the Subject of Key R & D Plan of Shandong Province (Major Scientific and Technological Innovation Project) (2021LZGC02304), the Subject of Key R & D Plan of Shandong Province (Agricultural Elite Varieties Project) (2024LZGC00301), and Innovation Team for Conservation and Utilization of Precious Tree Species Germplasm project of the Department of Natural Resources of Shandong Province (LZYZZ202398).

Data Availability Statement

Data are contained within the article and Supplementary Materials.

Acknowledgments

The authors wish to express their gratitude to Shandong Provincial Center of Forest and Grass Germplasm Resources, Key Laboratory of National Forestry and Grassland Administration on Conservation and Utilization of Warm Temperate Zone Forest and Grass Germplasm Resource for providing instrumentation support.

Conflicts of Interest

The authors declare that they have no known competing financial interests or personal relationships that could have appeared to influence the work reported in this paper.

References

  1. Li, J.; Peng, Z.; Liu, Y. Phenotypic difference and comprehensive evaluation of Sophora japonica in Beijing urban area. J. Beijing For. Univ. 2022, 44, 23–33. [Google Scholar] [CrossRef]
  2. Sun, Y.; Peng, Z. Insights into history culture and value of Sophora japonica. J. Beijing For. Univ. (Soc. Sci.) 2018, 17, 23–31. [Google Scholar] [CrossRef]
  3. Qu, B.; Liu, Y.; Sun, X.; Li, S.; Wang, X.; Xiong, K.; Yun, B.; Zhang, H. Effect of various mulches on soil physico—Chemical properties and tree growth (Sophora japonica) in urban tree pits. PLoS ONE 2019, 14, e0210777. [Google Scholar] [CrossRef] [PubMed]
  4. Bao, L.; Qu, L.; Ma, K.; Lin, L. Effects of road dust on the growth characteristics of Sophora japonica L. seedlings. J. Environ. Sci. 2016, 46, 147–155. [Google Scholar] [CrossRef]
  5. Zan, W.; Wu, Q.; Dou, S.; Wang, Y.; Zhu, Z.; Xing, S.; Yu, Y. Analysis of flower color diversity revealed the co-regulation of cyanidin and peonidin in the red petals coloration of Rosa rugosa. Plant Physiol. Biochem. 2024, 216, 109126. [Google Scholar] [CrossRef]
  6. Xu, H.; Zheng, Y.J.; Gao, F.P.; Li, Y.K.; Sun, W. Advances in the biosynthesis and influencing factors of anthocyanins. Jiangsu J. Agric. Sci. 2019, 35, 1246–1253. [Google Scholar] [CrossRef]
  7. Li, L.; Zhai, Y.; Luo, X.; Zhang, Y.; Shi, Q. Comparative transcriptome analyses reveal genes related to pigmentation in the petals of red and white Primula vulgaris cultivars. Physiol. Mol. Biol. Plants 2019, 25, 1029–1041. [Google Scholar] [CrossRef]
  8. Sun, W.; Yan, Y.; Muhammad, Z.; Zhang, G. Transcriptomic analysis reveals the formation mechanism of anthocyanins light-independent synthesis in Chrysanthemum. Tech Sci. Press 2024, 10, 791. [Google Scholar] [CrossRef]
  9. Fu, M.; Yang, X.; Zheng, J.; Wang, L.; Yang, X.; Tu, Y.; Ye, J.; Zhang, W.; Liao, Y.; Cheng, S.; et al. Unraveling the regulatory mechanism of color diversity in Camellia japonica petals by integrative transcriptome and metabolome analysis. Front. Plant Sci. 2021, 12, 685136. [Google Scholar] [CrossRef]
  10. Sun, Y.; Hu, P.; Jiang, Y.; Li, J.; Chang, J.; Zhang, H.; Shao, H.; Zhou, Y. Integrated metabolome and transcriptome analysis of petal anthocyanin accumulation mechanism in Gloriosa superba ‘Rothschildiana’ during different flower development stages. Int. J. Mol. Sci. 2023, 24, 15034. [Google Scholar] [CrossRef]
  11. Zhao, H.; Chen, G.; Sang, L.; Deng, Y.; Gao, L.; Yu, Y.; Liu, J. Mitochondrial citrate synthase plays important roles in anthocyanin synthesis in petunia. Plant Sci. Int. J. Exp. Plant Biol. 2021, 305, 110835. [Google Scholar] [CrossRef] [PubMed]
  12. Hichri, I.; Barrieu, F.; Bogs, J.; Kappel, C.; Delrot, S.; Lauvergeat, V. Recent advances in the transcriptional regulation of anthocyanin biosynthesis. Acta Hortic. Sin. 2013, 40, 2295–2306. [Google Scholar] [CrossRef]
  13. Sun, C.; Huang, H.; Xu, C.; Li, X.; Chen, K. Biological activities of extracts from Chinese bayberry (Myrica rubra Sieb. et Zucc.): A Review. Plant Foods Hum. Nutr. 2013, 68, 97–106. [Google Scholar] [CrossRef]
  14. Hong, J.; Yang, L.; Zhang, D.; Shi, J. Plant metabolomics: An indispensable system biology tool for plant science. Int. J. Mol. Sci. 2016, 17, 767. [Google Scholar] [CrossRef]
  15. Augustijn, D.; De Groot, H.J.M.; Alia, A. HR-MAS NMR applications in plant metabolomics. Molecules 2021, 26, 931. [Google Scholar] [CrossRef]
  16. Ramautar, R. CE-MS in metabolomics: Status quo and the way forward. Bioanalysis 2016, 8, 371–374. [Google Scholar] [CrossRef]
  17. Rontani, J.-F. Use of gas chromatography-mass spectrometry techniques (GC-MS, GC-MS/MS and GC-QTOF) for the characterization of photooxidation and autoxidation products of lipids of autotrophic organisms in environmental samples. Molecules 2022, 27, 1629. [Google Scholar] [CrossRef]
  18. Wu, W.; Jiao, C.; Li, H.; Ma, Y.; Jiao, L.; Liu, S. LC-MS based metabolic and metabonomic studies of Panax ginseng. Phytochem. Anal. PCA 2018, 29, 331–340. [Google Scholar] [CrossRef]
  19. Yue, Y.; Liu, J.; Shi, T.; Chen, M.; Li, Y.; Du, J.; Jiang, H.; Yang, X.; Hu, H.; Wang, L. Integrating transcriptomic and GC-MS metabolomic analysis to characterize color and aroma formation during tepal development in Lycoris longituba. Plants 2019, 8, 53. [Google Scholar] [CrossRef]
  20. Zhao, J.; Xu, J.-W.; Liu, J.-G.; Chen, T.; Shi, Y.; Qi, Y.; Xiao, S. Target metabolomic analysis of material composition using a pair of near isogenic lines with different floral colors in sunflower. J. Nanjing Agric. Univ. 2021, 44, 437–446. [Google Scholar] [CrossRef]
  21. Chen, W.; Gong, L.; Guo, Z.; Wang, W.; Zhang, H.; Liu, X.; Yu, S.; Xiong, L.; Luo, J. A novel integrated method for large-scale detection, identification, and quantification of widely targeted metabolites: Application in the study of rice metabolomics. Mol. Plant 2013, 6, 1769–1780. [Google Scholar] [CrossRef] [PubMed]
  22. Chen, W.; Gong, L.; Guo, Z.; Wang, W.; Zhang, H.; Liu, X.; Yu, S.; Xiong, L.; Luo, J. Metabolite profiling reveals distinct modulation of complex metabolic networks in non-pigmented, black, and red rice (Oryza sativa L.) cultivars. Metabolites 2021, 11, 367. [Google Scholar] [CrossRef] [PubMed]
  23. Sobeh, M.; Youssef, F.S.; Esmat, A.; Petruk, G.; El-Khatib, A.H.; Monti, D.M.; Ashour, M.L.; Wink, M. High resolution UPLC-MS/MS profiling of polyphenolics in the methanol extract of Syzygium samarangense leaves and its hepatoprotective activity in rats with CCl4-induced hepatic damage. Food Chem. Toxicol. 2018, 113, 145–153. [Google Scholar] [CrossRef] [PubMed]
  24. Wan, H.; Yu, C.; Han, Y.; Guo, X.; Luo, L.; Pan, H.; Zheng, T.; Wang, J.; Cheng, T.; Zhang, Q. Determination of flavonoids and carotenoids and their contributions to various colors of rose cultivars (Rosa spp.). Front. Plant Sci. 2019, 10, 123. [Google Scholar] [CrossRef]
  25. Yuan, Y.; Ren, S.; Liu, X.; Su, L.; Wu, Y.; Zhang, W.; Li, Y.; Jiang, Y.; Wang, H.; Fu, R.; et al. SlWRKY35 positively regulates carotenoid biosynthesis by activating the MEP pathway in tomato fruit. New Phytol. 2022, 234, 164–178. [Google Scholar] [CrossRef]
  26. Chen, L.; Shen, Y.; Yang, W.; Pan, Q.; Li, C.; Sun, Q.; Zeng, Q.; Li, B.; Zhang, L. Comparative metabolic study of two contrasting Chinese cabbage genotypes under mild and severe drought stress. Int. J. Mol. Sci. 2022, 23, 5947. [Google Scholar] [CrossRef]
  27. Kanehisa, M.S. KEGG: Kyoto encyclopedia of genes and genomes. Nucleic Acids Res. 2000, 28, 27–30. [Google Scholar] [CrossRef]
  28. Wang, Y.; Li, S.; Zhu, Z.; Xu, Z.; Qi, S.; Xing, S.; Yu, Y.; Wu, Q. Transcriptome and chemical analyses revealed the mechanism of flower color formation in Rosa rugosa. Front. Plant Sci. 2022, 13, 1021521. [Google Scholar] [CrossRef]
  29. Horiuchi, R.; Nishizaki, Y.; Okawa, N.; Ogino, A.; Sasaki, N. Identification of the biosynthetic pathway for anthocyanin triglucoside, the precursor of polyacylated anthocyanin, in red cabbage. J. Agric. Food Chem. 2020, 68, 9750–9758. [Google Scholar] [CrossRef]
  30. Tian, J.; Xu, R.; Chang, K.; Yuan, S.; Huang, C.; Wang, J.; Li, S.; Liu, F.; Zhong, F. Identification of PAL gene in purple cabbage and functional analysis related to anthocyanin synthesis. Horticulturae 2023, 9, 469. [Google Scholar] [CrossRef]
  31. Mu, Z.; Yang, Y.; Yusuyin, A.; Xu, Y.; Yuan, H.; Liu, C. Transcriptome analysis provides insights into anthocyanin synthesis in Blueberry. Horticulturae 2023, 9, 1036. [Google Scholar] [CrossRef]
  32. Chen, X.; Yuan, Y.; Xu, Y.; Shi, Y.; Tang, D. Anthocyanin profiles in petals of different hyacinthus orientalis. Acta Hortic. Sin. 2015, 42, 301–310. [Google Scholar] [CrossRef]
  33. Yu, J.-J.; Tang, D.-Q.; Li, X. Anthocyanin compositions in petals of Freesia hybrida. Guihaia 2020, 40, 687–695. [Google Scholar] [CrossRef]
  34. Lan, W.; Xue-Qin, W.; Hao, Z. Analysis of flavonoids of flower of Robiniapseu Doacacia L. by HPLC-DAD-ESI-MS/MS. Food Drug 2013, 15, 240–242. [Google Scholar]
  35. Grotewold, E. The genetics and biochemistry of floral pigments. Annu. Rev. Plant Biol. 2006, 57, 761–780. [Google Scholar] [CrossRef]
  36. Tanaka, Y.; Sasaki, N.; Ohmiya, A. Biosynthesis of plant pigments: Anthocyanins, betalains and carotenoids. Plant J. Cell Mol. Biol. 2008, 54, 733–749. [Google Scholar] [CrossRef]
  37. Zhao, D.; Tao, J. Recent advances on the development and regulation of flower color in ornamental plants. Front. Plant Sci. 2015, 6, 261. [Google Scholar] [CrossRef]
  38. Xue, L. Study on Germplasm Innovation and Molecular Mechanism of Flower Color Formation in Red-Flowered Strawberry; Shengyang Agricultural University: Shenyang, China, 2016. [Google Scholar]
  39. Liu, G.; Liu, H.; Shi, G.; Xu, N.; Niu, Z.; Wang, L.; Zhao, R.; Wang, L.; Fan, L. Multi-omics analysis of Iris sanguinea with distinctive flower colors provides insights into petal coloration. Hortic. Plant J. 2024, in press. [Google Scholar] [CrossRef]
  40. Du, H.; Lai, L.; Wang, F.; Sun, W.; Zhang, L.; Li, X.; Wang, L.; Jiang, L.; Zheng, Y. Characterisation of flower colouration in 30 Rhododendron species via anthocyanin and flavonol identification and quantitative traits. Plant Biol. 2018, 20, 121–129. [Google Scholar] [CrossRef]
  41. Shao, D.; Liang, Q.; Wang, X.; Zhu, Q.-H.; Liu, F.; Li, Y.; Zhang, X.; Yang, Y.; Sun, J.; Xue, F. Comparative metabolome and transcriptome analysis of anthocyanin biosynthesis in white and pink petals of cotton (Gossypium hirsutum L.). Int. J. Mol. Sci. 2022, 23, 10137. [Google Scholar] [CrossRef]
  42. Zhou, C.; Mei, X.; Rothenberg, D.O.; Yang, Z.; Zhang, W.; Wan, S.; Yang, H.; Zhang, L. Metabolome and transcriptome analysis reveals putative genes involved in anthocyanin accumulation and coloration in white and pink tea (Camellia sinensis) flower. Molecules 2020, 25, 190. [Google Scholar] [CrossRef] [PubMed]
  43. Fu, Z.; Wang, R.; Zhang, T.; Wang, H.; Gao, J.; Li, Y.; Jiang, H.; Wang, L.; Yuan, X.; Li, Y.; et al. Identification of F3’5’H Gene in petunia and the roles in petal coloration. J. Henan Agric. Sci. 2021, 50, 121–127. [Google Scholar] [CrossRef]
  44. Abid, M.A.; Wei, Y.; Meng, Z.; Wang, Y.; Ye, Y.; Wang, Y.; He, H.; Zhou, Q.; Li, Y.; Wang, P.; et al. Increasing floral visitation and hybrid seed production mediated by beauty mark in Gossypium hirsutum. Plant Biotechnol. J. 2022, 20, 1274–1284. [Google Scholar] [CrossRef] [PubMed]
  45. Ma, K.-F.; Zhang, Q.-X.; Cheng, T.-R.; Yan, X.-L.; Pan, H.-T.; Wang, J. Substantial epigenetic variation causing flower color chimerism in the ornamental tree Prunus mume revealed by single base resolution methylome detection and transcriptome sequencing. Int. J. Mol. Sci. 2018, 19, 2315. [Google Scholar] [CrossRef]
  46. Liu, L.; Zhang, L.-Y.; Wang, S.-L.; Niu, X.-Y. Analysis of anthocyanins and flavonols in petals of 10 Rhododendron species from the Sygera Mountains in Southeast Tibet. Plant Physiol. Biochem. 2016, 104, 250–256. [Google Scholar] [CrossRef]
  47. Honda, C.; Kotoda, N.; Wada, M.; Kondo, S.; Kobayashi, S.; Soejima, J.; Zhang, Z.; Tsuda, T.; Moriguchi, T. Anthocyanin biosynthetic genes are coordinately expressed during red coloration in apple skin. Plant Physiol. Biochem. 2002, 40, 955–962. [Google Scholar] [CrossRef]
  48. Guo, L.-P. Transcriptome Analysis Revealing Flower Coloration of Sophora japonica Linn. and Function Analysis for Key Genes Involved in Anthycayanin Accumulation; Beijing Forestry University: Beijing, China, 2020. [Google Scholar]
Figure 1. Phenotypes of the flower color mutant S. japonica ‘AM’.
Horticulturae 11 00143 g001
Figure 2. Sample quality control analysis. (A) Sample correlation analysis. The vertical and diagonal lines represent the sample names of different samples, and different colors represent different Spearman correlation coefficient sizes: the redder the color represents stronger positive correlation, the greener the color represents weaker correlation, and the bluer the color represents stronger negative correlation. (B) Sample principal component analysis. PC1 denotes the first principal component, PC2 denotes the second principal component, and the percentage denotes the explanation rate of this principal component for the dataset. Each point in the figure represents a sample.
Horticulturae 11 00143 g002
Figure 3. OPLS-DA plot of different petal types in ‘AM’. (AL) are the score plots of QB versus YB, QB versus LGB at bud period, pre-flowering period, full bloom period, and end flowering period, respectively. Horizontal coordinates indicate the predicted principal components, and the horizontal direction shows the gap between groups; vertical coordinates indicate the orthogonal principal components, and the vertical direction shows the gap within groups; and the percentage indicates the degree of explanation of the component for the dataset.
Horticulturae 11 00143 g003
Figure 4. Metabolite analysis. (A) Differential metabolite heat map. The horizontal represents the sample name, vertical represents metabolite information, and different colors represent the colors filled with different values obtained after standardization of relative content (red represents high content, green represents low content). (B) UpSet plot of each contrasting combination. The lower left of the figure (bar graph) is the size of each set; the lower right is the intersection of each set, where black dots indicate the presence, the line connecting the dots indicates the intersection relationship of multiple sets, and the upper part is the number of each grouping of unique and common.
Horticulturae 11 00143 g004
Figure 5. Histogram of differential metabolite content. Plot of the content of 10 differential metabolites measured over 4 periods in 3 petal types.
Horticulturae 11 00143 g005
Table 1. Analysis of the significance of differences in flower color among different petal types at each flowering stages of ‘AM’.
Petal TypeL*a*b*
S1QB90.76 ± 0.46 ab−2.62 ± 0.09 e37.31 ± 1.54 a
S2QB83.60 ± 4.60 cd−3.16 ± 0.99 e32.58 ± 2.03 b
S3QB80.74 ± 3.49 de−2.04 ± 0.79 e27.34 ± 1.59 c
S4QB85.05 ± 2.15 cd−3.64 ± 1.08 e21.57 ± 1.87 d
S1YB80.02 ± 1.73 def1.29 ± 3.54 cd17.42 ± 0.27 ef
S2YB71.93 ± 1.74 h7.46 ± 0.03 a17.06 ± 1.79 f
S3YB74.07 ± 2.38 gh5.87 ± 0.92 ab18.12 ± 1.43 ef
S4YB86.52 ± 2.73 bc3.36 ± 1.13 bc22.96 ± 0.93 d
S1LGB84.32 ± 3.81 cd−1.26 ± 2.92 de32.43 ± 2.69 b
S2LGB74.91 ± 2.23 fgh3.82 ± 0.56 bc28.71 ± 0.69 c
S3LGB77.62 ± 1.89 ef4.06 ± 0.52 bc20.48 ± 2.23 de
S4LGB93.03 ± 1.06 a−3.59 ± 0.14 e20.52 ± 0.96 de
Notes: Different lowercase letters denote the significant differences (p < 0.05) in columns; L*, a*, and b* values represent the petal brightness, color features on the red axis, and blue axis, respectively; L* represents the brightness (0~100)—the larger the value, the brighter it is; a* ranges from negative to positive (−60~60) and indicates that the color features in the green-red change; the b* negative–positive value ranging (−128~127) indicates that the color feature changes from blue to yellow.
Disclaimer/Publisher’s Note: The statements, opinions and data contained in all publications are solely those of the individual author(s) and contributor(s) and not of MDPI and/or the editor(s). MDPI and/or the editor(s) disclaim responsibility for any injury to people or property resulting from any ideas, methods, instructions or products referred to in the content.

