Article

Characterization of LBD Genes in Cymbidium ensifolium with Roles in Floral Development and Fragrance

1
The Cross-Strait Scientific and Technological Innovation Hub of Flower Industry, Ornamental Plant Germplasm Resources Innovation & Engineering Application Research Center, Key Laboratory of National Forestry and Grassland Administration for Orchid Conservation and Utilization, College of Landscape Architecture and Art, Fujian Agriculture and Forestry University, Fuzhou 350002, China
2
State Key Laboratory of Subtropical Silviculture, Bamboo Industry Institute, Zhejiang A&F University, Lin’an, Hangzhou 311300, China
3
College of Life Sciences, Fujian Normal University, Fuzhou 350117, China
*
Author to whom correspondence should be addressed.
These authors contribute equally to this work.
Horticulturae 2025, 11(2), 117; https://doi.org/10.3390/horticulturae11020117
Submission received: 12 December 2024 / Revised: 16 January 2025 / Accepted: 17 January 2025 / Published: 22 January 2025
(This article belongs to the Special Issue Orchids: Advances in Propagation, Cultivation and Breeding)

Abstract

:
LBD transcription factors are critical regulators of plant growth and development. Recent studies highlighted their significant role in the transcriptional regulation of plant growth and metabolism. Thus, identifying the CeLBD gene in Cymbidium ensifolium, a species abundant in floral scent metabolites, could provide deeper insights into its functional significance. A total of 34 LBD genes were identified in C. ensifolium. These CeLBDs fell into two major groups: Class I and Class II. The Class I group contained 30 genes, while the Class II group included only 4 genes. Among the 30 Class I genes, several genes in the Ie branch exhibited structural variations or partial deletions (CeLBD20 and CeLBD21) in the coiled-coil motif (LX6LX3LX6L). These changes may contribute to the difficulty in root hair formation in C. ensifolium. The variations may prevent normal transcription, leading to low or absent expression, which may explain the fleshy and corona-like root system of C. ensifolium without prominent lateral roots. The expansion for CeLBDs was largely due to special WGD events in orchids during evolution, or by segmental duplication and tandem duplication. CeLBDs in different branches exhibit similar functions and expression characteristics. Promoter analysis enriched environmental response elements, such as AP2/ERF, potentially mediating the specific expression of CeLBDs under different stresses. CeLBDs were predicted to interact with multiple transcription factors or ribosomal proteins, forming complex regulatory networks. CeLBD20 was localized in the cytoplasm, it may act as a signaling factor to activate other transcription factors. CeLBD6 in Class II was significantly up-regulated under cold, drought, and ABA treatments, suggesting its role in environmental responses. Furthermore, metabolic correlation analysis revealed that its expression was associated with the release of major aromatic compounds, such as MeJA. These findings offer valuable insights for further functional studies of CeLBD genes in C. ensifolium.

1. Introduction

The LBD gene family is a plant-specific gene family that is conserved across the genomes of organisms, ranging from primitive green algae to modern angiosperms [1]. The LBD family is named after its N-terminal Lateral Organ Boundaries Domain (LOB domain), which contains a characteristic zinc finger-like motif (CX2CX6CX3C), where X represents non-conserved amino acid residues. It also features a GAS motif, comprised of Glycine-Alanine-Serine, and a coiled-coil motif resembling a leucine zipper, following the pattern LX6LX3LX6L. Specifically, the CX2CX6CX3C motif plays a pivotal role in DNA binding, while the LX6LX3LX6L motif facilitates protein dimerization [2,3]. The LBD gene family is categorized into two classes based on the distinctive structural features of their encoded proteins. Genes that fully contain all three motifs belong to Class I, which can be further subdivided into five clades; most LBD members fall into this category. A small subset of genes lacking the complete leucine zipper-like coiled-coil motif (LX6LX3LX6L) is categorized under Class II, which is further subdivided into two clades [4,5].
The LBD transcription factor family is crucial for regulating plant growth and development, with its members playing key roles in processes like organ development [6], stress responses [7,8], substance synthesis [9], and growth metabolism [10]. First identified in Arabidopsis thaliana, this transcription factor family plays a critical role in the development of lateral organs in plants. However, further advances in functional research have revealed that LBD proteins not only act as transcription factors to influence the development of lateral organs but also play significant roles in regulating diverse aspects of plant growth [11], metabolic regulation [12,13], fruit formation [14], and hormone response [15,16,17]. Recent advancements in genome sequencing technologies have enabled comprehensive analysis of the LBD gene family in model plants, such as O. sativa [18] as well as in economically important agricultural and forestry plants such as Medicago truncatula [19], Malus domestica [20], Lycopersicon esculentum [21], Zea mays [22], and Solanum lycopersicum [23]. Moreover, by synthesizing the roles of LBD genes within a phylogenetic context, researchers can clarify the varied functions of LBD proteins more effectively. Previous functional and evolutionary studies of LBD family members have demonstrated that LBD genes within the same phylogenetic group generally exhibit similar molecular functions. For instance, Class I LBD genes primarily contribute to various aspects of plant development, such as the formation of lateral roots, leaves, and flowers in species like A. thaliana and O. sativa [24,25]. In contrast, Class II LBD genes, including AtLBD37, AtLBD38, and AtLBD39, are predominantly engaged in metabolic processes, acting as negative regulators in pathways like nitrogen response and anthocyanin synthesis [17,26]. Therefore, through phylogenetic and clustering analysis, the functions of many LBD genes can be predicted [27], providing a convenient starting point for further research into the roles of LBD proteins in more plants.
As of 2025, Orchidaceae comprises 736 genera and over 29,000 species, making it the largest and most diverse family among angiosperms [28]. The vast diversity of this group allows orchids to exhibit a wide range of growth adaptations and forms, enabling them to successfully inhabit various ecological niches. Orchid flowers differ significantly from those of other plants and share a distinct morphology. Recent sequencing of multiple orchid genomes, along with the analysis of various transcription factor families has begun to unravel the molecular mechanisms underlying their morphological characteristics and environmental adaptability [18,29]. C. ensifolium, a significant member of the orchid family as a flower crop, is highly sought after by breeders due to the release of MeJA as its unique aroma. MeJA serves not only as a key floral volatile that attracts pollinators and facilitates plant reproduction but also as a growth hormone that significantly influences the growth, development, and stress resistance of C. ensifolium. Existing studies have shown that MeJA can induce the expression of LBD genes, thereby enhancing plant resistance to cold environments [30]. Therefore, investigating the expression patterns and functions of CeLBD genes in C. ensifolium is crucial for understanding the mechanisms underlying floral scent emission, stress resistance, and flower development. Although its genome was decoded in 2021, the characteristics and functions of LBD genes in C. ensifolium remain unclear. To address this research gap, we identified the LBD gene family in the complete genome of C. ensifolium and performed comprehensive analyses. The results provide a theoretical foundation for future functional studies of the LBD gene family in C. ensifolium.

2. Materials and Methods

2.1. Plant Material and Related Treatment Methods

C. ensifolium ’Xiaotao Hong’ was originally introduced from Shan Cheng Town, Nanjing County, Zhangzhou City, Fujian Province (24° N, 117° E). These plants were cultivated at the Forest Orchid Garden of Fujian Agriculture and Forestry University and identified by experts in a local lab (26° N, 119° E) as the research material. Chromosome-level C. ensifolium genome data were obtained from the National Genome Data Center (NGDC) (https://ngdc.cncb.ac.cn/, accessed on 18 June 2024) [31]. Transcriptome data included leaves, stems, roots, fruits at different stages, and flowers during bud, initial bloom, full bloom, and senescence stages. Healthy and consistently growing plants free from pests and diseases were selected for sampling, and RNA was extracted for subsequent RT-qPCR and subcellular localization experiments. Each experimental treatment consisted of three individual plants serving as biological replicates, with untreated plants maintaining similar growth conditions used as a control group. The plants were subjected to three different treatments: a drought condition simulated by irrigation with 20% (w/v) polyethylene glycol (PEG6000), an auxin response stimulated by 100 μM abscisic acid (ABA), and subjected to low-temperature treatment at 4 °C. Leaf samples from C. ensifolium ’Xiao Tao Hong’ were collected at intervals of 1, 3, and 7 days following the initiation of these treatments.
Nicotiana benthamiana were cultivated at 26 °C and 70% humidity. After 30 ± 2 days of growth, the leaves were harvested for subcellular localization experiments.

2.2. Identification and Physicochemical Properties Analysis of LBD Genes in C. ensifolium Genome

For acquiring the Arabidopsis LBD protein sequences, we utilized the TAIR database (https://www.arabidopsis.org/, accessed on 15 May 2024). We then used the sequences of AtLBD genes to perform the BLAST search against the C. ensifolium genome [32]. HMMER version 3.0 was used to search for the LOB domain (pfam accession number: PF03195) in the entire C. ensifolium genome using the HMM profile available from Pfam (https://www.ebi.ac.uk/interpro/entry/pfam/PF03195/, accessed on 15 March 2024) [33]. Finally, we screened the preliminarily identified CeLBD genes using the CDD-search function on NCBI, setting a maximum hit count of 500, and leaving the remaining settings at default values. The results from these identifications were merged to ensure a comprehensive and complete identification of the CeLBD genes. The ProtParam online analysis tool (https://web.expasy.org/protparam/, accessed on 1 May 2024) was used to predict several protein properties [34]. The Excel 2021 statistical results were utilized to analyze the enlargement of the CeLBD gene family and the divergences in physicochemical attributes between its branches.

2.3. Sequence Alignment, Protein Structure, and Phylogenetic Analysis of CeLBD Proteins

Conserved motifs within LBD proteins were identified and analyzed using the MEME online tool (https://meme-suite.org/, accessed on 3 March 2024). TBtools (Version 2.069) was employed for drawing these motifs [35]. Gene structure information was obtained from genome annotation files and visualized using Excel 2021 and PowerPoint 2021. Multiple alignments of CeLBD domain-containing sequences were performed using PhyloSuite (version 1.2.3) and visualized by DNAMAN (version 9) Using online tools, SOPMA (https://npsa-prabi.ibcp.fr, accessed on 3 March 2024) [36] for secondary structure and Alphafold2 (https://colab.research.google.com/github/deepmind/alphafold/blob/main/notebooks/AlphaFold.ipynb, accessed on 3 March 2024) to predict the tertiary structures [37]. Visualization of protein tertiary structures was performed with PyMOL (Version 2.5.7) [38]. The OsLBD protein sequences were sourced from Ensymble-plants (https://plants.ensembl.org/, accessed on 1 March 2024), and PhyloSuite (version 1.2.3) was utilized for multiple sequence alignment of C. ensifolium, Oryza, and Arabidopsis LBD protein sequences. The phylogenetic tree was constructed using the neighbor-joining (NJ) method in PhyloSuite (version 1.2.3), with 1000 bootstrap replicates. The resulting evolutionary tree was visualized using iTOL (https://itol.embl.de/, accessed on 3 March 2024) [39].

2.4. Chromosomal Distribution and Synteny Analyses

To conduct a comprehensive analysis of the LBD gene family in C. senfolium, we utilized TBtools-II to determine the chromosomal distribution of the CeLBDs based on the full genome annotation of this orchid species. For the identification of duplication events involving the CeLBDs within the genome, we applied the MCScanX toolkit, using its default settings [40]. KaKs_Calculator2.0 was used to calculate Ks, Ka, and their ratio between gene pairs [41]. Additionally, we obtained the complete genome sequences and GFF files for A. thaliana and O. sativa were obtained from the NCBI database to perform synteny comparing the CeLBDs with those in these model organisms. The findings were then visualized using the Advanced Circos and Multiple Synteny Plot features available in TBtools-II [42].

2.5. Prediction of miRNAs Binding Site and Cis-Acting Elements in CeLBDs

Active miRNA targets genes, leading to post-transcription regulation. In this study, to investigate the interactions between miRNAs and their target genes LBD, we submitted 34 CeLBD genes to the psRNA server (https://www.zhaolab.org/psRNATarget/, accessed on 25 April 2024) to predict miRNA binding sites [43]. The expectation value threshold was set to 5, with all other parameters maintained at their default settings.
We utilized TBtools to retrieve the 2000 bp upstream nucleotide sequences from the start codons of CeLBD genes and submitted them to the PlantPAN4.0 database (http://plantpan.itps.ncku.edu.tw/plantpan4, accessed on 7 March 2024) for the prediction of cis-acting regulatory elements [44]. Information on conserved cis-elements was visualized using Excel 2021.

2.6. Protein Interaction Network Analysis of CeLBD Proteins

For analyzing the protein–protein interaction network involving CeLBD proteins, we uploaded 34 CeLBD protein sequences to the STRING database (https://string-db.org/, accessed on 7 March 2024) with A. thaliana as the reference organism. To ensure data accuracy, we set the maximum number of interactions to 20, including both the 1st and 2nd shell interactions. Subsequently, we utilized Cytoscape (version 3.9.1) to visualize the resulting network [45]. For Cytoscape, the parameters were set as follows: node size was determined by betweenness centrality, and node color was based on degree centrality. Nodes increased in size with higher betweenness centrality and darkened in color with increasing degree centrality.

2.7. CeLBD Gene Expression Patterns from Transcriptomes

To explore the potential roles of LBD genes in different organs of C. ensifolium, we analyzed the expression profiles of 34 LBD genes in various tissues, including leaves, roots, sepals, petals, lips, and gynandria, as well as at four stages of flower development. Gene expression levels were calculated following previously published methods [29]. Mfuzz was employed to conduct expression pattern clustering [46] (https://www.omicstudio.cn/tool, accessed on 4 October 2024). To visualize the correlation between transcription and metabolism during the main fragrance compound release in C. ensifolium as the flowers open, we utilized Chiplot (https://www.chiplot.online/, accessed on 1 October 2024).

2.8. Subcellular Localization of CeLBD

The CeLBD20 was cloned from the orchid C. ensifolium ’Xiaotao Hong’ and inserted into the pCMDC-202-GFP vector; the homologous recombination primers for the selected genes were referenced from (Supplementary Table S5). Detailed information about the primers used in this process, along with sequencing results, can be found in Table S1 of the Supplementary Materials. Both the pCMDC-202-CeLBD20-GFP construct and the empty pCMDC-202-GFP were transformed into the Agrobacterium tumefaciens strain GV3101. The agrobacteria were cultured overnight, and the infiltration buffer was prepared by adding 10 mM MES-KOH (pH 5.6), 10 mM MgCl2, and 200 μM acetosyringone. The pH was adjusted with 200 μL NaOH, and the bacterial suspension was adjusted to an OD600 between 0.6 and 0.8. The infiltration solution was then injected into the leaves of N. benthamiana plants with six true leaves using a needleless syringe (Melissabio, Beijing, China), with the empty pMDC202-GFP vector serving as a negative control. After two days of culture under a 16 h light and 8 h dark cycle, the samples were examined for fluorescence signals using a Zeiss LSM880 confocal laser scanning microscope (Carl Zeiss AG, Oberkochen, Germany).

2.9. RNA Extraction, cDNA Synthesis, and RT-qPCR Analysis

Total RNA was extracted using the R6827 Plant RNA Kit (Omega Bio-Tek, Guangzhou, China) following the standard protocol, and reverse transcription was conducted for quantitative PCR with fluorescence detection. The selected genes and their corresponding primers are referenced in Supplementary Table S5. The reaction setup and amplification conditions adhered to previously published papers [29,47], with the Master Mix being Hieff UNICON Advanced qPCR SYBR.

3. Results

3.1. Genome-Wide Identification and Physicochemical Properties of CeLBD Genes

Based on the genomic data of C. ensifolium, 34 CeLBD genes were identified and named CeLBD1 to CeLBD34 according to their chromosomal positions. The identified 34 CeLBD genes were translated into proteins, and a phylogenetic tree was constructed to classify the LBD proteins in C. ensifolium, which included 43 AtLBD proteins, 37 OsLBD proteins, and the aforementioned 34 CeLBD proteins (Supplementary Table S1). Phylogenetic analysis results classified the 34 CeLBD proteins into seven typical subfamilies: Ia, Ib, Ic, Id, Ie, IIa, and IIb (Figure 1A). Nine CeLBDs were assigned to the Ic subfamily, which contained a larger number of members than the Ib subfamily. The subfamily with the fewest members was IIa, with only one member (CeLBD26), indicating fewer genes in this subfamily compared to other species. The remaining subfamilies consisted of 3 to 6 members each, without significant differences in the number of members (Figure 1B). Physicochemical property analysis of the identified CeLBD proteins revealed that their lengths ranged from 94 to 260 amino acids, with molecular weights ranging from 16,368.69 to 34,726.56 daltons, theoretical isoelectric points (pI) ranging from 4.85 to 9.76, instability indices ranging from 36.65 to 84.98, aliphatic indices ranging from 66.75 to 92.39, and grand average of hydropathy (GRAVY) values ranging from −0.511 to 0.285 (Supplementary Table S2). Overall, the two classes of proteins exhibited very similar physicochemical properties. Notably, though, the instability index for Class II LBD proteins was found to be higher than that for Class I, whereas no significant differences were observed in their other properties (Figure 1C).

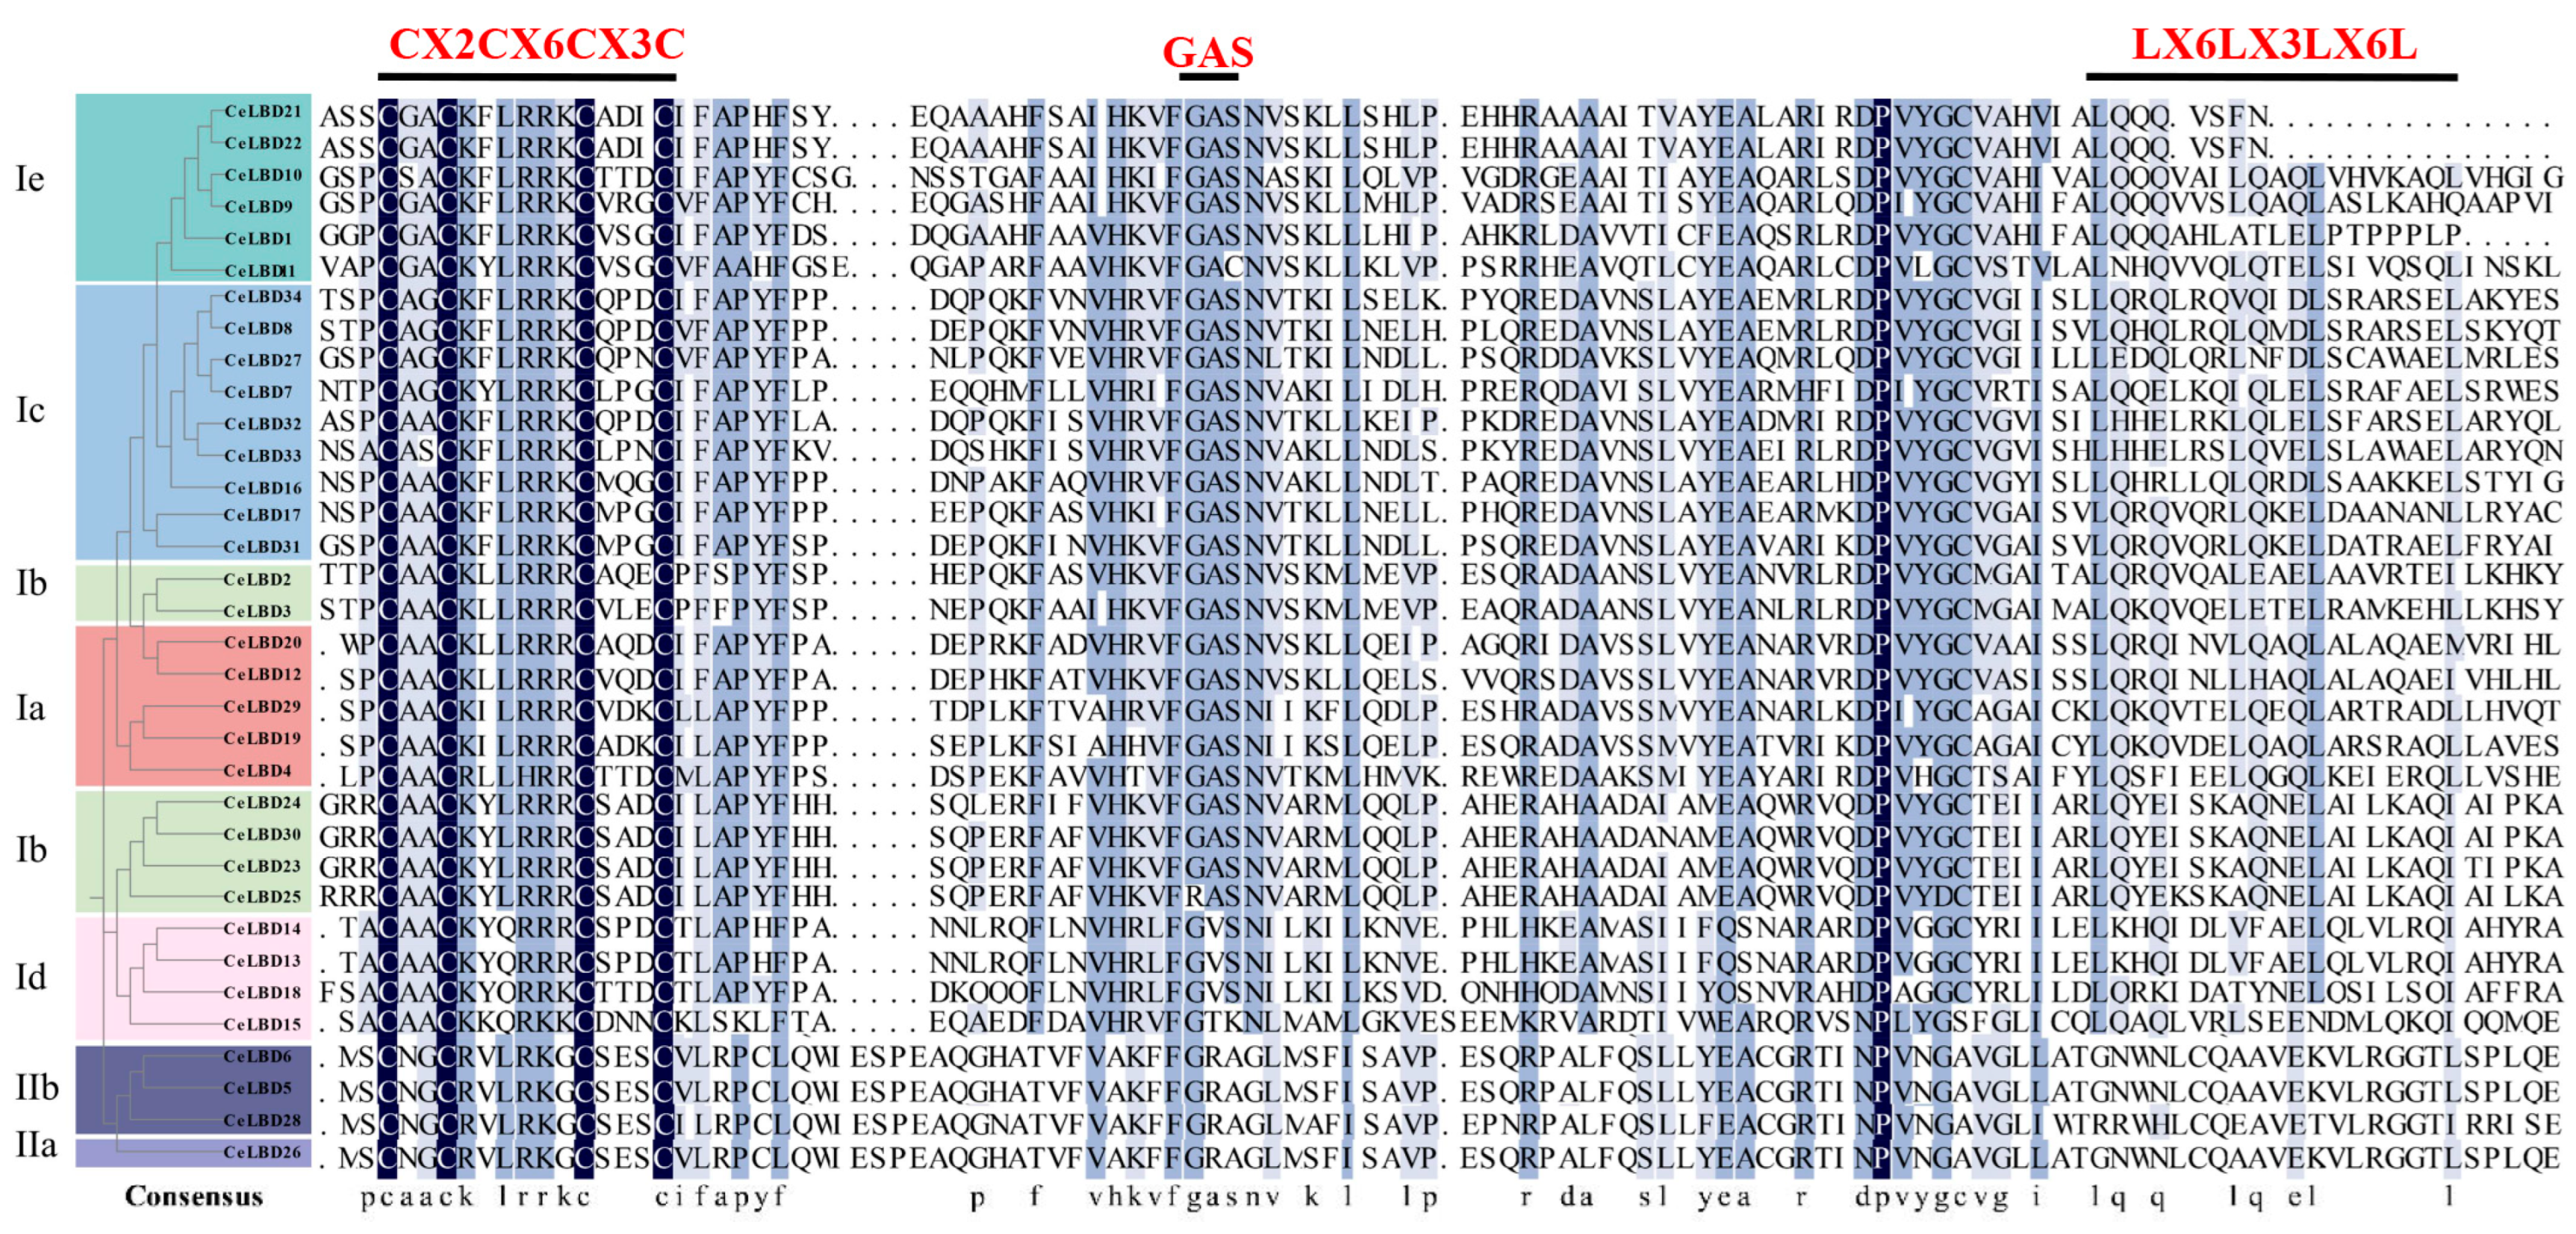
3.2. Conserved Domain and Structure in CeLBD Proteins

Through sequence alignment analysis, it was found that all LBD proteins feature a highly conserved domain comprising roughly 100 amino acids at their N-terminal region (Figure 2). Specifically, all proteins featured the CX2CX6CX3C motif, whereas the GAS block domain and leucine zipper-like domain (LX6LX3LX6L) were exclusively present in Class I CeLBD proteins. This indicated functional differences between Class I and Class II proteins. Notably, within the Class I branch, the LX6LX3LX6L domain was missing in the Ie subfamily, and the GAS and LX6LX3LX6L domains were incomplete in the Id subfamily, suggesting potential functional differences from other conserved CeLBDs. One protein was selected from each subfamily to display secondary and tertiary structures. Secondary structure analysis of the seven CeLBD proteins revealed that the alpha helix content ranged from 26.52% to 49.78%, the extended strand from 0.66% to 6.21%, and the random coil from 44.84% to 67.74% (Supplementary Figure S1). Analysis of tertiary structures indicated that CeLBD proteins within the two major branches shared similar helical configurations. However, CeLBD5 (IIb) and CeLBD26 (IIa) in Branch II were characterized by distinct structural changes when compared to the remaining five proteins.

3.3. CeLBD Structure Variations by Motif Rearrangement and Loss

Through MEME database analysis, the conserved motifs of each protein were identified. The results revealed that Motif 1 and Motif 2 were identified as the most conserved motifs present throughout all CeLBD proteins (Figure 3A,C). Notably, Motif 3 was absent in the CeLBD proteins of branch I e, while in all proteins of branch II, Motif 3 was replaced by Motif 5. Analysis showed that the number and distribution of motifs differed among the various C. ensifolium LBD proteins, highlighting diversity within this protein family. The number of motifs per protein ranged from 2 to 9, with CeLBD13 and CeLBD14 having the highest number of motifs (8 each). CeLBD1, CeLBD21, and CeLBD22 had the fewest motifs, with only two each. Conservation of motifs within each subfamily was observed, for example, motif 9 and motif 15 were exclusively present in the Ic subfamily, while motif 12 was found only in the Ia subfamily, and motifs 5, 6, and 13 were exclusive to the IIb subfamily. Different subfamilies contained distinct motifs and sequences, which contribute significantly to the broad functional diversity within the LBD gene family.
Based on the annotation file, the number of introns in CeLBD genes varied from 0 to 3. CeLBD5 had the highest number of exons, while CeLBD16, CeLBD17, CeLBD21, CeLBD22, CeLBD31, CeLBD32, and CeLBD33 had no introns. Among the genes, the number of exons varied from 1 to 4, with CeLBD5 containing the largest exon count. The number of exons and introns varied between different subfamilies (Figure 3B). The Ib and Id subfamilies had the highest number of introns, with eight each. The Ib and Ic subfamilies had the highest number of exons, with 14 each. The different numbers of intron and exon among subfamilies contributed to the functional diversity of CeLBD genes.

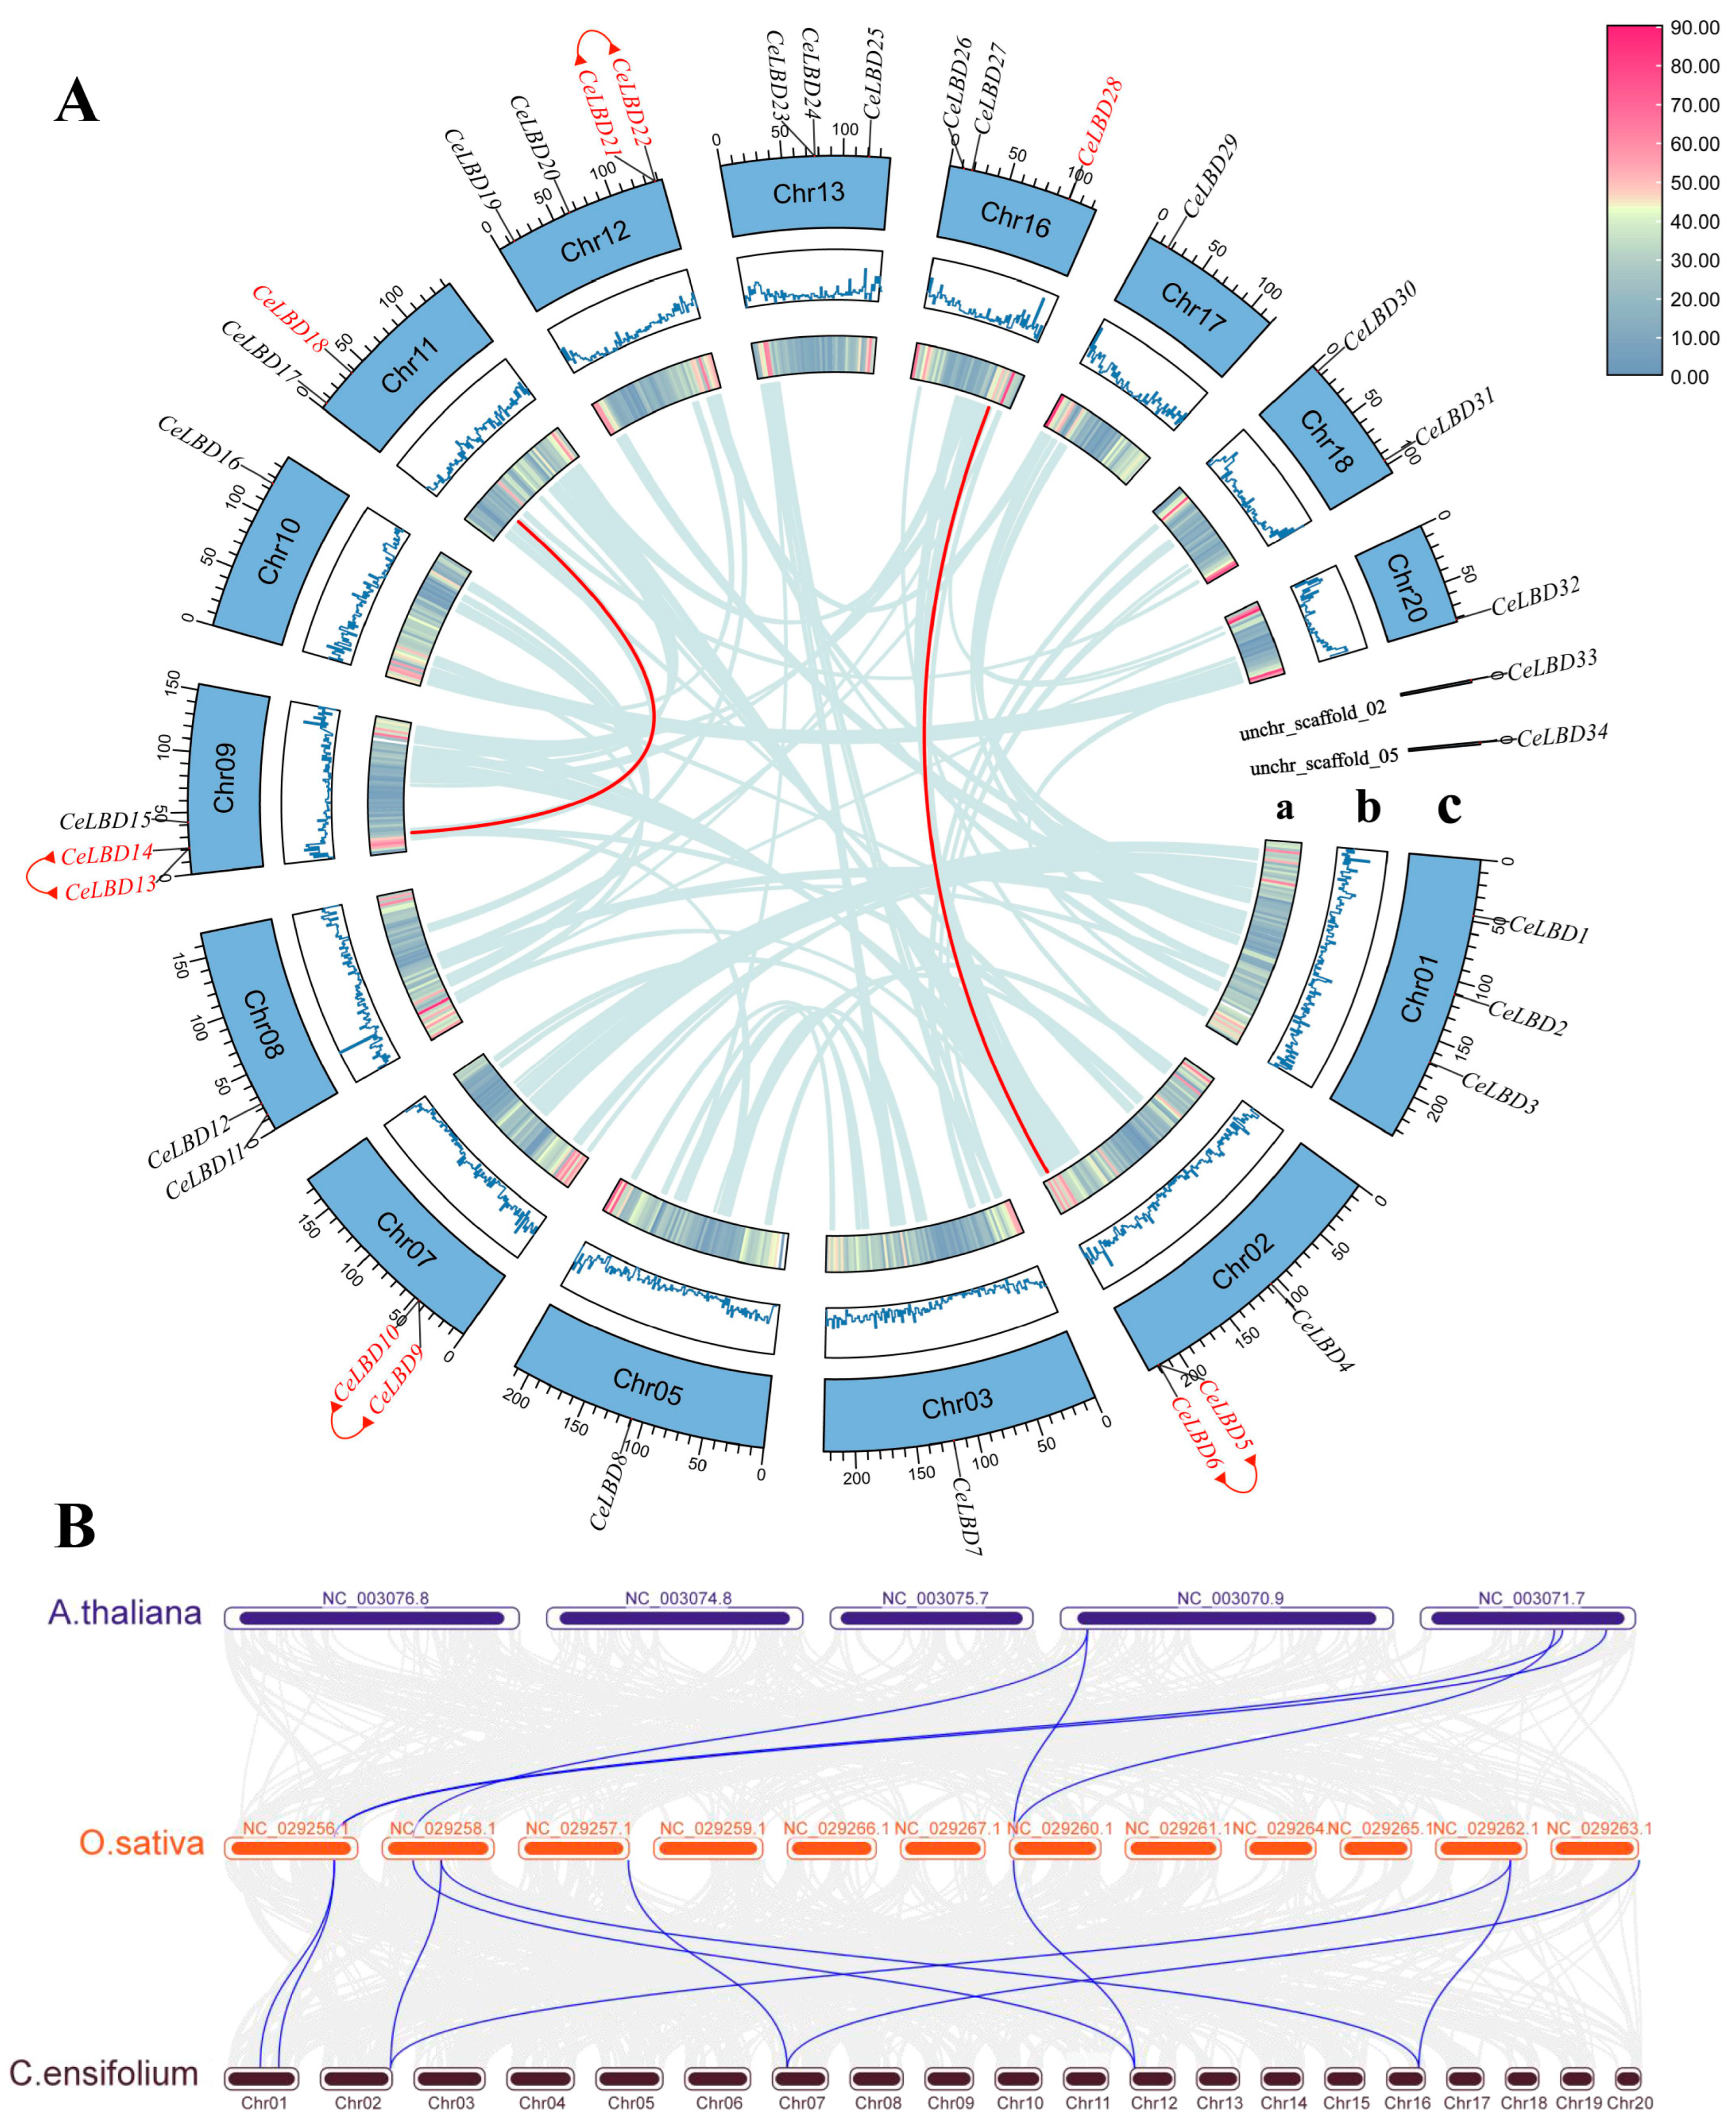
3.4. CeLBD Location and Synteny in the C. ensifolium Genome

The results of chromosome localization showed that the distribution of CeLBDs was not dependent on the length of the chromosomes. CeLBDs were localized to all chromosomes except chromosome 15, with 1 to 5 CeLBDs distributed on each chromosome (Figure 4A). Additionally, CeLBD33 and CeLBD34 were located on unchr_scaffold_02 and unchr_scaffold_05, respectively. Throughout the entire genome, six duplication events of CeLBDs were identified, including segmental duplications between CeLBD5 and CeLBD28, and CeLBD13 and CeLBD18, as well as tandem duplications within chromosomes for CeLBD5 and CeLBD6, CeLBD9 and CeLBD10, CeLBD13 and CeLBD14, and CeLBD21 and CeLBD22. To further elucidate the evolutionary history of the CeLBDs at the genome level, we performed synteny analysis with selected monocot and dicot model plants (Figure 4B). The results demonstrated that CeLBD2, CeLBD3, CeLBD9, CeLBD19, and CeLBD28 exhibited synteny with genes in the O. sativa genome. Notably, the orthologous genes of CeLBD2, CeLBD3, and CeLBD19 in O. sativa also showed synteny with genes in A. thaliana. To further analyze the evolutionary dynamics, we also computed the Ka (non-synonymous) and Ks (synonymous) substitution rates, along with their ratios, for the six duplicate gene pairs. Our analysis of the Ka/Ks ratios across CeLBD gene pairs revealed values less than one for all pairs except for CeLBD13 and CeLBD14 (Supplementary Table S3).

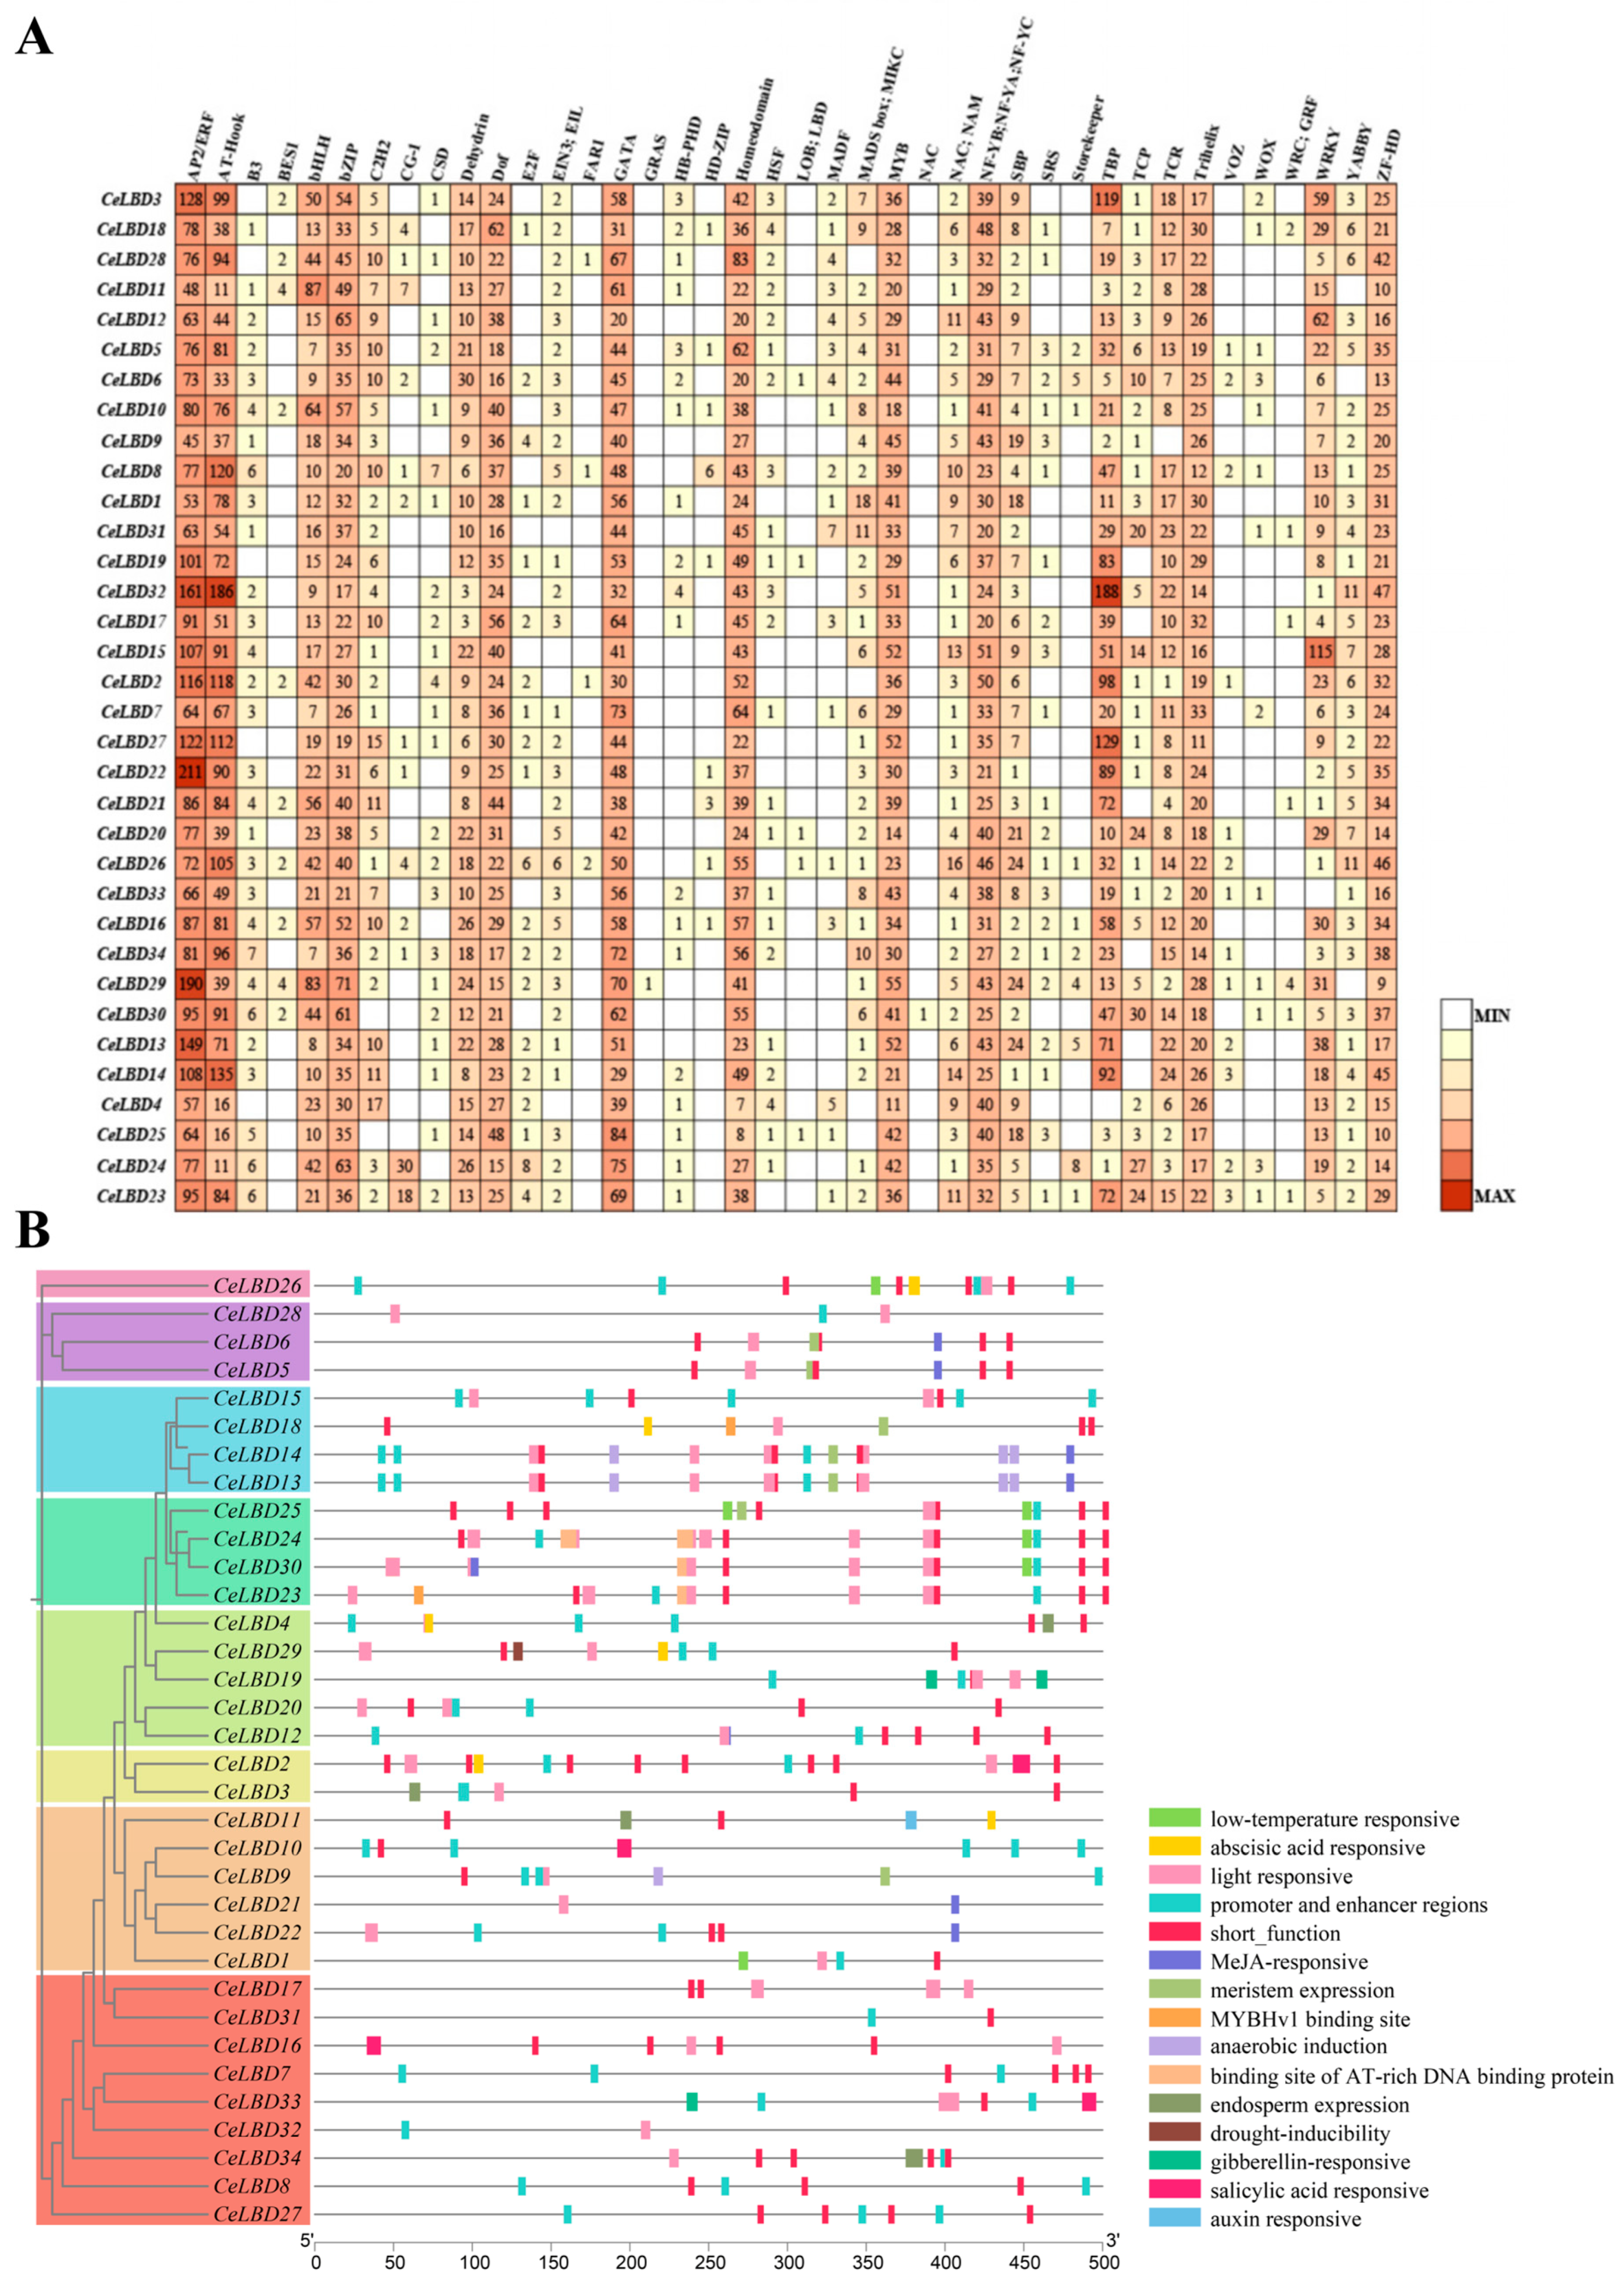
3.5. Analysis of Cis-Regulatory Elements in the Promoter Regions of CeLBD Genes

Our analysis showed that the 2 kb upstream regions of the CeLBD gene family contained a rich abundance of cis-regulatory elements connected to various transcription factor families, including AP2/ERF, AT-hook, TBP, WRKY, bHLH, bZIP, and GATA (Figure 5A). Analysis revealed that these cis-regulatory elements are essential for responding to environmental stresses such as low temperature, drought, salt stress, and ABA signaling. Remarkably, the promoter of CeLBD22 featured 211 instances of the AP2/ERF element, the highest frequency among the 34 CeLBD genes, suggesting a potentially significant role of this gene in plant responses to environmental stresses. Further analysis of the core promoter elements upstream (500bp) of CeLBD proteins (Figure 5B) showed that the upstream sequences of genes across branches had similar promoter arrangements. The first promoter element in the upstream sequences of the Id, Ie, and IIb branches was predominantly a MeJA-responsive element. Most CeLBD genes upstream contained one or more cold-responsive or hormone-responsive elements, while drought-responsive elements were only partially present in CeLBDs.

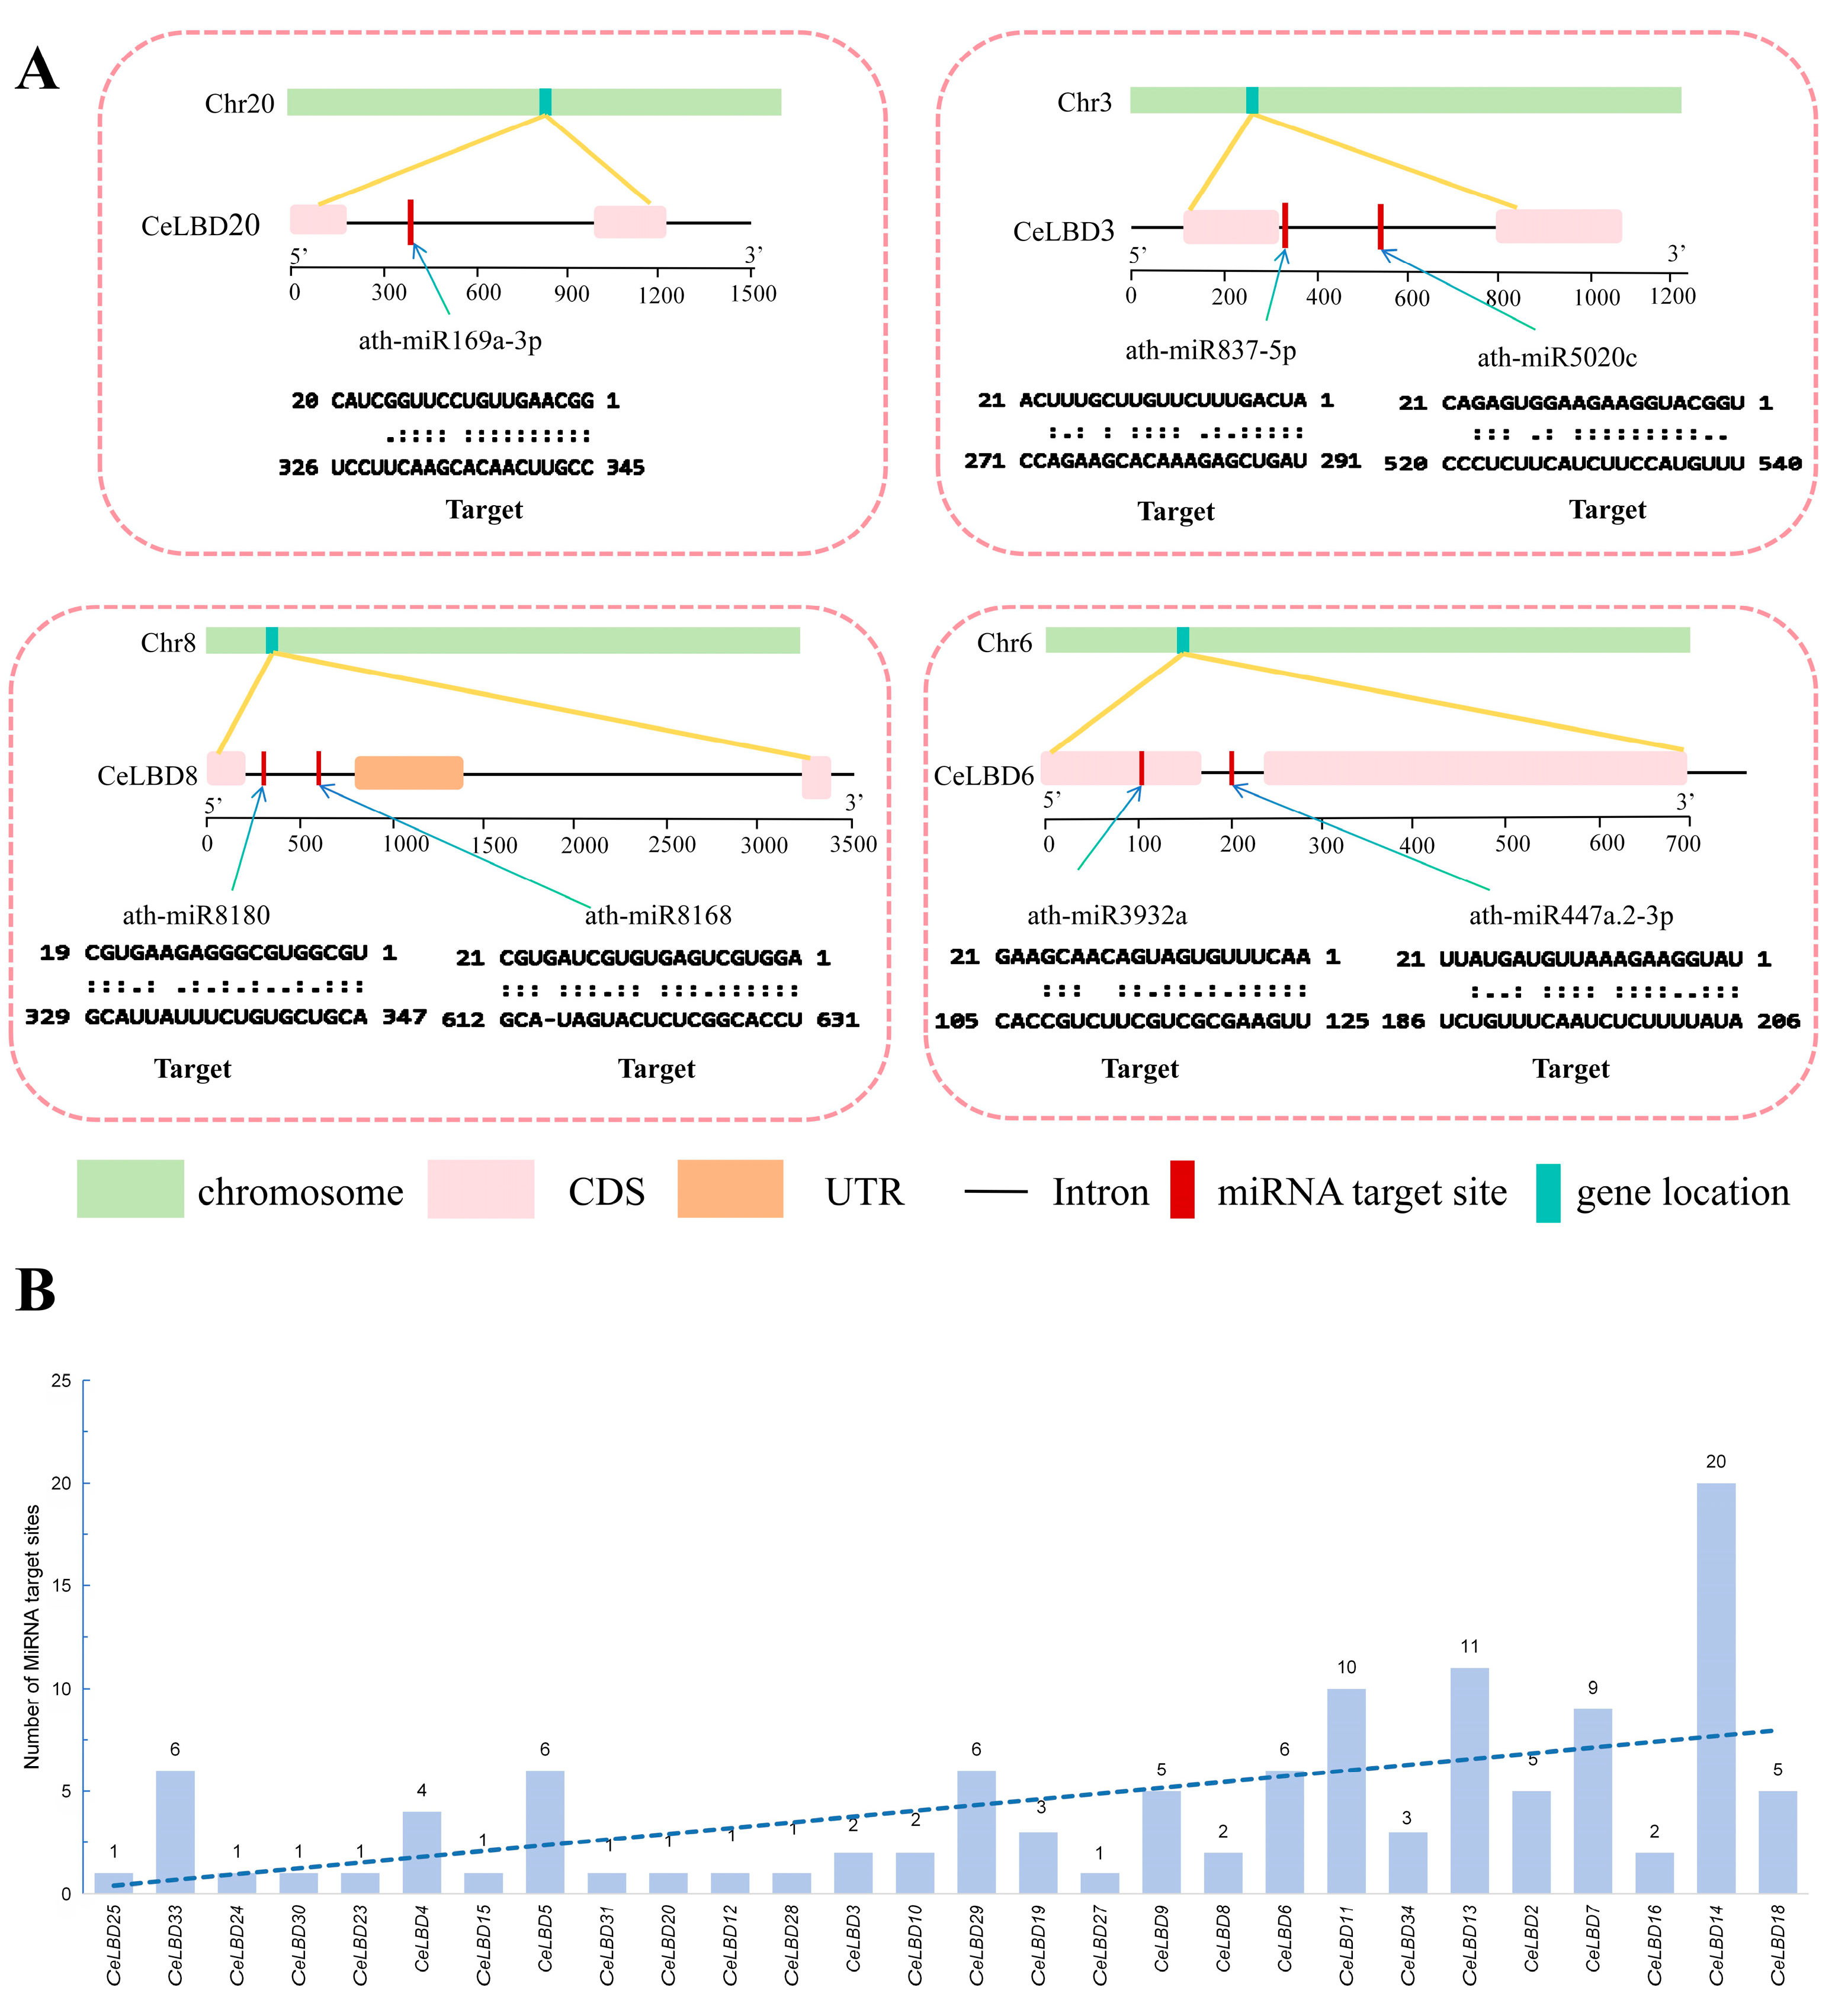
3.6. Prediction of miRNA Targets for 34 CeLBD Genes

In this study, we used the psRNATarget: A Plant Small RNA Target Analysis Server (2017 Update, https://www.zhaolab.org/psRNATarget/, accessed on 25 April 2024) to identify potential miRNAs that target the 34 members of the CeLBD gene family (Figure 6A and Supplementary Table S4). The results indicated that the 34 family members of the CeLBD genes can be targeted by a total of 77 miRNAs, involving a total of 187 target sites. With the exception of CeLBD17, CeLBD21, CeLBD22, and CeLBD26, each CeLBD gene had at least one target site, with CeLBD14 being the most targeted gene, harboring a total of 20 target sites. Recent findings highlight the involvement of miR395 and miR396 in regulating plant growth and development, as well as facilitating responses to a range of biotic and abiotic stresses. Notably, miR395 plays a crucial role in regulating sulfur metabolism in plants, thereby enhancing the plant’s adaptability to adverse conditions. miR395 and miR396-related occupy 17 out of the 187 target sites, indicating a complex regulatory network system between miRNAs and CeLBDs during stress responses in C. ensifolium. In addition, from the perspective of changes in the number of small RNA editing sites, CeLBD genes with larger protein molecular weights tend to have longer sequence lengths (Figure 6B). The presence of multiple small RNA editing sites correlates with lower transcription levels in genes such as CeLBD11, CeLBD13, and CeLBD14, which harbor over ten such sites. In contrast, larger proteins like CeLBD2, CeLBD18, and CeLBD7, with fewer than ten editing sites, exhibit relatively stable expression. This indicates that small RNAs may play a regulatory role in modulating the expression of CeLBD genes.

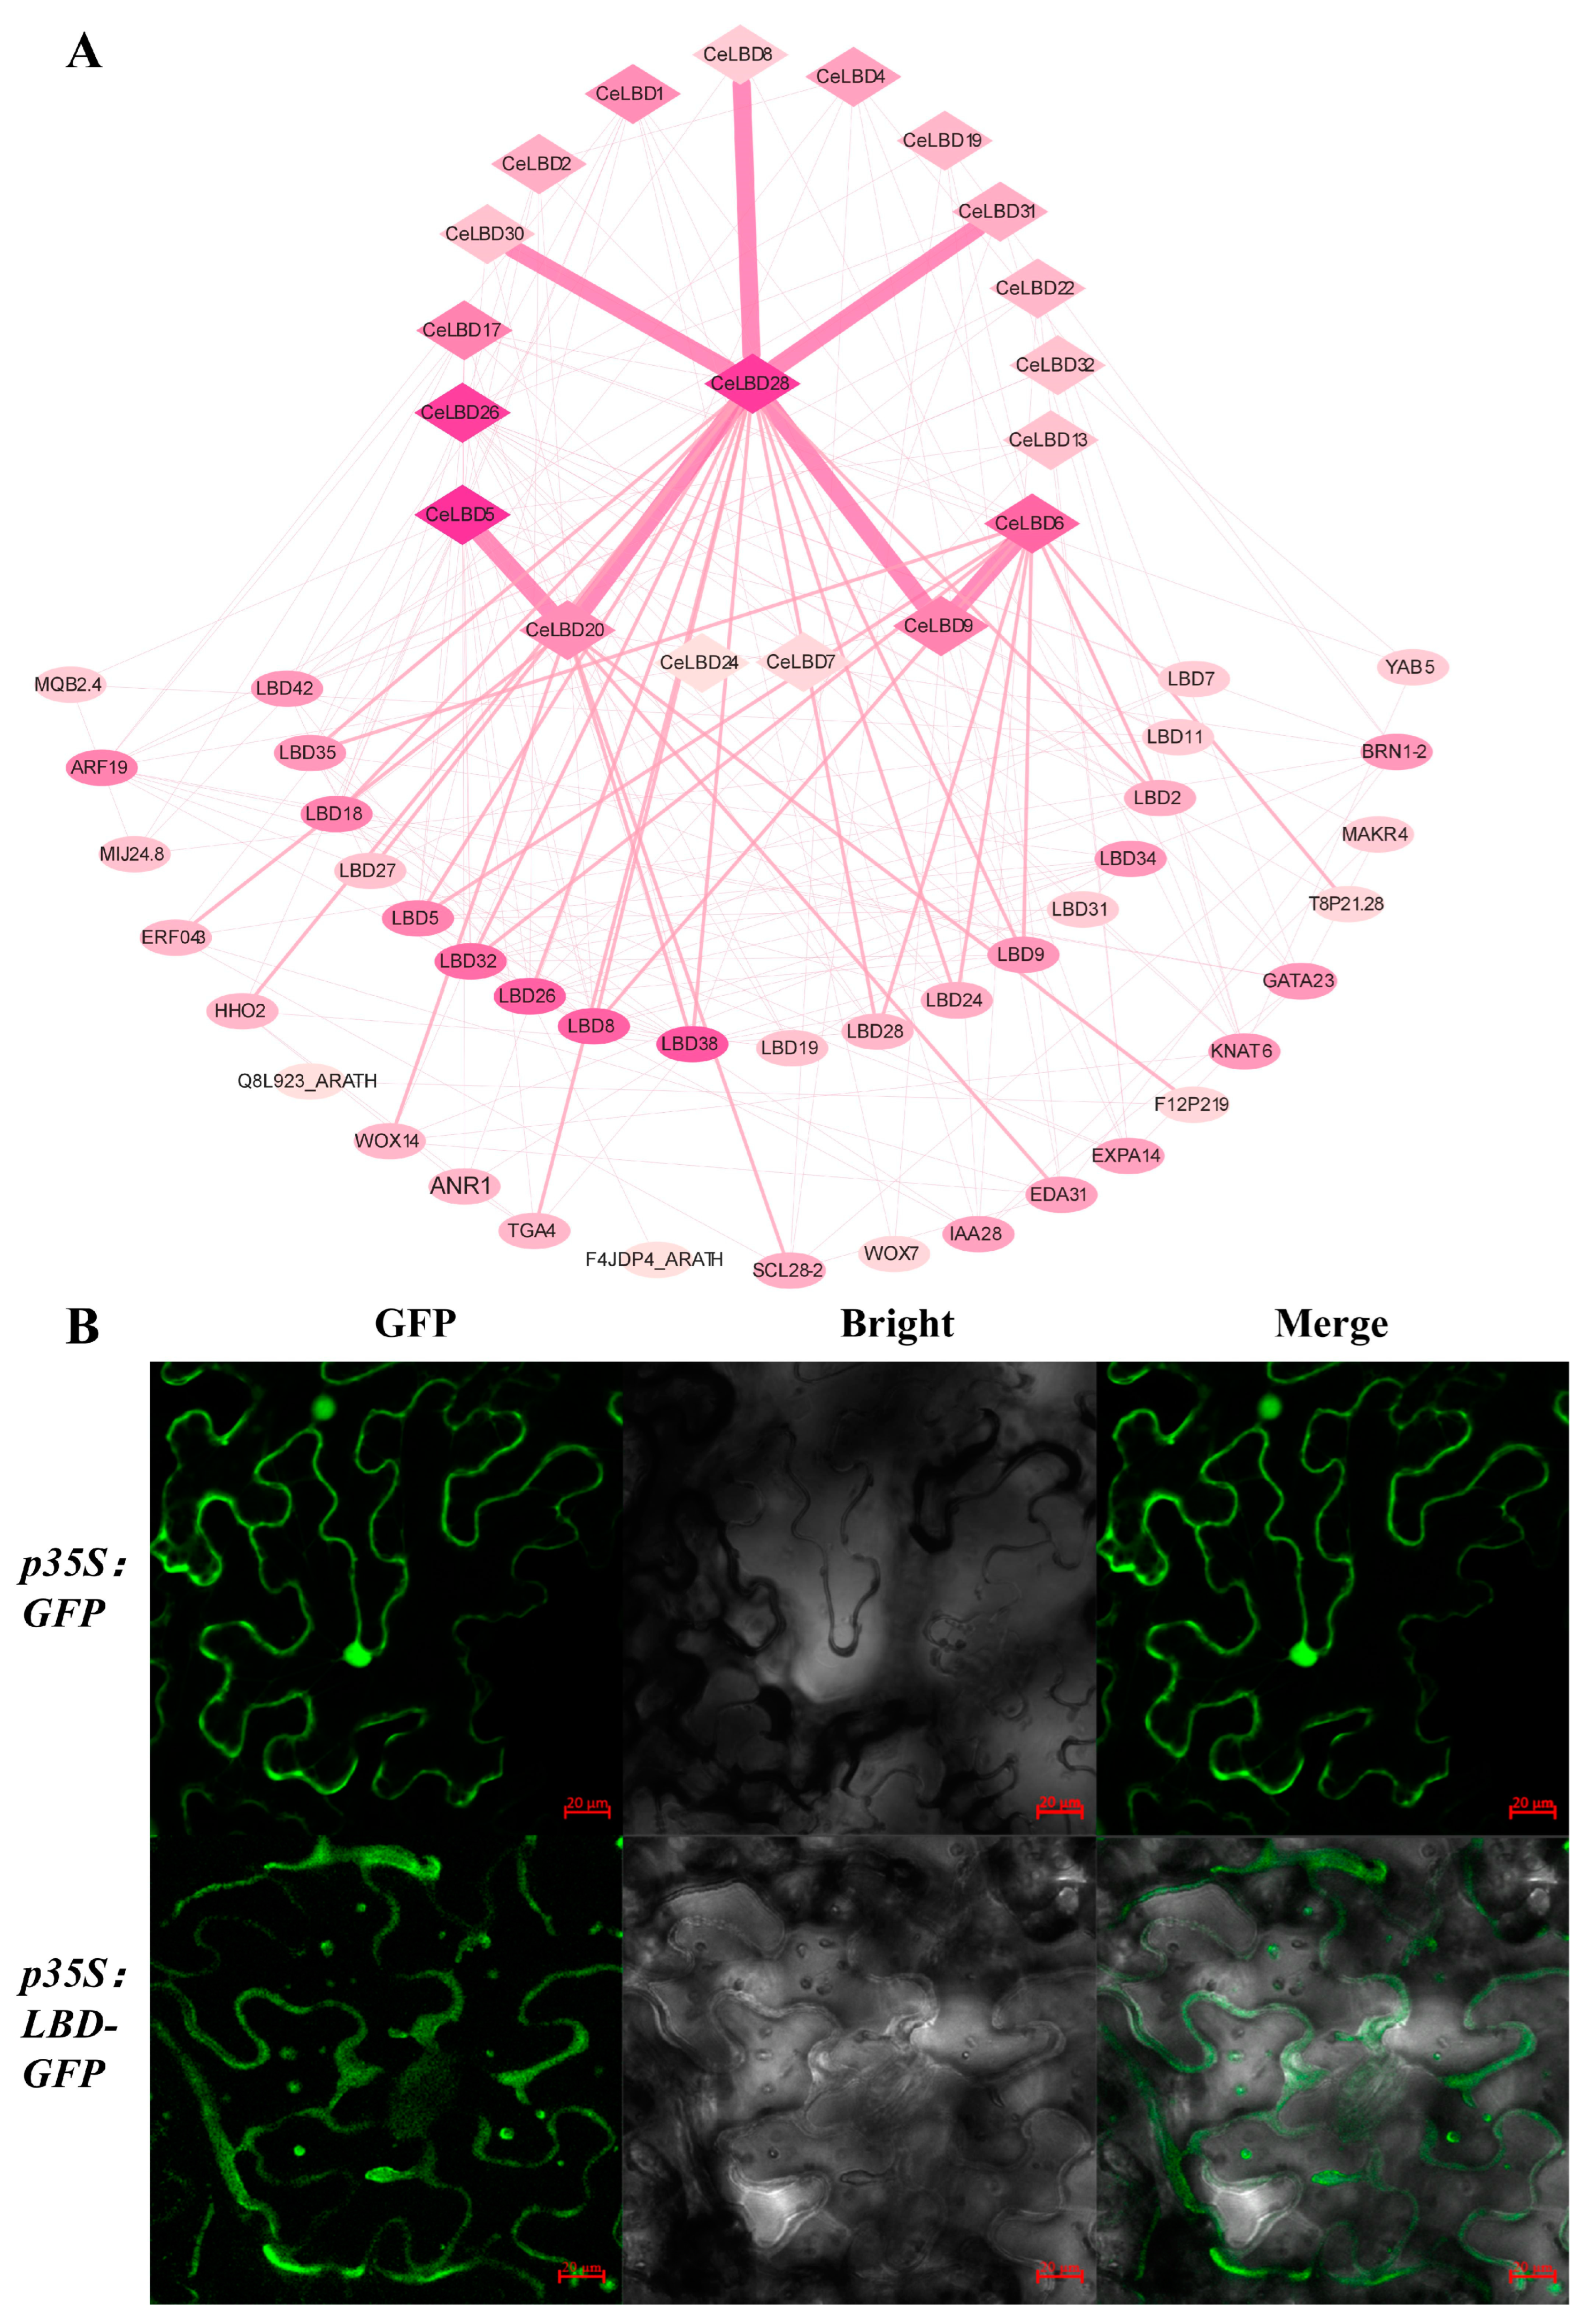
3.7. Co-Expression Network Analysis and Subcellular Localization of CeLBD Protein

PPI network prediction further elucidated the potential interactions among various CeLBD proteins (Figure 7A). Among the 34 CeLBD proteins, CeLBD28 was identified as potentially interacting with multiple CeLBDs, including CeLBD8, CeLBD9, CeLBD20, CeLBD30, and CeLBD31. CeLBD20 interacted with CeLBD5, and CeLBD9 interacted with CeLBD6. The outcomes of PPI predictions revealed that CeLBDs may facilitate the coordination of plant growth and marginal organ development by becoming part of protein complexes. For instance, LBD40, ARF19, LBD16, IAA14, IAA28, LAX3, WOX14, WOX7, and TGA4 are involved in the activation of auxin signaling pathways and the promotion of lateral root development. Genes such as SCL28, ERF086, and ANR1 may participate in enhancing the plant’s resistance to abiotic stresses like drought and freezing by regulating the expression of relevant genes. Notably, the interaction between CeLBDs and the Arabidopsis T8P21.28 protein was identified in the PPI network. These proteins primarily reside in the ribosomes of plant cytoplasm and are involved not only in the structure and function of ribosomes but also in plant growth and responses to environmental stresses. In this study, we chose CeLBD20, which interacts strongly with many other transcription factors, for protein expression localization. The results showed that it was mainly localized in the plant cytoplasm and formed small spots within the cytoplasm (Figure 7B). This aggregation may be due to protein–protein interactions forming complexes involved in specific biological processes such as signal transduction, which can enhance the efficiency and specificity of signaling. Consequently, this may regulate leaf morphogenesis and floral organ development in C. ensifolium, ultimately affecting plant growth and development and strengthening its adaptability to adverse conditions.

3.8. The Transcriptional Patterns of the CeLBD Genes and Co-Relation with JA Biosynthesis

By analyzing transcriptome data, we systematically classified and compared the expression patterns of CeLBDs in various tissues and developmental stages, revealing distinct tissue-specific expression levels (Figure 8A). Among all 34 CeLBDs, only CeLBD6 showed a relatively high expression level in all samples. More than one-third of the genes displayed low expression levels in all analyzed tissues, with some not being expressed at all, such as CeLBD21, CeLBD22, CeLBD4, and CeLBD5. Analysis revealed that, when compared to leaves and roots, the majority of CeLBDs demonstrated significantly higher expression levels in flowers. Notably, the expression of CeLBDs during flower development followed certain patterns; for instance, the expression levels of CeLBD28, CeLBD8, and CeLBD7 gradually decreased throughout the life cycle of the flower, while CeLBD18 and CeLBD27 peaked during the mid-bud stage before gradually declining. Interestingly, CeLBD3 was specifically highly expressed only in wilting flowers.
Utilizing the major fragrance compounds detected during the initial opening, full bloom, and decline stages of C. ensifolium ‘Xiaotao Hong’ flowers, combined with transcriptome data, we performed an analysis of gene expression trends (Figure 8B). The results showed that, apart from CeLBD4, CeLBD5, CeLBD13, CeLBD10, CeLBD21, and CeLBD22, which had extremely low expression levels during the flowering period, the other genes clustered into four expression patterns. The expression profiles of Cluster 3 aligned with the release patterns of fragrance compounds (particularly MeJA), including CeLBD1, CeLBD8, CeLBD3, CeLBD20, CeLBD30, CeLBD14, and CeLBD28. These genes likely have a certain association with the release of floral fragrance during the flowering period of C. ensifolium. Notably, the synthesis and release of floral fragrances typically lag behind the expression of the corresponding genes. Genes in Cluster 2, such as CeLBD6, exhibited a temporal offset with respect to fragrance emission, suggesting that their expression might also be associated with fragrance release. In contrast, the expression pattern of genes in Cluster 1 is completely opposite to the release of fragrance, while genes within Cluster 4 gradually increase during the flowering period, reaching their highest expression levels during full bloom. It is speculated that genes in these two clusters may have antagonistic effects on the release of floral fragrance in C. ensifolium.
To further validate the relationship between fragrance emission and LBD genes, we continued our analysis by combining fragrance data with the top 15 highly expressed CeLBD genes and the CeJMT (Jasmonic acid carboxyl methyltransferase) gene, creating an interactive Mantel test correlation heatmap (Figure 8C). The results showed that only CeLBD2 had no significant correlation with all fragrance compounds; CeLBD34’s expression had no significant correlation with MeJA (methyl jasmonate) and alloaromadendrene; the release of fragrance compounds other than MeJA was not significantly associated with CeLBDs’ expression. The release of MeJA showed a highly significant correlation with the expression of the JMT gene and several CeLBDs, including CeLBD6, CeLBD23, CeLBD26, and CeLBD34. Combining the expression correlation of JMT with these genes indicated that CeLBD6, CeLBD23, and CeLBD26 can co-express to promote the release of MeJA, while CeLBD34 may antagonize the JMT gene, inhibiting the release of MeJA during the flowering period.

3.9. Expression of CeLBD Genes in Response to Hormone Treatments and Abiotic Stress

To investigate the regulatory mechanisms of CeLBD genes in response to plant hormones and hormone treatments affecting growth, we selected ten genes that showed high expression in the transcriptome data and may have strong transcriptional activity and response. These genes were subjected to artificial treatments, and their expression levels were monitored over the course of one week post-treatment. The results (Figure 9A and Supplementary Table S6) indicated that under cold stress, most genes displayed a similar upregulation trend (except for CeLBD8 and CeLBD20). In a drought environment, gene expression was diverse. CeLBD2, CeLBD8, CeLBD20, CeLBD28, and CeLBD30 were significantly downregulated. Notably, CeLBD2 was almost entirely suppressed under drought-stress conditions. Conversely, CeLBD6 and CeLBD27 were the only genes that were upregulated. The results of ABA treatment clearly demonstrated that three genes (CeLBD2, CeLBD8, and CeLBD28) were significantly downregulated by the seventh day. Interestingly, the expression of CeLBD6 consistently showed a significant increase. Further correlation analysis revealed a strong correlation among certain genes, suggesting that the expression of these genes might be interrelated (CeLBD2, CeLBD3, CeLBD6, CeLBD27, CeLBD28, CeLBD30, and CeLBD34) (Figure 9B). Analysis of the trends in interconnectivity among the three treatments indicated that there was some positive correlation in gene expression under different treatments, but the correlations were not significant (Figure 9C). Thus, it is proposed that CeLBD genes have the potential to modulate the growth of C. ensifolium through synergistic responses to environmental shifts, exhibiting diverse expression patterns in response to various stimuli.

4. Discussion

4.1. The CeLBD Genes Were Relatively Primitive and Underwent Variation and Functional Differentiation at the Subbranch Level

Previous evolutionary analyses from algae to monocots and dicots showed that the number of LBD genes varies among different taxonomic groups, and the number of LBD family members increased from lower to higher plants [5]. The LBD family initially comprised only six members in the green alga (Cylindrocystis brebissonii). In moss (Physcomitrella patens) and basal angiosperm (Amborella trichopoda), the number of LBD genes expanded to 30 and 20 members, respectively. Subsequently, during the evolution of higher plants, the number of LBD genes continued to increase from this base [5]. Similarly, in monocots, Hordeum vulgare possesses 28 LBD genes, the model plant Oryza sativa has 37 LBD genes, and maize Zea mays has 49 LBD genes.
In this study, 34 CeLBD genes were identified in the C. ensifolium genome, consistent with the expansion trend of LBD genes during plant evolution. Phylogenetic analysis has revealed that LBD proteins are grouped into two main categories: Class I and Class II. Genes within these two groups exhibit significant functional divergence. Based on our results (Figure 1), we compared the numbers of genes in the major and minor branches among three plants. The Class I CeLBD genes were unevenly distributed across the Ia to Ie sub-clades and underwent different degrees of expansion and contraction during evolution, which may be related to the functions performed by each sub-clade and the natural selection they experienced during evolution. Specifically, most of the CeLBD genes in the branches cluster with AtLBD genes whose functions have been validated, and LBD genes within the same branch, typically possess relatively conserved functions. For instance, in the Ia branch, CeLBD20 and CeLBD12 clustered together with AtLBD3. AtLBD3 was previously found to cause dwarfing of plants and delayed inflorescence and flower development when over-expressed [17]. Therefore, it is speculated that CeLBD20 and CeLBD12 may share similar functions with AtLBD3 and participate in the feedback regulation of auxin response, thereby controlling the growth rate of plant organs. Similarly, the CeLBD3 gene, which had the highest expression level in the Ib branch, clusters with AtLBD15 and showed extremely high expression in large buds, indicating that this gene shares similar functions with AtLBD15 during flower opening. It can influence the maintenance of stem cells and the differentiation of surrounding regions in bracts and floral meristems by regulating the expression of WUS (WUSCHEL-like homeobox gene) [48], thereby affecting the growth and development of C. ensifolium. In the Ic branch, CeLBD17, which was homologous to AtLOB, had similar functions and may be involved in reactions related to flower organ development and anthocyanin accumulation [49]. However, research on genes in the Id branch is currently limited, and their specific functions require further investigation. Interestingly, we found that the number of genes in the Ie branch of C. ensifolium was less than others, and according to sequence alignment results, there is a significant loss of the LX6LX3LX6L motif in multiple genes within this branch (Figure 2 and Figure 3). Genomic collinearity analysis showed that the genes with the greatest variation in this branch underwent expansion during evolution. The pairs CeLBD9 and CeLBD10, and CeLBD21 and CeLBD22 underwent tandem duplication, accounting for half of all tandem duplications in CeLBD genes. Furthermore, the Ka/Ks values between gene pairs are close to zero, suggesting that the genes in the Ie branch have not experienced significant internal variation or evolved new functions. However, interestingly, although these genes with structural losses have undergone expansion in C. ensifolium, transcriptome data showed that the expression levels of genes in this branch were minimal. Particularly, the two pairs of genes involved in duplication events were almost undetectable in any tissue. Even CeLBD1, which had the highest expression level, cannot be transcribed or translated in roots, thus failing to exert its biological function in promoting root tissue differentiation. According to previous studies, this branch was primarily associated with the development of marginal organs in the underground parts of plants, especially the differentiation and growth of adventitious roots. This function has been repeatedly validated in A. thaliana [50]. However, in C. ensifolium, the roots in the underground part are fleshy and corona-like, lacking a prominent adventitious root system. Therefore, it is speculated that significant mutations during evolution have impaired the transcription of these genes, leading to the loss of their primary functions and contributing to the differences in root traits between C. ensifolium and other species. For the CeLBD genes in Branch II, there is only one gene, CeLBD26, in the entire IIa branch, which may have similar functions to AtLBD40 [16]. Therefore, it can be speculated that CeLBD26 in C. ensifolium can respond to GA (gibberellin) and other plant hormones to control seed germination, stem elongation, flower development, and various other physiological processes. In the IIb branch, CeLBD28 was highly conserved during evolution, with orthologous genes present in A. thaliana and Oryza sativa. Additionally, CeLBD28 exhibited segmental duplication with CeLBD5. Within the same branch, CeLBD5 and CeLBD6 also underwent segmental duplication, with Ka/Ks values being less than one, indicating that all genes in this branch were derived from the expansion of CeLBD28 and underwent purifying selection during evolution, performing very conserved functions and generating new traits. Previous studies have shown that all AtLBD genes in the IIb branch are related to flower development; therefore, it is speculated that the several conserved genes in this branch play a regulatory role in substance metabolism during the development of flowers and specific functional traits in C. ensifolium. In the IIb branch, CeLBD28 is highly conserved during evolution, with orthologous genes present in Arabidopsis (AtLBD30) and rice (OsLBD33). Additionally, CeLBD28 exhibits segmental duplication with CeLBD5. Within the same branch, CeLBD5 and CeLBD6 underwent tandem duplication (Figure 4), and the Ka/Ks values for these gene pairs are all less than one (Supplementary Table S3). This indicates that all genes in this branch are derived from the expansion of CeLBD28 and have undergone purifying selection during evolution, performing very conserved functions. Previous studies have shown that all Arabidopsis genes in the IIb branch are related to flower development [12]; therefore, it is speculated that the several conserved genes in this branch play a regulatory role in substance metabolism during the development of flowers and specific functional traits in C. ensifolium.

4.2. The CeLBD Gene Indirectly Regulates the Development of Orchid Flowers and the Release of Fragrance by Responding to Changes in External Abiotic Factors

During the flowering process of C. ensifolium, volatile lipids are the primary substances responsible for its delicate fragrance [51]. Methyl jasmonate (MeJA) is a major characteristic volatile organic compound in C. ensifolium. It also influences fruit ripening, pollen development, and root formation [52]. Current researchers report that although the LBD gene family does not directly participate in the jasmonic acid metabolic pathway, LBDs of subfamily II can interact with other transcription factors to regulate jasmonic acid synthesis, thereby controlling organ growth and enhancing stress resistance to some extent [53]. Based on cis-acting element predictions, the upstream regions of CeLBD6 and CeLBD5 genes, which have undergone tandem duplication in branch II, contain similar promoter elements, and the first 500 bp of both genes possess MeJA-responsive elements. This suggested that CeLBD genes responsive to methyl jasmonate may have important biological significance and have undergone expansion to some extent, providing more regulatory sequence variations. This has enhanced the responsiveness of CeLBDs to methyl jasmonate, allowing them to better adapt to different environmental conditions (Figure 5B). Notably, transcription factors such as CeLBD6 and CeLBD20 possessed LOB binding sites, suggesting that these genes may have self-activation capabilities or the ability to interact with other LBD proteins (Figure 5A). On the other hand, small RNA editing site prediction shows that the CDS of the key CeLBD6 gene can be cleaved by ath-miR393. This miRNA has been shown to target several transcription factors involved in plant growth, development, stress responses (both abiotic and biotic), and the synthesis and accumulation of secondary metabolites, thereby affecting plant defense mechanisms [54] (Figure 6A). PPI protein network prediction analysis shows that CeLBD28 can interact with multiple CeLBD proteins, including potential further interactions between CeLBD5 and CeLBD20, as well as CeLBD9 and CeLBD6. These CeLBD proteins also have the potential to bind to other transcription factors such as ARF, ERF, and WOX. Notably, many organelle proteins, such as T8P21.28, can also interact with CeLBD proteins (Figure 7A). Subcellular localization analysis of CeLBD20 revealed a punctate pattern in the cytoplasm, indicating that this protein may form complexes with other proteins in the cytoplasm to participate in signal transduction functions or may be distributed in organelles such as mitochondria (Figure 7B). Expression pattern analysis of CeLBD genes in different organs and flower developmental stages of C. ensifolium showed that CeLBD6 is highly expressed in all organs, significantly surpassing other CeLBDs. It maintains high expression during flower opening and reaches its peak from the bud stage to the initial opening stage (Figure 8A). To validate the association between CeLBDs and methyl jasmonate (MeJA) release, we analyzed the correlation between the expression of these genes and the release of four major floral volatiles during the initial opening, full blooming, and senescence stages of C. ensifolium flowers. The results show that CeLBD genes cluster to varying degrees in the transcriptional regulation before, during, and after the release of floral volatiles (Figure 8B). The release of MeJA is strongly associated not only with the expression of the JMT (jasmonate acid carboxyl methyltransferase) gene but also with CeLBD23, CeLBD26, CeLBD6, and CeLBD34. CeLBD2 is associated with the release of all major floral volatiles (Figure 8C). The expression of specific CeLBD genes is closely linked to the release patterns of floral volatiles in C. ensifolium. Specifically, CeLBD6 from subfamily II clusters in Cluster 2 during flower opening and is significantly correlated with MeJA release and JMT gene expression. Therefore, we can infer that during the flowering period of C. ensifolium, CeLBD6 functions similarly to the studied SlLBD40 [53], interacting with other transcription factors to regulate MeJA synthesis. After flower opening, as MeJA concentration increases, CeLBD6 expression is subject to negative feedback regulation and gradually decreases.
In order to further confirm the regulatory expression patterns of CeLBDs, we analyzed their expression under conditions of cold stress (4 °C), drought stress using PEG6000, and ABA hormone stimulation. Under different environmental stresses, the expression patterns of CeLBD gene family members showed significant differences: most genes were upregulated under cold stress, with exceptions being CeLBD8 and CeLBD20; under drought stress, gene expression was diverse, with CeLBD2 being significantly inhibited and CeLBD6 and CeLBD27 being significantly upregulated; under ABA treatment, CeLBD2, CeLBD8, and CeLBD28 were significantly downregulated, while CeLBD6 was consistently upregulated. Correlation analysis revealed strong correlations between certain genes, suggesting that CeLBD genes may regulate the growth of C. ensifolium through synergistic effects in response to environmental changes and exhibit different expression patterns under various stimuli. Notably, CeLBD6 showed significant changes in expression under all treatments and was consistently upregulated over 7 days, indicating that this gene may have a central function within the CeLBD gene family (Figure 9). Therefore, it is speculated that significant mutations during evolution have impaired the transcription of these genes, leading to the loss of their primary functions and contributing to the differences in root traits between C. ensifolium and other species. Additionally, its expression is specifically upregulated under most environmental changes. This gene likely acts as a signaling factor, interacting with other transcription factors to directly or indirectly influence the expression of JA pathway-related genes, thereby further regulating the synthesis of MeJA to affect the development of floral organs and a series of biological functions during this process.
In summary, future studies can further explore the relationship between CeLBD6 expression, MeJA variation, and stress responses in C. ensifolium and related plants through more in-depth experimental validation. First, exogenous MeJA treatments can be applied to floral organs of C. ensifolium to observe changes in CeLBD expression and establish upstream and downstream regulatory relationships. Once initial findings are confirmed, overexpression of CeLBD6 in plants can be conducted to investigate changes in the expression of MeJA biosynthesis pathway genes and the accumulation of related metabolites. Alternatively, silencing techniques can be used to knock down CeLBD6 expression, analyzing the expression levels of MeJA biosynthesis-related genes and the physiological responses of plants to determine the specific function of CeLBD6. Additionally, using protein interaction network data and future experimental results, the co-expression patterns of CeLBD6 with MeJA biosynthesis-related genes can be evaluated. Further validation of its role in the pathway can be achieved through BiFC (Bimolecular Fluorescence Complementation) and Y2H (Yeast Two-Hybrid) experiments.

5. Conclusions

In this study, 34 CeLBD genes were identified in the genome of C. ensifolium, which are unevenly distributed across 15 chromosomes and 2 uncher_scaffolds. The CeLBD genes were relatively primitive and underwent variation and functional differentiation at the subfamily level. Multiple CeLBD genes in the Ie branch lost the LX6LX3LX6L motif, leading to low or absent expression in various tissues and the loss of primary functions. Partial CeLBD genes undergone segmental duplication and tandem duplication. Taking together the results of promoter binding elements and miRNA site data, CeLBDs may participate in the regulation of core Me-JA metabolism and the response pathway. CeLBD6 is significantly upregulated under various environmental stresses, including cold, drought, and ABA treatment. By analyzing the specific expression of CeLBDs under various environmental stresses and their association with the release of aromatic compounds, we proposed a correlation model that CeLBD6 may respond to environmental stresses by interacting with other transcription factors, indirectly influencing the expression of JA pathway-related genes. These findings provide clues for a deeper understanding of the molecular mechanisms of the LBD gene family in C. ensifolium and other plants. It is believed that under the stable gene editing system of orchids in the future, the function of related LBD can further confirm and assist in the development of new cultivars and breeding systems in orchids.

Supplementary Materials

The following supporting information can be downloaded at: https://www.mdpi.com/article/10.3390/horticulturae11020117/s1, Figure S1: Secondary and Tertiary structure protein structure analysis of CeLBDs. Table S1: Sequences of LBD proteins in Arabidopsis thaliana, Oryza indica, and Cymbidium ensifolium. Table S2: Protein information of LBD proteins in Cymbidium ensifolium. Table S3: The CeLBD genes involved in repeated events and their Ka/Ks values. Table S4: Small RNA editing sites in CeLBD predicted using Arabidopsis thaliana miRNAs as probes. Table S5: Homologous recombination and qRT PCR Primers for CeLBDs. Table S6: The correlation between CeLBD gene expression changes and their corresponding treatmeng conditions.

Author Contributions

K.Z., Z.-J.L. and Y.Z. (Yuzhen Zhou): Conceptualization, Methodology, Supervision, Writing—Review & editing; Y.P. and S.Z.: Data curation. Y.P.: Writing—Original draft preparation; R.H., Q.S., Y.Z. (Yuqing Zhao), F.T., H.W., X.L. and L.-H.Z.: Resources. All authors have read and agreed to the published version of the manuscript.

Funding

The Project of National Key R & D Program (2023YFD1600504), the National Natural Science Foundation of China (No. 32101583), Fujian Provincial Natural Science Foundation of China (2023J01283), the Innovation and Application Engineering Technology Research Center of Ornamental Plant Germplasm Resources in Fujian Province (No. 115-PTJH16005).

Data Availability Statement

The raw genome data and assembled C. ensifolium genome were submitted to National Genomics Data Center (NGDC) database with the accession number PRJCA005355/CRA004327 and GWHBCII00000000. The raw transcriptome sequences have been deposited in the BioProject of GSA under the accession codes PRJCA009885/CRA007101 and PRJCA005426/CRA004351, respectively. All data generated or analyzed during this study are included in this published article (Supplementary Materials) and also available from the corresponding author on reasonable request.

Acknowledgments

We would like to thank the editor and reviewers for their helpful comments on the manuscript.

Conflicts of Interest

The authors declare that the research was conducted in the absence of any commercial or financial relationships that could be construed as a potential conflict of interest.

References

  1. Shuai, B.; Reynaga-Pena, C.G.; Springer, P.S. The lateral organ boundaries gene defines a novel, plant-specific gene family. Plant Physiol. 2002, 129, 747–761. [Google Scholar] [CrossRef] [PubMed]
  2. Majer, C.; Hochholdinger, F. Defining the boundaries: Structure and function of LOB domain proteins. Trends Plant Sci. 2011, 16, 47–52. [Google Scholar] [CrossRef] [PubMed]
  3. Lee, H.W.; Kim, M.J.; Park, M.Y.; Han, K.H.; Kim, J. The conserved proline residue in the LOB domain of LBD18 is critical for DNA-binding and biological function. Mol. Plant 2013, 6, 1722–1725. [Google Scholar] [CrossRef] [PubMed]
  4. Kong, Y.; Xu, P.; Jing, X.; Chen, L.; Li, L.; Li, X. Decipher the ancestry of the plant-specific LBD gene family. BMC Genom. 2017, 18, 951. [Google Scholar] [CrossRef] [PubMed]
  5. Zhang, Y.; Li, Z.; Ma, B.; Hou, Q.; Wan, X. Phylogeny and Functions of LOB Domain Proteins in Plants. Int. J. Mol. Sci. 2020, 21, 2278. [Google Scholar] [CrossRef]
  6. Jhu, M.Y.; Ichihashi, Y.; Farhi, M.; Wong, C.; Sinha, N.R. LATERAL ORGAN BOUNDARIES DOMAIN 25 functions as a key regulator of haustorium development in dodders. Plant Physiol. 2021, 186, 2093–2110. [Google Scholar] [CrossRef]
  7. Liu, L.; Zhang, J.; Xu, J.; Li, Y.; Guo, L.; Wang, Z.; Zhang, X.; Zhao, B.; Guo, Y.D.; Zhang, N. CRISPR/Cas9 targeted mutagenesis of SlLBD40, a lateral organ boundaries domain transcription factor, enhances drought tolerance in tomato. Plant Sci. 2020, 301, 110683. [Google Scholar] [CrossRef]
  8. Feng, S.; Shi, J.; Hu, Y.; Li, D.; Guo, L.; Zhao, Z.; Lee, G.S.; Qiao, Y. Genome-Wide Analysis of Soybean Lateral Organ Boundaries Domain Gene Family Reveals the Role in Phytophthora Root and Stem Rot. Front. Plant Sci. 2022, 13, 865165. [Google Scholar] [CrossRef] [PubMed]
  9. Jiang, X.; Cui, H.; Wang, Z.; Kang, J.; Yang, Q.; Guo, C. Genome-Wide Analysis of the LATERAL ORGAN BOUNDARIES Domain (LBD) Members in Alfalfa and the Involvement of MsLBD48 in Nitrogen Assimilation. Int. J. Mol. Sci. 2023, 24, 4644. [Google Scholar] [CrossRef] [PubMed]
  10. Rong, M.; Gao, S.X.; Wen, D.; Xu, Y.H.; Wei, J.H. The LOB domain protein, a novel transcription factor with multiple functions: A review. Plant Physiol. Biochem. 2024, 214, 108922. [Google Scholar] [CrossRef]
  11. Mangeon, A.; Bell, E.M.; Lin, W.C.; Jablonska, B.; Springer, P.S. Misregulation of the LOB domain gene DDA1 suggests possible functions in auxin signalling and photomorphogenesis. J. Exp. Bot. 2011, 62, 221–233. [Google Scholar] [CrossRef] [PubMed]
  12. Rubin, G.; Tohge, T.; Matsuda, F.; Saito, K.; Scheible, W.R. Members of the LBD family of transcription factors repress anthocyanin synthesis and affect additional nitrogen responses in Arabidopsis. Plant Cell 2009, 21, 3567–3584. [Google Scholar] [CrossRef] [PubMed]
  13. Albinsky, D.; Kusano, M.; Higuchi, M.; Hayashi, N.; Kobayashi, M.; Fukushima, A.; Mori, M.; Ichikawa, T.; Matsui, K.; Kuroda, H.; et al. Metabolomic screening applied to rice FOX Arabidopsis lines leads to the identification of a gene-changing nitrogen metabolism. Mol. Plant 2010, 3, 125–142. [Google Scholar] [CrossRef]
  14. Li, C.; Zhu, S.; Zhang, H.; Chen, L.; Cai, M.; Wang, J.; Chai, J.; Wu, F.; Cheng, Z.; Guo, X.; et al. OsLBD37 and OsLBD38, two class II type LBD proteins, are involved in the regulation of heading date by controlling the expression of Ehd1 in rice. Biochem. Biophys. Res. Commun. 2017, 486, 720–725. [Google Scholar] [CrossRef]
  15. Yu, P.; Gutjahr, C.; Li, C.; Hochholdinger, F. Genetic Control of Lateral Root Formation in Cereals. Trends Plant Sci. 2016, 21, 951–961. [Google Scholar] [CrossRef]
  16. Zentella, R.; Zhang, Z.L.; Park, M.; Thomas, S.G.; Endo, A.; Murase, K.; Fleet, C.M.; Jikumaru, Y.; Nambara, E.; Kamiya, Y.; et al. Global analysis of della direct targets in early gibberellin signaling in Arabidopsis. Plant Cell 2007, 19, 3037–3057. [Google Scholar] [CrossRef]
  17. Naito, T.; Yamashino, T.; Kiba, T.; Koizumi, N.; Kojima, M.; Sakakibara, H.; Mizuno, T. A link between cytokinin and ASL9 (ASYMMETRIC LEAVES 2 LIKE 9) that belongs to the AS2/LOB (LATERAL ORGAN BOUNDARIES) family genes in Arabidopsis thaliana. Biosci. Biotechnol. Biochem. 2007, 71, 1269–1278. [Google Scholar] [CrossRef]
  18. Geng, L.; Tan, M.; Deng, Q.; Wang, Y.; Zhang, T.; Hu, X.; Ye, M.; Lian, X.; Zhou, D.X.; Zhao, Y. Transcription factors WOX11 and LBD16 function with histone demethylase JMJ706 to control crown root development in rice. Plant Cell 2024, 36, 1777–1790. [Google Scholar] [CrossRef] [PubMed]
  19. Kirolinko, C.; Hobecker, K.; Cueva, M.; Botto, F.; Christ, A.; Niebel, A.; Ariel, F.; Blanco, F.A.; Crespi, M.; Zanetti, M.E. A lateral organ boundaries domain transcription factor acts downstream of the auxin response factor 2 to control nodulation and root architecture in Medicago truncatula. New Phytol. 2024, 242, 2746–2762. [Google Scholar] [CrossRef]
  20. Liu, Y.; An, X.H.; Liu, H.; Zhang, T.; Li, X.; Liu, R.; Li, C.; Tian, Y.; You, C.; Wang, X.F. Cloning and functional identification of apple LATERAL ORGAN BOUNDARY DOMAIN 3 (LBD3) transcription factor in the regulation of drought and salt stress. Planta 2024, 259, 125. [Google Scholar] [CrossRef]
  21. Shi, Y.; Vrebalov, J.; Zheng, H.; Xu, Y.; Yin, X.; Liu, W.; Liu, Z.; Sorensen, I.; Su, G.; Ma, Q.; et al. A tomato LATERAL ORGAN BOUNDARIES transcription factor, SlLOB1, predominantly regulates cell wall and softening components of ripening. Proc. Natl. Acad. Sci. USA 2021, 118, e2102486118. [Google Scholar] [CrossRef] [PubMed]
  22. Jiao, P.; Wei, X.; Jiang, Z.; Liu, S.; Guan, S.; Ma, Y. ZmLBD2 a maize (Zea mays L.) lateral organ boundaries domain (LBD) transcription factor enhances drought tolerance in transgenic Arabidopsis thaliana. Front. Plant Sci. 2022, 13, 1000149. [Google Scholar] [CrossRef]
  23. Dong, L.; Manghwar, H. Genome-wide expression analysis of LBD genes in tomato (Solanum lycopersicum L.) under different light conditions. Plant Signal. Behav. 2023, 18, 2290414. [Google Scholar] [CrossRef]
  24. Liu, W.; Yu, J.; Ge, Y.; Qin, P.; Xu, L. Pivotal role of LBD16 in root and root-like organ initiation. Cell. Mol. Life Sci. 2018, 75, 3329–3338. [Google Scholar] [CrossRef] [PubMed]
  25. Hu, Y.; Zhang, J.; Jia, H.; Sosso, D.; Li, T.; Frommer, W.B.; Yang, B.; White, F.F.; Wang, N.; Jones, J.B. Lateral organ boundaries 1 is a disease susceptibility gene for citrus bacterial canker disease. Proc. Natl. Acad. Sci. USA 2014, 111, E521–E529. [Google Scholar] [CrossRef]
  26. Xu, C.; Luo, F.; Hochholdinger, F. LOB Domain Proteins: Beyond Lateral Organ Boundaries. Trends Plant Sci. 2016, 21, 159–167. [Google Scholar] [CrossRef]
  27. Yu, Q.; Hu, S.; Du, J.; Yang, Y.; Sun, X. Genome-wide identification and characterization of the lateral organ boundaries domain gene family in Brassica rapa var. rapa. Plant Divers 2020, 42, 52–60. [Google Scholar] [CrossRef]
  28. Perez-Escobar, O.A.; Bogarin, D.; Przelomska, N.A.S.; Ackerman, J.D.; Balbuena, J.A.; Bellot, S.; Buhlmann, R.P.; Cabrera, B.; Cano, J.A.; Charitonidou, M.; et al. The origin and speciation of orchids. New Phytol. 2024, 242, 700–716. [Google Scholar] [CrossRef]
  29. Zheng, R.; Chen, J.; Peng, Y.; Zhu, X.; Niu, M.; Chen, X.; Xie, K.; Huang, R.; Zhan, S.; Su, Q.; et al. General Analysis of Heat Shock Factors in the Cymbidium ensifolium Genome Provided Insights into Their Evolution and Special Roles with Response to Temperature. Int. J. Mol. Sci. 2024, 25, 1002. [Google Scholar] [CrossRef] [PubMed]
  30. Ba, L.J.; Kuang, J.F.; Chen, J.Y.; Lu, W.J. MaJAZ1 Attenuates the MaLBD5-Mediated Transcriptional Activation of Jasmonate Biosynthesis Gene MaAOC2 in Regulating Cold Tolerance of Banana Fruit. J. Agric. Food Chem. 2016, 64, 738–745. [Google Scholar] [CrossRef]
  31. Ai, Y.; Li, Z.; Sun, W.H.; Chen, J.; Zhang, D.; Ma, L.; Zhang, Q.H.; Chen, M.K.; Zheng, Q.D.; Liu, J.F.; et al. The Cymbidium genome reveals the evolution of unique morphological traits. Hortic. Res. 2021, 8, 255. [Google Scholar] [CrossRef] [PubMed]
  32. Mount, D.W. Using the Basic Local Alignment Search Tool (BLAST). Cold Spring Harb. Protoc. 2007, 2007, pdb top17. [Google Scholar] [CrossRef] [PubMed]
  33. Finn, R.D.; Coggill, P.; Eberhardt, R.Y.; Eddy, S.R.; Mistry, J.; Mitchell, A.L.; Potter, S.C.; Punta, M.; Qureshi, M.; Sangrador-Vegas, A.; et al. The Pfam protein families database: Towards a more sustainable future. Nucleic Acids Res. 2016, 44, D279–D285. [Google Scholar] [CrossRef] [PubMed]
  34. Artimo, P.; Jonnalagedda, M.; Arnold, K.; Baratin, D.; Csardi, G.; de Castro, E.; Duvaud, S.; Flegel, V.; Fortier, A.; Gasteiger, E.; et al. ExPASy: SIB bioinformatics resource portal. Nucleic Acids Res. 2012, 40, W597–W603. [Google Scholar] [CrossRef] [PubMed]
  35. Li, J.; Wang, Z.; Qi, B.; Zhang, J.; Yang, H. MEMe: A Mutually Enhanced Modeling Method for Efficient and Effective Human Pose Estimation. Sensors 2022, 22, 632. [Google Scholar] [CrossRef] [PubMed]
  36. Geourjon, C.; Deleage, G. SOPMA: Significant improvements in protein secondary structure prediction by consensus prediction from multiple alignments. Bioinformatics 1995, 11, 681–684. [Google Scholar] [CrossRef]
  37. Zhao, C.; Liu, T.; Wang, Z. PANDA-3D: Protein function prediction based on AlphaFold models. NAR Genom. Bioinform. 2024, 6, lqae094. [Google Scholar] [CrossRef]
  38. Janson, G.; Paiardini, A. PyMod 3: A complete suite for structural bioinformatics in PyMOL. Bioinformatics 2021, 37, 1471–1472. [Google Scholar] [CrossRef]
  39. Letunic, I.; Bork, P. Interactive Tree of Life (iTOL) v6: Recent updates to the phylogenetic tree display and annotation tool. Nucleic Acids Res. 2024, 52, W78–W82. [Google Scholar] [CrossRef] [PubMed]
  40. Wang, Y.; Tang, H.; Debarry, J.D.; Tan, X.; Li, J.; Wang, X.; Lee, T.H.; Jin, H.; Marler, B.; Guo, H.; et al. MCScanX: A toolkit for detection and evolutionary analysis of gene synteny and collinearity. Nucleic Acids Res. 2012, 40, e49. [Google Scholar] [CrossRef]
  41. Wang, D.; Zhang, Y.; Zhang, Z.; Zhu, J.; Yu, J. KaKs_Calculator 2.0: A toolkit incorporating gamma-series methods and sliding window strategies. Genom. Proteom. Bioinform. 2010, 8, 77–80. [Google Scholar] [CrossRef] [PubMed]
  42. Chen, C.; Wu, Y.; Li, J.; Wang, X.; Zeng, Z.; Xu, J.; Liu, Y.; Feng, J.; Chen, H.; He, Y.; et al. TBtools-II: A “one for all, all for one” bioinformatics platform for biological big-data mining. Mol. Plant 2023, 16, 1733–1742. [Google Scholar] [CrossRef]
  43. Li, J.; Xu, C.; Wang, L.; Liang, H.; Feng, W.; Cai, Z.; Wang, Y.; Cong, W.; Liu, Y. PSRna: Prediction of small RNA secondary structures based on reverse complementary folding method. J. Bioinform. Comput. Biol. 2016, 14, 1643001. [Google Scholar] [CrossRef] [PubMed]
  44. Chow, C.N.; Yang, C.W.; Wu, N.Y.; Wang, H.T.; Tseng, K.C.; Chiu, Y.H.; Lee, T.Y.; Chang, W.C. PlantPAN 4.0: Updated database for identifying conserved non-coding sequences and exploring dynamic transcriptional regulation in plant promoters. Nucleic Acids Res. 2024, 52, D1569–D1578. [Google Scholar] [CrossRef]
  45. Otasek, D.; Morris, J.H.; Boucas, J.; Pico, A.R.; Demchak, B. Cytoscape Automation: Empowering workflow-based network analysis. Genome Biol. 2019, 20, 185. [Google Scholar] [CrossRef] [PubMed]
  46. Lyu, F.; Han, F.; Ge, C.; Mao, W.; Chen, L.; Hu, H.; Chen, G.; Lang, Q.; Fang, C. OmicStudio: A composable bioinformatics cloud platform with real-time feedback that can generate high-quality graphs for publication. Imeta 2023, 2, e85. [Google Scholar] [CrossRef] [PubMed]
  47. Peng, Y.; Zhao, K.; Zheng, R.; Chen, J.; Zhu, X.; Xie, K.; Huang, R.; Zhan, S.; Su, Q.; Shen, M.; et al. A Comprehensive Analysis of Auxin Response Factor Gene Family in Melastoma dodecandrum Genome. Int. J. Mol. Sci. 2024, 25, 806. [Google Scholar] [CrossRef]
  48. Ohashi-Ito, K.; Iwamoto, K.; Fukuda, H. LOB DOMAIN-CONTAINING PROTEIN 15 Positively Regulates Expression of VND7, a Master Regulator of Tracheary Elements. Plant Cell Physiol. 2018, 59, 989–996. [Google Scholar] [CrossRef]
  49. Bell, E.M.; Lin, W.C.; Husbands, A.Y.; Yu, L.; Jaganatha, V.; Jablonska, B.; Mangeon, A.; Neff, M.M.; Girke, T.; Springer, P.S. Arabidopsis lateral organ boundaries negatively regulates brassinosteroid accumulation to limit growth in organ boundaries. Proc. Natl. Acad. Sci. USA 2012, 109, 21146–21151. [Google Scholar] [CrossRef]
  50. Zhang, F.; Wang, J.; Ding, T.; Lin, X.; Hu, H.; Ding, Z.; Tian, H. MYB2 and MYB108 regulate lateral root development by interacting with LBD29 in Arabidopsis thaliana. J. Integr. Plant Biol. 2024, 66, 1675–1687. [Google Scholar] [CrossRef]
  51. Huang, M.; Ma, C.; Yu, R.; Mu, L.; Hou, J.; Yu, Y.; Fan, Y. Concurrent changes in methyl jasmonate emission and the expression of its biosynthesis-related genes in Cymbidium ensifolium flowers. Physiol. Plant. 2015, 153, 503–512. [Google Scholar] [CrossRef] [PubMed]
  52. Yu, X.; Zhang, W.; Zhang, Y.; Zhang, X.; Lang, D.; Zhang, X. The roles of methyl jasmonate to stress in plants. Funct. Plant Biol. 2019, 46, 197–212. [Google Scholar] [CrossRef]
  53. Liu, L.; Zhang, J.; Xu, J.; Li, Y.; Lv, H.; Wang, F.; Guo, J.; Lin, T.; Zhao, B.; Li, X.X.; et al. SlMYC2 promotes SlLBD40-mediated cell expansion in tomato fruit development. Plant J. 2024, 118, 1872–1888. [Google Scholar] [CrossRef] [PubMed]
  54. Zhao, J.; Yuan, S.; Zhou, M.; Yuan, N.; Li, Z.; Hu, Q.; Bethea, F.G., Jr.; Liu, H.; Li, S.; Luo, H. Transgenic creeping bentgrass overexpressing Osa-miR393a exhibits altered plant development and improved multiple stress tolerance. Plant Biotechnol. J. 2019, 17, 233–251. [Google Scholar] [CrossRef] [PubMed]
Figure 1. (A) Phylogenetic trees of LBD proteins for C. ensifolium, O. sativa, and A. thaliana. The tree is divided into seven classes and represented by different colors. (B) Proportions of branches from the three plants within the total number of branches; blue shading indicates Class I, while green shading indicates Class II. (C) Box plots comparing the physicochemical properties of proteins in Class I versus Class II.
Horticulturae 11 00117 g001
Figure 2. Sequence alignment analysis of CeLBD proteins. Darker colors represent more conservative.
Horticulturae 11 00117 g002
Figure 3. Conserved motifs and gene structure analysis of CeLBDs: (A) Conserved motif with phylogenetic relationships of CeLBDs. (B) Gene structure statistics of LBD gene classes. (C) Amino acid sequence of the conserved motif of CeLBDs. The motif outlined in red frames is a conserved structural domain that constitutes the LOD domain.
Horticulturae 11 00117 g003
Figure 4. (A) Chromosomal locations and duplication of the CeLBDs in the C. ensifolium genome. The red lines inside indicate pairs of CeLBDs involved in segmental duplication, while the lines outside represent Tandem duplicated: a: The orange line represents gene density. b: The depth of the fragment’s color indicates gene density. c: Chr01–Chr20 represents the chromosome representing the presence of LBDs in the C. ensifolium. (B) Synteny analysis of CeLBDs in A. thaliana, O. sativa, and C. ensifolium. The gray lines in the background represent the synteny blocks of all the genes between the three plants, and the blue lines represent synteny CeLBD gene pairs.
Horticulturae 11 00117 g004
Figure 5. (A) Heatmap analysis of cis-acting elements of 2 kb promoter regions of CeLBD genes. (B) The position of cis-acting elements related to hormone and stress response on CeLBD genes.
Horticulturae 11 00117 g005
Figure 6. (A) The position of miRNA editing sites and specific miRNA sequences in certain CeLBDs. (B) Statistics of the number of miRNA editing sites in the CeLBDs.
Horticulturae 11 00117 g006
Figure 7. (A) Protein interaction networks involving CeLBD proteins and other interactors. The outer circle, depicting proteins interacting with CeLBDs, is shown in circular nodes, while CeLBD proteins are depicted in diamond nodes. Interactions between these proteins are denoted by red lines. (B) Subcellular localization of p35S:CeLBD20-GFP fusion protein in the leaf of N. benthamiana. p35S:GFP was used as a control. The scale bar indicates 20 μm.
Horticulturae 11 00117 g007
Figure 8. (A) Heatmap of the expression patterns of the LBD genes in C. ensifolium. CK: flowers in the initial opening stage, SK: flowers in full bloom stage, SB: flowers in the decaying stage. The color scale represents normalized log2-transformed transcripts per kilobase million, with creamy white indicating low levels and pink indicating high levels. (B) Analysis of CeLBD gene expression trends and floral fragrance compound release during different flowering stages. (C) Correlation heatmap of major floral fragrance compound release and CeLBD genes expression during flowering period. The mantel test correlation between the release of four major floral fragrance compounds and the expression of CeLBD genes, Red indicates positive correlations. Significance of gene expression correlation calculated using a t-test: * indicates significant correlation (p < 0.05), ** indicates highly significant correlation (p < 0.01), and *** indicates extremely significant correlation (p < 0.001).
Horticulturae 11 00117 g008
Figure 9. (A) Expression analysis of the 10 CeLBD genes in leaves under various abiotic stresses (drought and low-temperature treatments) and hormones. (B) A heatmap illustrates the correlation of gene expressions between the three treatments. The data represent means ± standard error (SE) of three independent measurements using a t-test, where significance levels were denoted as * for p < 0.05 and ** for p < 0.01. (C) Correlation of total expression changes in CeLBD genes under the three treatments.
Horticulturae 11 00117 g009
Disclaimer/Publisher’s Note: The statements, opinions and data contained in all publications are solely those of the individual author(s) and contributor(s) and not of MDPI and/or the editor(s). MDPI and/or the editor(s) disclaim responsibility for any injury to people or property resulting from any ideas, methods, instructions or products referred to in the content.

