Article

Systematic Analysis of Nutritional Components and Characteristics in Red-Fleshed Dragon Fruit from Different Origins Using Non-Targeted Metabolomics

1
School of Food Science and Engineering, Guiyang University, Guiyang 550005, China
2
School of Karst Science, State Engineering Technology Institute for Karst Desertification Control, Guizhou Normal University, Guiyang 550001, China
*
Author to whom correspondence should be addressed.
Horticulturae 2025, 11(12), 1436; https://doi.org/10.3390/horticulturae11121436
Submission received: 3 October 2025 / Revised: 14 November 2025 / Accepted: 18 November 2025 / Published: 27 November 2025

Abstract

This research sought to analyze the nutritional composition of red-fleshed dragon fruit cultivated in various regions of Guizhou, focusing on samples obtained from three distinct production areas: Guanling (GL), Zhenfeng (ZF), and Luodian (LD). The findings revealed notable regional variations in nutritional constituents. Specifically, the GL samples exhibited the highest concentrations of betacyanin, vitamin C, total phenolics, and flavonoids; ZF samples demonstrated the greatest levels of soluble sugars alongside the lowest titratable acidity, whereas LD samples presented the opposite trend. Through non-targeted metabolomic profiling, a total of 4515 metabolites were identified. Multivariate analyses, including principal component analysis (PCA) and orthogonal partial least squares discriminant analysis (OPLS-DA), indicated that metabolic differences corresponded with geographical origin. Furthermore, the OPLS-DA S-plot identified L-Histidine, Glu-Leu, Uridine, Leu-Glu, (2S)-2-Isopropylmalate, 2-amino-4-({1-[(carboxymethyl)-C-hydroxycarbonimidoyl]-2-[(3-hydroxy-2-methyl-4-oxobutan-2-yl}sulfanyl]ethyl)-C-hydroxycarbonimidoyl)butanoic acid, Leu-Leu-Ser-Pro-Tyr, 1,1′-bis(iso-13-carbon saturated acyl)-2-(iso-12-carbon saturated acyl)-3-[(9Z,11Z)-octadecadienoyl] cardiolipin. The eight characteristic metabolites under scrutiny can evidently differentiate dragon fruits from disparate regions and thus serve as potential markers for distinguishing their origins. This study offers a theoretical foundation for quality assessment, investigations into health benefits, and the sustainable advancement of the dragon fruit industry.

1. Introduction

Pitaya, classified within the genus Hylocereus of the Cactaceae family, is a perennial climbing succulent herbaceous plant. It is distinguished by the presence of aerial roots, smooth fruits, and distinctive peel scales. Serving multiple roles as a source of fruit, flower, vegetable, healthcare, and medicinal applications, pitaya has emerged as a globally popular fruit with significant market potential [1,2]. Originally native to southern Mexico and Central America, the cultivation of dragon fruit later expanded to Southeast Asian countries, including Vietnam and Thailand, as well as to China. Within China, dragon fruit farming is primarily concentrated in the southern provinces of Guangxi, Guangdong, Guizhou, Hainan, Yunnan, and Fujian. By August 2020, Guizhou Province ranked third nationwide in terms of the total area allocated for dragon fruit cultivation [3]. Dragon fruit contains a variety of natural bioactive compounds, such as betacyanins, polyphenols, phenolic acids, flavonoids, fatty acids, terpenes, and sterols. It also contains high levels of vitamins, proteins, dietary fiber, carotenoids, and minerals such as potassium, sodium, calcium, phosphorus, and iron [4]. Dragon fruit exhibits considerable nutritional and health potential, attributable to its high nutritional value and abundant bioactive components. The primary dragon fruit varieties cultivated in the current market include the following: pink-rind white-flesh dragon fruit (Hylocereus undatus), yellow-rind white-flesh dragon fruit (Selenicereus megalanthus), and pink-rind red-flesh dragon fruit (Hylocereus polyrhizus) [5]. White-fleshed and red-fleshed pitayas are similar in terms of total sugar content and the content of most phenolic compounds, with quercetin being the main phenolic component in both. However, red-fleshed pitaya exhibits significantly superior total phenolic content and antioxidant capacity compared to white-fleshed pitaya [1]. Under the same soil conditions, red-fleshed pitaya shows lower acidity, higher total betalain content, higher pH value, as well as stronger Folin–Ciocalteu reducing capacity and FRAP antioxidant activity than white-fleshed pitaya, indicating a higher bioactive potential [6]. Owing to its excellent functional properties, red-fleshed pitaya is favored by a large number of consumers and producers [7]. Moreover, its characteristics of a longer fruiting period and multibatch fruiting make it the main variety for pitaya cultivation in Guizhou Province.
Guizhou Province is distinguished by its characteristic karst landscape, which is indicative of pronounced soil erosion. Dragon fruit is integral to the mitigation of karst desertification owing to its drought tolerance, resistance to pests and diseases, high productivity, and superior quality. Furthermore, as an economic crop, it has been shown to enhance the income levels of local farmers [8]. It is evident that Guanling County, Luodian County, and Zhenfeng County are the three primary production zones for dragon fruit in Guizhou. Guanling County is located on the southern declivity of the eastern ridge-like escarpment of the Yunnan-Guizhou Plateau, sloping toward the Guangxi hills. The topography of the region features a higher elevation in the northwest and a lower elevation in the southeast, with elevations ranging from 370 to 1850 m. The county’s climate is characterized by a three-dimensional distribution, spanning the southern temperate, northern subtropical, and central subtropical zones. The central subtropical monsoon humid climate is predominant, with distinct seasons and ample heat accumulation. The mean annual temperature is 16.2 °C, with a mean maximum of 16.9 °C and a mean minimum of 15.4 °C. Precipitation levels are notably high, ranging from 1205.1 to 1656.8 mm annually, thus classifying it as one of the province’s concentrated rainfall centers [9]. Luodian County is located in the southern part of Qiannan Buyi and Miao Autonomous Prefecture, Guizhou Province. The county falls within the subtropical monsoon climate zone, which is characterized by an early spring, a prolonged summer, a late autumn, and a short winter. The mean annual temperature is 19.6 °C, with a mean winter temperature of 11.6 °C. The annual sunshine hours range from 1350 to 1520; the mean annual precipitation is 1335 mm; and the frost-free period extends to 335 days [10]. Most areas of Zhenfeng County exhibit a humid subtropical plateau monsoon climate, characterized by warm and humid conditions. The region is distinguished by high temperatures, substantial precipitation, and a prolonged frost-free interval, resulting in consistently mild temperatures throughout the year without severe cold in winter or excessive heat in summer [11]. The unique quality attributes of fruits are determined by their morphological characteristics, fruit color, aroma, and nutritional value [1]. The quality of fruit is influenced by two key factors: variety and origin. For instance, Tian et al. [12] evaluated 21 mulberry varieties for appearance, nutritional quality, functional components, and antioxidant capacity, identifying five varieties with outstanding overall quality and rich nutritional value. Geographical and climatic conditions have been demonstrated to exert varying effects on fruit quality. Divergent geographical and climatic conditions exert disparate effects on fruit quality. For instance, altitude has been demonstrated to influence the morphophysiological characteristics associated with mango quality. Within the 680–1000 m range, fruit weight and size increase with rising altitude, while above 1000 m, they gradually decrease. It has been demonstrated that parameters such as soluble solids and total sugars decrease with increasing altitude. Total acidity has been shown to increase with altitude, and environmental factors associated with altitude changes have been found to significantly influence the accumulation patterns of volatile compounds [13]. As Wang et al. [14] demonstrate, banana composition and color values are correlated with rainfall and temperature. In humid tropical regions, the incidence of rot disease in yams has been shown to exhibit a significant positive correlation with monthly rainfall [15].
Metabolomics constitutes a crucial methodology within systems biology, significantly enhancing our comprehension of signal transduction and metabolic biological processes [16]. Within this domain, non-targeted metabolomics enables the unbiased detection of all small-molecule metabolites, whereas targeted metabolomics is dedicated to the precise quantification of selected metabolites [17]. Non-targeted metabolomics employs high-throughput technologies to facilitate a comprehensive analysis of the entire metabolome, with liquid chromatography-mass spectrometry (LC-MS) being extensively utilized in plant metabolic studies [16]. Non-targeted metabolomics has been instrumental in advancing the understanding of mechanisms underlying fruit development, quality formation, and environmental adaptation. Regarding fruit development, Hu et al. [18] employed non-targeted metabolomics to demonstrate that the exogenous application of 2,4-dichlorophenoxyacetic acid significantly affected cucumber fruits at various developmental stages. Metabolites exhibiting no-table changes at the stigma tip four days post-flowering were primarily linked to methionine metabolism, the citric acid cycle, and flavonoid biosynthetic pathways. Similarly, Shen et al. [19] identified, through non-targeted metabolomics, the accumulation of nucleotides, amino acids, and their derivatives during the maturation of Golden Thread Jujube. Additionally, cyclic adenosine monophosphate (cAMP) levels were observed to increase markedly during ripening, while triterpenoids progressively accumulated and sustained elevated concentrations. A considerable number of flavonoids were also found to maintain relatively high levels during the early developmental stages. In terms of quality development, non-targeted metabolomics investigations have been conducted across various fruits and vegetables, including grapes [20], citrus fruits [21], strawberries [22], bananas [23], and mangoes [24]. Concerning environmental adaptation, Wang et al. [25] pioneered the use of non-targeted metabolomics to elucidate metabolic variations in the leaves of the Tibetan medicinal plant Dendropanax monogynus across different altitudinal gradients and north–south slope orientations. Furthermore, Pegiou et al. [26] combined liquid chromatography-mass spectrometry (LC-MS) and solid-phase microextraction gas chromatography-mass spectrometry (SPME GC-MS) in a non-targeted metabolomics approach to examine white asparagus harvested over two consecutive seasons, revealing seasonal fluctuations in both volatile and non-volatile metabolites.
Therefore, this study aims to analyze the differences in nutritional components and metabolite profiles of red-fleshed pitaya from three regions in Guizhou Province using an untargeted metabolomics approach, with the aim of providing a scientific basis for the identification of the characteristic components of pitaya and its processing and utilization.

2. Materials and Methods

2.1. Sample Collection

During the pitaya ripening season in September 2024, fruits will be harvested from three major production areas: Zhenfeng County (25°22′36.48″ N, 105°46′7.10″ E), Luodian County (25°25′37.52″ N, 106°45′27.51″ E), and Guanling County (25°44′45.71″ N, 105°36′36.18″ E). In each location, five-year-old ‘Jindu No. 1’ red-fleshed pitaya plants exhibiting healthy growth and free from diseases and pests will be selected. In each production area, ten plants were randomly selected using the five-point sampling method. From each plant, dragon fruits were selected according to the ‘east, south, west’ orientation. A total of three fruits were selected on the basis of meeting the specified criteria. These criteria included uniform ripeness, the absence of cracking, no evidence of pest or disease damage, and consistent size. The fruits thus collected were promptly placed into sterile self-sealing bags, to which was attached a label indicating their origin and the time at which they were sampled. The fruits were then expedited to the laboratory, where they were homogenized. For each biological replicate, ten individual fruits were pooled and thoroughly homogenized. Three independent biological replicates were prepared per collection site to ensure data reliability and representativeness. The samples were labeled as follows: those from the Zhenfeng origin were designated ZF-1, ZF-2, and ZF-3; those from the Luodian origin were designated LD-1, LD-2, and LD-3; and those from the Guanling origin were designated GL-1, GL-2, and GL-3. Subsequently, the samples were transferred to −80 °C freezers (DW-86L388J, Qingdao Haier Biomedical Co., Ltd., Qingdao, China) for storage and subsequent experimental analysis. The geographical and meteorological data for each production area were collected from the China Meteorological Data Service Center (CMDC) [27]. The dataset for September 2024, encompassing daily maximum and minimum temperatures, relative humidity, sunshine duration, altitude, as well as monthly average temperature, monthly relative humidity, monthly sunshine duration, and annual precipitation, is presented in Table 1.

2.2. Determination of Vitamin C, Total Acidity, and Soluble Sugars

The quantification of vitamin C was conducted in accordance with the methodology established by Arakawa et al. [28]. The sample should be weighed at 0.5 g, after which 50 g/L trichloroacetic acid (TCA) solution should be added for the purpose of extraction. The 1 mL sample extract should be transferred into a pipette, after which 50 g/L TCA solution and anhydrous ethanol should be added. The contents of the pipette should then be thoroughly mixed by means of shaking. Subsequently, 0.4% phosphoric acid-ethanol solution, 5 g/L BP-ethanol solution, and 0.3 g/L FeCl3-ethanol solution should be added. Following thorough shaking, the mixture should be subjected to a water bath at 30 °C for a period of 60 min. The measurement of the extinction coefficient at a wavelength of 534 nm is then required. The results are expressed in milligrams of ascorbic acid equivalent per 100 g of fresh material.
The determination of total acidity was conducted in accordance with the method outlined by Angonese et al. [6]. To this end, 8 g of each fresh pulp sample was meticulously diluted in 90 mL of distilled water. These mixtures were then titrated with a 0.1 mol/L NaOH solution under constant stirring until a pH of 8.2 was achieved. The result was expressed as mg/100 g.
With minor adjustments to the anthrone reagent method outlined by Zhang et al. [29], the anthrone-ethyl acetate reagent and concentrated sulfuric acid were utilized. Following a 30 min reaction in a boiling water bath, the sample was cooled and the absorbance at 630 nm was measured. The total soluble sugar content was then determined using a sucrose standard curve. The result was expressed as mg/100 g.

2.3. Determination of Total Phenolic and Total Flavonoid Content

The total phenolic content was determined by means of the Folin–Ciocalteu method. A quantity of 1.0 g of ground dragon fruit sample was weighed, and 60% ethanol was added. The mixture was then extracted for a period of 2 h. Following this, the mixture was subjected to a centrifuge process for a duration of 30 min. The transfer of 1 mL of the serum to a 25 mL stoppered test tube is required, followed by the addition of 1.0 mol/L Folin reagent. The contents of the tube must then be shaken well and left to stand for 5 min. The sodium carbonate solution should be added, followed by dilution to 25 mL with distilled water. The solution should be left at room temperature in darkness for a period of two hours. Utilizing a sample devoid of gallic acid as the blank, the measurement of the optical density at a wavelength of 760 nm is to be conducted. This sequence is to be repeated on three occasions. For each sample, a calibration blank tube should be established in order to verify accuracy. The preparation of a 200 μg/mL gallic acid standard solution is to be undertaken as the reference material. This should then be diluted into a series of solutions, after which the procedure should be repeated to determine the standard curve. The results obtained are representative of the total phenolic content, which has been measured against the gallic acid content and expressed in mg/100 g.
The flavonoid content was determined according to the method of Hua et al. [30]. A 0.1 mL aliquot of the extract was transferred into a test tube, to which 70% ethanol, 5% NaNO2, followed by 10% Al(NO3)3 solution, was added after a period of six minutes. Subsequently, 4% NaOH was added after a further 6 min, and the absorbance was measured at 510 nm using a spectrophotometer after 10 min. In order to ensure the accuracy of the results, a calibration blank tube was established for each sample. Rutin was utilised as the standard for total flavonoid determination. A stock solution of 1 mg/mL was prepared by dissolving 70% ethanol in water. This solution was then serially diluted to create a gradient series. A volume of 0.1 mL of each dilution was transferred to a test tube, and the absorbances were measured following the aforementioned procedure to construct a standard curve. The result was expressed as mg/100 g.

2.4. Determination of Betacyanin Content

The betacyanin content was determined using the method described by Zhang et al. [31]. Absorbance values at 538 nm and 483 nm were measured using a spectrophotometer to calculate the contents of betacyanin (specifically betanin) and betaxanthin, respectively. The formula used to determine the content of betanin or betaxanthin (expressed as mg/100 g) is as follows:
B = (A × DF × W × V × 100)/(ε × P × L)
In this equation: B represents the content of betanin or betaxanthin (mg/100 g); A is the absorbance value (measured at 538 nm for betanin and 483 nm for betaxanthin); DF is the dilution factor at the time of reading; W is the molecular weight (550 g/mol for betanin and 308 g/mol for betaxanthin); V is the total volume of the sample extract (in liters); ε is the molar extinction coefficient (60,000 L/(mol·cm) for betanin and 48,000 L/(mol·cm) for betaxanthin); P is the mass of the fresh sample (in grams); L is the cuvette path length (1 cm).

2.5. Based on Non-Targeted UPLC-MS/MS Analysis

The analysis of the samples was conducted using UPLC-MS/MS technology. The separation process was conducted utilizing an 18 µm Waters ACQUITY UPLC HSS T3 Column (Waters Corporation, Milford, CT, USA), with dimensions of 2.1 mm × 100 mm. The mobile phase A was composed of 0.1% formic acid in ultrapure water, while the mobile phase B consisted of 0.1% formic acid in acetonitrile. The gradient conditions of the mobile phase in the chromatographic column are as follows: at 0.0 min, 95% mobile phase A and 5% mobile phase B; linearly adjusted to 35% A and 65% B at 5.0 min, then further changed to 1% A and 99% B at 6.0 min and held until 7.5 min; subsequently, rapidly returned to 95% A and 5% B at 7.6 min and maintained until 10.0 min. The instrument column temperature was set to 40 °C. The flow rate was measured to be 0.40 mL/min. The injection volume was 4 µL.
The operating parameters for the ESI source of the mass spectrometer (TripleTOF 6600, SCIEX, Foster City, CA, USA) are as follows: Ion source temperature: 550 °C Ion spray voltage (IS): The ion source gas I (GSI), gas II (GSII), and curtain gas (CUR) were set to 50, 60 and 35 psi, respectively. The declustering voltage was set to 60 V, the MS1 collision energy to 10 V, the MS2 collision energy to 30 V, the collision energy step size to 15 and the acquisition time to 10 min.
The mass spectrometry data were processed using the XCMS package (v4.8.0, Bioconductor platform, R programming language) for peak picking, alignment, and retention time correction. Peaks with a missing rate greater than 50% in any sample group were removed. Missing values were imputed using a hybrid strategy: by the K-nearest neighbor(KNN) algorithm implemented based on the impute package (v1.56.0) in the R programming language for groups with <50% missing values, and by one-fifth of the minimum value for groups with >50%. Support Vector Regression (SVR) was then applied for peak area correction. Subsequently, the processed peaks were annotated as metabolites by querying against Metware’s self-built database, supplemented with public databases, predictive databases, and the metDNA tool.

2.6. Statistical Analysis

The statistical significance of p < 0.05 was determined by analysis of variance (ANOVA)and Duncan multiple comparison. SPSS 27.0 software (IBM Corporation, Chicago, IL, USA) was adopted for statistical calculations and analyses. Data derived from UPLC-MS/MS analysis were subsequently uploaded to the Metware Cloud platform [32], a freely accessible online tool, to perform multivariate statistical analyses. These analyses encompassed principal component analysis (PCA), orthogonal partial least squares discriminant analysis (OPLS-DA), hierarchical cluster analysis (HCA), and K-means clustering, with the objective of identifying differential metabolites among red-fleshed pitaya samples originating from various production regions. Identification and annotation of differential metabolites were achieved through querying the Kyoto Encyclopedia of Genes and Genomes (KEGG) database. Furthermore, metabolic pathway analysis was conducted on the identified differential metabolites to elucidate variations in metabolic pathways across pitaya samples from distinct producing areas.

3. Results

3.1. Nutritional Component Analysis

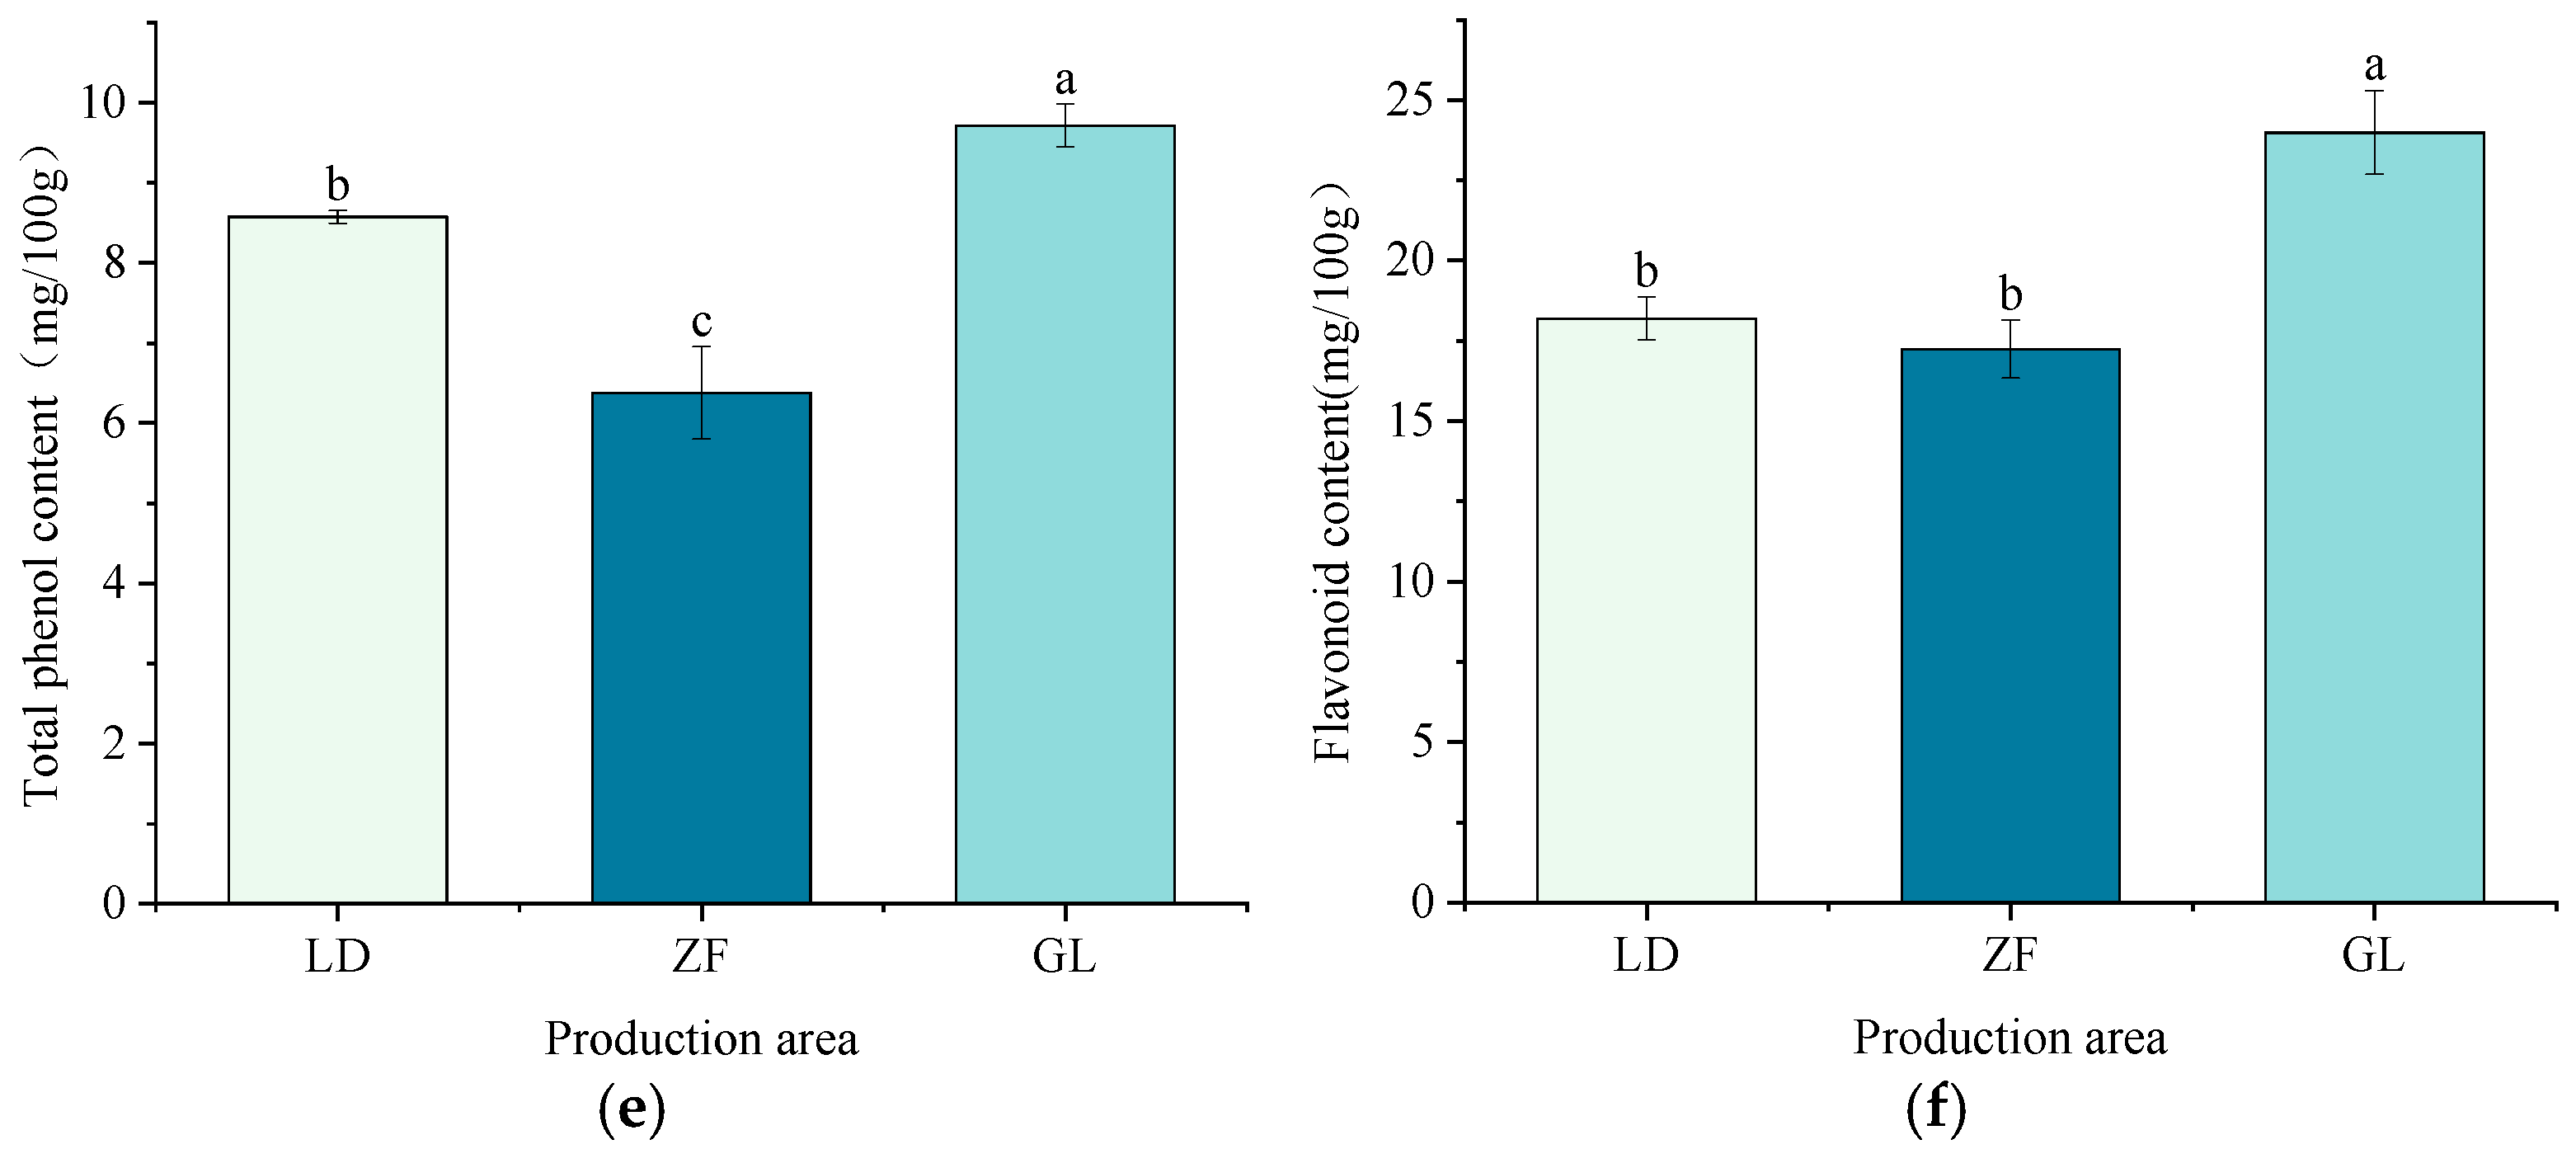
A comparative analysis of the nutritional components in red-fleshed dragon fruit from three production areas (LD, ZF, and GL) was conducted, revealing disparities in their functional nutrients. In Figure 1, dragon fruit from the GL region exhibited significantly higher levels of betacyanin, betaxanthin, vitamin C, total phenols, and flavonoids compared to other regions, with values of 37.80 mg/100 g, 18.17 mg/100 g, 4.20 mg/100 g, 9.72 mg/100 g, and 23.99 mg/100 g, respectively. In contrast, ZF dragon fruit exhibited the lowest levels of these components at 28.68 mg/100 g, 13.85 mg/100 g, 3.91 mg/100 g, 6.38 mg/100 g, and 17.25 mg/100 g. This phenomenon may be attributed to the elevated altitude of GL, where vegetation exhibits an enhanced tolerance to low temperatures and ultraviolet radiation at high elevations. This enhancement is achieved through an increase in the levels of betacyanins, vitamin C, total phenolics, and flavonoids [33,34,35,36]. With regard to soluble sugar content, the highest level was recorded in ZF dragon fruit (1817.33 mg/100 g), followed by GL (1042.33 mg/100 g), with the lowest level observed in LD (709 mg/100 g). Furthermore, LD dragon fruit exhibited the highest titratable acid content at 152.33 mg/100 g, followed by GL (124.67 mg/100 g), with ZF being the lowest (117.67 mg/100 g). This outcome is consistent with the trend observed in soluble sugar content.

3.2. Non-Targeted Metabolite Analysis

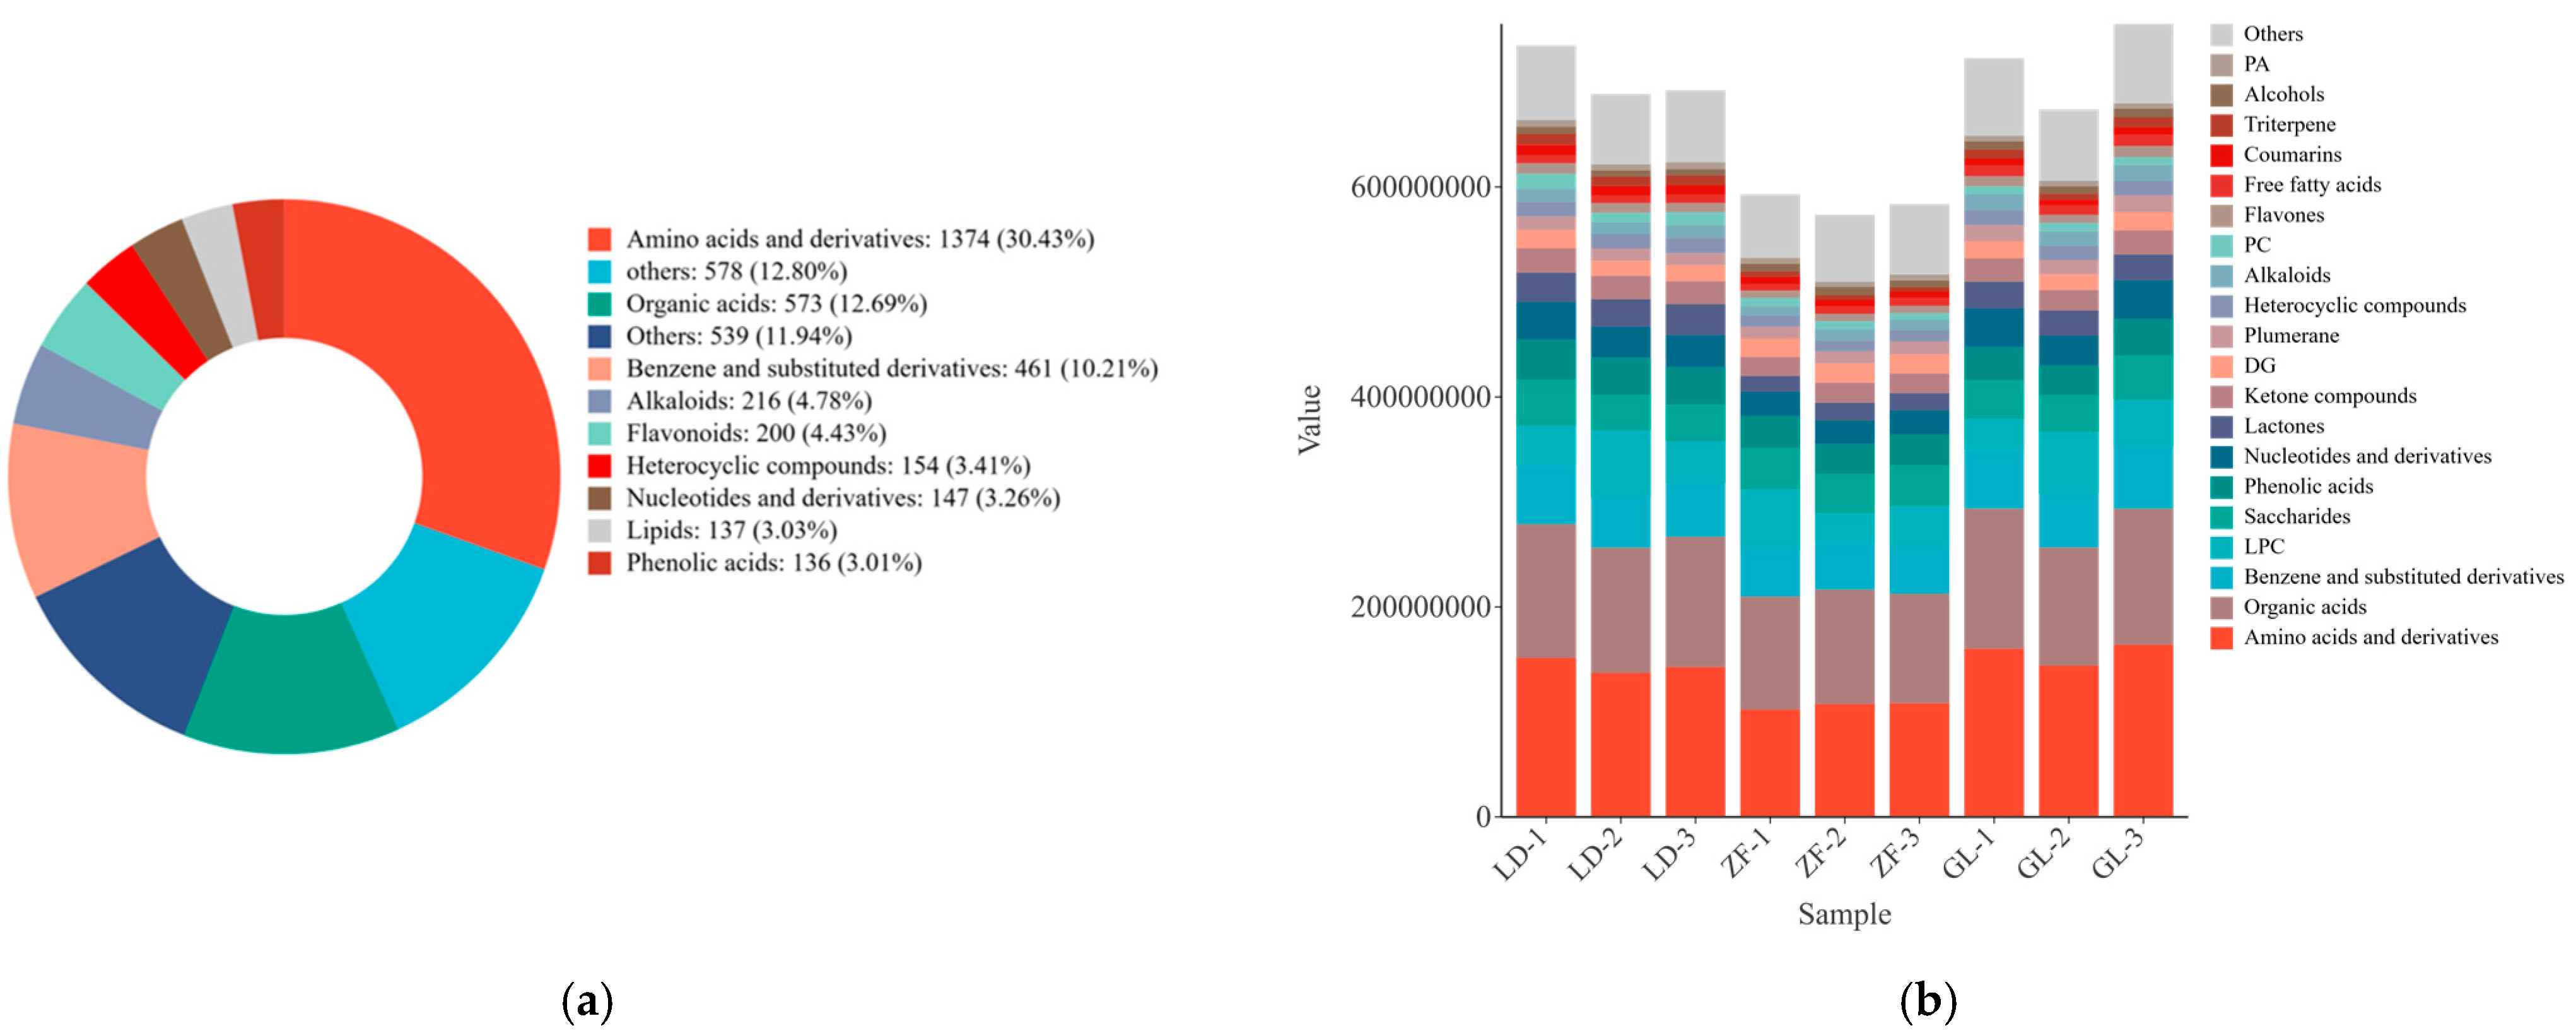
A study was conducted to analyze the overlap of total ion current (TIC) profiles across different ion modes for control samples obtained via UPLC-MS/MS non-targeted metabolomics. The results of this analysis revealed a high degree of overlap in TIC curves for detected metabolites, characterized by consistent retention times and peak intensities. This finding suggests that the signal stability is satisfactory when the mass spectrometer detects the same sample at different time points (Figure S1). A total of 4515 metabolites were identified in red-fleshed dragon fruit from three origins using UPLC-MS/MS non-targeted metabolomics. In the given sample, amino acids and their derivatives accounted for 30.43%, organic acids for 12.69%, benzene and its substituted derivatives for 10.21%, alkaloids for 4.78%, flavonoids for 4.43%, heterocyclic compounds for 3.41%, nucleotides and their derivatives for 3.26%, lipids for 3.03%, phenolic acids for 3.01%, and other com-pounds for 11.94%. Metabolites with individual proportions below 3% were grouped under “others” (Table S1), accounting for 12.80% (Figure 2a). A comprehensive analysis of the relative metabolite abundances across three distinct dragon fruit origins was conducted. The findings revealed that ZF exhibited significantly lower levels of amino acids and derivatives in comparison to LD and GL. However, ZF demonstrated higher levels of sugar compounds in comparison to GL and LD. This pattern is consistent with previously measured soluble sugar and organic acid content (Figure 2b).

3.3. PCA and OPLS-DA Analysis of Dragon Fruit from Different Origins

Principal component analysis was performed on all samples to preliminarily explore distribution patterns and clustering trends among samples. The results obtained demonstrated a significant separation of metabolites from red-fleshed dragon fruits of three different origins along the first principal component (PC1, explaining 36.51% variance) and second principal component (PC2, explaining 24.46% variance) dimensions (Figure 3a). Orthogonal partial least squares discriminant analysis, a supervised multivariate statistical method, has been demonstrated to be effective in the elimination of irrelevant confounding factors, thus facilitating the identification of differential metabolites. This method possesses strong predictive capability and orthogonal variable separation ability, making it suitable for screening differential metabolites among different origins [37]. The OPLS-DA results were found to be in alignment with the PCA findings, thereby providing further validation of the significant association between metabolic differences in red-fleshed dragon fruit and origin (Figure 3b).
The evaluation metrics R2Y and Q2 of the OPLS-DA model were 0.997 and 0.916, respectively, indicating that the model exhibited high explanatory power and strong predictive ability (Figure 3c). The S-plot generated based on the OPLS-DA results intuitively visualized the contribution degree of each metabolite to sample classification. Specifically, the farther a point on the S-shaped curve was from the origin, the higher its variable importance in projection (VIP) value and the more significant its contribution to distinguishing samples from different origins. In the plot, red dots represented key differential metabolites with VIP ≥ 1, whereas green dots indicated metabolites with VIP < 1. The top 8 metabolites that contributed most significantly to classification were identified from the S-plot, including L-Histidine, Glu-Leu, Uridine, Leu-Glu, (2S)-2-Isopropylmalate, 2-amino-4-({1-[(carboxymethyl)-C-hydroxycarbonimidoyl]-2-[(3-hydroxy-2-methyl-4-oxobutan-2-yl)sulfanyl]ethyl}-C-hydroxycarbonimidoyl)butanoic acid, Leu-Leu-Ser-Pro-Tyr, and 1,1′-bis(iso-13-carbon saturated acyl)-2-(iso-12-carbon saturated acyl)-3-[(9Z,11Z)-octadecadienoyl] cardiolipin (CL(i-13:0/i-13:0/i-12:0/18:2(9Z,11Z))) (the points enclosed in the red box in Figure 3d and Table 2). These metabolites may serve as potential markers for distinguishing red-fleshed dragon fruit from different origins.

3.4. Cluster Analysis of Red-Flesh Dragon Fruit from Different Origins

HCA further validated the PCA results, thereby revealing significant differences in metabolite content among dragon fruits from different origins. This finding suggests that the geographical origin exerts a substantial influence on the comprehensive metabolite profile of red-fleshed dragon fruit. The analysis of red-fleshed dragon fruit samples revealed the presence of three distinct clusters, which were determined to be geographically distinct and further categorized based on their metabolite content levels. GL and LD formed a single cluster, while ZF formed a distinct branch, showing the greatest divergence from the other samples. This finding suggests that there is a comparable metabolic expression pattern in GL and LD samples (Figure 4a).
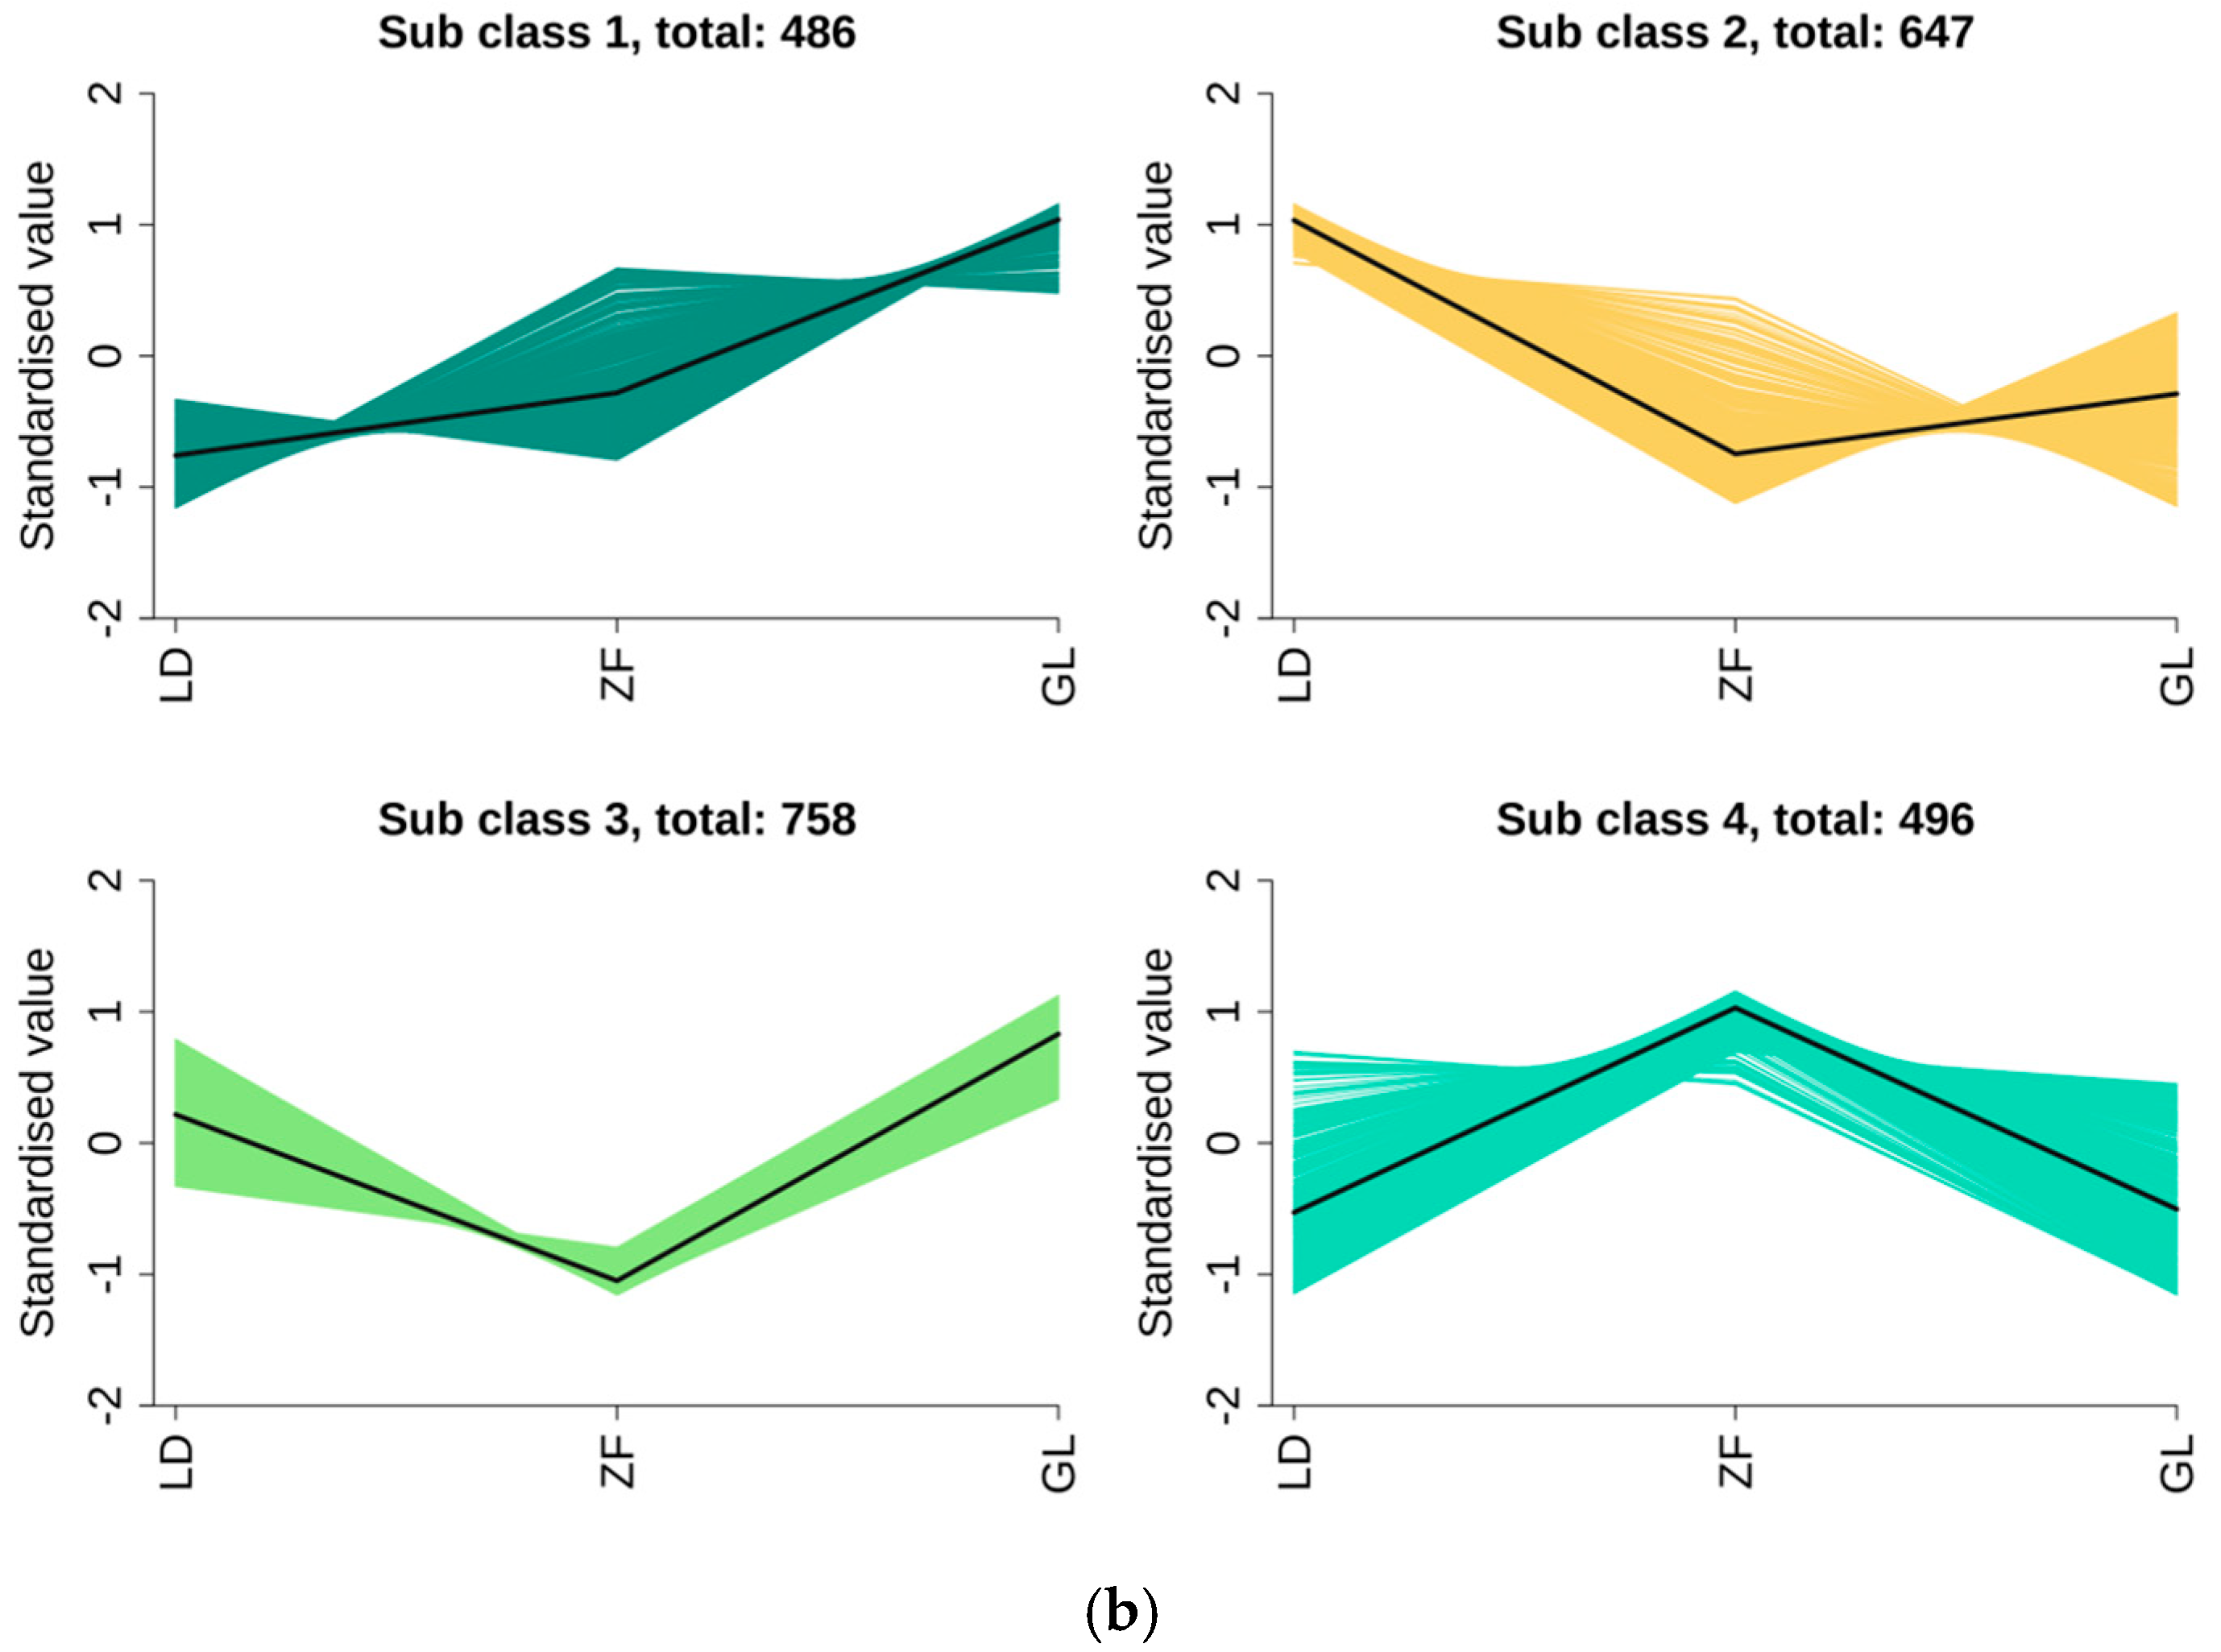
The results of the principal component analysis and the clustering analysis demonstrate significant variations in the metabolic profiles of red-fleshed dragon fruits originating from diverse geographical locations. In order to further explore the metabolic characteristics of red-fleshed dragon fruits from different sources, a multi-component K-means clustering analysis was performed on the identified differential metabolites. As demonstrated in Figure 4, Subclass 1 encompasses 486 metabolites, while Subclass 3 incorporates 758 metabolites, both of which manifest elevated levels of expression in GL samples. Subclass 2 comprises 647 metabolites, which are highly expressed in LD samples. Subclass 4 aggregates 496 metabolites, which are highly expressed in ZF samples (Figure 4b).

3.5. Metabolite Analysis of Red-Fleshed Dragon Fruit from Different Origins

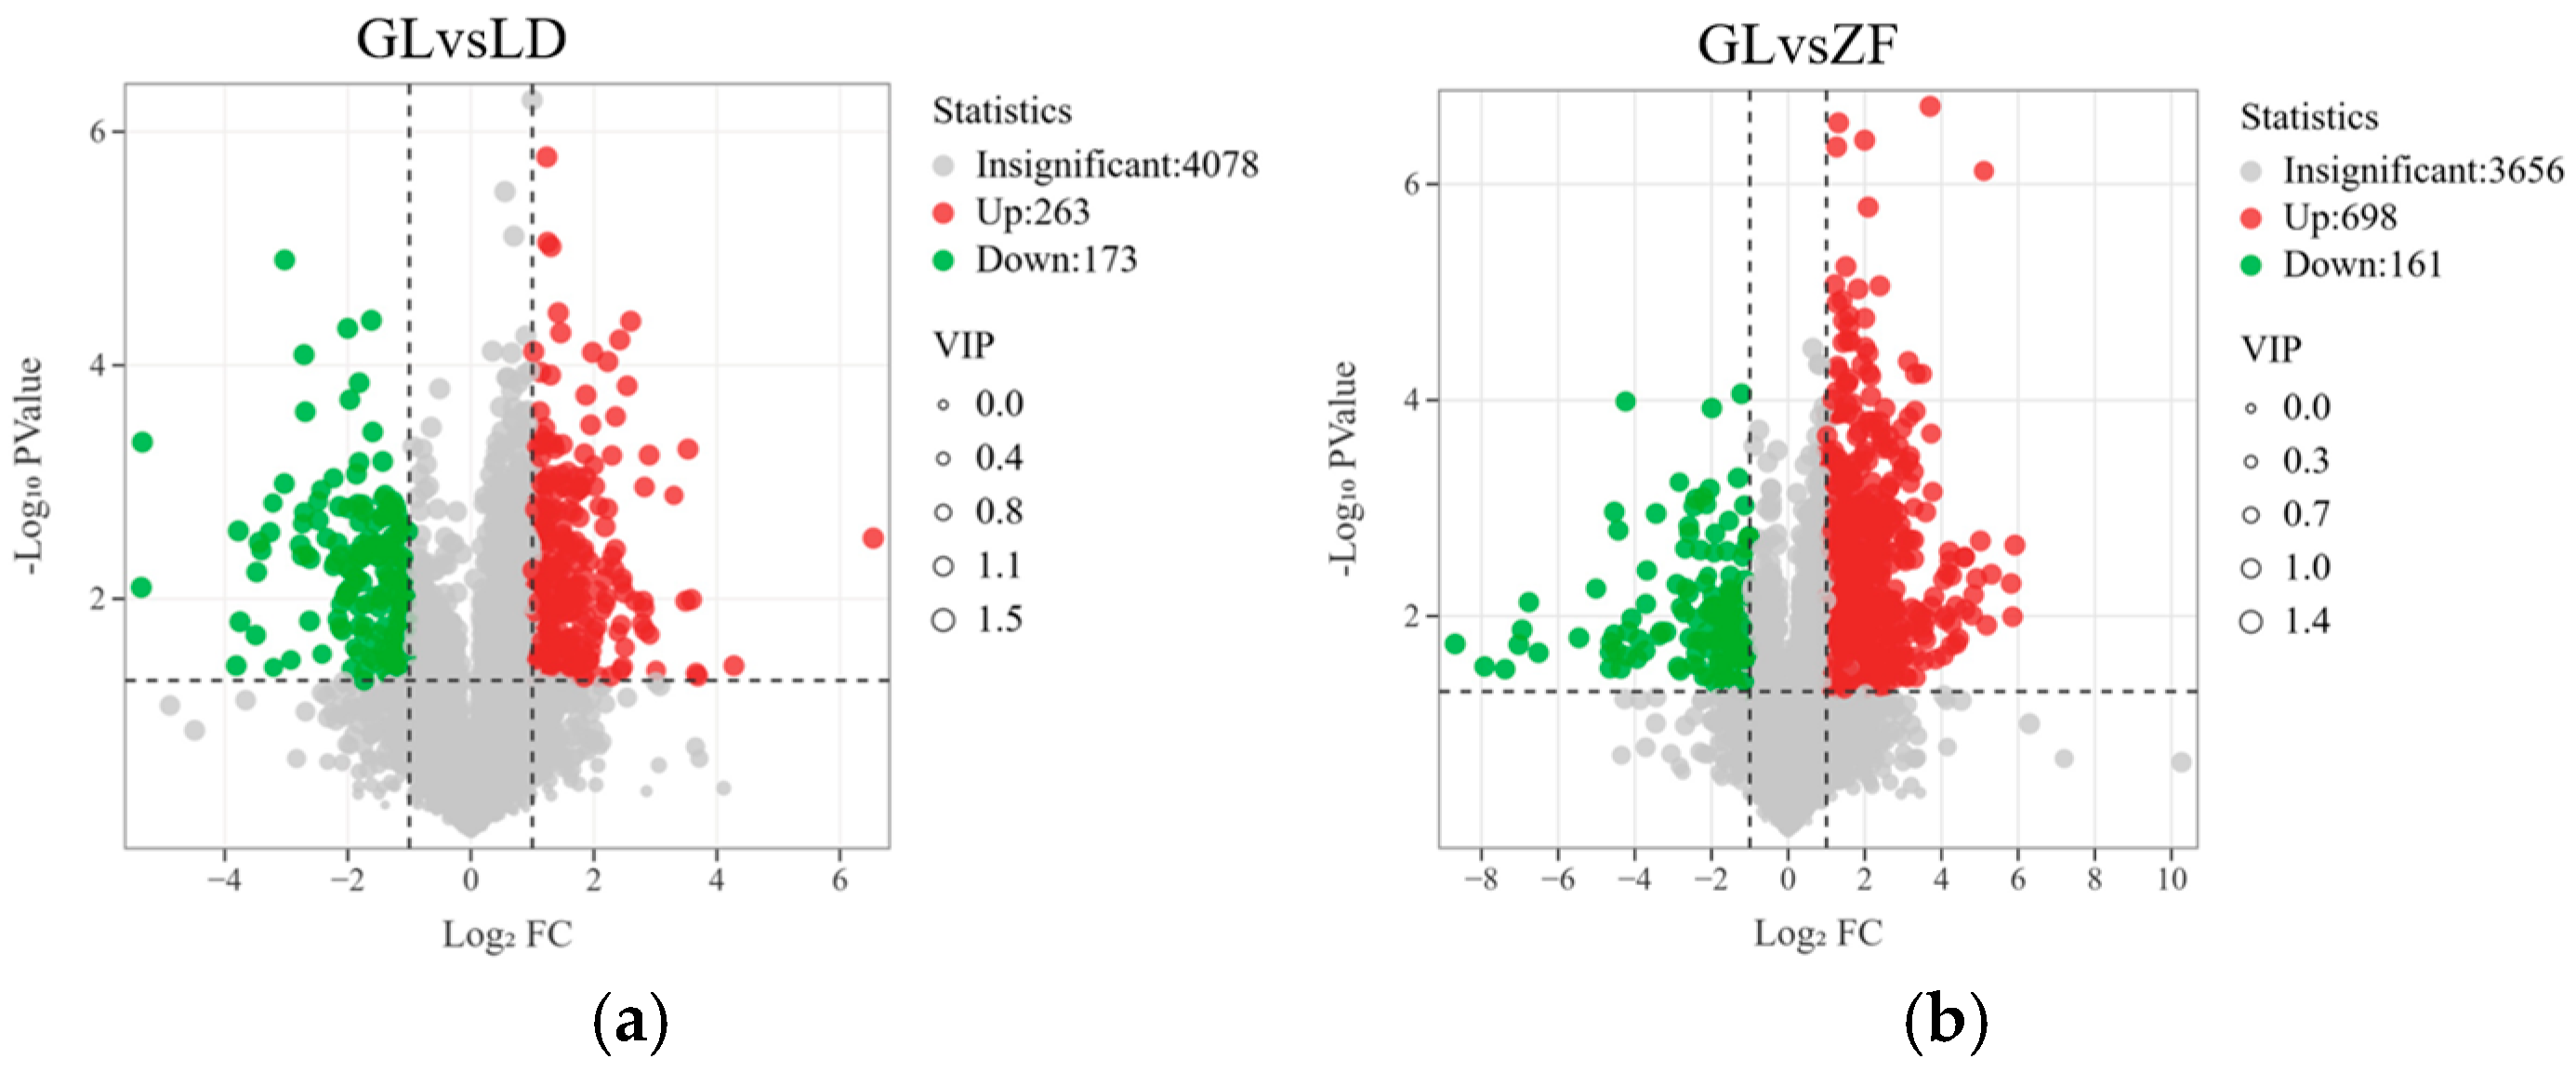
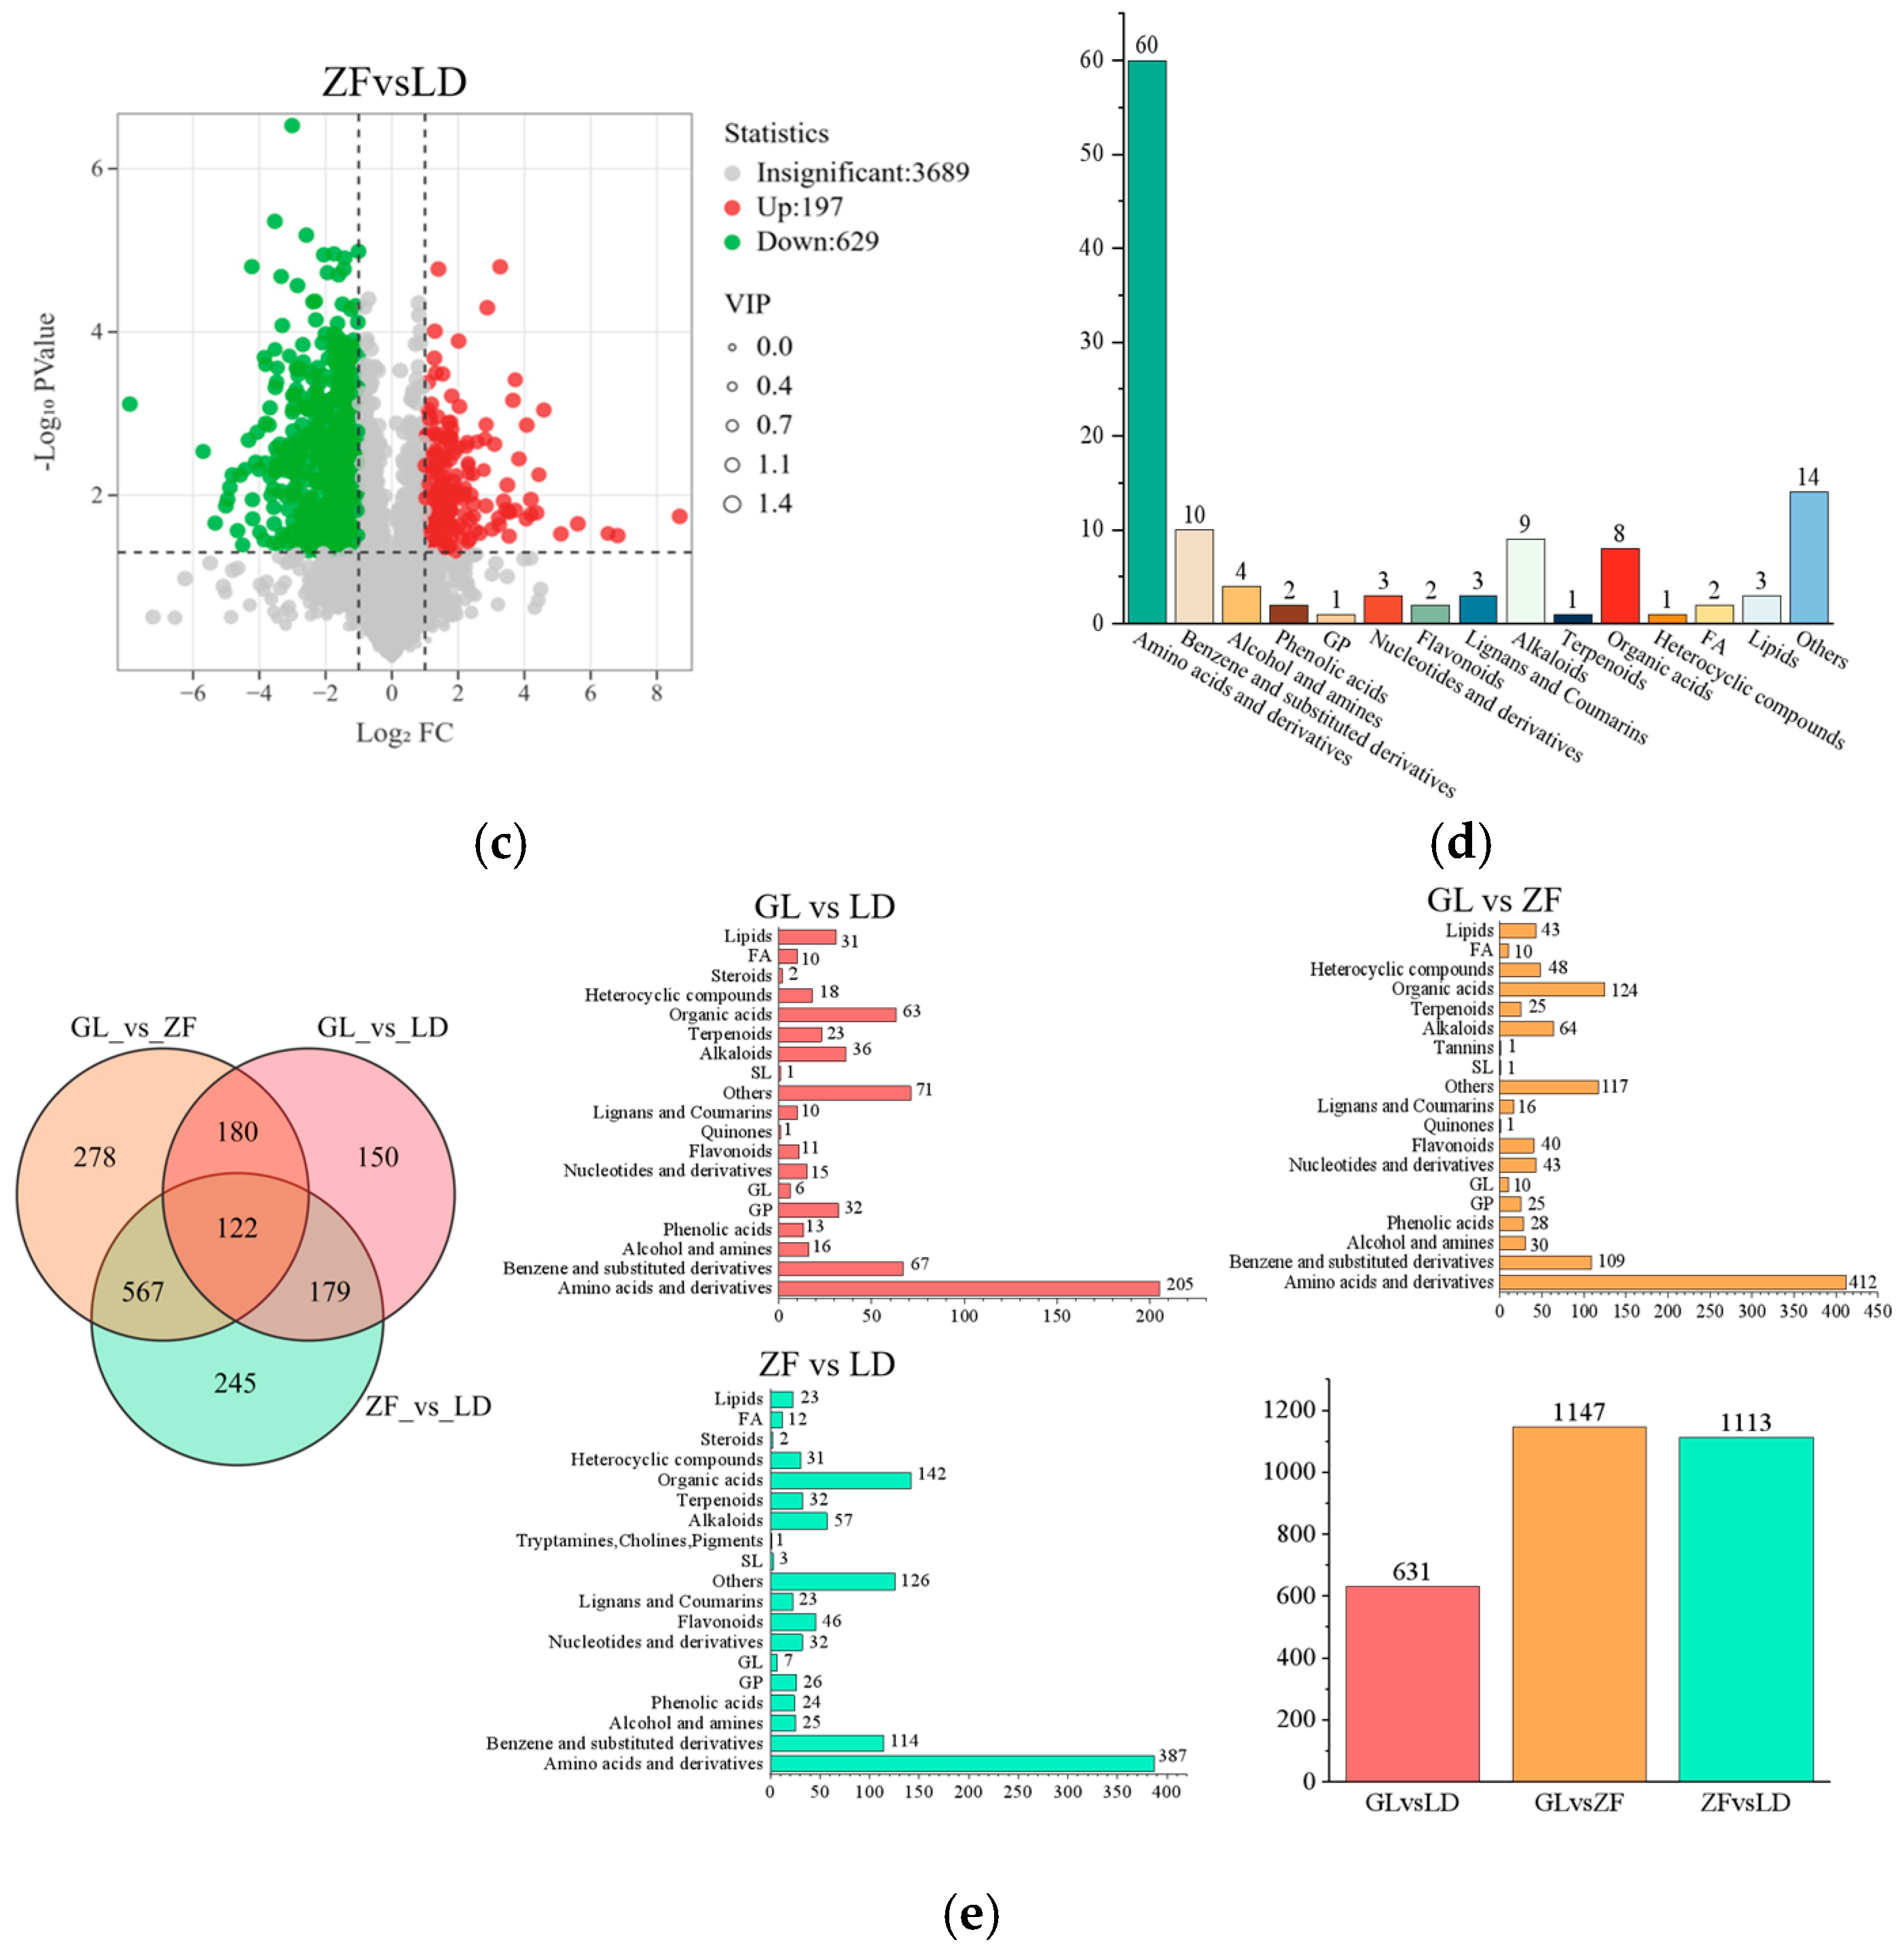
A comparative analysis should be performed between the three origins. Metabolites with a VIP > 1.0 from OPLS-DA and a p < 0.05 from one-way ANOVA were identified as potential marker compounds contributing to origin differentiation [38]. The differential expression of metabolites was then screened using the following criteria: a fold change (FC) of ≥2 or ≤0.5, VIP > 1, and a p < 0.05. A total of 436 significantly differentially expressed metabolites were identified between GL and LD, including 263 that were found to be upregulated and 173 that were found to be downregulated (Figure 5a). A total of 859 significantly differentially expressed metabolites were identified between GL and ZF, comprising 698 up-regulated and 161 down-regulated metabolites (Figure 5b); 826 significantly differentially expressed metabolites were identified between ZF and LD, including 197 up-regulated and 629 down-regulated metabolites (Figure 5c).
Venn analysis provides a visual representation of the distribution of metabolites across groups and the overlap of metabolites between different metabolomics datasets. Among the identified differentially expressed metabolites, 150 metabolites were unique to the GL and LD groups, 278 metabolites were unique to the GL and ZF groups, and 245 metabolites were unique to the ZF and LD groups. Furthermore, 122 differentially expressed metabolites were identified as common across all three sites (Figure 5e). The 122 metabolites comprised 60 amino acids and their derivatives, 13 other compounds, 10 benzene and its derivatives, 9 alkaloids, 8 organic acids, 4 alcohols, amines, 3 nucleotides and their derivatives, 3 lignans, 3 lipids, 2 phenolic acids, 2 flavonoids, 2 fatty acids, 1 glycerophospholipid, 1 terpenoid, and 1 hetero-cyclic compound (Figure 5d). Multigroup analysis revealed 2387 differentially expressed metabolites when comparing red-fleshed dragon fruit samples from all three origins simultaneously. Of these, 785 metabolites exhibited significantly higher levels in ZF than in the other two origins, 500 exhibited significantly higher levels in LD than in the other two origins, and 1102 exhibited significantly higher levels in GL than in the other two origins. This finding suggests that these metabolites have the potential to serve as effective markers for distinguishing red-fleshed dragon fruit of different origins.

3.6. Annotation and Analysis of Metabolite Differences in Red-Fleshed Dragon Fruit from Different Origins

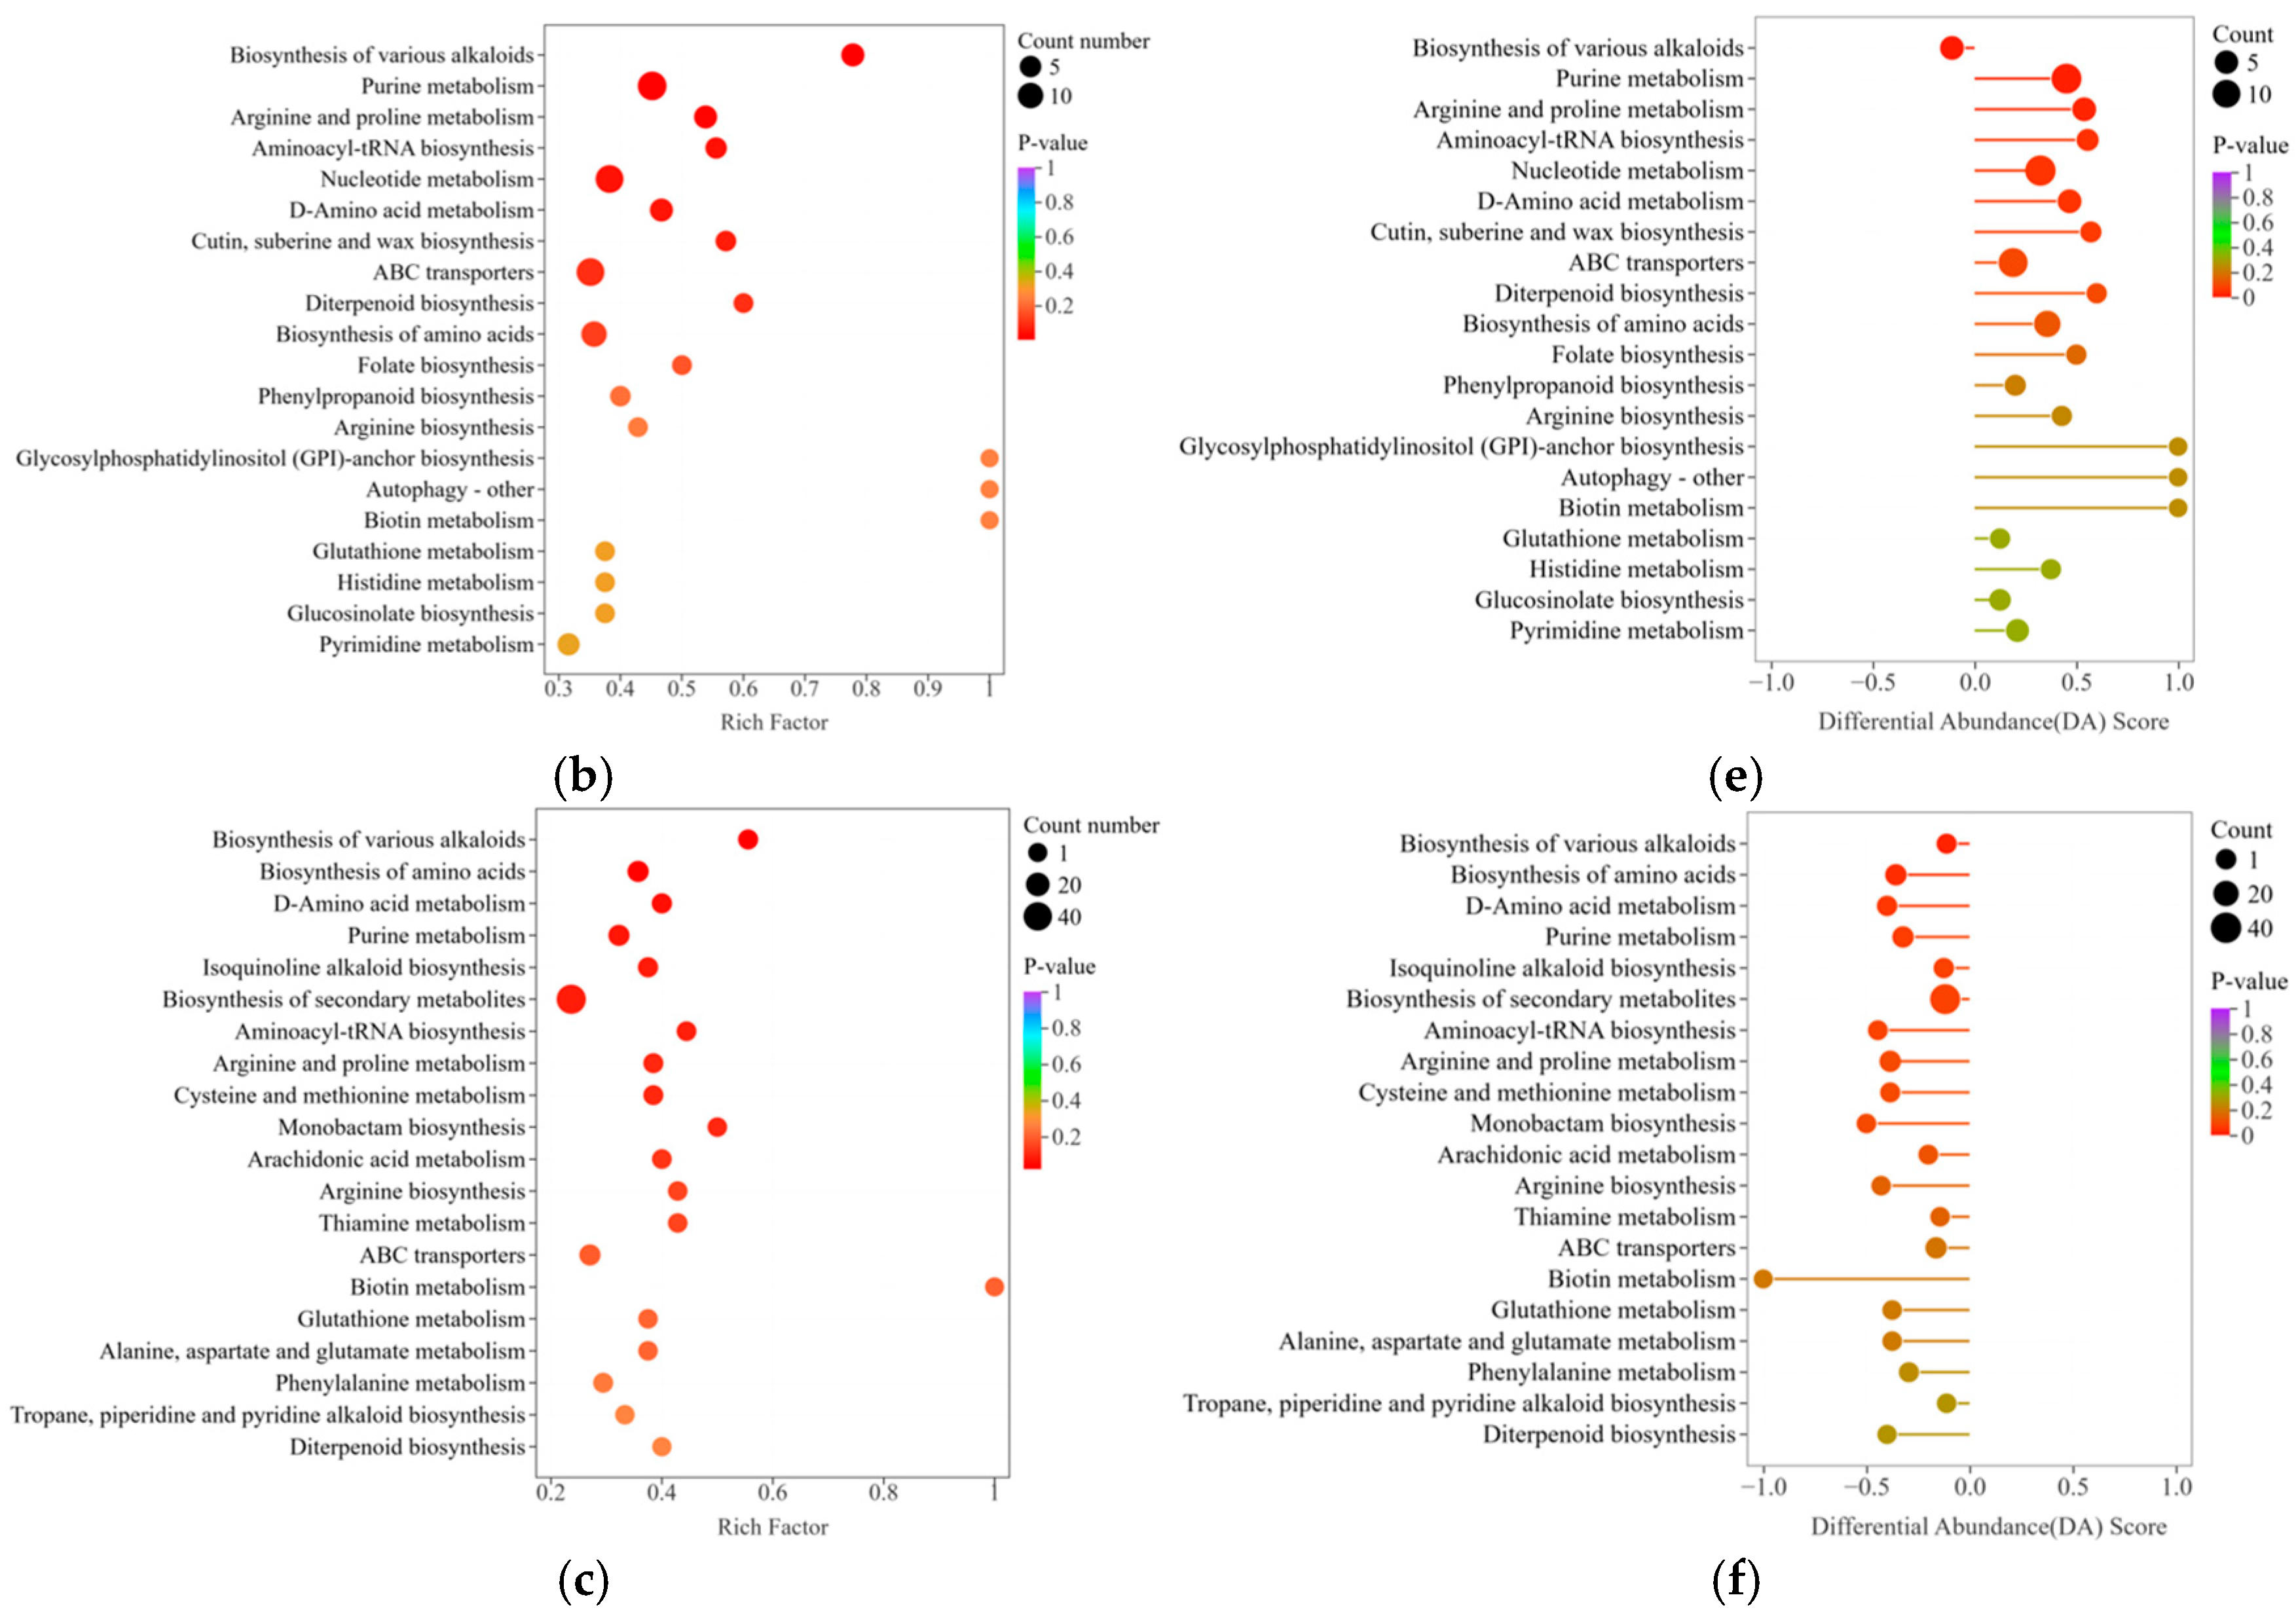
Annotation and enrichment analysis of differentially expressed metabolites in red dragon fruit samples was performed using the KEGG database, thus identifying the three most enriched major metabolic pathways across each sample group. In the present study, a total of 631 differentially expressed metabolites were identified in the GL and LD metabolomes, including 205 amino acids and their derivatives, 67 benzene and its derivatives, 63 organic acids, 36 alkaloids, and 32 glycerophospho-lipids. A total of 31 lipids, 23 terpenoids, 18 heterocyclic compounds, 16 alcohols and amines, 15 nucleotides and their derivatives, 13 phenolic acids, 11 flavonoids, 10 fatty acids, 10 lignin and coumarin compounds, 6 glycerides, 2 sterols, 1 quinone, and 1 sterol were identified. Subsequent analysis focused on key metabolic pathways and metabolite levels in GL and LD. A smaller p-value for a differential metabolic pathway indicates more significant enrichment of that pathway. The three metabolic pathways that were found to be significantly enriched between GL and LD were glycerophospholipid metabolism, α-linolenic acid metabolism, and biosynthesis of cutin, suberin, and wax, with 7, 5, and 4 metabolites, respectively. A total of 11 metabolites were found to be overexpressed, while 5 were found to be underexpressed (Figure 6a). The data analysis score plot (DA score plot) is a graphical representation of the overall change in all metabolites within a metabolic pathway. When the DA score is 1, all identified metabolites in that pathway show an upward trend, while a DA score of −1 indicates a downward trend in the expression of all identified metabolites in that pathway. The absolute value of the DA score is represented by the length of the line segment. The size of the dot at the endpoint is indicative of the number of differentially expressed metabolites in that pathway. The positioning of a dot to the left of the central axis, accompanied by a longer line segment, is indicative of a pathway that exhibits a stronger overall tendency towards downregulation. Conversely, a dot positioned to the right of the central axis with a longer line segment indicates a pathway with a stronger overall tendency toward upregulation. The magnitude of the dot is directly proportional to the number of metabolites present. The color of the line segments and dots is indicative of the magnitude of the p-value, with red denoting a smaller p-value and purple indicating a larger p-value. A comparison of the identified metabolites in the glycerophospholipid metabolism pathway revealed an overall downregulation trend, while those in the α-linolenic acid metabolism and suberin and wax biosynthesis pathways exhibited an overall upregulation trend (Figure 6d).
A total of 1147 differentially expressed metabolites were identified in the GL and ZF metabolomes, comprising 412 amino acids and their derivatives, 124 organic acids, 109 benzene and its derivatives, 64 alkaloids, and 48 heterocyclic compounds. A total of 43 nucleotides and their derivatives, 43 lipids, 40 flavonoids, 30 alcohols and amines, 28 phenolic acids, 25 terpenes, 25 glycerophospholipids, 16 lignans/coumarins, 10 fatty acids, 10 glycerides, 1 quinone, 1 sphingolipid, 1 gluten, and 117 other compounds were identified. The three metabolic pathways that were found to be significantly enriched between ZF and LD were alkaloid biosynthesis, purine metabolism, and arginine/proline metabolism, with 7, 14, and 7 metabolites being identified in each case. A total of 24 metabolites were found to be overexpressed, while 4 were found to be underexpressed (Figure 6b). The data analysis (DA) score plot revealed that, in the comparison between GL and ZF, metabolites identified in various alkaloid biosynthesis pathways showed an overall downregulated trend, while those in purine metabolism, arginine, and proline metabolism exhibited an overall upregulated trend (Figure 6e).
In the metabolomes of ZF and LD, there were a total of 1113 differential metabolites, including 387 species of amino acids and their derivatives, 142 species of organic acids, 114 species of benzene and its derivatives, 57 species of alkaloids, 46 species of flavonoids, 32 species of nucleotides and their derivatives, 32 species of terpenoids, 32 species of heterocyclic compounds, 26 species of glycerophospholipids, 25 species of alcohols and amines, 24 species of phenolic acids, 23 species of lignans and coumarins, 23 species of lipids, 12 species of fatty acyls, 7 species of glycerolipids, 3 species of sphingolipids, 2 species of steroids, 1 species of choline, and 126 species of other categories. The biosynthesis of various alkaloids, amino acid biosynthesis, and D-amino acid metabolism represent the three major significantly different metabolic pathways enriched between LD and ZF, with 5, 10, and 6 metabolites, respectively. Of these, 2 metabolites were found to be overexpressed and 19 were underexpressed (Figure 6c). The data analysis (DA) score plot demonstrates that the collective expression of metabolites identified within these pathways exhibits a consistent downregulation trend (Figure 6f).

4. Discussion

4.1. Effects of Different Origins on the Nutritional Composition of Red-Fleshed Dragon Fruit

Nutritional constituents are regarded as essential indicators in evaluating the quality of dragon fruit. The present study identified notable differences in the concentrations of betacyanins, vitamin C, total phenolics, flavonoids, and other bioactive compounds among fruits sourced from various production regions. Environ-mental factors characteristic of high-altitude zones, such as lower temperatures and intensified ultraviolet radiation, have been documented to induce elevated synthesis of polyphenols and flavonoids in plants [39,40]. These phytochemicals are known to enhance the antioxidant capacity and stress tolerance of the plants producing them. Additionally, conditions of reduced precipitation and humidity have been shown to facilitate the accumulation of total phenolics, total flavonoids, and vitamin C in plant tissues [41]. Correspondingly, the geographical and climatic attributes of the GL production area examined in this study were associated with significantly higher levels of these compounds relative to other regions, aligning with prior findings on environmental stress-induced metabolic regulation (Table 1). Regarding fruit edibility, variations in the quantity and profile of sugars and organic acids exert direct effects on fruit texture, flavor, and nutritional quality. It is posited that light intensity and temperature serve as critical determinants in the biosynthesis and accumulation of sugars and organic acids in red-fleshed dragon fruit. Empirical evidence indicates that sufficient light exposure enhances soluble sugar accumulation by stimulating photosynthetic activity within the fruit [42,43]. Under suboptimal growth conditions, including moderate drought and low temperature stress, fruits tend to accumulate soluble sugars to maintain cellular osmotic homeostasis and bolster stress resilience [44,45,46]. Conversely, diminished temperatures and inadequate light availability have been reported to adversely affect the synthesis and metabolism of organic acids [47,48,49]. In the current investigation, the soluble sugar content in dragon fruit from the ZF region was significantly greater than that observed in fruits from the other two origins. This outcome is attributable to the abundant sunlight in the ZF area, which provides the fundamental substrate for sugar biosynthesis. Moreover, pronounced diurnal temperature fluctuations have been demonstrated to reduce respiratory consumption during nighttime, thereby facilitating sugar accumulation. These findings corroborate the established paradigm of synergistic regulation of sugar metabolism by light and temperature.

4.2. Effects of Metabolite Differences in Red-Fleshed Dragon Fruit from Different Origins on Fruit Quality

An extensive metabolomic investigation of red-fleshed dragon fruit was performed utilizing UPLC-MS/MS technology, leading to the identification of 4515 metabolites spanning over 20 distinct categories. Among these metabolites, amino acids and their derivatives represented the most abundant class, followed by organic acids and benzene and substituted derivatives. Significant variations in metabolite profiles and concentrations were observed among samples originating from different geographical locations, with these differences correlating with variations in fruit texture, flavor, and functional attributes. Notably, the composition and abundance of amino acids exhibited a strong association with the sensory characteristics of texture, flavor, and aroma. Specifically, glutamic acid, aspartic acid, and lysine were identified as critical markers for assessing fruit palatability; glycine and serine were implicated in imparting sweetness, whereas histidine, valine, leucine, isoleucine, and tryptophan were categorized as bitter-tasting amino acids. Additionally, phenylalanine, tryptophan, and tyrosine were recognized as precursors for the biosynthesis of aromatic compounds [50]. Organic acids, which constitute the primary contributors to fruit sourness, were found to directly influence the acid-sweet balance and modulate taste complexity through their specific types and concentrations [51]. The predominant organic acids identified in dragon fruit included malic acid, citric acid, formic acid, pyrrolidonic acid, and ascorbic acid [6]. The presence of these organic acids was demonstrated to enhance the fruit’s refreshing quality and overall palatability, while mitigating the overly cloying sensation often associated with elevated sugar levels. The dynamic transition characterized by a decrease in acidity coupled with an increase in sweetness during fruit maturation was shown to elevate the sugar-to-acid ratio, thereby enhancing flavor quality [52]. Moreover, benzene and substituted derivatives were found to play pivotal roles in flavor development and preservation. For example, Jiang et al. [53] reported that the glycoside hydrolase PpGH28BG1 enhances peach aroma by modulating the benzaldehyde metabolic pathway. Additionally, Wan et al. [54] demonstrated that monosubstituted phenyl derivatives isolated from Ficus hirta fruit exhibit antifungal activity against Penicillium italicum.

4.3. Regulatory Mechanisms of Dragon Fruit Quality Under Different Production Environments

This investigation, utilizing KEGG enrichment analysis, elucidated that the quality of dragon fruit is predominantly influenced by the growing environment through fundamental physiological pathways. These include lipid metabolism and membrane structure formation, nitrogen compound metabolism, regulation of secondary metabolism, as well as energy and nucleic acid metabolism. Regarding lipid metabolism and membrane architecture, α-linolenic acid (ALA), a principal unsaturated fatty acid in plants, is intimately linked to processes such as fruit development [55], flavor biosynthesis [56], and responses to both biotic and abiotic stresses [57,58]. It has been established that glycerophospholipid metabolism directly affects the synthesis of cuticle, suberin, and waxes, thereby influencing the physical quality of the fruit and its tolerance to stress. Glycerophospholipids constitute essential components of plant cell and organelle membranes, with their abundance closely correlated with fruit firmness and the sugar-acid ratio [59]. The cuticle, suberin, and wax layers serve as critical elements of plant defense mechanisms, offering protection against various biotic and abiotic challenges [60,61]. In the domain of secondary metabolic regulation, alkaloids—nitrogen-containing natural organic compounds—have been shown to perform diverse biological functions, including the modulation of fruit ripening, antioxidant defense, deterrence of pests and pathogens, and attraction of pollinators [62,63,64]. Concurrently, the biosynthesis of amino acids, D-amino acid metabolism, and the metabolism of arginine and proline constitute nitrogenous compound metabolic pathways that underpin protein synthesis, signal transduction, and stress response mechanisms [65,66,67]. For example, alkaloid biosynthesis typically depends on amino acids such as tyrosine and tryptophan as precursors; thus, downregulation of amino acid synthesis may result in a deficient supply of these precursors, indirectly suppressing alkaloid production [68,69]. Concerning energy metabolism, observed regional differences in purine metabolism reflect adaptive responses to environmental conditions. As demonstrated by Senecoff et al. [70], purine metabolism is closely interconnected with energy metabolism and nucleic acid synthesis. Upregulation of purine metabolism may signify an increased energy supply or the stimulation of physiological processes such as cell proliferation. Active purine metabolism has been shown to promote nucleic acid synthesis, thereby supporting protein biosynthesis and the regulation of gene expression [71], which collectively facilitate adaptation to environmental fluctuations.

4.4. Feasibility of Origin Tracing and Potential Markers

With the increasing demand for the protection and development of geographical indication products, the identification of markers capable of distinguishing production origins has become essential. The geographical and climatic conditions of Guanling, Luodian, and Zhenfeng exhibit substantial differences. In this study, both PCA and OPLS-DA effectively classified samples from these three regions into distinct groups. Moreover, 200 permutation tests validated that the OPLS-DA model avoided overfitting and demonstrated high predictive accuracy, thereby indicating that metabolic variations are closely associated with geographic origin. This outcome supports the feasibility of tracing product origin through metabolic profiling. Metabolite clustering analysis further revealed that dragon fruit samples from different origins could be categorized into two groups based on metabolite similarity. Most metabolites showed relatively higher concentrations in samples from Guanling and lower concentrations in those from Zhenfeng. Metabolomics has been widely applied in origin tracing; for example, Liu et al. [72] employed metabolomics to trace the provenance of Poria cocos and to explore the relationships between environmental factors and biomarkers. Similarly, Sun et al. [73] identified 32 non-volatile and 27 volatile compounds as markers differentiating high-altitude from low-altitude origins of Lushan Cloud and Mist Tea. In the present study, eight metabolites with significant contributions to classification were identified for red-fleshed dragon fruit from different origins using non-targeted metabolomics. These differential metabolites hold potential as markers for origin tracing of red-fleshed dragon fruit, although their practical application warrants further validation.

5. Conclusions

This study investigated the nutritional composition of red-fleshed pitayas from different geographical origins and revealed that samples from the ZF region exhibited the highest soluble sugar content, whereas those from LD showed the highest titratable acidity, and those from GL contained the highest levels of betaine, vitamin C, total phenolics, and flavonoids. Untargeted metabolomic analysis was conducted using UPLC-MS/MS coupled with multivariate statistical methods to profile metabolites across the different origins. The results indicated that amino acids and their derivative metabolites were the most abundant compound class in red-fleshed pitayas from all three regions. Notably, the ZF-origin pitayas displayed the lowest levels of amino acids and related derivatives, but higher concentrations of sugar compounds compared to LD and GL samples. Metabolite accumulation patterns suggested a high degree of similarity between GL and LD, whereas ZF exhibited the greatest metabolic divergence. Eight metabolites—L-Histidine, Glu-Leu, Uridine, Leu-Glu, (2S)-2-isopropylmalate, 2-amino-4-({1-[(carboxymethyl)c-hydroxycarbonimidoyl]-2-[(3-hydroxy-2-methyl-4-oxobutan-2-yl)sulfanyl]ethyl}-c-hydroxycarbonimidoyl)butanoic acid, Leu-Leu-Ser-Pro-Tyr, and 1,1′-bis(iso-13-carbon saturated acyl)-2-(iso-12-carbon saturated acyl)-3-[(9Z,11Z)-octadecadienoyl] cardiolipin—were identified as key contributors to sample classification and may serve as potential biomarkers for origin discrimination. KEGG pathway analysis revealed that, when comparing the GL and LD groups, metabolites associated with the alpha-linolenic acid metabolism pathway were generally upregulated. In the GL versus ZF comparison, metabolites involved in purine metabolism and the arginine and proline metabolic pathways showed increased expression. In contrast, in the ZF versus LD comparison, metabolites associated with alkaloid biosynthesis, amino acid biosynthesis, and the D-amino acid metabolism pathway were predominantly downregulated. These findings suggest that pitayas from the GL region may exhibit enhanced stress tolerance and greater physiological activity in response to biotic and abiotic stresses. This study provides a scientific basis for quality assessment, geographical traceability, and the rational development and utilization of pitaya, as well as contributes to elucidating the molecular mechanisms underlying environmental influences on fruit quality.

Supplementary Materials

The following supporting information can be downloaded at: https://www.mdpi.com/article/10.3390/horticulturae11121436/s1, Figure S1: Total ion chromatography (TIC); Table S1: Metabolites included in “Others” in the pie chart and their respective proportions.

Author Contributions

Conceptualization, Z.Z. and L.B.; methodology, L.W. and Z.Z.; software, L.W.; visualization, L.W. and Y.L.; data curation, L.W. and Y.L.; funding acquisition, Z.Z.; formal analysis, L.W. and Y.L.; writing—original draft preparation, L.W.; writing—review and editing, Z.Z. and L.B. All authors have read and agreed to the published version of the manuscript.

Funding

This research was funded by the Guizhou Provincial Graduate Student Scientific Research Fund Project (2024YJSKYJJ155), National Natural Science Foundation of China (grant No.: 32160595), and the Department of Science and Technology of Guizhou Province (No. QKHZYD [2022]4051).

Data Availability Statement

The original contributions proposed in this study are included in the article and Supplementary Materials. For further inquiries, please contact the corresponding author directly.

Conflicts of Interest

The authors declare that they have no known competing financial interests or personal relationships that could have appeared to influence the work reported in this paper.

Abbreviations

GLGuanling
LDLuodian
ZFZhenfeng
KNNK-nearest neighbor
PCALinear dichroism
CMDCChina Meteorological Data Service Center
TCATrichloroacetic acid
OPLS-DAOrthogonal partial least squares discriminant analysis
HCAHierarchical cluster analysis
UPLC-MS/MSUltra-performance liquid chromatography-tandem mass spectrometry
ANOVAAnalysis of variance
KEGGKyoto Encyclopedia of Genes and Genomes
CL(i-13:0/i-13:0/i-12:0/18:2(9Z,11Z))1,1′-bis(iso-13-carbon saturated acyl)-2-(iso-12-carbon saturated acyl)-3-[(9Z,11Z)-octadecadienoyl] cardiolipin

References

  1. Attar, Ş.H.; Gündeşli, M.A.; Urün, I.; Kafkas, S.; Kafkas, N.E.; Ercisli, S.; Ge, C.; Mlcek, J.; Adamkova, A. Nutritional analysis of red-purple and white-fleshed pitaya (Hylocereus) species. Molecules 2022, 27, 808. [Google Scholar] [CrossRef]
  2. Chen, J.; Sabir, I.A.; Qin, Y. From challenges to opportunities: Unveiling the secrets of pitaya through omics studies. Sci. Hortic. 2023, 321, 112357. [Google Scholar] [CrossRef]
  3. Huang, D.; Zhou, Z.; Zhang, Z.; Zhu, M.; Yin, L.; Peng, R.; Zhang, Y.; Zhang, W. Recognition and counting of pitaya trees in karst mountain environment based on unmanned aerial vehicle RGB images. J. Appl. Remote Sens. 2021, 15, 042402. [Google Scholar] [CrossRef]
  4. Shah, K.; Chen, J.; Chen, J.; Qin, Y. Pitaya nutrition, biology, and biotechnology: A review. Int. J. Mol. Sci. 2023, 24, 13986. [Google Scholar] [CrossRef]
  5. Taharuddin, N.; Jumaidin, R.; Mansor, M.; Hazrati, K.; Tarique, J.; Asyraf, M.; Razman, M. Unlocking the potential of lignocellulosic biomass dragon fruit (Hylocereus polyrhizus) in bioplastics, biocomposites and various commercial applications (en línea). Polymers 2023, 15, 2654. [Google Scholar] [CrossRef]
  6. Angonese, M.; Motta, G.E.; de Farias, N.S.; Molognoni, L.; Daguer, H.; Brugnerotto, P.; de Oliveira Costa, A.C.; Müller, C.M.O. Organic dragon fruits (Hylocereus undatus and Hylocereus polyrhizus) grown at the same edaphoclimatic conditions: Comparison of phenolic and organic acids profiles and antioxidant activities. LWT 2021, 149, 111924. [Google Scholar] [CrossRef]
  7. Magalhães, D.S.; da Silva, D.M.; Ramos, J.D.; Pio, L.A.S.; Pasqual, M.; Boas, E.V.B.V.; Galvão, E.C.; de Melo, E.T. Changes in the physical and physico-chemical characteristics of red-pulp dragon fruit during its development. Sci. Hortic. 2019, 253, 180–186. [Google Scholar] [CrossRef]
  8. Yang, H.; Garousi, F.; Wang, J.; Cao, J.; Xu, X.; Zhu, T.; Müller, C. Land use effects on gross soil nitrogen transformations in karst desertification area. Plant Soil 2022, 475, 61–77. [Google Scholar] [CrossRef]
  9. Guanling Bouyei and Miao Autonomous County People’s Government. Available online: https://www.guanling.gov.cn (accessed on 18 September 2025).
  10. Luodian County People’s Government. Available online: https://www.gzluodian.gov.cn (accessed on 18 September 2025).
  11. Zhenfeng County People’s Government. Available online: https://www.gzzf.gov.cn (accessed on 18 September 2025).
  12. Tian, J.; Wen, H.; Liu, B.; Tian, X.; Wu, Y.; Yang, J.; Zhang, B.; Li, H. Fruit quality evaluation of different mulberry varieties. Front. Plant Sci. 2025, 15, 1500253. [Google Scholar] [CrossRef] [PubMed]
  13. Zhang, C.; Yi, H.; Gao, X.; Bai, T.; Ni, Z.; Chen, Y.; Wang, M.; Zhang, Y.; Pan, J.; Yu, W.; et al. Effect of different altitudes on morpho-physiological attributes associated with mango quality. Diversity 2022, 14, 876. [Google Scholar] [CrossRef]
  14. Wang, Z.; Erasmus, S.W.; Liu, X.; van Ruth, S.M. Study on the relations between hyperspectral images of bananas (Musa spp.) from different countries, their compositional traits and growing conditions. Sensors 2020, 20, 5793. [Google Scholar] [CrossRef]
  15. Okoro, U.K.; Akalazu, J.N.; Nwulu, N.C. Near-term impact of climate variability on yam rot incidence over a humid tropical region: Projections in CORDEX-Africa scenarios. Renew. Agric. Food Syst. 2021, 36, 477–490. [Google Scholar] [CrossRef]
  16. Li, Y.; Zhu, W.; Xiang, Q.; Kim, J.; Dufresne, C.; Liu, Y.; Li, T.; Chen, S. Creation of a plant metabolite spectral library for untargeted and targeted metabolomics. Int. J. Mol. Sci. 2023, 24, 2249. [Google Scholar] [CrossRef]
  17. Zhou, J.; Hou, D.; Zou, W.; Wang, J.; Luo, R.; Wang, M.; Yu, H. Comparison of widely targeted metabolomics and untargeted metabolomics of wild Ophiocordyceps sinensis. Molecules 2022, 27, 3645. [Google Scholar] [CrossRef]
  18. Hu, C.; Zhao, H.; Shi, J.; Li, J.; Nie, X.; Yang, G. Effects of, 2, 4-dichlorophenoxyacetic acid on cucumber fruit development and metabolism. Int. J. Mol. Sci. 2019, 20, 1126. [Google Scholar] [CrossRef]
  19. Shen, B.; Zhang, Z.; Shi, Q.; Du, J.; Xue, Q.; Li, X. Active compound analysis of Ziziphus jujuba cv. Jinsixiaozao in different developmental stages using metabolomic and transcriptomic approaches. Plant Physiol. Biochem. 2022, 189, 14–23. [Google Scholar] [CrossRef]
  20. Darwish, A.G.; Das, P.R.; Ismail, A.; Gajjar, P.; Balasubramani, S.P.; Sheikh, M.B.; Tsolova, V.; Sherif, S.M.; El-Sharkawy, I. Untargeted metabolomics and antioxidant capacities of muscadine grape genotypes during berry development. Antioxidants 2021, 10, 914. [Google Scholar] [CrossRef] [PubMed]
  21. Nadi, R.; Golein, B.; Gómez-Cadenas, A.; Arbona, V. Developmental stage-and genotype-dependent regulation of specialized metabolite accumulation in fruit tissues of different citrus varieties. Int. J. Mol. Sci. 2019, 20, 1245. [Google Scholar] [CrossRef]
  22. Wang, X.; Wu, L.; Qiu, J.; Qian, Y.; Wang, M. Comparative metabolomic analysis of the nutritional aspects from ten cultivars of the strawberry fruit. Foods 2023, 12, 1153. [Google Scholar] [CrossRef] [PubMed]
  23. Shi, Y.; Guo, Y.; Wang, Y.; Li, M.; Li, K.; Liu, X.; Fang, C.; Luo, J. Metabolomic analysis reveals nutritional diversity among three staple crops and three fruits. Foods 2022, 11, 550. [Google Scholar] [CrossRef] [PubMed]
  24. Suh, J.H.; Madden, R.T.; Sung, J.; Chambers, A.H.; Crane, J.; Wang, Y. Pathway-based metabolomics analysis reveals biosynthesis of key flavor compounds in mango. J. Agric. Food Chem. 2021, 70, 10389–10399. [Google Scholar] [CrossRef]
  25. Wang, L.; Wang, H.; Chen, J.; Lamu, Y.; Qi, X.; Lei, L.; Mao, K.; Tso, S. Analysis of metabolic differences in Tibetan medicinal plant Phlomoides rotata leaves in different habitats based on non-targeted metabolomics. Front. Plant Sci. 2025, 16, 1503218. [Google Scholar] [CrossRef] [PubMed]
  26. Pegiou, E.; Engel, J.; Mumm, R.; Hall, R.D. Unravelling the seasonal dynamics of the metabolome of white asparagus spears using untargeted metabolomics. Metabolomics 2023, 19, 23. [Google Scholar] [CrossRef]
  27. China Meteorological Data Service Center. Available online: https://data.cma.cn/ (accessed on 23 May 2025).
  28. Arakawa, N.; Tsutsumi, K.; Sanceda, N.G.; Kurata, T.; Inagaki, C. A rapid and sensitive method for the determination of ascorbic acid using 4, 7-diphenyl-l, 10-phenanthroline. Agric. Biol. Chem. 1981, 5, 1289–1290. [Google Scholar] [CrossRef]
  29. Zhang, Y.; Cheng, W.; Di, H.; Yang, S.; Tian, Y.; Tong, Y.; Huang, H.; Escalona, V.H.; Tang, Y.; Li, H.; et al. Variation in nutritional components and antioxidant capacity of different cultivars and organs of Basella alba. Plants 2024, 13, 892. [Google Scholar] [CrossRef]
  30. Hua, Q.; Chen, C.; Zur, N.T.; Wang, H.; Wu, J.; Chen, J.; Zhang, Z.; Zhao, J.; Hu, G.; Qin, Y. Metabolomic characterization of pitaya fruit from three red-skinned cultivars with different pulp colors. Plant Physiol. Biochem. 2018, 126, 117–125. [Google Scholar] [CrossRef]
  31. Zhang, Z.; Yang, H.; Xing, Y.; Xie, F.; Chen, C.; Zhang, Z.; Zhao, J.; Hu, G.; Qin, Y. Quality analysis and evaluation of different batches of pitaya fruit (Hylocereus) in south china. Int. J. Fruit Sci. 2024, 24, 33–43. [Google Scholar] [CrossRef]
  32. Maiwei Cloud. Available online: https://cloud.metware.cn (accessed on 17 September 2025).
  33. Causin, H.F.; Cá, F.D.; Spotorno, V.G.; Palacios, M.B.; Tosar, L.M.; Burrieza, H.P.; Tossi, V.E. Comparative role of betalains and other key antioxidant metabolites in the photoprotection against acute exposure to UV-B radiation in Chenopodium quinoa and C. berlandieri seedlings. Plant Physiol. Biochem. 2025, 221, 109580. [Google Scholar] [CrossRef] [PubMed]
  34. Paunović, S.M.; Mašković, P.; Milinković, M. Bestimmung von Primärmetaboliten, Vitaminen und Mineralien in Schwarzen Maulbeeren (Morus nigra), angebaut in verschiedenen Höhenlagen. Erwerbs Obstbau 2020, 62, 355–360. [Google Scholar] [CrossRef]
  35. Boyarskikh, I.G.; Artemov, I.A.; Kuznetsov, A.A.; Kostikova, V.A. Changes in Profiles of Classes and of Individual Polyphenols in Leaves of Spiraea chamaedryfolia and Spiraea media along an Altitudinal Gradient. Plants 2023, 12, 2977. [Google Scholar] [CrossRef]
  36. Rao, M.J.; Wang, H.; Lei, H.; Zhang, H.; Duan, X.; Bao, L.; Yang, C.; Han, D.; Zhang, Y.; Yang, S.; et al. LC-MS/MS-based metabolomic study provides insights into altitude-dependent variations in flavonoid profiles of strawberries. Front. Plant Sci. 2025, 15, 1527212. [Google Scholar] [CrossRef] [PubMed]
  37. Boccard, J.; Rutledge, D.N. A consensus orthogonal partial least squares discriminant analysis (OPLS-DA) strategy for multiblock Omics data fusion. Anal. Chim. Acta 2013, 769, 30–39. [Google Scholar] [CrossRef] [PubMed]
  38. Zhang, J.; Yu, H.; Li, S.; Zhong, X.; Wang, H.; Liu, X. Comparative metabolic profiling of Ophiocordyceps sinensis and its cultured mycelia using GC–MS. Food Res. Int. 2020, 134, 109241. [Google Scholar] [CrossRef] [PubMed]
  39. Pandey, G.; Khatoon, S.; Pandey, M.; Rawat, A. Altitudinal variation of berberine, total phenolics and flavonoid content in Thalictrum foliolosum and their correlation with antimicrobial and antioxidant activities. J. Ayurveda Integr. Med. 2018, 9, 169–176. [Google Scholar] [CrossRef]
  40. Kuźniak, E.; Gajewska, E. Lipids and lipid-mediated signaling in plant–pathogen interactions. Int. J. Mol. Sci. 2024, 25, 7255. [Google Scholar] [CrossRef]
  41. Arabsalehi, F.; Rahimmalek, M.; Sabzalian, M.R.; Ghanadian, M.; Matkowski, A.; Szumny, A. Changes in polyphenolic composition, physiological characteristics, and yield-related traits of Moshgak (Ducrosia anethifolia Boiss.) populations in response to drought stress. Protoplasma 2023, 260, 967–985. [Google Scholar] [CrossRef]
  42. Hu, L.; Yang, C.; Zhang, L.; Feng, J.; Xi, W. Effect of light-emitting diodes and ultraviolet irradiation on the soluble sugar, organic acid, and carotenoid content of postharvest sweet oranges (Citrus sinensis (L.) Osbeck). Molecules 2019, 24, 3440. [Google Scholar] [CrossRef]
  43. Qin, Y.; Gong, A.; Liu, X.; Li, N.; Ji, T.; Li, J.; Yang, F. Testing a Simulation Model for the Response of Tomato Fruit Quality Formation to Temperature and Light in Solar Greenhouses. Plants 2024, 13, 1662. [Google Scholar] [CrossRef]
  44. Ma, W.-F.; Li, Y.-B.; Nai, G.-J.; Liang, G.-P.; Ma, Z.-H.; Chen, B.-H.; Mao, J. Changes and response mechanism of sugar and organic acids in fruits under water deficit stress. PeerJ 2022, 10, e13691. [Google Scholar] [CrossRef]
  45. Barbosa, A.C.; Rocha, D.S., Jr.; Silva, G.C.; Santos, M.G.; Camillo, L.R.; De Oliveira, P.H.; Costa, M.G. Dynamics of the sucrose metabolism and related gene expression in tomato fruits under water deficit. Physiol. Mol. Biol. Plants 2023, 29, 159–172. [Google Scholar] [CrossRef]
  46. Wu, Z.; Tu, M.; Yang, X.; Xu, J.; Yu, Z. Effect of cutting and storage temperature on sucrose and organic acids metabolism in postharvest melon fruit. Postharvest Biol. Technol. 2020, 161, 111081. [Google Scholar] [CrossRef]
  47. Mulas, M.; Fadda, A.; Angioni, A. Effect of maturation and cold storage on the organic acid composition of myrtle fruits. J. Sci. Food Agric. 2013, 93, 37–44. [Google Scholar] [CrossRef] [PubMed]
  48. Zhao, H.; Jiao, W.; Cui, K.; Fan, X.; Shu, C.; Zhang, W.; Cao, J.; Jiang, W. Near-freezing temperature storage enhances chilling tolerance in nectarine fruit through its regulation of soluble sugars and energy metabolism. Food Chem. 2019, 289, 426–435. [Google Scholar] [CrossRef] [PubMed]
  49. Tang, W.; Chen, C.; Zhang, Y.; Chu, Y.; Yang, W.; Cui, Y.; Kou, G.; Chen, H.; Song, H.; Gong, R. Effect of low-light stress on sugar and acid accumulation during fruit development and ripening of sweet cherry. Horticulturae 2023, 9, 654. [Google Scholar] [CrossRef]
  50. Zhou, X.; Obel, H.O.; Liu, S.; Yang, Y.; Liu, J.; Zhuang, Y. Comparative Analysis of Metabolic Variation in Eggplant Fruit of Different Varieties Reveals Metabolites Important for Quality Traits. Foods 2023, 12, 4383. [Google Scholar] [CrossRef]
  51. Tang, Y.; Wang, P.; Chen, J.; Li, L.; Tang, L.; Huang, W.; Wei, X.; Xu, J. The accumulation pattern of sugars and organic acids in diverse fruit pulps coordinates sweet-sour taste of passion fruit. LWT 2025, 225, 117948. [Google Scholar] [CrossRef]
  52. Wei, J.; Chenlei, L.; Yi, S.W. Analysis of quality changes in mulberry fruit at three developmental stages using targeted metabolomics based on lcms. Trop. Plant Biol. 2023, 16, 287–306. [Google Scholar] [CrossRef]
  53. Jiang, D.; Han, Q.; Su, Y.; Cao, X.; Wu, B.; Wei, C.; Chen, K.; Li, X.; Zhang, B. Glycoside hydrolase ppgh28bg1 modulates benzaldehyde metabolism and enhances fruit aroma and immune responses in peach. Plant Physiol. 2024, 196, 1444–1459. [Google Scholar] [CrossRef] [PubMed]
  54. Wan, C.; Han, J.; Chen, C.; Yao, L.; Chen, J.; Yuan, T. Monosubstituted benzene derivatives from fruits of Ficus hirta and their antifungal activity against phytopathogen Penicillium italicum. J. Agric. Food Chem. 2016, 64, 5621–5624. [Google Scholar] [CrossRef]
  55. Ma, C.; Zhang, C.; Wang, X.; Zhu, F.; Wang, X.; Zhang, M.; Duan, Y. Alternative splicing analysis revealed the role of alpha-linolenic acid and carotenoids in fruit development of Osmanthus fragrans. Int. J. Mol. Sci. 2023, 24, 8666. [Google Scholar] [CrossRef]
  56. Li, X.; Qi, L.; Zang, N.; Zhao, L.; Sun, Y.; Huang, X.; Wang, H.; Yin, Z.; Wang, A. Integrated metabolome and transcriptome analysis of the regulatory network of volatile ester formation during fruit ripening in pear. Plant Physiol. Biochem. 2022, 185, 80–90. [Google Scholar] [CrossRef]
  57. Sivankalyani, V.; Maoz, I.; Feygenberg, O.; Maurer, D.; Alkan, N. Chilling stress upregulates α-linolenic acid-oxidation pathway and induces volatiles of C6 and C9 aldehydes in mango fruit. J. Agric. Food Chem. 2017, 65, 632–638. [Google Scholar] [CrossRef]
  58. Lu, H.; Zheng, S.; Ma, C.; Gao, X.; Ji, J.; Luo, J.; Hua, H.; Cui, J. Integrated Omics Analysis Reveals Key Pathways in Cotton Defense against Mirid Bug (Adelphocoris suturalis Jakovlev) Feeding. Insects 2024, 15, 254. [Google Scholar] [CrossRef]
  59. Picchioni, G.; Watada, A.; Conway, W.; Whitaker, B.; Sams, C. Phospholipid, galactolipid, and steryl lipid composition of apple fruit cortical tissue following postharvest CaCl2 infiltration. Phytochemistry 1995, 39, 763–769. [Google Scholar] [CrossRef]
  60. Wang, X.; Kong, L.; Zhi, P.; Chang, C. Update on cuticular wax biosynthesis and its roles in plant disease resistance. Int. J. Mol. Sci. 2020, 21, 5514. [Google Scholar] [CrossRef] [PubMed]
  61. Ayaz, A.; Huang, H.; Zheng, M.; Zaman, W.; Li, D.; Saqib, S.; Zhao, H.; Lü, S. Molecular cloning and functional analysis of GmLACS2-3 reveals its involvement in cutin and suberin biosynthesis along with abiotic stress tolerance. Int. J. Mol. Sci. 2021, 22, 9175. [Google Scholar] [CrossRef] [PubMed]
  62. Pérez-Mesa, P.A.; Roda, F. Alkaloid evolution in the Solanaceae. Curr. Opin. Plant Biol. 2025, 85, 102727. [Google Scholar] [CrossRef]
  63. Xie, Y.; Xu, Y.; Jia, H.; Wang, K.; Chen, S.; Ma, T.; Niu, Q. Tomato MADS-RIN regulates GAME5 expression to promote non-bitter glycoalkaloid biosynthesis in fruit. Plant J. 2024, 120, 2500–2514. [Google Scholar] [CrossRef]
  64. Adedayo, B.C.; Oyeleye, S.I.; Okeke, B.M.; Oboh, G. Anti-cholinesterase and antioxidant properties of alkaloid and phenolic-rich extracts from pawpaw (Carica papaya) leaf: A comparative study. Flavour Fragr. J. 2021, 36, 47–54. [Google Scholar] [CrossRef]
  65. Melo Czekster, C.; Robertson, W.E.; Walker, A.S.; Söll, D.; Schepartz, A. In vivo biosynthesis of a β-amino acid-containing protein. J. Am. Chem. Soc. 2016, 138, 5194–5197. [Google Scholar] [CrossRef] [PubMed]
  66. Satoh, S.; Esashi, Y. D-Amino-acid-stimulated ethylene production in seed tissues. Planta 1980, 149, 64–68. [Google Scholar] [CrossRef]
  67. Wang, L.; Liu, L.; Huang, A.; Zhang, H.; Zheng, Y. The metabolism of amino acids, AsA and abscisic acid induced by strigolactone participates in chilling tolerance in postharvest zucchini fruit. Front. Plant Sci. 2024, 15, 1402521. [Google Scholar] [CrossRef] [PubMed]
  68. Takahashi, H.; Kurimoto, S.-I.; Kobayashi, J.; Kubota, T. Ishigadine A, a new canthin-6-one alkaloid from an Okinawan marine sponge Hyrtios sp. Tetrahedron Lett. 2018, 59, 4500–4502. [Google Scholar] [CrossRef]
  69. Wang, Z.; Xiao, Y.; Wu, S.; Chen, J.; Li, A.; Tatsis, E.C. Deciphering and reprogramming the cyclization regioselectivity in bifurcation of indole alkaloid biosynthesis. Chem. Sci. 2022, 13, 12389–12395. [Google Scholar] [CrossRef]
  70. Senecoff, J.F.; McKinney, E.C.; Meagher, R.B. De novo purine synthesis in Arabidopsis thaliana (II. the PUR7 gene encoding 5 [prime]-phosphoribosyl-4-(N-succinocarboxamide)-5-aminoimidazole synthetase is expressed in rapidly dividing tissues). Plant Physiol. 1996, 112, 905–917. [Google Scholar] [CrossRef]
  71. Sun, M.; Dai, P.; Cao, Z.; Dong, J. Purine metabolism in plant pathogenic fungi. Front. Microbiol. 2024, 15, 1352. [Google Scholar] [CrossRef] [PubMed]
  72. Liu, X.; Zhong, C.; Xie, J.; Liu, H.; Xie, Z.; Zhang, S.; Jin, J. Geographical region traceability of Poria cocos and correlation between environmental factors and biomarkers based on a metabolomic approach. Food Chem. 2023, 417, 135817. [Google Scholar] [CrossRef]
  73. Sun, Q.; Wu, F.; Wu, W.; Yu, W.; Zhang, G.; Huang, X.; Hao, Y.; Luo, L. Identification and quality evaluation of Lushan Yunwu tea from different geographical origins based on metabolomics. Food Res. Int. 2024, 186, 114379. [Google Scholar] [CrossRef]
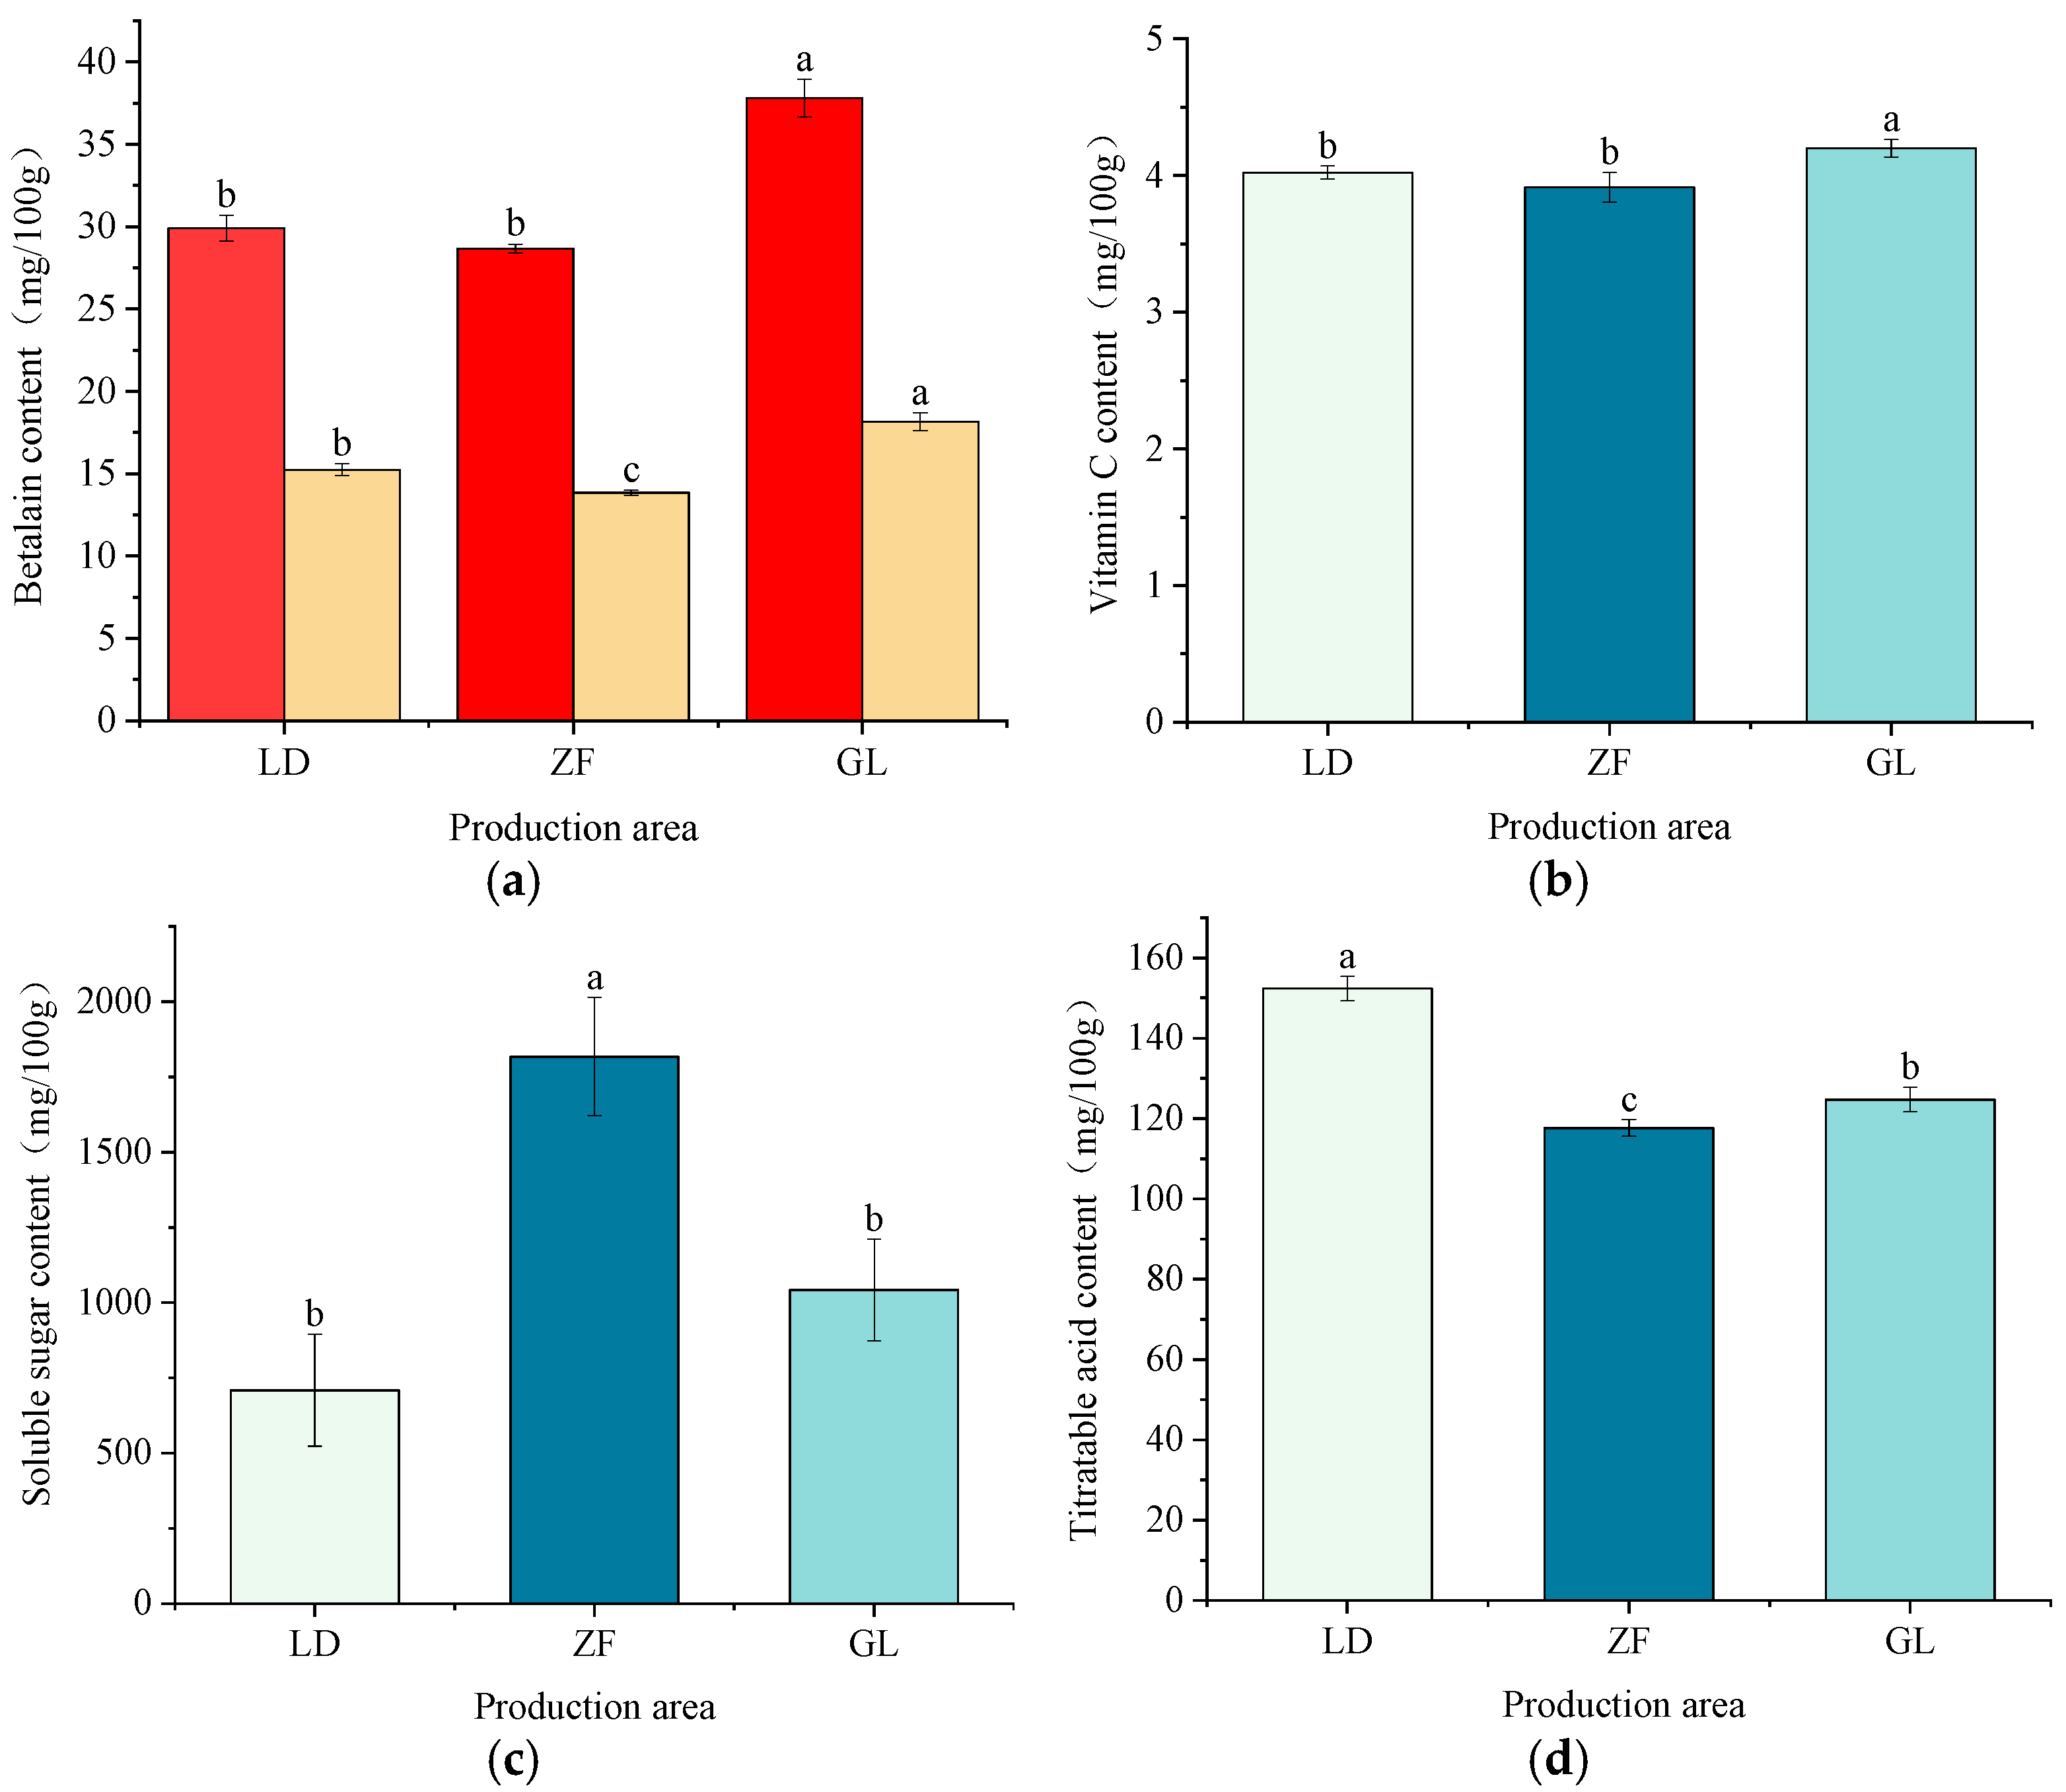
Figure 1. Differences in nutritional functional components of red-fleshed pitaya from different producing areas. (a) Content of betacyanins (red bars) and betaxanthins (yellow bars); (b) Vitamin C content; (c) Soluble sugar content; (d) Titratable acid content; (e) Total phenol content; (f) Flavonoid content. Note: Different lowercase letters (a, b, c) above the bars indicate significant differences among groups (p < 0.05).
Horticulturae 11 01436 g001aHorticulturae 11 01436 g001b
Figure 2. (a) Classification of the 4515 metabolites in dragon fruit samples; (b) Differences in metabolite contents among dragon fruits from different producing areas.
Horticulturae 11 01436 g002
Figure 3. (a) Principal component analysis; (b) OPLS-DA analysis of pitaya samples from different producing areas; (c) 200 permutation tests for the OPLS-DA model; (d) The S-Plot of OPLS-DA.
Horticulturae 11 01436 g003aHorticulturae 11 01436 g003b
Figure 4. Cluster Analysis. (a) Analysis of the hierarchical clustering heatmap for metabolites in dragon fruit samples from different producing areas; (b) K-means cluster analysis of red-fleshed pitaya samples from different origins.
Horticulturae 11 01436 g004aHorticulturae 11 01436 g004b
Figure 5. Differential Metabolite Analysis. (ac) Volcanograms of differential metabolites of GL vs. LD, GL vs. ZF, ZF vs. LD. Note: Red dots indicate up-regulated differential metabolites, green dots indicate down-regulated differential metabolites, and grey dots indicate no significant difference metabolites; the abscissa represents the change in difference multiples, and the ordinate represents the level of difference visibility. Two vertical dotted lines represent the threshold values for the fold change of up-regulated and down-regulated differential molecules. (d) Common differential metabolites among the comparison groups of GL vs. LD, GL vs. ZF, and ZF vs. LD; (e) Venn diagram of pairwise comparisons.
Horticulturae 11 01436 g005aHorticulturae 11 01436 g005b
Figure 6. KEGG Enrichment Analysis. (ac) Differential metabolite pathway enrichment maps representing GL vs. LD, GL vs. ZF, and ZF vs. LD, respectively; (df) Denote the score plot of GL vs. LD, GL vs. ZF, and ZF vs. LD, respectively.
Horticulturae 11 01436 g006aHorticulturae 11 01436 g006b
Table 1. Climatic factors in the main production areas of different red-fleshed pitayas.
AreaDaily
Average
Temperature
(°C)
Daily
Maximum Temperature
(°C)
Daily
Minimum
Temperature
(°C)
Relative
Humidity
(%)
Annual
Rainfall
(mm)
Sunshine Duration
(h)
Altitude
(m)
Monthly Average Temperature
(°C)
Monthly Average Relative Humidity (%)Monthly Sunshine Duration (h)
LD25.634.4922.2451596.811.2440.127.178268.7
ZF22.632.0119.0170658.79.61063.823.378275.6
GL24.732.7719.47601239.99.71138.42474273.8
Table 2. The top 8 metabolites that contribute the most to the classification of pitayas from different origins.
IndexCompoundsClassFormula
MEDP0017L-HistidineAmino acids and derivativesC6H9N3O2
MEDL00353Glu-LeuAmino acids and derivativesC11H20N2O5
MW0152601Leu-GluAmino acids and derivativesC11H20N2O5
MW0152405Leu-Leu-Ser-Pro-TyrAmino acids and derivativesC29H45N5O8
MW01045522-amino-4-({1-[(carboxymethyl)-C-hydroxycarbonimidoyl]-2-[(3-hydroxy-2-methyl-4-oxobutan-2-yl)sulfanyl]ethyl}-C-hydroxycarbonimidoyl)butanoic acidOrganic acidsC15H25N3O8S
MEDN1093(2S)-2-IsopropylmalateOrganic acidsC7H12O5
MEDP0179UridineNucleotides and derivativesC9H12N2O6
MW0043185CL(i-13:0/i-13:0/i-12:0/18:2(9Z,11Z))GPC65H122O17P2
Disclaimer/Publisher’s Note: The statements, opinions and data contained in all publications are solely those of the individual author(s) and contributor(s) and not of MDPI and/or the editor(s). MDPI and/or the editor(s) disclaim responsibility for any injury to people or property resulting from any ideas, methods, instructions or products referred to in the content.