Article

LED Light and Plant Growth Regulators Affect Callus Induction, Shoot Organogenesis, dl-Tetrahydropalmatine Accumulation, and Activities of Antioxidant Enzymes in Corydalis turtschaninovii Besser

1
School of Agricultural Science and Technology, Shandong Agricultural and Engineering University, Jinan 250100, China
2
Department of Horticulture, Division of Applied Life Science (BK21 Plus Program), Graduate School, Gyeongsang National University, Jinju 52828, Republic of Korea
3
Division of Horticultural Science, College of Agriculture and Life Sciences, Gyeongsang National University, Jinju 52828, Republic of Korea
*
Author to whom correspondence should be addressed.
Horticulturae 2025, 11(12), 1420; https://doi.org/10.3390/horticulturae11121420
Submission received: 13 October 2025 / Revised: 18 November 2025 / Accepted: 19 November 2025 / Published: 24 November 2025
(This article belongs to the Section Medicinals, Herbs, and Specialty Crops)

Abstract

The genus Corydalis, belonging to the Papaveraceae family, is widely distributed across the Northern Hemisphere, primarily in Asia. This study aimed to investigate the effect of plant growth regulators (PGRs) on callus induction, and of light quality and intensity on indirect shoot organogenesis, dl-Tetrahydropalmatine (dl-THP) accumulation, and activities of antioxidant enzymes in Corydalis turtschaninovii Besser. Calli were successfully induced from the leaf, tuber, and petiole explants with different PGR combinations. The best callus induction from leaf, tuber, and petiole explants were obtained in the medium supplemented with 3 mg·L−1 kinetin (Kn) combined with 0.8 mg·L−1 naphthalene acetic acid (NAA), 3 mg·L−1 benzyl adenine (BA) combined with 0.8 mg·L−1 NAA, and 2 mg·L−1 BA combined with 0.5 mg·L−1 NAA, respectively. For indirect shoot organogenesis, calli were cultured on the Murashige and Skoog (MS) medium under dark (D), white (W), red (R), blue (B), or 1:1 mixture of red and blue (RB) light-emitting diodes (LEDs) at an intensity of 25 or 50 µmol·m−2·s−1 photosynthetic photon flux density (PPFD) for six weeks. The RB treatment increased biomass accumulation of the callus, and promoted the induction of the shoot from the callus, whereas the R treatment promoted the dl-THP accumulation, especially with the higher light intensity. Light quality and intensity significantly influenced the activities of antioxidant enzymes and the 1,1-diphenyl-2-picrylhydrazyl (DPPH) radical scavenging capacity in calli, with the most pronounced effects observed under B or RB light treatments. Taken together, the application of monochromatic LED or combinations of red and blue LEDs could be used for the callus culture for different purposes in vitro.

1. Introduction

The genus Corydalis, belonging to the Papaveraceae family, comprises approximately 500 species and is widely distributed across the Northern Hemisphere [1], particularly in Asian countries, such as Korea, China, Japan, and India. The Corydalis turtschaninovii Besser is one kind of perennial medicinal and garden plant species with multiple pharmaceutical benefits and economic values [2]. The plant extracts exhibit significant analgesic effects and notable antithrombotic properties [3,4]. The plant is usually 10–30 cm long in height and consists of thin, green stems with two or three leaves, and delicate flower bunches with underground yellow, rounded tuber about 10–25 mm long.
To overcome the dependency of commercial production on natural plants due to high anthropogenic and technogenic load on biogeocenoses [5], studies about the Corydalis genus mainly focused on industrial large-scale production of the important alkaloids. In vitro plant callus and suspension culture systems serve as viable alternatives for sourcing biologically active plant compounds. These biotechnological methods enable consistent production irrespective of external environmental factors, thereby supporting the conservation of natural habitats of medicinal plants. The production and isolation of alkaloids from callus cultures, as opposed to intact plants, offer a streamlined approach for pharmaceutical synthesis and commercial application [6]. This is because in vitro-cultured explants retain the biosynthetic capacity to produce alkaloids comparable to that of their mother plants [7,8]. The high yield of secondary metabolites could be achieved in callus cultures induced from explants [9]. Studies on the effects of explants and combinations of PGRs on callus induction in the Corydalis genus species have been conducted, while callus induction from various explants of C. turtschaninovii has not been reported. Calli was successfully induced from the stem or petiole explants in C. pallida and C. incisa with 1 mg·L−1 2,4-dichlorophenoxyacetic acid (2,4-D) and 0.1 mg·L−1 kinetin (Kn), respectively [10]. In C. yanhusuo, tuber explant was used in callus induction with 2 mg·L−1 6-benzyladenine (BA) and 0.5 mg·L−1 α-naphthalene acetic acid (NAA) [11]. Furthermore, immature seeds were also applied as explants to induce callus in C. remota with 1 mg·L−1 NAA and 0.5 mg·L−1 BA [12]. An efficient in vitro regeneration system for C. saxicola Bunting was established via cytokinin-induced shoot organogenesis. The optimal shoot induction occurred on MS medium containing 2.0 µM BA and 0.5 µM NAA [13]. This tissue culture method facilitated the optimization of production and isolation of alkaloids, particularly those derived from slow-growing plants or those difficult to synthesize with chemical methods [14].
Studies focused on medicinal ingredients revealed that tubers of C. turtschaninovii contained more than 20 kinds of alkaloids, including dl-Tetrahydropalmatine, d-Corydaline, protopine, dl-Tetrahydrocoptisine, and dl-Tetrahydrocolumbamine, which were linked to pharmaceutical functions and clinical efficacies. dl-Tetrahydropalmatine (dl-THP) is an isoquinoline derivative alkaloid and is usually isolated from the Corydalis genus plant species. It has active pharmacological effects including analgesic [15], anti-arrhythmic [16], anti-epileptic [17], and protective effects against neurodegenerative diseases [18]. Studies showed that abscisic acid [19] and the concentration ratios of NH4+ to NO3 [20] influenced the accumulation of dl-THP in C. yanhusuo. It has been shown that endogenous signal components, such as jasmonic acid, methyl jasmonate, and reactive oxygen species, are involved in the synthesis signal networks of secondary metabolites [21]. However, the role of light in the biosynthesis of alkaloids in C. turtschaninovii has not been studied.
Light quality and intensity greatly affect plant morphological development and the synthesis of valuable bioactive compounds. Previous studies have shown that culture environments had impacts on the induction of adventitious shoot and bioactive compounds produced in vitro [22]. Several studies revealed that the effects of a specific spectrum on morphology and metabolite contents varied in the same plant [23,24]. The percentage of shoot proliferation of Brassica napus [25] and frequency of shoot regeneration and the number of shoots of Curculigo orchioides [26] were larger under blue light. In recent years, light-emitting diodes (LEDs) as energy-efficient and wavelength-specific lighting sources have been widely used for different applications of plant tissue culture.
The study provided a comprehensive framework for in vitro production. It outlined a clear two-step strategy. Used optimized PGRs were used for high-frequency callus initiation to generate raw material, and specific LED light regimes were applied to direct these cultures toward either high biomass propagation or high-value alkaloid synthesis based on the production goal. The aim of this study was to provide a foundational, controllable platform for the consistent and sustainable production of dl-THP and potentially other valuable alkaloids from Corydalis turtschaninovii, paving the way for its future commercial and pharmaceutical application. This development also served as a conservation measure to reduce harvesting pressure on natural populations, which were scarce because of their limited geographic range.

2. Materials and Methods

2.1. Plant Materials and Light Treatments

2.1.1. Explants, PGRs, and Culture Conditions for Callus Induction

The plant specimen Corydalis turtschaninovii Besser was collected on 25 March 2015 from Oryongmyo, Seonyudo-ri, Okdo-myeon, Gunsan-si, Jeollabuk-do, Korea and was deposited in the National Institute of Biological Resources of Korea under the voucher specimen number NIBRVP0000612180. The collected tubers were cleaned under running tap water and subsequently surface-sterilized by immersion in 70% ethanol (Thermo Fisher Scientific, Waltham, MA, USA) for 1 min, followed by treatment with 0.5% sodium hypochlorite for 10 min from the same supplier. Then, they were cultured on Murashige and Skoog (MS) (Phytotechlab, Lenexa, KS, USA) medium in a plastic Petri dish with 3% (w/v) sucrose and 0.8% (w/v) agar and allowed to grow until plantlets developed. These plantlets, after eight weeks of growth, were used as the experimental material for callus induction experiment. The Petri dish had a diameter of 60 mm, a culture area of 21 cm2, and a maximum capacity of 7 mL of medium. The pH of the medium was adjusted to 5.80 using 0.1 N NaOH or 0.1 N HCl and the medium was autoclaved at 121 °C for 15 min. The plantlets were cultured in the chamber with a day/night temperature of 25/18 °C, 75% relative humidity (RH), and 16 h of daily photoperiod under white LED (40 W, Philips, Eindhoven, The Netherlands) at an intensity of 50 µmol·m−2·s−1 photosynthetic photon flux density (PPFD) measured with a photo/radiometer (HD 2102.2, Delta OHM, Padova, Italy). The leaf, tuber, and petiole explants derived from the plantlets were used as materials. The explants were cut into consistent-sized pieces and planted on the MS media or the MS media supplemented with 1, 2, or 3 mg·L−1 6-benzyladenine (BA) or kinetin (Kn) combined with 0.2, 0.5, or 0.8 mg·L−1 1-naphthylacetic acid (NAA) for induction of callus under a dark and day/night temperature of 25/18 °C condition with 70% RH. The plant growth regulators 6-BA, Kn, and NAA were purchased from Sigma-Aldrich Chemical Corporation (St. Louis, MO, USA). Frequency of callus induction and fresh weight were recorded after six weeks of culture. The frequency of callus induction was calculated in one Petri dish as (number of explants producing callus/total number of explants inoculated) × 100% and the calli were weighed individually. The data were reported as mean ± standard error (n = 9). Each treatment consisted of three biological replicates, with each Petri dish containing three explant pieces.

2.1.2. Effect of Light Intensity and Quality on Indirect Shoot Induction and dl-Tetrahydropalmatine Accumulation

The 0.2 g healthy growing calli induced from the tuber explant of C. turtschaninovii with 3.0 mg·L−1 BA combined with 0.8 mg·L−1 NAA were cultured on the 20 mL PGR-free MS media containing 30 g·L−1 sucrose and 0.8% agar. The calli were incubated in a growth chamber for six weeks under conditions of 70% RH and day/night temperatures of 25/18 °C. They were exposed to one of the following four light environments: darkness (D) without light contamination; a 16 h daily photoperiod provided by white (W), red (R), blue (B); a 1:1 mixture of red and blue (RB) LEDs (400–700 nm, PSLED-1203-50A, Force Lighting Co. Ltd., Hwaseong, Republic of Korea). The irradiance of different lights is shown in Figure 1. The LED lights were set at an intensity of 25 or 50 µmol·m−2·s−1 photosynthetic photon flux density (PPFD) measured with a photo/radiometer (HD 2102.2, Delta OHM, Padova, Italy). Fresh and dry weights of calli and the number of shoots induced per callus were recorded after six weeks of exposure to different light qualities and intensities. The dry weights were determined after drying for 48 h at 60 °C.

2.2. Quantification of dl-Tetrahydropalmatine (dl-THP) by HPLC

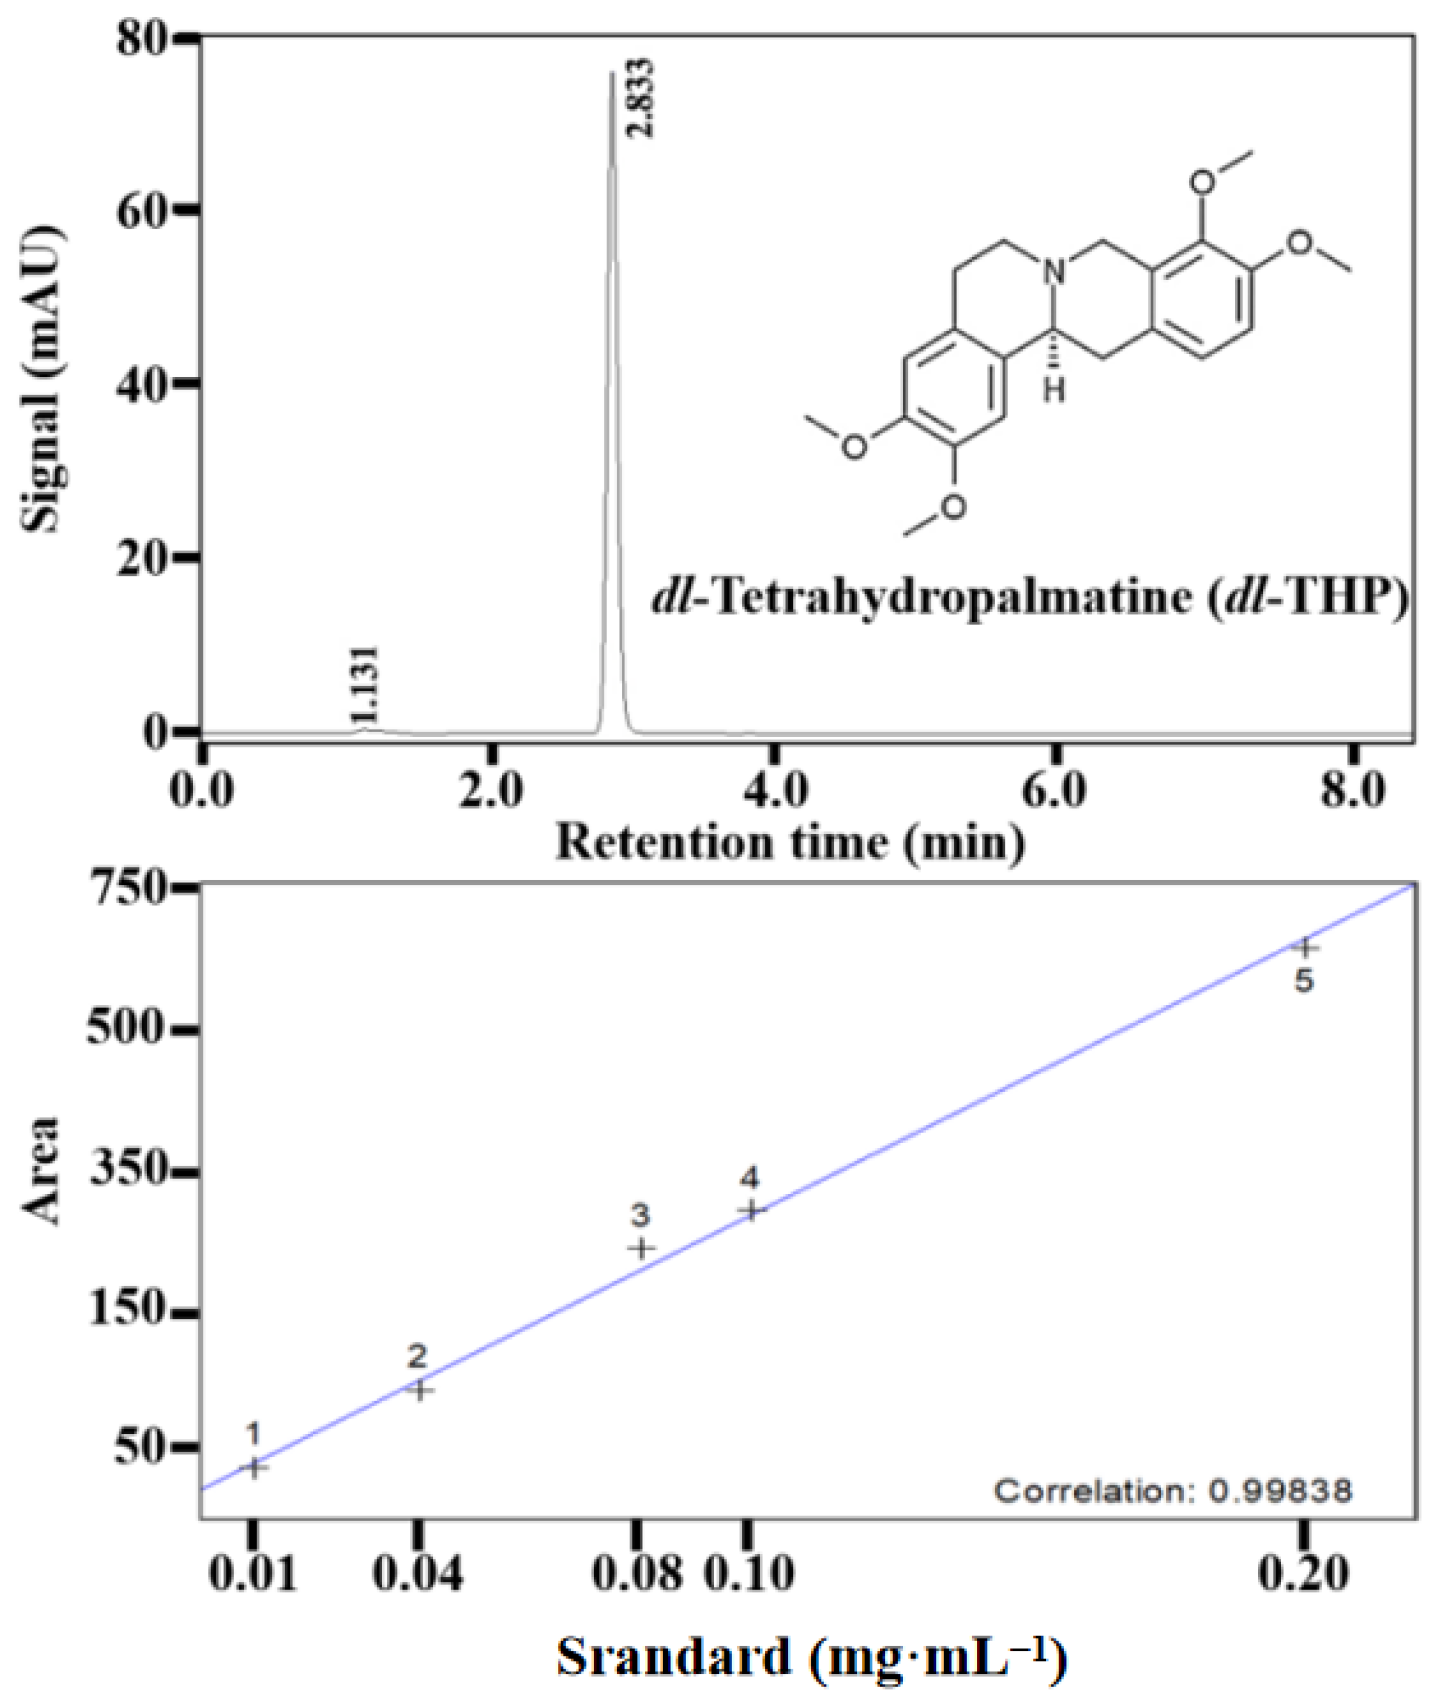
The dry samples of cultures were powdered finely and dissolved with 1 mL methanol, and the mixture was extracted in an ultra-sonication bath (Bandelin Sonorex Super RK156BH, Bandelin Electronic, Berlin, Germany) for 2 h. Subsequently, the supernatant was filtered with a 0.45 mm nylon membrane. An aliquot of 5 μL of filtrates was injected for high-performance liquid chromatography (HPLC) analysis. The dl-THP were quantified through the Agilent 1200 Chemstation HPLC-system with VWD absorbance detector (Agilent 1200, Agilent Technologies Inc., Santa Clara, CA, USA). The Zorbax HPLC column (C18, 5 µm) was used. The mobile phase was acetonitrile/water/acetic acid (60:40:0.5, v/v/v, pH 6.5 adjusted with triethylamine) at a flow-rate of 1 mL·min−1. Detection was set at a wavelength of 280 nm. For this experiment, a series of standards of dl-THP in the range of 0.01–0.20 mg·mL−1 were prepared in methanol. The chromatogram of the reference standard is shown in Figure 2 with the structure in the inset. Quantification was performed using external standard calibration as shown in Figure 2. A linear response with a correlation coefficient of 0.998 (n = 3) was obtained for the standards. All the chemicals used were HPLC grade.

2.3. Analysis of Activities of Antioxidant Enzymes

The antioxidant enzyme assays were performed with three independent replicates, with each replicate consisting of a homogenate prepared from three individual callus cultures within a single Petri dish. The determinations of antioxidant enzymes were carried out in three replicates. The analysis methods were performed as described by Zhao et al. [27]. A total of 100 mg of callus was ground in liquid nitrogen and extracted with a 1.5 mL buffer (50 mM phosphate buffer, 1 mM EDTA, 0.05% Triton X-100, and 2% polyvinylpyrrolidone) and the pH was adjusted to 7.0. The homogenate was centrifuged at 13,000 r·min−1 for 20 min at 4 °C and the supernatant was collected for the measurement of enzyme activities.
Enzyme activities were defined as follows: one unit of catalase (CAT) represented the decomposition of 1 μmol H2O2·min−1; one unit of ascorbate peroxidase (APX) corresponded to the oxidation of 1 μmol ascorbate·min−1; and one unit of peroxidase (POD) was defined as the formation of 1 μmol tetraguaiacol·min−1. For superoxide dismutase (SOD), one unit was defined as the amount of enzyme required to achieve 50% inhibition of nitroblue tetrazolium reduction. The specific activities of all enzymes are expressed as units per milligram of protein (U·mg−1 protein).

2.4. Preparation of Plant Extracts and Determination of 2,2-Diphenyl-1-picrylhydrazyl (DPPH) Free Radical Scavenging Activity

The DPPH free radical scavenging activity was determined as described by Gaafar et al. with modifications [28]. A total of 500 mg of liquid nitrogen-frozen calli samples were blended in 5.0 mL 80% methanol (v/v) overnight and the homogenate was sonicated in an ultra-sonication bath (Bandelin Sonorex Super RK156BH, Bandelin, Germany) for 10 min and centrifuged at 12,000 r·min−1 for 10 min. The supernatant was used for the determination of DPPH free radical scavenging activity. A 1.5 mL reaction solution contained 100 μL extraction of sample or ascorbic acid standard solution and 1.4 mL of DPPH solution. The mixture was incubated for 20 min in a dark environment. Then the absorbance at 517 nm was recorded and converted to DPPH free radical scavenging %. The DPPH free radical scavenging % of each sample were recorded and calculated as standard curve and was expressed on the fresh weight basis as mg ascorbic acid equivalent (AAE) g−1. The capability to scavenge the DPPH radical was calculated by using the following equation.
DPPH free radical scavenging (%) = (1 − As/Ac) × 100
As was the OD value of the sample extracts or ascorbic acid solution. Ac was the OD value of the DPPH solution.
DPPH scavenging activity (mg AAE·g−1 FW) = [X (mg·mL−1) × V (mL)]/W (g)
X (mg·mL−1) was the concentration of the sample solution calculated from the standard curve. V (mL) was the total volume of the sample extract. W (g) was the fresh weight of the plant samples used for extraction.

2.5. Data Collection and Statistical Analysis

The units for the experimental results were as follows. The callus induction rate was expressed in %; the fresh and dry weights for callus biomass accumulation were reported in g; the dl-THP accumulation in callus is measured in mg·g−1 dry weight; the activities of antioxidant enzymes were indicated as U·mg−1 protein; and the DPPH free radical scavenging capacity was represented in mg AAE·g−1 FW.
Each treatment consisted of three biological replicates, with each Petri dish containing three uniform explant or calli pieces. To eliminate positional effects, all Petri dishes were completely randomized on the culture shelf. Data are reported as mean ± standard error (n = 9) and were statistically analyzed based on Petri dish-level averages. The selection between two-way or three-way ANOVA for statistical analysis (*: 0.01 < p ≤ 0.05; **: 0.001 < p ≤ 0.01; ***: p ≤ 0.001; ns: p > 0.05), performed using IBM SPSS Statistics (version 22.0), was based on the number of experimental factors in the respective tests. Tukey’s HSD test was adopted to test significant differences between different means. All graphical representations were generated in OriginPro (v9.0).

3. Results

3.1. Effect of Explant and PGR on Callus Induction

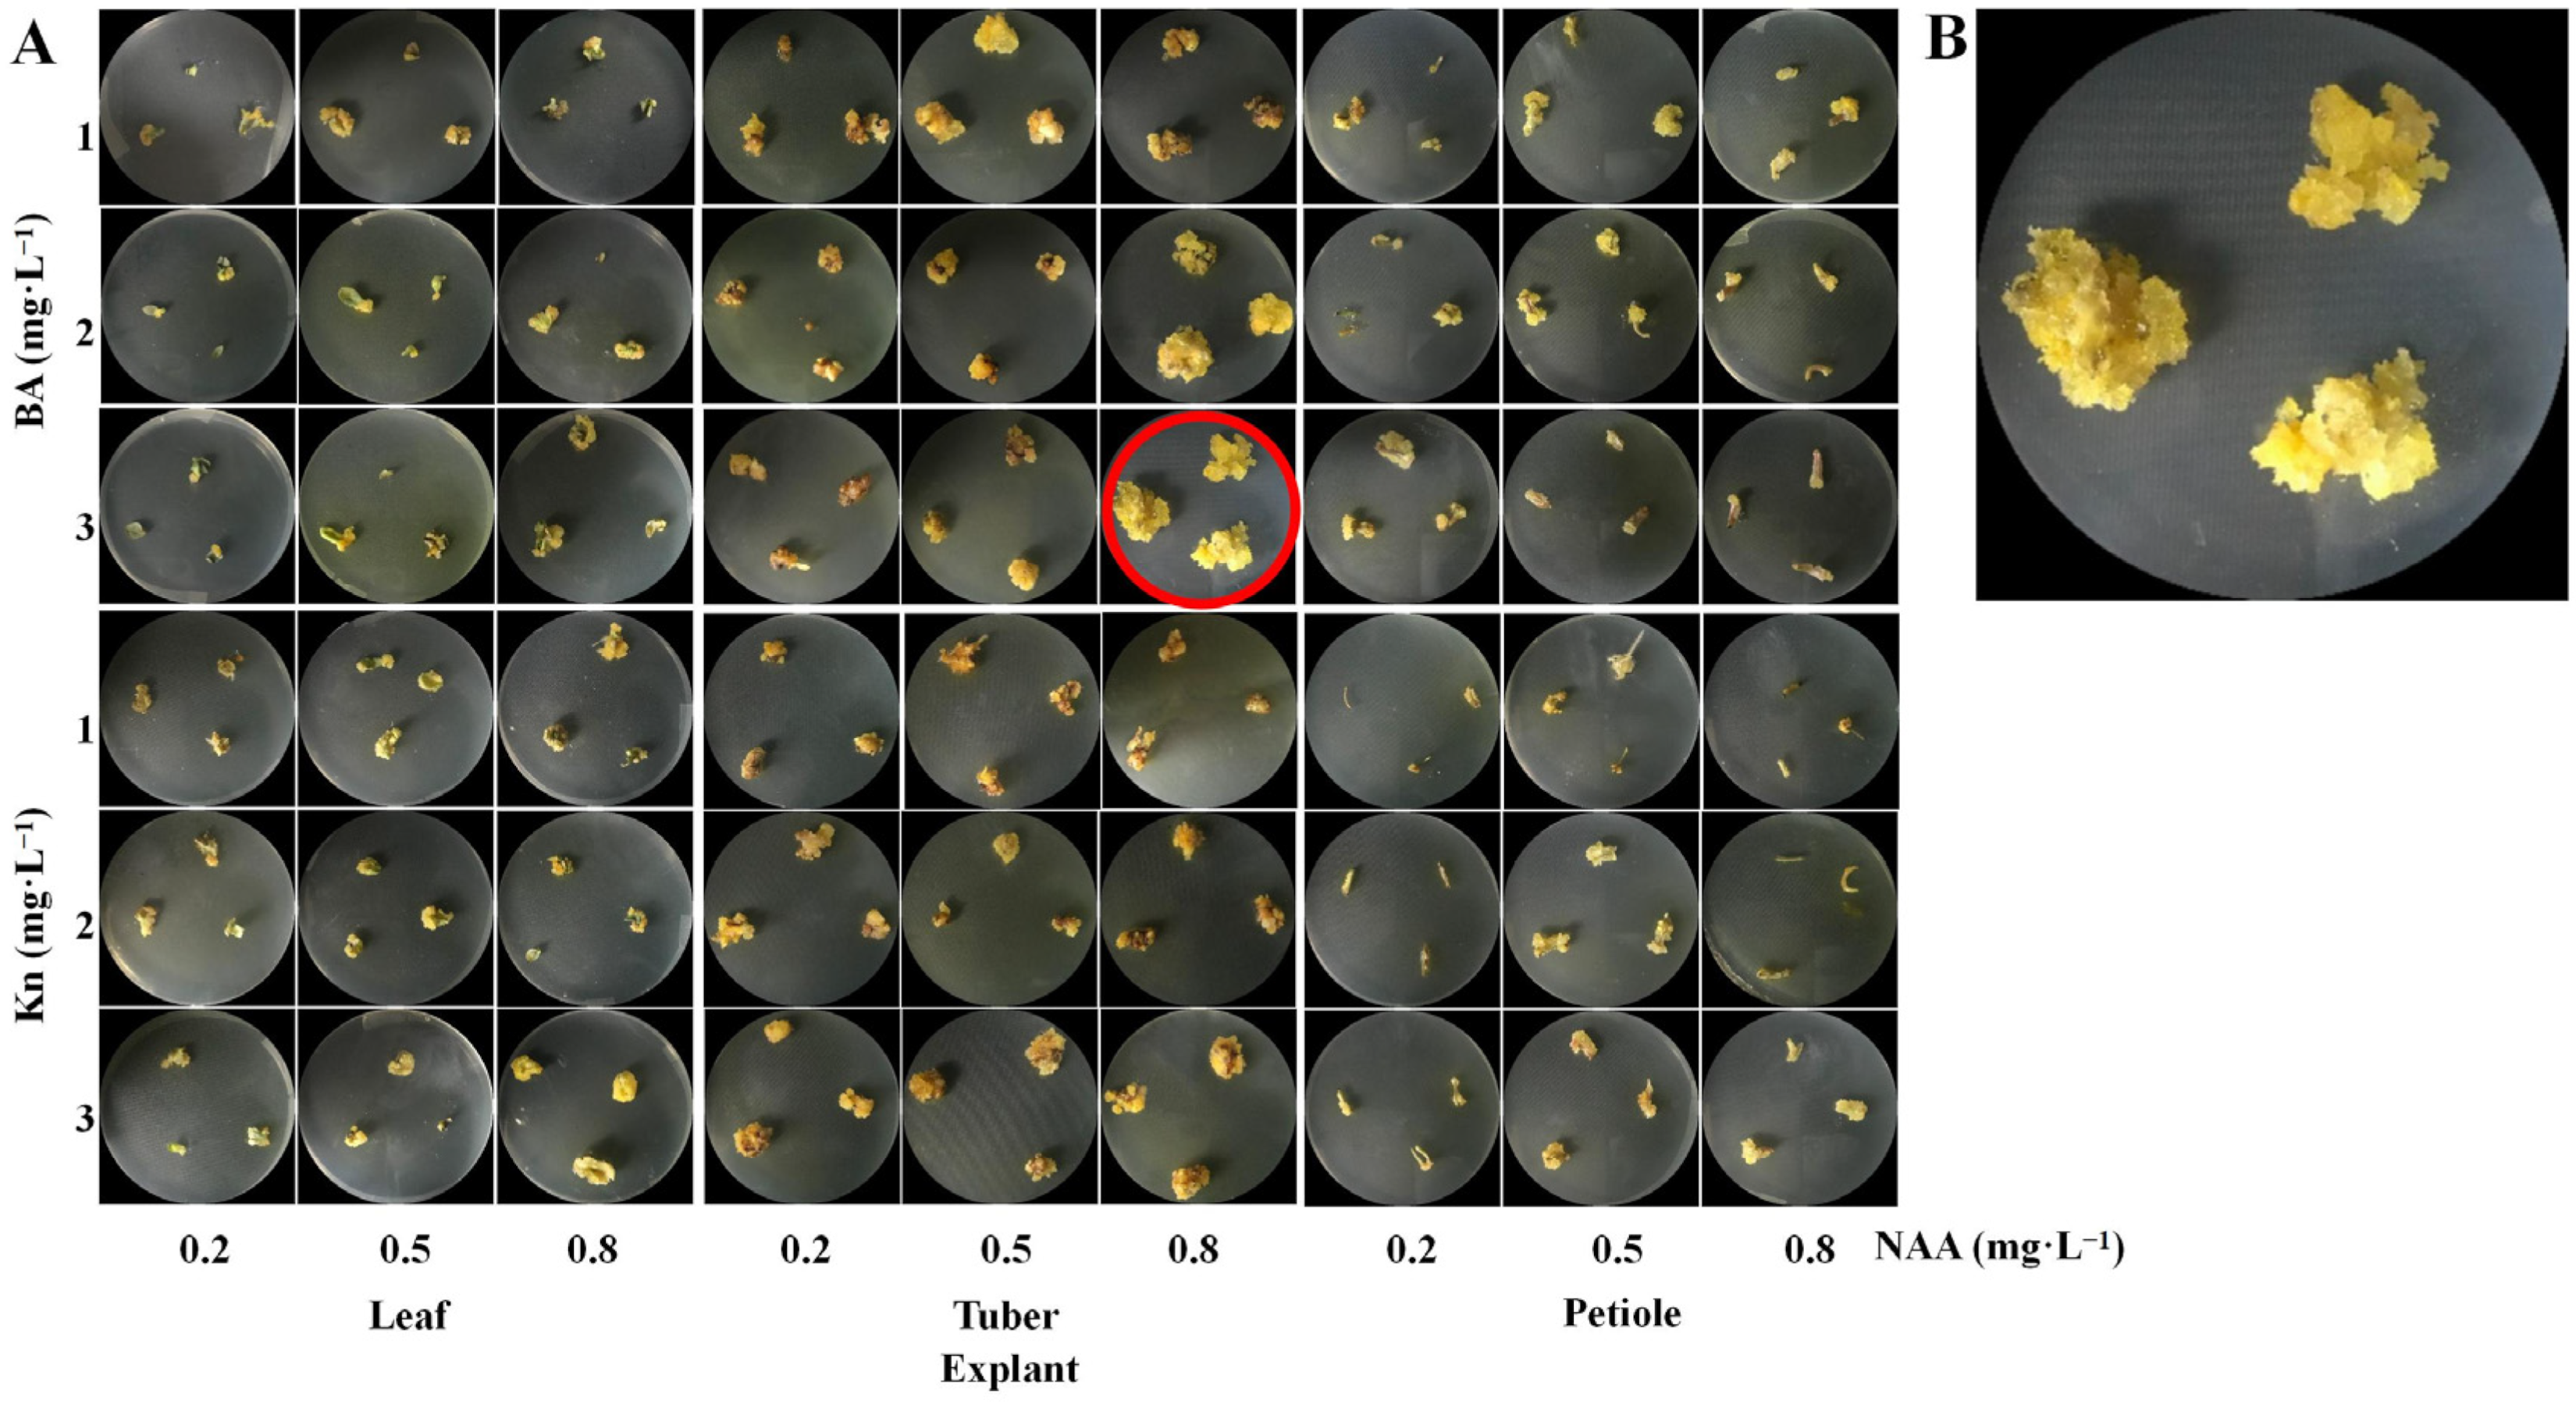
Calli were induced from the leaf, tuber, and petiole explants in all media with PGR supplements. According to the induction frequency and fresh weight of induced callus, different explants showed different responses to the combination of PGRs. Taking into consideration the callus induction frequency, fresh weight, as well as the growth status of callus, the best results of callus induction from leaf, tuber, or petiole were obtained in the media supplemented with 3 mg·L−1 Kn combined with 0.8 mg·L−1 NAA, 3 mg·L−1 BA combined with 0.8 mg·L−1 NAA, or 2 mg·L−1 BA combined with 0.5 mg·L−1 NAA, respectively. The explants became swollen and the calli emerged at the edge, cut position, or surface of the explants with a yellow color after the six weeks of culture. The induction of roots from the callus was also observed with treatments of low concentration of Kn combined with a high concentration of NAA (Table 1, Table 2 and Table 3; Figure 3A). Three-way ANOVA revealed that single factors (cytokinin type, cytokinin concentration, NAA concentration), two-way interactions, and the three-way interaction all had significant effects on the fresh weight of callus induced from leaf, tuber, or petiole explants. However, for callus induction frequency, only the single factor of NAA concentration or the interaction between cytokinin concentration and NAA concentration showed significant effects on callus induction from leaf or petiole explants (Table 4, Table 5 and Table 6). For generating secondary metabolites, suspension cultures developed from friable callus represent a scalable and easily manipulable platform, making them particularly suitable for industrial applications. The calli induced from tuber in the media supplemented with 3 mg·L−1 BA combined with 0.8 mg·L−1 NAA exhibited a fragile and light yellow phenotype with 100% induction ratio and high fresh weight (Figure 3B). The results of the induced calli from the three explants in this experiment showed that tuber turned out to be the best explant due to the maximum fresh weight and the calli were yellowish with fragile appearance, followed by leaf and petiole (Table 1, Table 2 and Table 3, and Figure 3).

3.2. The Effects of the Light Quality and Intensity on the Fresh and Dry Weights of Callus

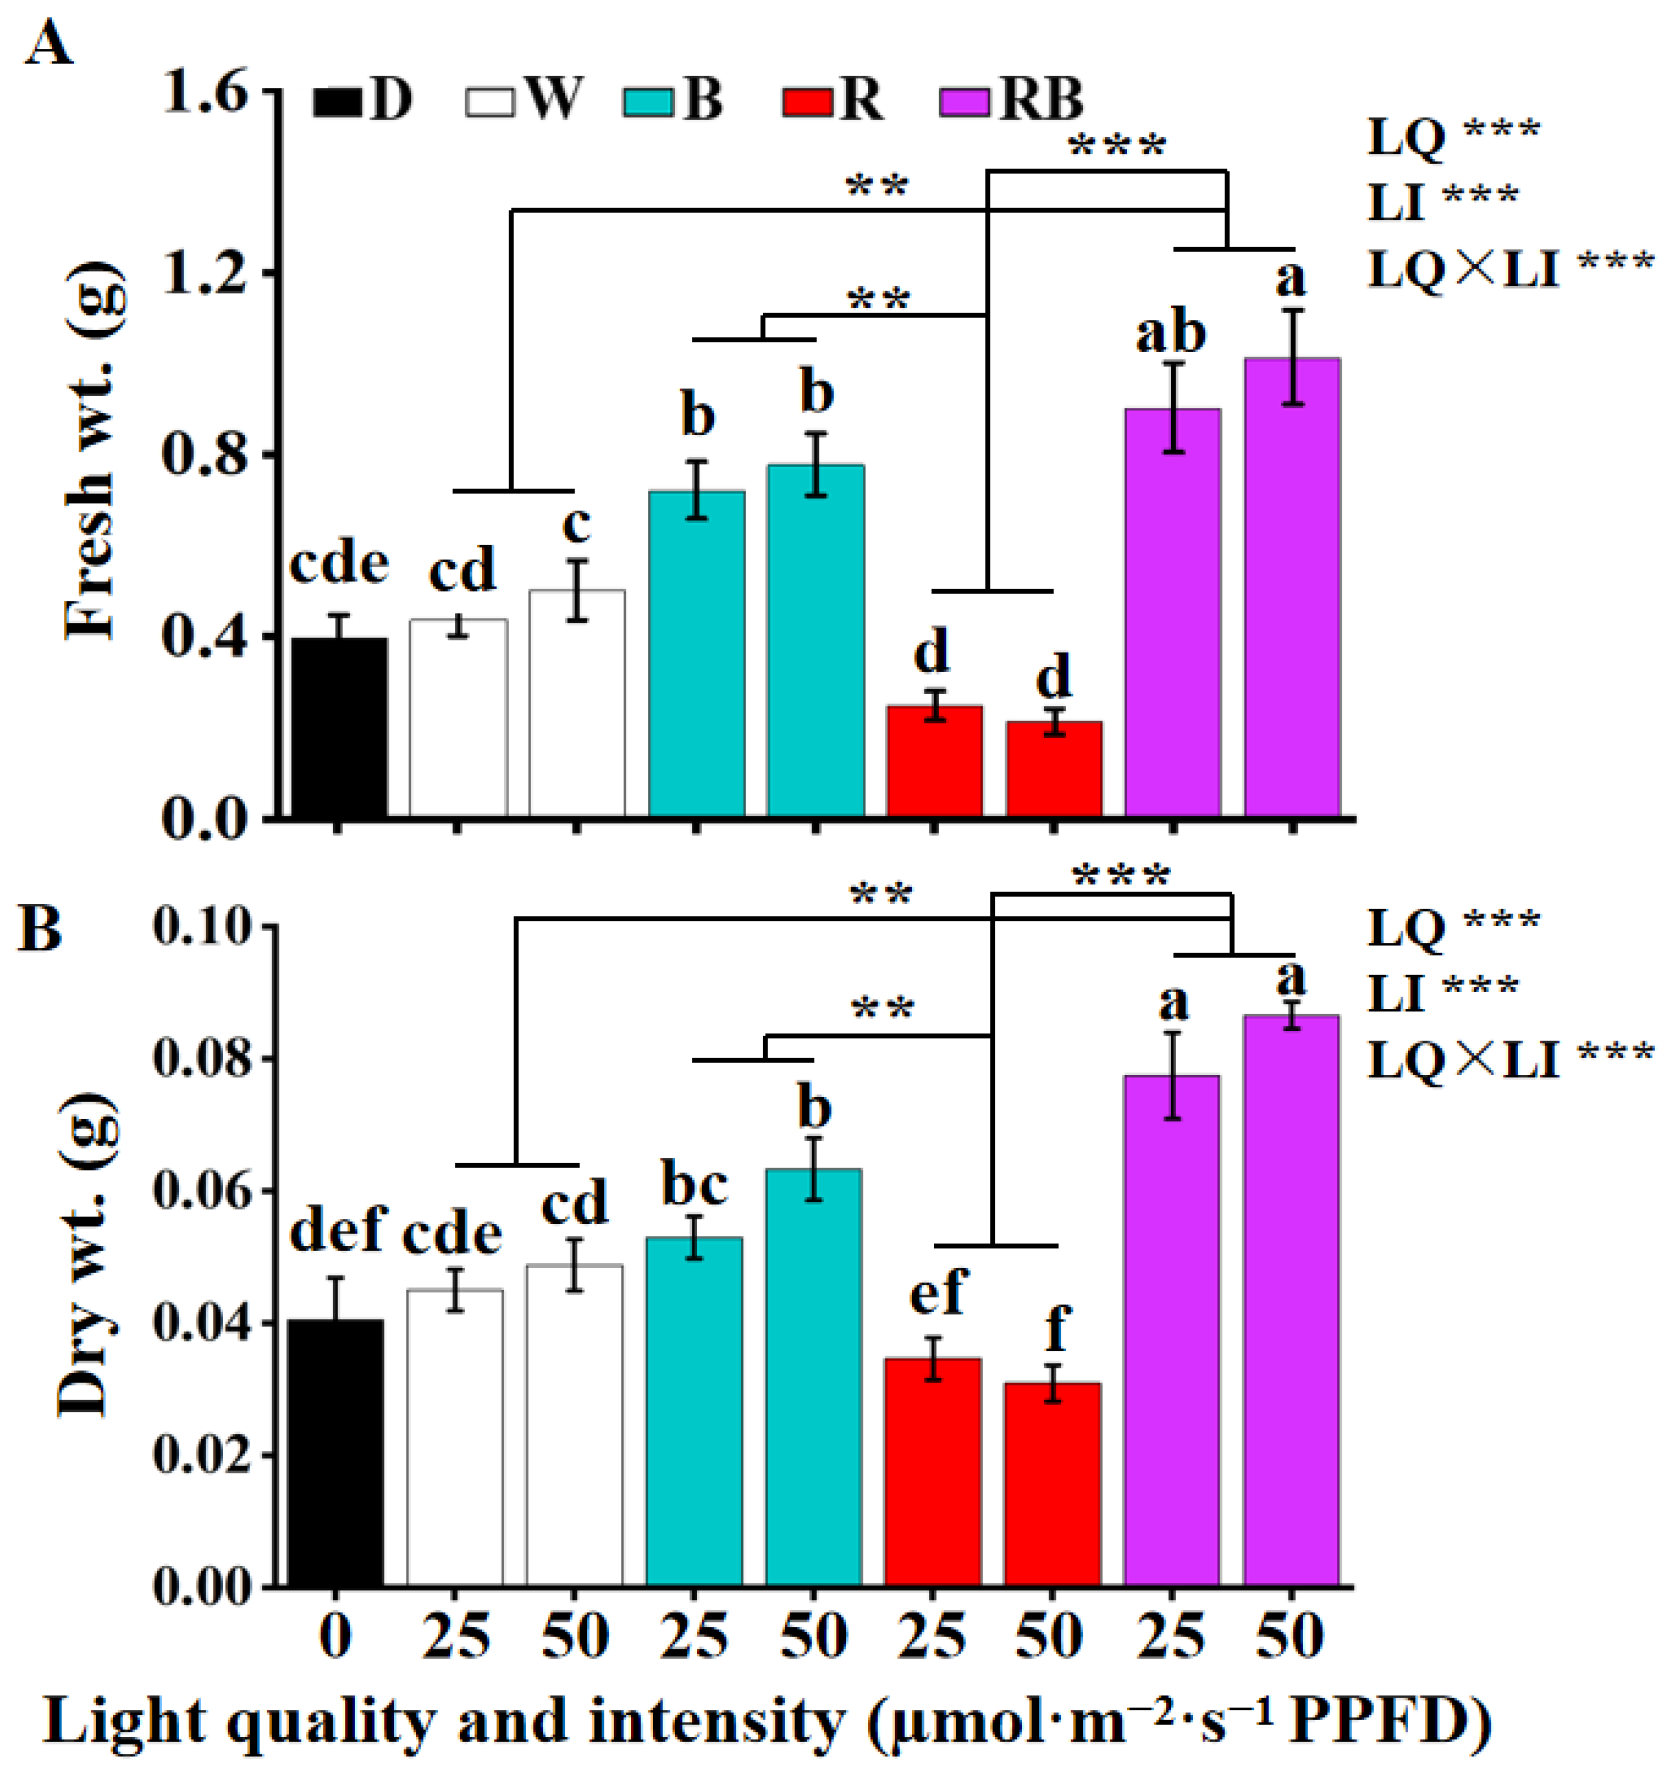
Light plays an essential role in the growth and development of callus. In this study, light quality and intensity had significant effects on the growth of the callus. Among the light conditions, the highest average fresh and dry weights of callus were observed in RB followed by B, W, dark, and R (Figure 4). The 50 µmol·m−2·s−1 PPFD showed a slightly better effect on the fresh weight and dry weights of calli as compared to 25 µmol·m−2·s−1 PPFD. Under 50 µmol·m−2·s−1 PPFD, the value of fresh weight of callus under RB was 1.3, 2.0, 2.6, and 4.7-fold as compared to those under B, W, dark, and R, respectively. Likewise, the value of dry weight under RB was 1.4, 1.8, 2.1, and 2.8-fold approximately as compared to those under B, W, dark, and R, respectively. Two-way ANOVA revealed that single factors (light quality or intensity) and two-way interactions all had significant effects on the fresh and dry weights of callus. Regardless of the light intensity treatment, the RB treatment significantly increased both the fresh and dry weights of callus compared with white and red light treatments (Figure 4).

3.3. Effect of the Light Quality and Intensity on the Shoot Induction from Callus

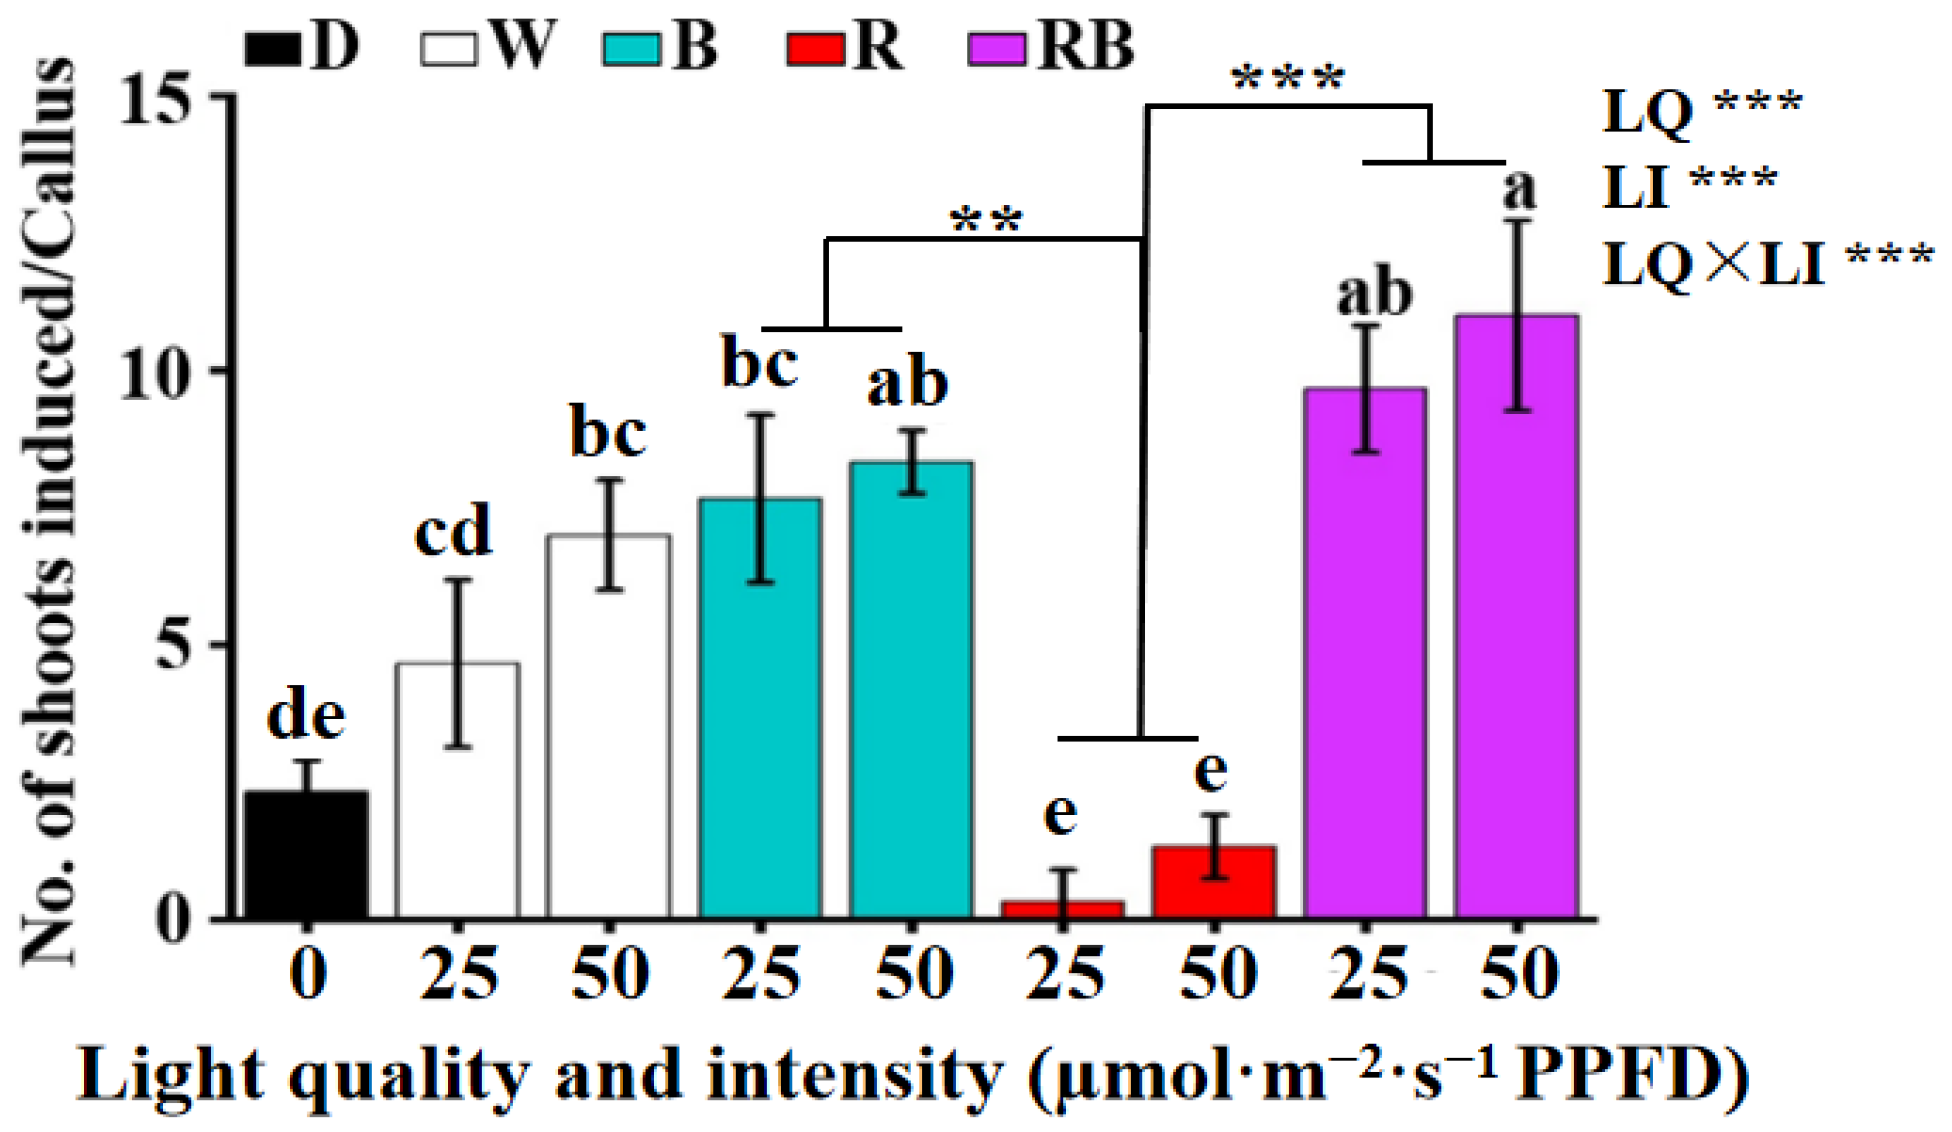
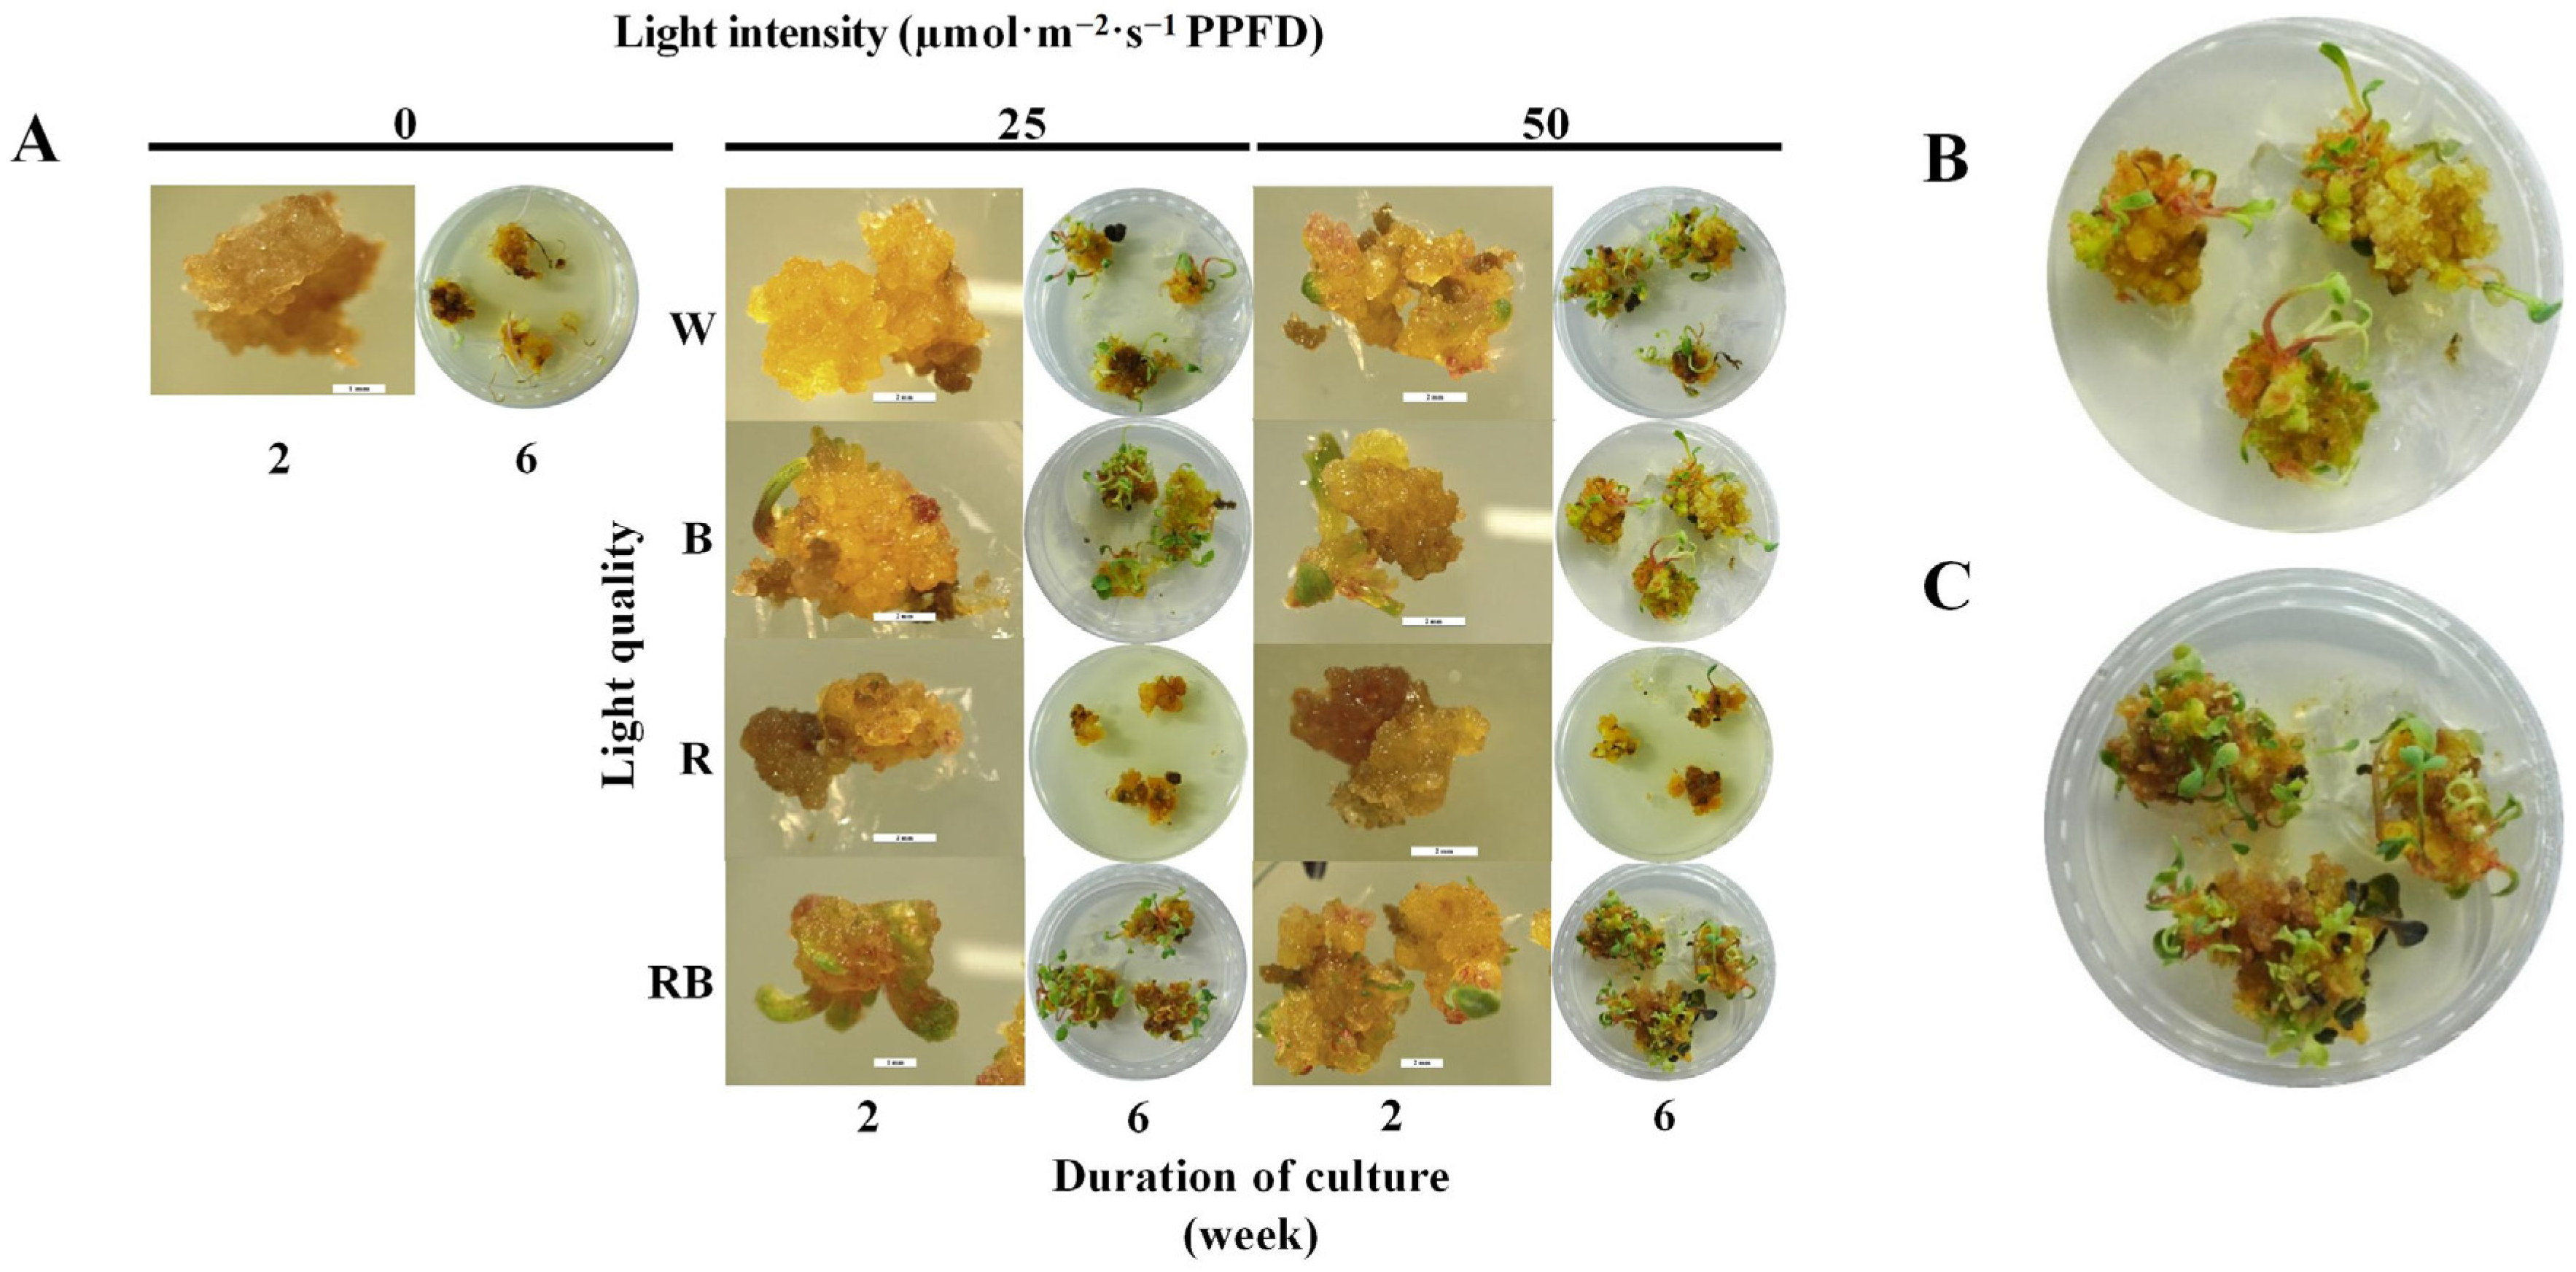
More adventitious shoots induced per callus were observed when the callus was subjected to B or RB, and the R showed the opposite effect (Figure 5). The 50 µmol·m−2·s−1 PPFD also had better effect on the number of shoots induced per callus as compared to 25 µmol·m−2·s−1 PPFD under different light qualities. The R significantly inhibited the shoot induction from callus and the effect was worse than the dark environment. Under 50 µmol·m−2·s−1 PPFD, the number of shoots induced per callus under RB was 1.3, 1.6, 4.7, and 8.3-fold approximately as compared to those under B, W, dark, and R, respectively. As Figure 6 and Table 7 showed, the least number of bud points were observed under R after 2 weeks of culture, and the calli were small and exhibited dark yellow color. The adventitious shoots induced from calli cultured under dark environment became etiolated and experienced browning after six weeks of culture. Two-way ANOVA revealed that single factors (light quality or intensity) and two-way interactions all had significant effects on the number of shoots induced per callus. A significant promotive effect of RB treatment on shoot number per callus was observed compared to B or R light, irrespective of the light intensity (Figure 5).

3.4. Effect of the Light Quality and Intensity on the Accumulation of dl-THP in Callus

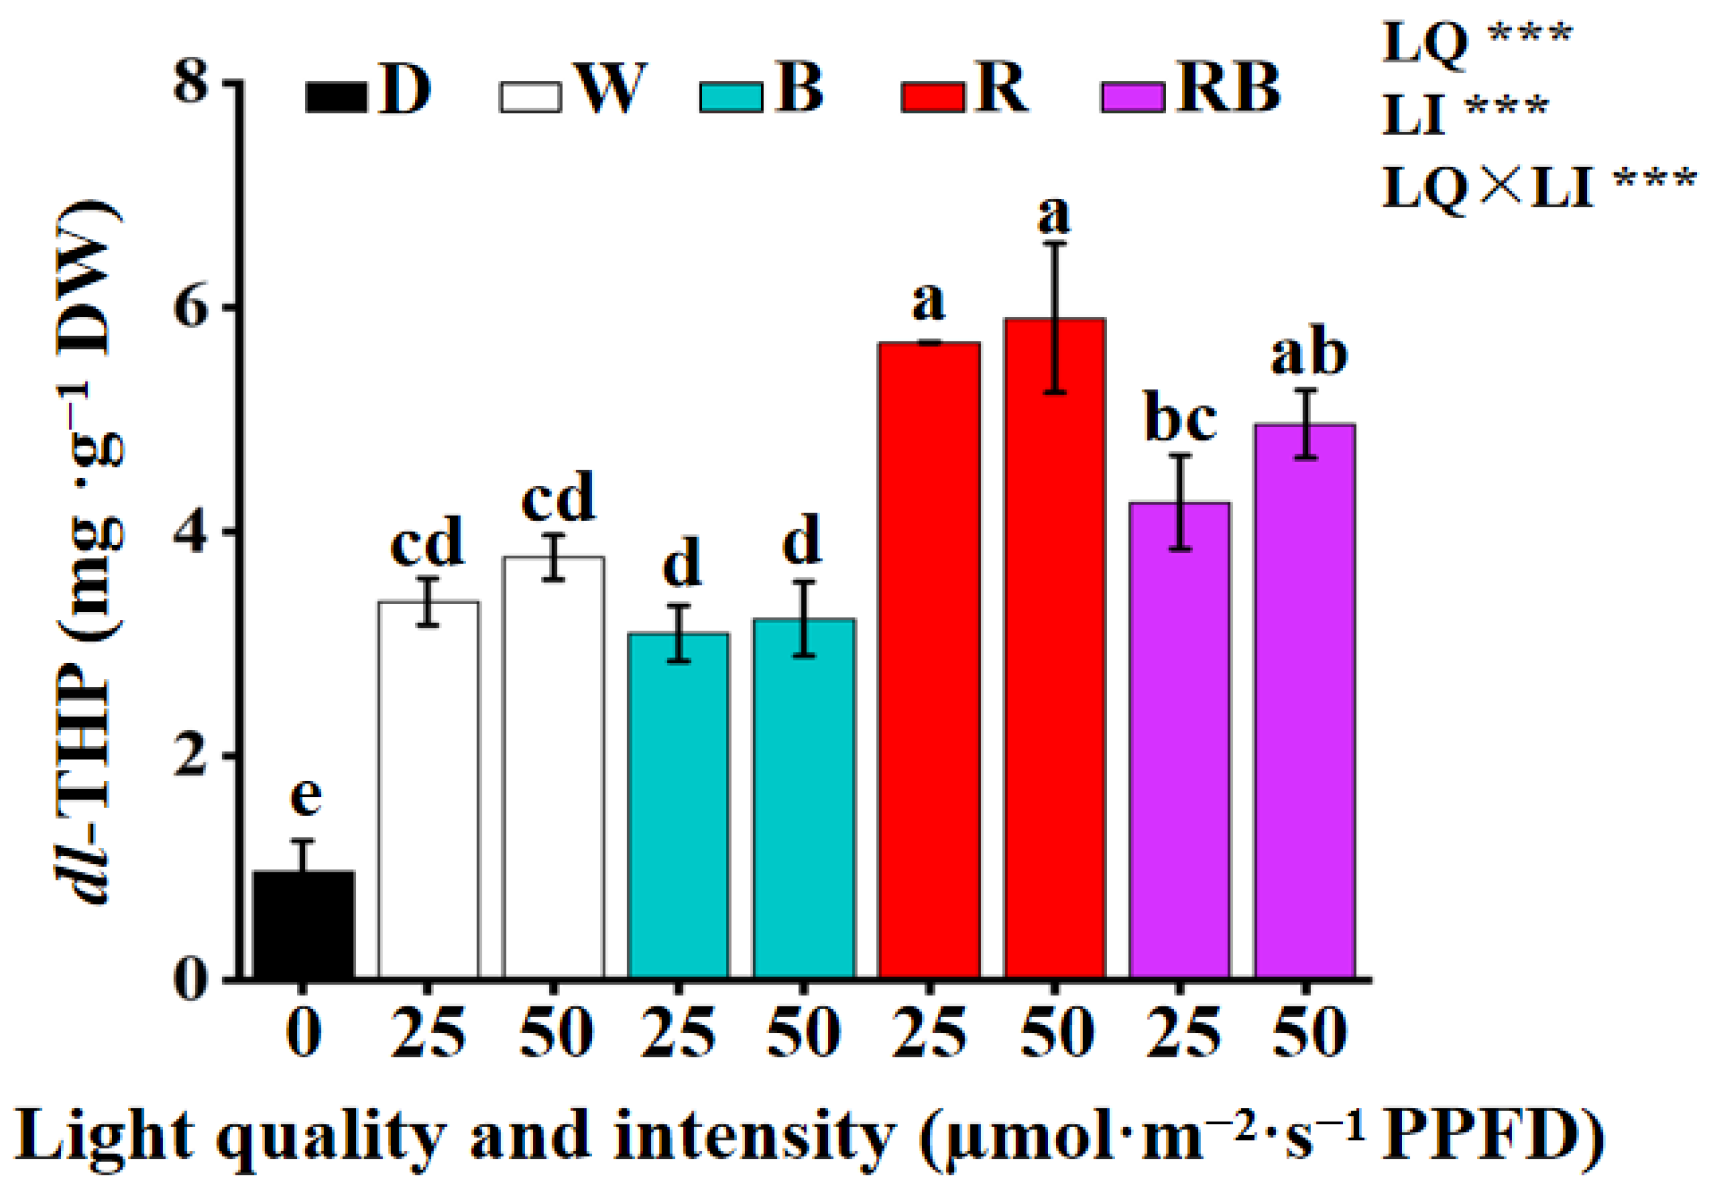
In this study, R exhibited great superior capacity in the production of dl-THP followed by RB, W, B, and D (Figure 7). The 50 µmol·m−2·s−1 PPFD also significantly stimulated the dl-THP accumulation in the callus as compared to 25 µmol·m−2·s−1 PPFD under W, R, and RB (Figure 7). The dark condition resulted in the lowest accumulation of dl-THP. Under the 50 µmol·m−2·s−1 PPFD light intensity condition, the dl-THP accumulation in calli reached to 5.28 mg·g−1 DW under red light irradiation, whereas only 0.72 mg·g−1 DW was detected under dark conditions. Two-way ANOVA revealed that single factors (light quality or intensity) and interactions of two factors all had significant effects on dl-THP accumulation in callus.

3.5. The Effects of the Light Quality and Intensity on the Activities of Antioxidant Enzyme

In this study, the activities of antioxidant enzyme in callus grown under different light qualities and intensities were determined.
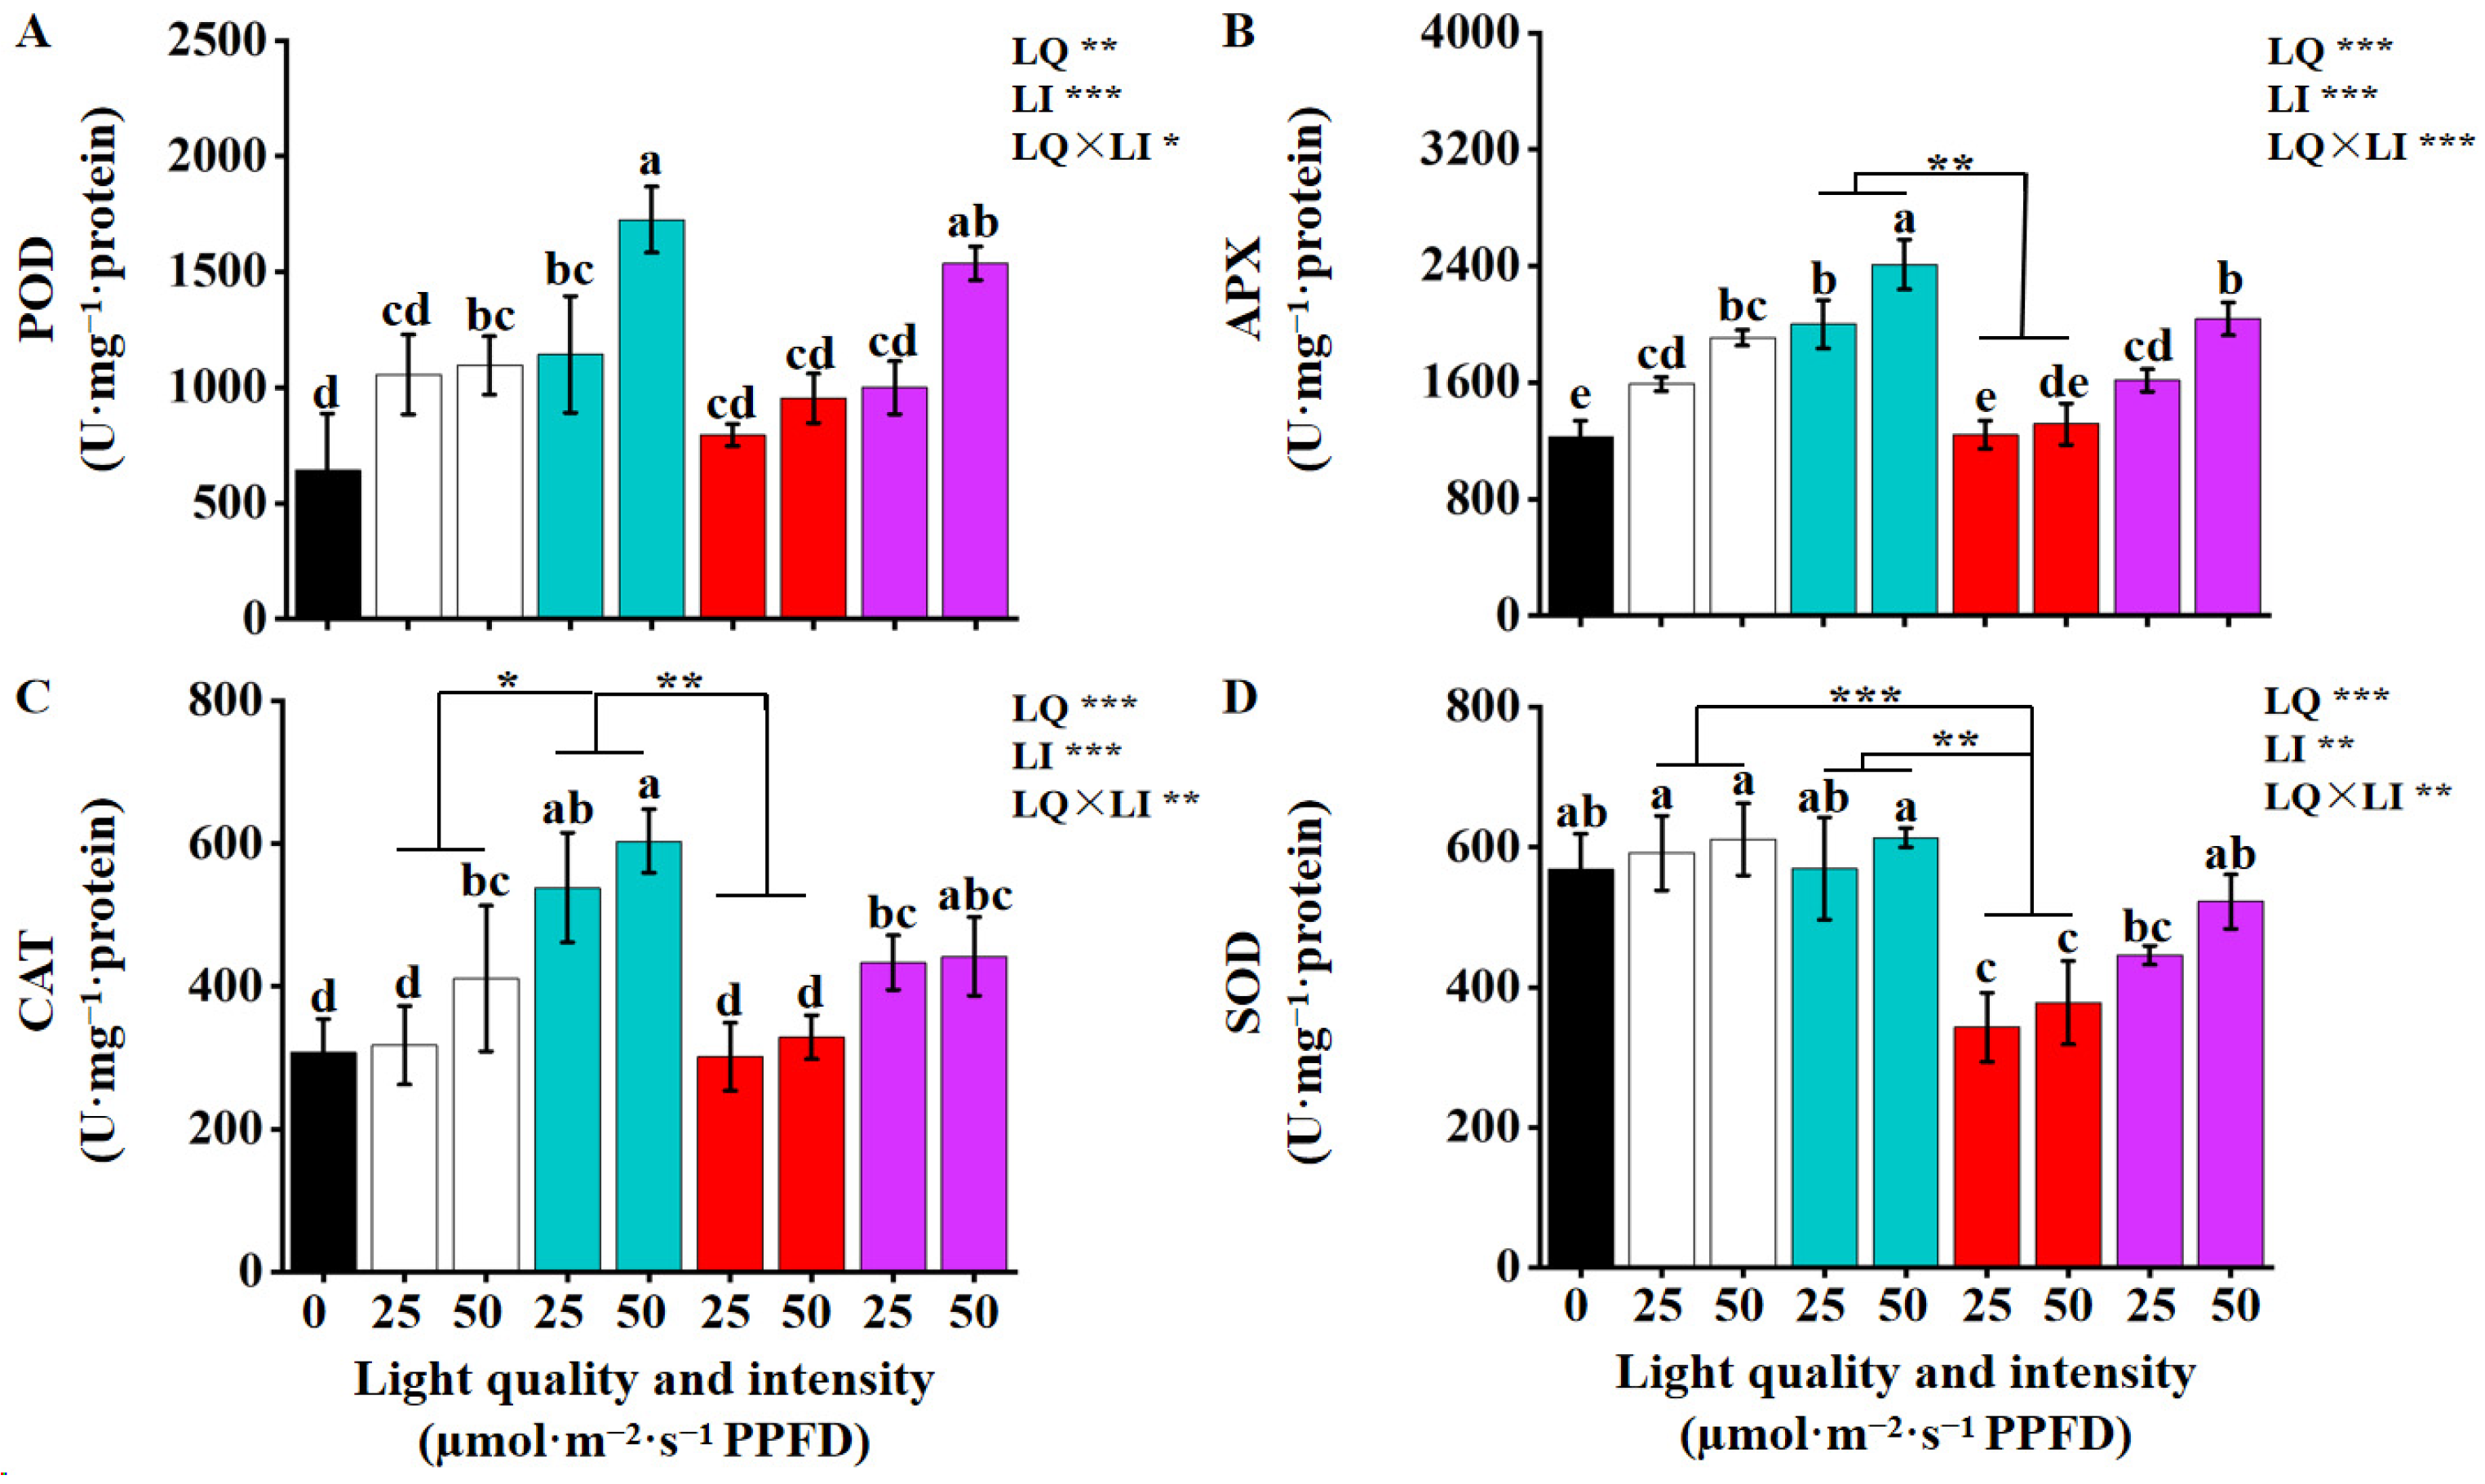
The POD activity was the lowest in callus grown under D treatment, and the highest values were observed in those grown under B and RB at 50 µmol·m−2·s−1 PPFD (Figure 8A). For the POD activity, the respective ratios of the highest to lowest were 2.69- and 2.40-fold. The B greatly increased the activities of APX as compared to the other light qualities under 50 µmol·m−2·s−1 PPFD, respectively, and the higher light intensity groups had better effects. Under a light intensity of 50 µmol·m−2·s−1 PPFD, the APX activity in callus was 1.83-fold higher under B treatment than under R treatment and 1.97-fold higher than those under dark treatment (Figure 8B). Under B treatment, particularly at 50 µmol·m−2·s−1 PPFD, the CAT enzyme activity in callus was significantly higher (Figure 8C). In addition, for SOD activity, the callus exhibited high enzyme activity under D, W, and B treatments, followed by RB treatment. The lowest SOD activity was observed under R treatment (Figure 8D).
Two-way ANOVA revealed that single factors (light quality or intensity) and two-way interactions all had significant effects on activities of POD, APX, CAT, and SOD in calli. Statistical analysis revealed no significant differences in POD activity among the different light quality treatment groups (Figure 8A). For APX activity in callus, a significant promotive effect of the blue treatment on shoot number per callus was observed compared to red light, irrespective of the light intensity (Figure 8B). Blue light treatment demonstrated a marked superiority over white or red light in CAT activity in callus, a statistically significant effect observed regardless of the applied light intensity (Figure 8C). Whereas for SOD activity in callus, significant effects were observed between white and red light, as well as between blue and red light, and these effects were independent of light intensity (Figure 8D).
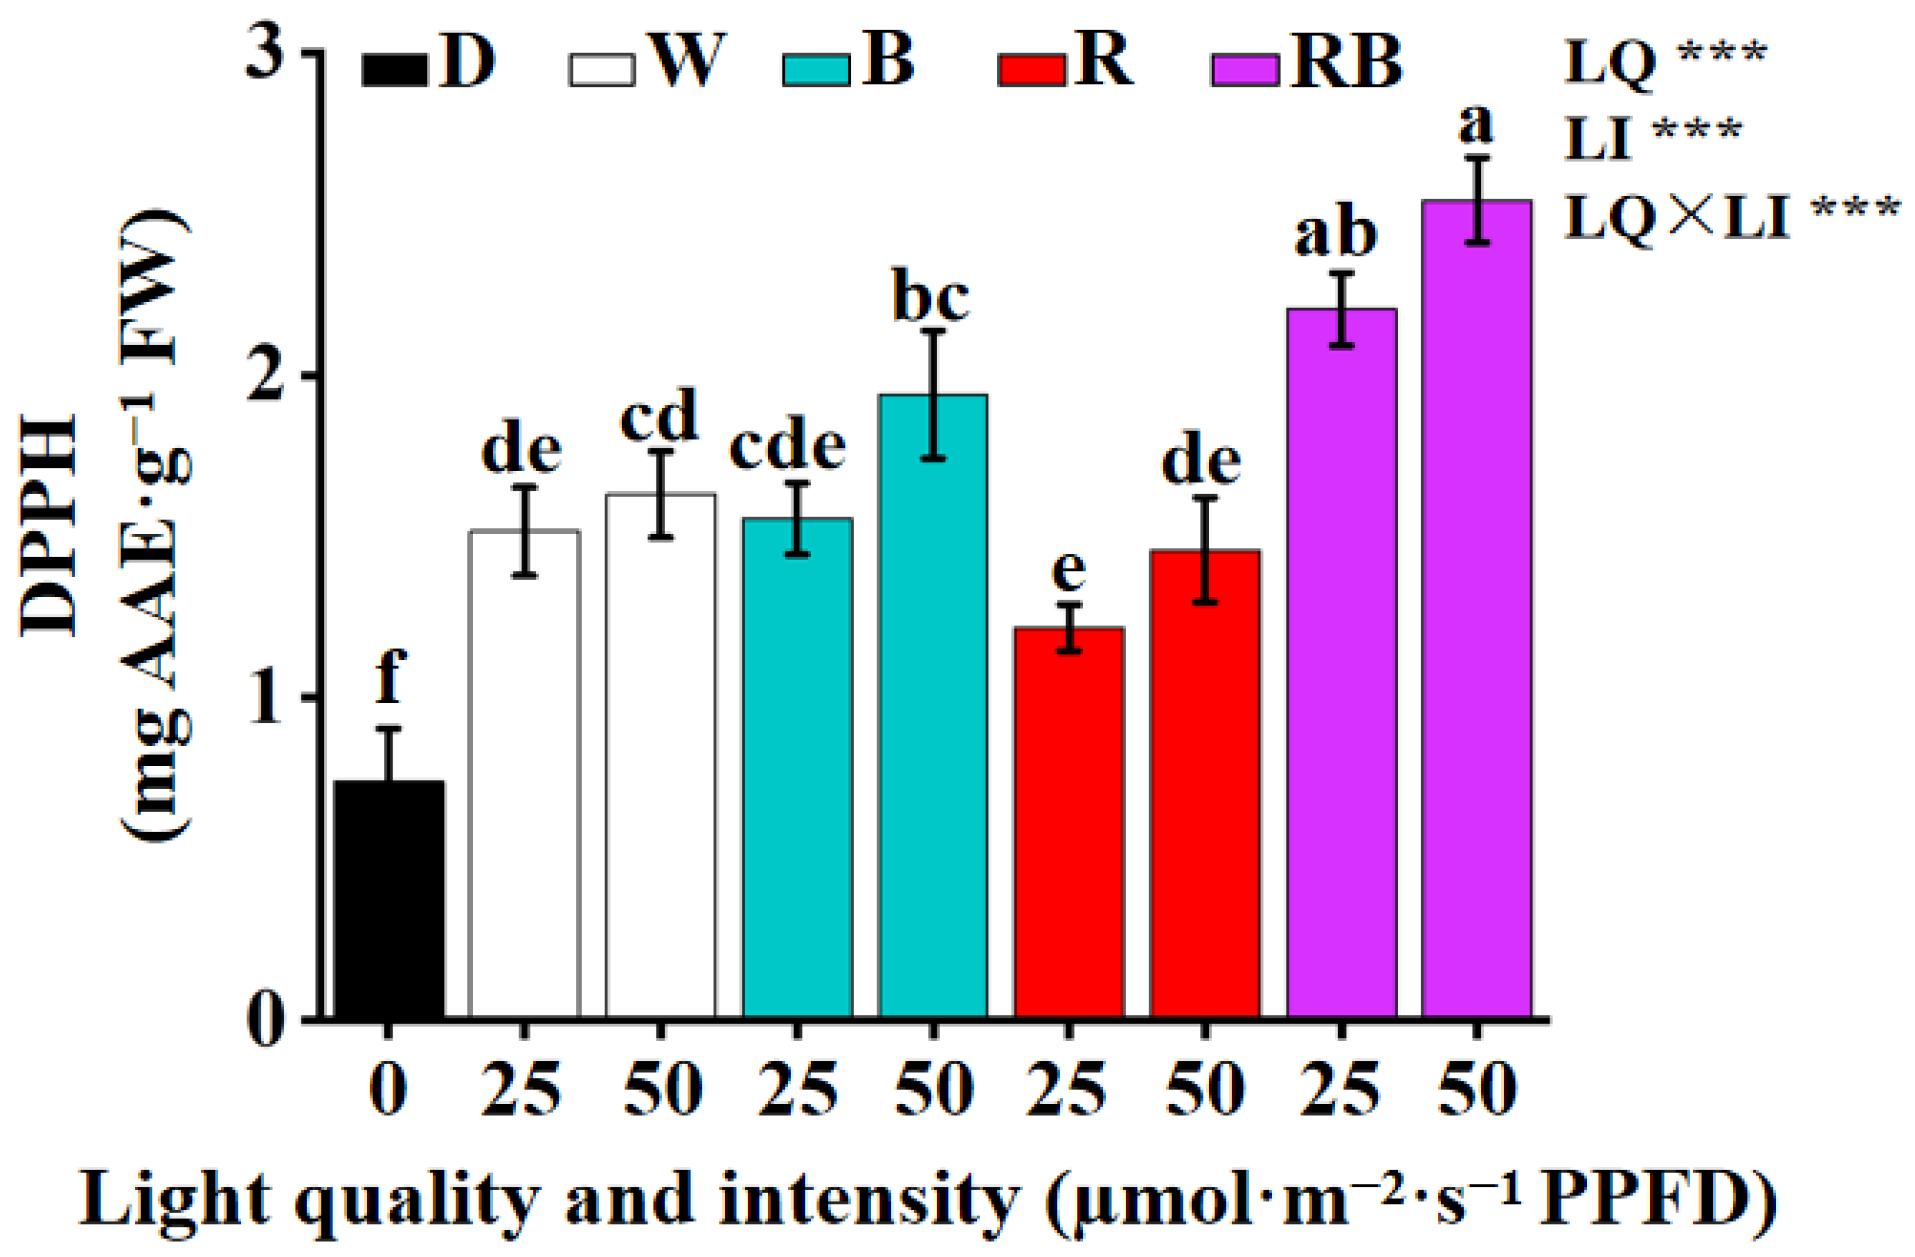
In this study, the antioxidant activity in callus grown under different light qualities and intensities was evaluated (Figure 9). The analysis was conducted using the DPPH radical scavenging method. The DPPH test estimated antioxidant activity by measuring the scavenging of DPPH free radicals. This scavenging action demonstrates the sample’s ability to inhibit lipid oxidation and reflects its overall free radical scavenging potential. The results indicated that callus tissues exposed to W, B, R, or RB light at the higher intensity of 50 µmol·m−2·s−1 exhibited stronger free radical scavenging potential compared to those treated at 25 µmol·m−2·s−1. Among these, the RB treatment led to the highest antioxidant index, which corresponded to the highest DPPH scavenging activity (2.54 mg AAE·g−1 FW). In contrast, callus tissues treated with D alone showed lower free radical scavenging capacity.

4. Discussion

4.1. Establish Technical System for Callus Induction

C. turtschaninovii, an important medicinal plant, faced a severe risk of extinction in its natural habitat due to over-harvesting [29]. This study aimed to establish callus cultures of this species to develop a sustainable biotechnological platform. These cultures represented a key source for the industrial production of valuable secondary metabolites, such as bioactive alkaloids, thereby reducing dependence on wild populations, offering a viable alternative to wild harvesting, and supporting species conservation. It had been suggested that BA and NAA have beneficial effects on the initiation and induction of callus. The MS medium containing the supplements of NAA and BA promoted the largest callus development [30]. The Kn is the first discovered cytokinin and has various functions in growth-promoting, antiaging, promotion of cell division and differentiation [31], as well as enhancing stress tolerance [32]. It had been reported that Kn could promote the growth of roots in maize [33]. Callus-forming ability of explants would be explained by differential reactivity to media components [34]. Rapid callus induction and its proliferation are vital to tissue culture. The varied responses of different explant types cultured with same PGR supplements may be due to the original endogenous distribution and uptake of hormones and physiological statuses [35,36]. Studies on callus induction in Telfairia occidentalis Hook F showed that the optimal hormone regimens for achieving the highest induction rates varied by explant: BA and NAA for stems, 2,4-D and Kn for nodal segments, and 2,4-D and kinetin for leaves [37]. Similarly, in a study on Cyamopsis tetragonoloba L., the most effective regimens for callus induction were 2,4-D and TDZ for stems and rootlets, and 2,4-D and BAP for leaves [38]. The above studies indicated that a suitable concentration of the growth-regulating substance is fruitful in tissue culture for further propagation. Plant regeneration was successfully achieved via shoot organogenesis from leaf and petiole explants of C. saxicola Bunting [13]. In this study, a comprehensive evaluation of callus induction frequency, fresh weight, and growth status revealed that tuber explant exhibited the most effective callus induction, significantly outperforming petiole and leaf explants (Table 1, Table 2 and Table 3 and Figure 3). This finding held considerable promise for application, as establishing efficient tuber-derived callus cultures presents a viable strategy for the industrial production of valuable secondary metabolites. This approach can significantly reduce reliance on wild-harvested plants, thereby contributing to species conservation. Furthermore, the optimized protocol using tuber explant provides a robust foundation for scaling up in vitro production systems.

4.2. Effects of Light Quality and Intensity on Growth and Organogenesis

Studies on tobacco callus treated with eight narrow-band fluorescent lamps (wavelength ranges: 371–750 nm) and four commercially available broad-band fluorescent light sources have long established that blue light stimulates growth and shoot production, though it requires higher intensity compared to near ultraviolet light. In contrast, red and far-red light (up to 1.7 mW cm−2) showed no significant effect on either callus growth or shoot initiation [39]. The physiological influence of differential light spectra on plants is governed by a triad of paramount importance: the spectral quality and intensity of the irradiation, the temporal period of exposure, and the particular plant species under investigation [40]. Martin–Urdiroz et al. [41] and Tubić et al. [42] found that although light was not strictly required to induce regeneration, the process occurred far more efficiently under light conditions than in darkness. Previous studies showed a close relationship between light intensity and callus biomass accumulation [43,44], indicating the need for optimal light intensity for optimum biomass accumulation. The findings of this study suggest that 50 µmol·m−2·s−1 PPFD caused slight boosts of fresh and dry weights of callus under different light qualities as compared to 25 µmol·m−2·s−1 PPFD and higher light intensity led to more adventitious shoots induced per callus as shown in Figure 4 and Figure 5. The enhanced efficacy of combined LED spectra, compared to monochromatic lighting, for stimulating plant growth and development had been demonstrated in multiple species, e.g., plum [45], populous [46], and eucalyptus [47]. A key finding of this work was the superior efficacy of a 1:1 red-to-blue light ratio in stimulating callus growth and shoot induction, surpassing the effects of monochromatic blue light. This optimized light regime provided a critical tool for manipulating in vitro development to achieve specific bioproduction goals. The consistency of this result across diverse species, such as Operculina turpethum [48] and Santalum album [49], underscored the robustness and potential broad applicability of red and blue LED combinations as a standard for enhancing productivity in the commercial micropropagation of high-value medicinal plants.

4.3. Light Regulation of Secondary Metabolite Biosynthesis

Light is a key factor affecting the biosynthesis of secondary metabolites [50,51]. The increased dl-THP accumulation under R treatment (Figure 7) was likely a result of the growth inhibition with a higher oxidative stress level [52]. High light intensity could enhance the accumulation and synthesis of secondary metabolites [53,54]. Previous studies have shown that excessive light or stress conditions, such as nutrient or water limitation, may stimulate the synthesis of secondary metabolites in many species [55]. Corydalis genus is renowned for its diverse array of benzylisoquinoline alkaloids (BIAs). Genomic analysis of C. sheareri had identified a total of 172 candidate genes implicated in the biosynthesis of these compounds [56]. The biosynthetic pathway of BIAs begins with L-tyrosine as the precursor, which is subsequently converted through a series of enzymatic reactions to produce various downstream compounds [57]. Then, (S)-reticuline which served as a pivotal intermediate was produced by catalytic action of norcoclaurine synthase (NCS), norcoclaurine 6-O-methyltransferase (6OMT), 4′-O-methyltransferase (4′OMT), coclaurine N-methyltransferase (CNMT), and Cytochrome P450 monooxygenases (CYPs) [58,59]. Compared to normal light conditions, the contents of bis-BIAs in lotus (Nelumbo spp.) plumule under dark treatment decreased by 18.4% at 18 DAP. This reduction was consistent with the downregulated expression of key genes in the BIA biosynthetic pathway, including gene-encoded norcoclaurine synthases (NCS), norcoclaurine 6-O-methyltransferase (6OMT), and (S)-N-methylcoclaurine-3′-hydroxylase (CYP80A) [60]. L-tyrosine and anthocyanin biosynthesis diverge from the shikimate pathway. It had been hypothesized that increasing tyrosine levels may divert metabolic flux away from phenylalanine-derived pathways, potentially compromising the production of other physiologically important compounds such as anthocyanins, flavonoids, and lignin [61]. Integrated transcriptomic and metabolomic analyses revealed that exposure to blue light significantly upregulated the expression of leucoanthocyanidin dioxygenase (LDOX), O-methyltransferase (OMT), and UDP-glucose flavonoid glucosyltransferase (UFGT). These enzymes were found to be critically involved in promoting the biosynthesis of pelargonidin (Pg) anthocyanidins, [62]. In summary, blue light promotes anthocyanin synthesis, thereby significantly increasing the consumption of the precursor phenylalanine. This may redirect carbon metabolic flux toward the phenylpropanoid pathway, competing for and reducing the metabolic resources available for L-tyrosine synthesis (shared precursors from the shikimate pathway). The decreased availability of L-tyrosine may consequently lead to a shortage of precursors required for the synthesis of its downstream product, dl-THP. The above theory can support the results of this study (Figure 7). This study systematically demonstrates, for the first time, the critical role of light quality and intensity in regulating dl-THP accumulation in C. turtschaninovii callus cultures. The results identified red light (R) combined with higher light intensity (50 µmol·m−2·s−1 PPFD) as the optimal condition for maximizing dl-THP production. Statistical analysis further confirmed that light quality, light intensity, and their interaction all exerted highly significant effects on dl-THP biosynthesis. This finding uniquely establishes the predominance of red light in C. turtschaninovii culture.

4.4. Antioxidant Defense System Under Different Light Treatments

This study demonstrated that blue light treatment at 50 µmol·m−2·s−1 PPFD was beneficial for enhancing POD, APX, and CAT activities in the callus (Figure 8). Regarding SOD activity, dark, white, and blue light treatments all significantly enhanced its activity (Figure 8D). LED treatments promoted plant growth and elevated phenolic and flavonoid levels, with blue light specifically enhancing enzymatic and non-enzymatic antioxidant activities of Rehmannia glutinosa [63]. Unlike white, red, or blue LED light treatments, a combined red and blue LED light (1:1 ratio) induced a significant increase in the activities of APX, SOD, and CAT in Dendrobium ‘Shuijing’ plantlets [64]. Based on the results of this study, the blue or red and blue mixed light treatment was effective in enhancing POD enzyme activity (Figure 8A). Additionally, in a study on Caralluma tuberculata, callus cultured under dark conditions exhibited significantly lower activities of SOD, POD, CAT, and APX enzymes, compared to those grown under natural or diffused light, following treatment with 0.5 mg·L−1 2,4-D and 3.0 mg·L−1 BA [65]. However, studies on the callus of Operculina turpethum have demonstrated that dark culture conditions enhance the activities of SOD [48], which was consistent with the findings of the present study. Different plant species have evolved distinct antioxidant defense mechanisms in response to environmental stressors. Darkness can be perceived as a stress factor [66] that disrupts the normal photosynthetic electron transport chain, potentially leading to the accumulation of specific reactive oxygen species (ROS), particularly in the mitochondria. The elevated SOD activity in C. turtschaninovii suggested a highly active first-line defense dedicated to the dismutation of superoxide radicals under these conditions. The incubation under red LED caused an increase in the activity of superoxide dismutase (SOD), catalase (CAT), and ascorbate peroxidase (APX) in calli derived from internodal segments in Caralluma tuberculata [67]. This result was inconsistent with the findings of the present study, in which red light treatment did not significantly enhance the antioxidant enzyme activities in the callus of C. turtschaninovii. The discrepancy may be attributed to species specificity. The significantly higher activities of POD, APX, and CAT under blue and red–blue mixed light, which coincided with the highest rates of shoot organogenesis (Figure 5) and robust callus growth (Figure 4), were interpreted as indicators of enhanced metabolic activity in rapidly developing tissues. In this scenario, the elevated antioxidant capacity likely served to mitigate the increased reactive oxygen species (ROS) generated as by-products of active metabolism and morphogenesis, thereby supporting the process rather than indicating severe stress. Assessment of DPPH radical scavenging activity indicated that calli under RB mixed light exhibited the highest activity, while the lowest levels were recorded under dark light conditions (Figure 9). These findings were consistent with research on the effects of light quality on the growth, secondary metabolite production, and antioxidant activity in Rhodiola imbricata Edgew callus [68] and Oplopanax elatus [69].

5. Conclusions

In conclusion, indirect shoot organogenesis from callus was achieved in C. turtschaninovii, which established a highly efficient, two-step protocol using optimized PGR combinations for callus initiation from tuber explant, and subsequently led to the employment of specific LED regimes to steer cultures toward either high biomass (RB light) or high alkaloid yield (R light). This offered a precise, controllable, and sustainable alternative to wild harvesting. This study provided the first comprehensive evidence that red light is the primary environmental cue for stimulating the biosynthesis of the valuable alkaloid dl-THP in C. turtschaninovii callus, a finding that refined the understanding of light-regulated secondary metabolism. From a practical perspective, these findings offer a viable, sustainable alternative to wild harvesting, directly contributing to the conservation of this endangered medicinal plant. The established protocols for plant regeneration and enhanced dl-THP production could be applicable for scaling in bioreactor systems. Future research will focus on elucidating the molecular mechanisms behind light regulation through transcriptomic analysis and exploring the integration of these optimized light regimes with elicitation strategies in large-scale cultures to further elevate the commercial viability of this biotechnological platform.

Author Contributions

Conceptualization, B.R.J.; methodology, B.R.J. and J.Z.; formal analysis, J.Z.; resources, B.R.J.; data curation, J.Z.; writing—original draft preparation, J.Z.; writing–review and editing, B.R.J.; project administration, B.R.J.; funding acquisition, B.R.J. and J.Z. All authors have read and agreed to the published version of the manuscript.

Funding

This work was supported by High-level Talent Research Start-up Funding Project of Shandong Agricultural and Engineering University (BSQJ202324), Jinan, China. Jin Zhao during the Ph.D. process was supported by the BK21 Plus Program, Ministry of Education, Republic of Korea.

Data Availability Statement

The original contributions presented in this study are included in the article. Further inquiries can be directed to the corresponding author.

Conflicts of Interest

The authors declare no conflicts of interest.

References

  1. Zhang, M.L.; Su, Z.Y.; Magnus, L. Corydalis. In Flora of China; Wu, Z.Y., Peter, H.R., Eds.; Science Press: Beijing, China; Missouri Botanical Garden Press: St. Louis, MO, USA, 2008; Volume 7, pp. 295–428. [Google Scholar]
  2. Ministry of Food and Drug Safety. The Korean Pharmacopoeia, 10th ed.; Ministry of Food and Drug Safety: Osong, Republic of Korea, 2012; p. 1284.
  3. Guo, Z.; Man, Y.; Wang, X.; Jin, H.; Sun, X.; Su, X.; Hao, J.; Mi, W. Levo-tetrahydropalmatine attenuates oxaliplatin-induced mechanical hyperalgesia in mice. Sci. Rep. 2014, 4, 3905. [Google Scholar] [CrossRef] [PubMed]
  4. Li, C.H.; Chen, C.; Zhang, Q.; Tan, C.N.; Hu, Y.J.; Li, P.; Wan, J.B.; Feng, G.; Xia, Z.N.; Yang, F.Q. Differential proteomic analysis of platelets suggested target-related proteins in rabbit platelets treated with Rhizoma Corydalis. Pharm. Biol. 2017, 55, 76–87. [Google Scholar] [CrossRef] [PubMed]
  5. Chupakhin, E.; Babich, O.; Prosekov, A.; Asyakina, L.; Gureev, M.; Krasavin, M. Plants of the Russian Federation pharmacopeia: An unexhausted natural products research opportunity? Nat. Prod. Res. 2021, 35, 3525–3527. [Google Scholar] [CrossRef] [PubMed]
  6. Pakseresht, G.; Kahrizi, D.; Mansouri, M.; Ghorbani, T.; Kazemi, N. Study of callus induction and cell culture to secondary metabolite production in Hyssopus officinalis L. JRPS 2016, 5, 104–111. [Google Scholar]
  7. Salma, U.; Rahman, M.; Islam, S.; Haque, N.; Jubair, T.; Haque, A.; Mukti, I. The influence of different hormone concentration and combination on callus induction and regeneration of Rauwolfia serpentina L. Benth. Pak. J. Biol. Sci. PJBS 2008, 11, 1638–1641. [Google Scholar] [CrossRef]
  8. Rad, S.Z.K.; Rameshrad, M.; Hosseinzadeh, H. Toxicology effects of Berberis vulgaris (barberry) and its active constituent, berberine: A review. Iran. J. Basic Med. Sci. 2017, 20, 516. [Google Scholar] [CrossRef]
  9. Maheshwari, P.; Songara, B.; Kumar, S.; Jain, P.; Srivastava, K.; Kumar, A. Alkaloid production in Vernonia cinerea: Callus, cell suspension and root cultures. Biotechnol. J. Healthcare Nutr. Technol. 2007, 2, 1026–1032. [Google Scholar] [CrossRef]
  10. Ikuta, A.; Syōno, K.; Furuya, T. Alkaloids of callus tissues and redifferentiated plantlets in the Papaveraceae. Phytochemistry 1974, 13, 2175–2179. [Google Scholar] [CrossRef]
  11. Sagare, A.; Lee, Y.; Lin, T.; Chen, C.; Tsay, H. Cytokinin-induced somatic embryogenesis and plant regeneration in Corydalis yanhusuo (Fumariaceae)—A medicinal plant. Plant Sci. 2000, 160, 139–147. [Google Scholar] [CrossRef]
  12. Chang, J.I.; Shin, S.W.; Chi, H.J. Production of Corydalis alkaloids by plant cell culture (I). Kor. J. Pharmacogn. 1995, 26, 419–425. [Google Scholar]
  13. Pang, J.; Xiong, Y.; Zeng, Y.; Chen, X.; Zhang, X.; Li, Y.; Wu, K.; Zeng, S.; Teixeira da Silva, J.A.; Ma, G. Shoot organogenesis and plant regeneration from leaf and petiole explants of Corydalis saxicola Bunting. Vitr. Cell Dev. Biol. Plant 2023, 59, 121–128. [Google Scholar] [CrossRef]
  14. Zhao, J.; Verpoorte, R. Manipulating indole alkaloid production by Catharanthus roseus cell cultures in bioreactors: From biochemical processing to metabolic engineering. Phytochem. Rev. 2007, 6, 435–457. [Google Scholar] [CrossRef]
  15. Hsu, B.; Kin, K. Pharmacological study of tetrahydropalmatine and its analogs. A new type of central depressants. Arch. Int. Pharmacodyn. Ther. 1962, 139, 318–327. [Google Scholar]
  16. Tian, B.; Tian, M.; Huang, S.M. Advances in phytochemical and modern pharmacological research of Rhizoma Corydalis. Pharm. Biol. 2020, 58, 265–275. [Google Scholar] [CrossRef] [PubMed]
  17. Chang, C.K.; Lin, M.T. DL-Tetrahydropalmatine may act through inhibition of amygdaloid release of dopamine to inhibit an epileptic attack in rats. Neurosci. Lett. 2001, 307, 163–166. [Google Scholar] [CrossRef]
  18. Lin, T.Y.; Chen, I.Y.; Lee, M.Y.; Lu, C.W.; Chiu, K.M.; Wang, S.J. Inhibition of glutamate release from rat cortical nerve terminals by dehydrocorydaline, an alkaloid from Corydalis yanhusuo. Molecules 2022, 27, 960. [Google Scholar] [CrossRef]
  19. Nalawade, S.M.; Sagare, A.; Kuo, C.; Lo, S.; Lee, C.; Lee, Y.; Tsay, H. Tissue culture of Corydalis yanhusuo (Fumariaceae) and its medicinal compound production from somatic embryo-derived plants. In Liquid Culture Systems for in Vitro Plant Propagation; Springer: Berlin/Heidelberg, Germany, 2005; pp. 557–565. [Google Scholar]
  20. Zhang, D.X.; Li, X.F.; Shao, S.L. Callus culture and conditions for dl-tetrahydropalmatine formationin Corydalis yanhuso from northeast of China. Zhiwu Yanjiu 2003, 23, 302–307. [Google Scholar]
  21. Baker, C.J.; Orlandi, E.W. Active oxygen in plant pathogenesis. Annu. Rev. Phytopathol. 1995, 33, 299–321. [Google Scholar] [CrossRef] [PubMed]
  22. Jeong, B.R.; Sivanesan, I. Direct adventitious shoot regeneration, in vitro flowering, fruiting, secondary metabolite content and antioxidant activity of Scrophularia takesimensis Nakai. Plant Cell Tissue Organ Cult. 2015, 123, 607–618. [Google Scholar] [CrossRef]
  23. Sivanesan, I.; Park, S.W. Optimizing factors affecting adventitious shoot regeneration, in vitro flowering and fruiting of Withania somnifera (L.) Dunal. Ind. Crops Prod. 2015, 76, 323–328. [Google Scholar] [CrossRef]
  24. Hung, C.D.; Hong, C.H.; Kim, S.K.; Lee, K.H.; Park, J.Y.; Nam, M.W.; Choi, D.H.; Lee, H.I. LED light for in vitro and ex vitro efficient growth of economically important highbush blueberry (Vaccinium corymbosum L.). Acta Physiol. Plant. 2016, 38, 152. [Google Scholar] [CrossRef]
  25. Li, H.; Tang, C.; Xu, Z. The effects of different light qualities on rapeseed (Brassica napus L.) plantlet growth and morphogenesis in vitro. Sci. Hortic. 2013, 150, 117–124. [Google Scholar] [CrossRef]
  26. Dutta Gupta, S.; Sahoo, T. Light emitting diode (LED)-induced alteration of oxidative events during in vitro shoot organogenesis of Curculigo orchioides Gaertn. Acta Physiol. Plant. 2015, 37, 233. [Google Scholar] [CrossRef]
  27. Zhao, J.; Thi, L.T.; Park, Y.G.; Jeong, B.R. Light quality affects growth and physiology of Carpesium triste Maxim. cultured in vitro. Agriculture 2020, 10, 258. [Google Scholar] [CrossRef]
  28. Gaafar, A.R.Z.; Qahtan, A.A.; Alatar, A.A. Unlocking the potential of green synthesis: Biogenic silver nanoparticles enhance biomass and bioactive chemicals in Ricinus communis Callus. Biotechnol. Biotechnol. Equip. 2024, 38, 2421996. [Google Scholar] [CrossRef]
  29. Kim, H.H.; Mizuno, K.; Lee, H.S.; Koo, J.G.; Kong, W.S. Distribution of indicator plant of climate change in major islands of the Korean peninsula. J. Environ. Sci. Int. 2021, 30, 29–43. [Google Scholar] [CrossRef]
  30. Sarker, R.; Mustafa, B.M. Regeneration and Agrobacterium-mediated genetic transformation of two indigenous potato varieties of Bangladesh. Plant Tissue Cult 2002, 12, 69–77. [Google Scholar]
  31. Wang, Q.; Zhang, F.; Smith, D.L. Application of GA3 and kinetin to improve corn and soybean seedling emergence at low temperature. Environ. Exp. Bot. 1996, 36, 377–383. [Google Scholar] [CrossRef]
  32. Krishna, P. Brassinosteroid-mediated stress responses. J. Plant Growth Regul. 2003, 22, 289–297. [Google Scholar] [CrossRef]
  33. Wang, H.; Dai, B.; Shu, X.; Wang, H.; Ning, P. Effect of kinetin on physiological and biochemical properties of maize seedlings under arsenic stress. Adv. Mater. Sci. Eng. 2015, 2015, 714646. [Google Scholar] [CrossRef]
  34. Ikram, U.H. Callus proliferation and somatic embroyogenesis in cotton (Gossypium hirsutum L.). Afr. J. Biotechnol. 2005, 4, 206–209. [Google Scholar]
  35. Okubo, H.; Wada, K.; Uemoto, S. In vitro morphogenetic response and distribution of endogenous plant hormones in hypocotyl segments of snapdragon (Antirrhinum majus L.). Plant Cell Rep. 1991, 10, 501–504. [Google Scholar] [CrossRef] [PubMed]
  36. Valdés, A.E.; Ordás, R.J.; Fernández, B.; Centeno, M.L. Relationships between hormonal contents and the organogenic response in Pinus pinea cotyledons. Plant Physiol. Biochem. 2001, 39, 377–384. [Google Scholar] [CrossRef]
  37. Sakpere, A.; Ajayi, S.; Adelusi, A. Effect of growth regulators and explant types on callus induction in Telfairia occidentalis Hook F. Afr. J. Biotechnol. 2014, 13, 2015–2021. [Google Scholar] [CrossRef]
  38. Ramazani, S.H.R.; Moshtaghi, R. Optimizing callus induction in Guar (Cyamopsis tetragonoloba L.): Impact of hormonal compositions and explant types. Agrotech. Ind. Crops 2025, 5, 104–110. [Google Scholar] [CrossRef]
  39. Seibert, M.; Wetherbee, P.J.; Job, D.D. The effects of light intensity and spectral quality on growth and shoot initiation in tobacco callus. Plant Physiol. 1975, 56, 130–139. [Google Scholar] [CrossRef]
  40. Dehestani-Ardakani, M.; Karimi Dorche, M.; Rahmati, M. Potential impact of different LED light spectra on callus induction, regeneration and plantlet growth of two cultivars of Caladium bicolor. J. Hortic. Postharvest Res. 2025, 8, 89–104. [Google Scholar] [CrossRef]
  41. Martin-Urdiroz, N.; Garrido-Gala, J.; Martin, J.; Barandiaran, X. Effect of light on the organogenic ability of garlic roots using a one-step in vitro system. Plant Cell Rep. 2004, 22, 721–724. [Google Scholar] [CrossRef]
  42. Tubić, L.; Anačkov, G.; Milojević, J.; Ghalawenji, N.; Mitić, N.; Igić, R.; Zdravković-Korać, S. High variability in the tissue culture response of root-tips of Allium ascalonicum individuals and optimization of the regeneration procedure. Plant Cell Tissue Organ Cult. 2014, 118, 101–110. [Google Scholar] [CrossRef]
  43. Ali, M.; Mujib, A.; Tonk, D.; Zafar, N. Plant regeneration through somatic embryogenesis and genome size analysis of Coriandrum sativum L. Protoplasma 2017, 254, 343–352. [Google Scholar] [CrossRef]
  44. Tariq, U.; Ali, M.; Abbasi, B.H. Morphogenic and biochemical variations under different spectral lights in callus cultures of Artemisia absinthium L. J. Photochem. Photobiol. B 2014, 130, 264–271. [Google Scholar] [CrossRef] [PubMed]
  45. Nacheva, L.; Dimitrova, N.; Koleva-Valkova, L.; Stefanova, M.; Ganeva, T.; Nesheva, M.; Tarakanov, I.; Vassilev, A. In vitro multiplication and rooting of plum rootstock ‘Saint Julien’ (Prunus domestica subsp. insititia) under fluorescent light and different LED spectra. Plants 2023, 12, 2125. [Google Scholar] [CrossRef] [PubMed]
  46. Mogilevskaya, I.; Zholobova, O.; Tereshchenko, T.; Fomenko, N.; Grichik, E. How Light Spectrum and Light Intensity Using Mixed LEDs Affect the Growth of Populus F1-3 g14 Hybrid and Callus Morphology in vitro. J. Plant Growth Regul. 2025, 44, 4820–4836. [Google Scholar] [CrossRef]
  47. Miranda, N.A.; Xavier, A.; Otoni, W.C.; Gallo, R.; Gatti, K.C.; de Moura, L.C.; Souza, D.M.; Maggioni, J.H.; Santos, S.S.d.O. Quality and intensity of light in the in vitro development of microstumps of Eucalyptus urophylla in a photoautotrophic system. For. Sci. 2020, 66, 754–760. [Google Scholar] [CrossRef]
  48. Biswal, B.; Jena, B.; Giri, A.K.; Acharya, L. Monochromatic light elicited biomass accumulation, antioxidant activity, and secondary metabolite production in callus culture of Operculina turpethum (L.). Plant Cell Tissue Organ Cult. 2022, 149, 123–134. [Google Scholar] [CrossRef]
  49. Mazhar, M.W.; Ishtiaq, M.; Maqbool, M.; Jafri, F.I.; Siddiqui, M.H.; Alamri, S.; Akhtar, M.S. Synergistic effects of selenium nanoparticles and LED light on enhancement of secondary metabolites in sandalwood (Santalum album) plants through in-vitro callus culturing technique. PeerJ 2024, 12, e18106. [Google Scholar] [CrossRef]
  50. Coelho, G.C.; Rachwal, M.F.; Dedecek, R.A.; Curcio, G.R.; Nietsche, K.; Schenkel, E.P. Effect of light intensity on methylxanthine contents of Ilex paraguariensis A. St. Hil. Biochem. Syst. Ecol. 2007, 35, 75–80. [Google Scholar] [CrossRef]
  51. Setiawati, T.; Ayalla, A.; Nurzaman, M.; Mutaqin, A. Influence of light intensity on leaf photosynthetic traits and alkaloid content of Kiasahan (Tetracera scandens L.). In Proceedings of the IOP Conference Series: Earth and Environmental Science, Bogor, Indonesia, 1–2 November 2017; p. 012025. [Google Scholar]
  52. Shohael, A.; Ali, M.; Yu, K.; Hahn, E.; Islam, R.; Paek, K. Effect of light on oxidative stress, secondary metabolites and induction of antioxidant enzymes in Eleutherococcus senticosus somatic embryos in bioreactor. Process Biochem. 2006, 41, 1179–1185. [Google Scholar] [CrossRef]
  53. Ghasemzadeh, A.; Jaafar, H.Z.; Rahmat, A.; Wahab, P.E.M.; Halim, M.R.A. Effect of different light intensities on total phenolics and flavonoids synthesis and anti-oxidant activities in young ginger varieties (Zingiber officinale Roscoe). Int. J. Mol. Sci. 2010, 11, 3885–3897. [Google Scholar] [CrossRef]
  54. Nezafatian, E.; Farhadian, O.; Daneshvar, E.; Bhatnagar, A. Investigating the effects of salinity and light stresses on primary and secondary metabolites of Tetraselmis tetrathele: Total phenolic compounds, fatty acid profile, and biodiesel properties. Biomass Bioenergy 2024, 181, 107050. [Google Scholar] [CrossRef]
  55. Walter, M.H.; Strack, D. Carotenoids and their cleavage products: Biosynthesis and functions. Nat. Prod. Rep. 2011, 28, 663–692. [Google Scholar] [CrossRef] [PubMed]
  56. Liu, Y.Y.; Yu, C.L.; Liu, Y.J.; Kan, S.L.; Chen, M.; Cao, Y.N.; Wang, H.W.; Li, J.M.; Peng, D. An autotetraploid genome of Corydalis sheareri provides insight into the evolution and benzylisoquinoline alkaloids diversity of Corydalis. Genom. Commun. 2025, 2, e002. [Google Scholar] [CrossRef]
  57. Wang, Y.; Subrizi, F.; Carter, E.M.; Sheppard, T.D.; Ward, J.M.; Hailes, H.C. Enzymatic synthesis of benzylisoquinoline alkaloids using a parallel cascade strategy and tyrosinase variants. Nat. Commun. 2022, 13, 5436. [Google Scholar] [CrossRef]
  58. Khodorova, N.V.; Shavarda, A.L.; Lequart-Pillon, M.; Laberche, J.-C.; Voitsekhovskaja, O.V.; Boitel-Conti, M. Biosynthesis of benzylisoquinoline alkaloids in Corydalis bracteata: Compartmentation and seasonal dynamics. Phytochemistry 2013, 92, 60–70. [Google Scholar] [CrossRef]
  59. Zhao, W.; Liu, J.; Chen, Y. Advances in the biosynthesis of naturally occurring benzylisoquinoline alkaloids. Front. Plant Sci. 2025, 16, 1548471. [Google Scholar] [CrossRef]
  60. Sun, H.; Song, H.; Deng, X.; Liu, J.; Yang, D.; Zhang, M.; Wang, Y.; Xin, J.; Chen, L.; Liu, Y. Transcriptome-wide characterization of alkaloids and chlorophyll biosynthesis in Lotus plumule. Front. Plant Sci. 2022, 13, 885503. [Google Scholar] [CrossRef]
  61. Timoneda, A.; Sheehan, H.; Feng, T.; Lopez-Nieves, S.; Maeda, H.A.; Brockington, S. Redirecting primary metabolism to boost production of tyrosine-derived specialised metabolites in planta. Sci. Rep. 2018, 8, 17256. [Google Scholar] [CrossRef]
  62. Zhang, J.; Li, S.; An, H.; Zhang, X.; Zhou, B. Integrated transcriptome and metabolome analysis reveals the anthocyanin biosynthesis mechanisms in blueberry (Vaccinium corymbosum L.) leaves under different light qualities. Front. Plant Sci. 2022, 13, 1073332. [Google Scholar] [CrossRef]
  63. Manivannan, A.; Soundararajan, P.; Halimah, N.; Ko, C.H.; Jeong, B.R. Blue LED light enhances growth, phytochemical contents, and antioxidant enzyme activities of Rehmannia glutinosa cultured in vitro. Hortic. Environ. Biotechnol. 2015, 56, 105–113. [Google Scholar] [CrossRef]
  64. Huo, J.; Lin, Q.; Mo, L.; Zheng, L.; Meng, X.; Song, X.; Liang, J.; Chen, T. The influence of varying wavelengths of led light on the development, physiology response, and metabolism activities of micropropagated Dendrobium hybrid ‘shuijing’ plantlets. Horticulturae 2024, 10, 774. [Google Scholar] [CrossRef]
  65. Ali, A.; Mashwani, Z.-u.-R.; Raja, N.I.; Mohammad, S.; Luna-Arias, J.P.; Ahmad, A.; Kaushik, P. Phytomediated selenium nanoparticles and light regimes elicited in vitro callus cultures for biomass accumulation and secondary metabolite production in Caralluma tuberculata. Front. Plant Sci. 2023, 14, 1253193. [Google Scholar] [CrossRef]
  66. Gad, A.G.; Habiba; Zheng, X.; Miao, Y. Low light/darkness as stressors of multifactor-induced senescence in rice plants. Int. J. Mol. Sci. 2021, 22, 3936. [Google Scholar] [CrossRef] [PubMed]
  67. Santos-Tierno, R.; Garcia, R.; Fonseca, E.; Faleiro, F.; Moreira, D.; Pacheco, G.; Mansur, E. Light quality and explant type modulate growth, antioxidant properties and bioactive compounds production of calluses of Passiflora setacea cv BRS Pérola do Cerrado. Plant Cell Tissue Organ Cult. 2021, 147, 635–646. [Google Scholar] [CrossRef]
  68. Kapoor, S.; Raghuvanshi, R.; Bhardwaj, P.; Sood, H.; Saxena, S.; Chaurasia, O.P. Influence of light quality on growth, secondary metabolites production and antioxidant activity in callus culture of Rhodiola imbricata Edgew. J. Photochem. Photobiol. B 2018, 183, 258–265. [Google Scholar] [CrossRef]
  69. Yu, C.Y.; Seong, E.S. Effect of light-emitting diode light sources on antioxidant activity and chemical composition variations of phenols, flavonoids, and terpenoids in Oplopanax elatus extracts. J. Appl. Biol. Chem. 2025, 68, 226–233. [Google Scholar] [CrossRef]
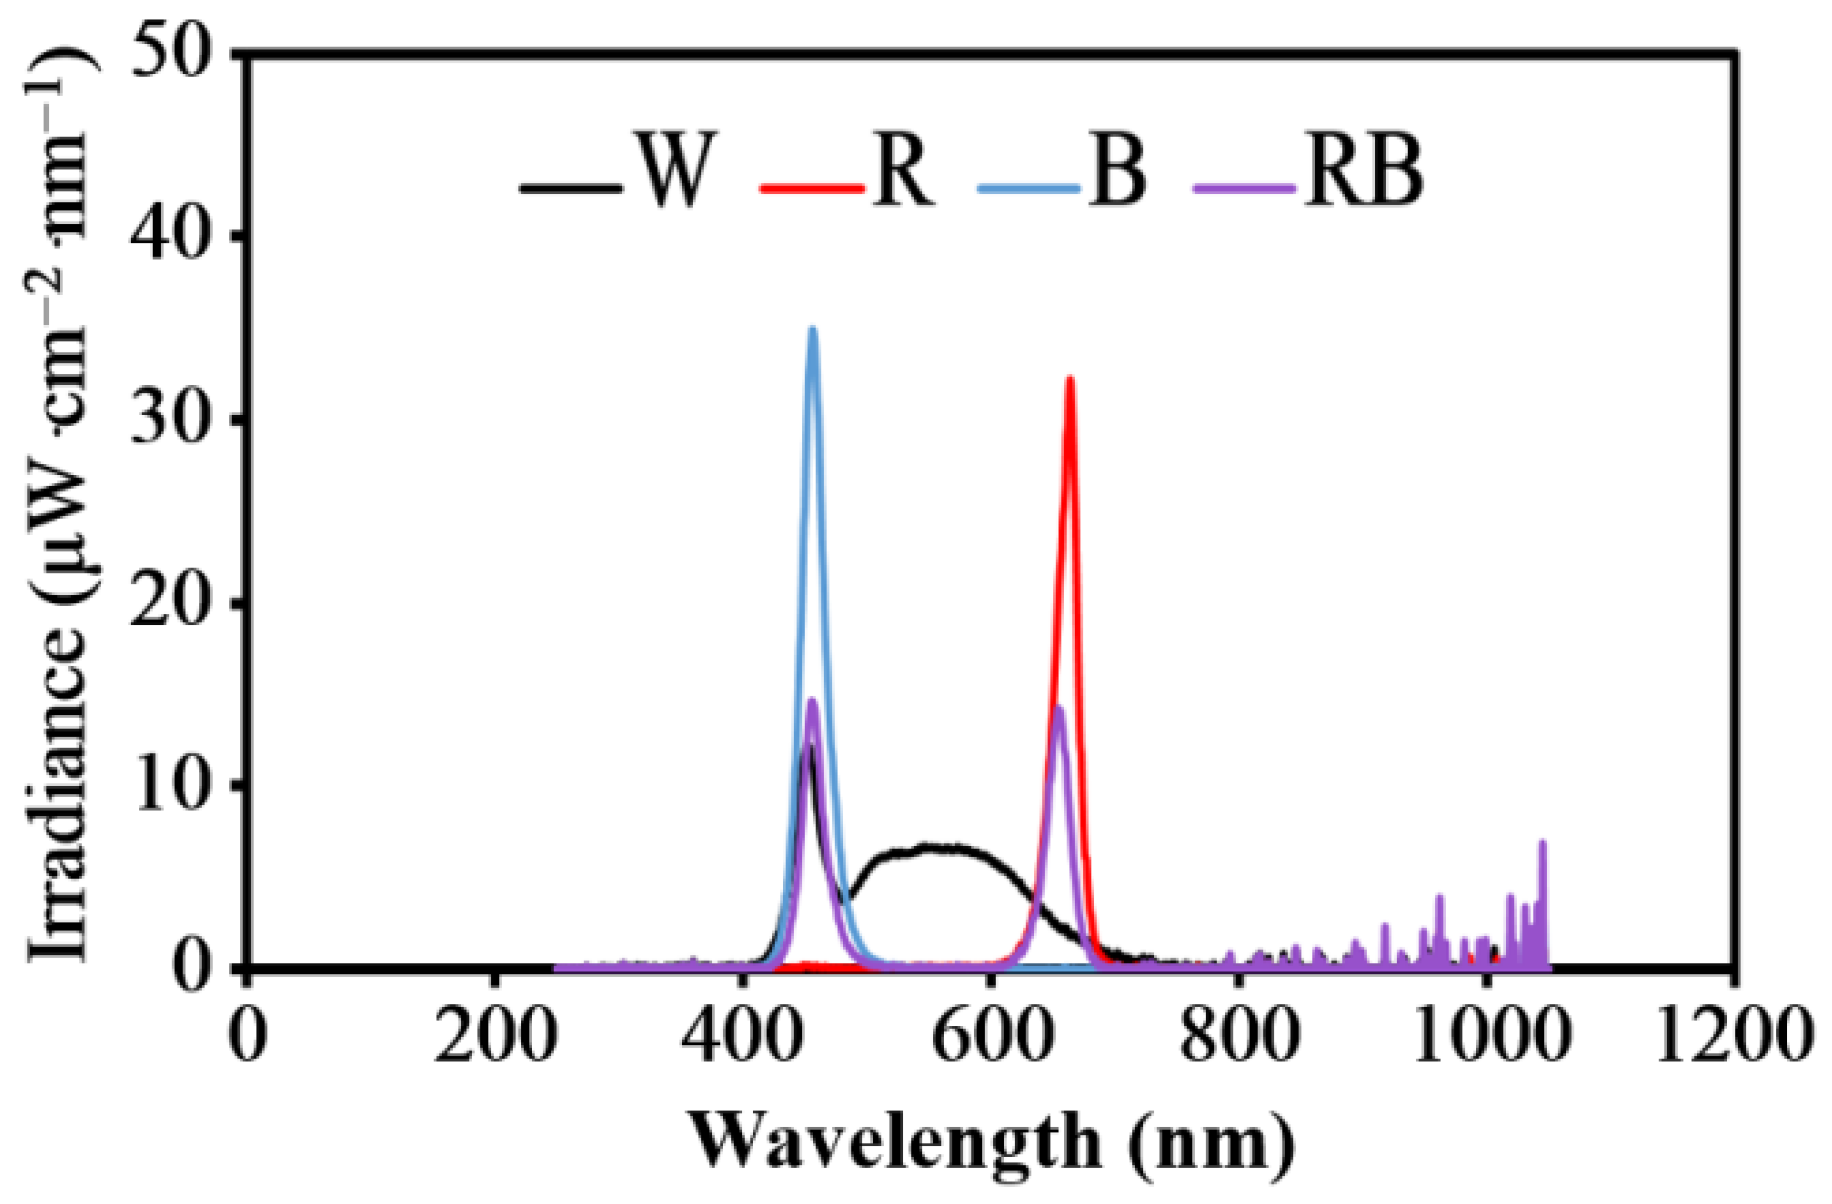
Figure 1. Irradiance of different lights (white, blue, red, and mix) in plant growth chamber used in the experiment at 50 µmol·m−2·s−1 PPFD. The W, R, B, and RB references to color in this figure legend referred to the white LED, red LED, blue LED, and combined red and blue LEDs in a 1:1 ratio, respectively.
Horticulturae 11 01420 g001
Figure 2. A typical HPLC chromatogram of reference standard dl-Tetrahydropalmatine (dl-THP, 0.1 mg·mL−1) at 280 nm and a calibration curve of dl-THP. The structure of the dl-THP is in the inset.
Horticulturae 11 01420 g002
Figure 3. Morphology of calli induced from the leaf, tuber, or petiole explants of C. turtschaninovii after six weeks of culture as affected by 6-benzyladenine (BA), kinetin (Kn), and α-naphthalene acetic acid (NAA) (A). The fragile phenotype of calli induced from tuber in the media supplemented with 3 mg·L−1 BA combined with 0.8 mg·L−1 NAA (B).
Horticulturae 11 01420 g003
Figure 4. Effect of light quality and intensity on fresh weight (A) and dry weight (B) of the calli of C. turtschaninovii. The calli were subjected to a combination of four light quality regimes: white (W), red (R), blue (B), and a 1:1 red/blue (RB) mixture provided by LEDs and three light intensity levels: 0 (dark, D), 25, and 50 μmol·m−2·s−1 PPFD. Significant differences (p ≤ 0.05), as determined by Tukey’s HSD test, were denoted by different letters. The two-way ANOVA test was used to evaluate the significance of light quality (LQ) and intensity (LI) on fresh weight and dry weights of calli. Statistical differences between the different light quality treatment groups were denoted by different numbers of stars (**, p ≤ 0.01; ***, p ≤ 0.001).
Horticulturae 11 01420 g004
Figure 5. Effects of light quality and intensity on the number of shoots induced per callus of C. turtschaninovii after six weeks of culture. The calli were subjected to a combination of four light quality regimes: white (W), red (R), blue (B), and a 1:1 red/blue (RB) mixture provided by LEDs and three light intensity levels: 0 (dark, D), 25, and 50 μmol·m−2·s−1 PPFD. Significant differences (p ≤ 0.05), as determined by Tukey’s HSD test, were denoted by different letters. The two-way ANOVA test was used to evaluate the significance of light quality (LQ) and intensity (LI) on the number of shoots induced per callus. Statistical differences between the different light quality treatment groups were denoted by different numbers of stars (**, p ≤ 0.01; ***, p ≤ 0.001).
Horticulturae 11 01420 g005
Figure 6. Morphology of callus with induced adventitious shoots of C. turtschaninovii after two or six weeks of culture as affected by light quality and intensity. The calli were exposed to four light quality regimes: white (W), red (R), blue (B), or a 1:1 red/blue (RB) combination using LEDs (A). Close-up view of the callus with induced adventitious shoot growth phenotype under B light (B) and RB light (C) treatments after six weeks of culture.
Horticulturae 11 01420 g006
Figure 7. Effect of light quality and intensity on dl-THP accumulation in callus of C. turtschaninovii after six weeks of exposure. The calli were subjected to a combination of four light quality regimes: white (W), red (R), blue (B), and a 1:1 red/blue (RB) mixture provided by LEDs and three light intensity levels: 0 (dark, D), 25, and 50 μmol·m−2·s−1 PPFD. Significant differences (p ≤ 0.05), as determined by Tukey’s HSD test, were denoted by different letters. The two-way ANOVA test was used to evaluate the significance of light quality (LQ) and intensity (LI) on dl-THP accumulation in calli (***, p ≤ 0.001).
Horticulturae 11 01420 g007
Figure 8. Effect of light quality and intensity on the activities of enzyme POD (A), APX (B), CAT (C), and SOD (D) in callus of C. turtschaninovii after six weeks of exposure. The calli were subjected to a combination of four light quality regimes: white (W), red (R), blue (B), and a 1:1 red/blue (RB) mixture provided by LEDs and three light intensity levels: 0 (dark, D), 25, and 50 μmol·m−2·s−1 PPFD. Significant differences (p ≤ 0.05), as determined by Tukey’s HSD test, were denoted by different letters. The two-way ANOVA test was used to evaluate the significance of light quality (LQ) and intensity (LI) on the activities of enzymes in calli. Statistical differences between the different light quality treatment groups were denoted by different numbers of stars (*, p ≤ 0.05; **, p ≤ 0.01; ***, p ≤ 0.001).
Horticulturae 11 01420 g008
Figure 9. Effect of light quality and intensity on DPPH radical scavenging in callus of C. turtschaninovii after six weeks of exposure. The calli were subjected to a combination of four light quality regimes: white (W), red (R), blue (B), and a 1:1 red/blue (RB) mixture provided by LEDs and three light intensity levels: 0 (dark, D), 25, and 50 μmol·m−2·s−1 PPFD. Significant differences (p ≤ 0.05), as determined by Tukey’s HSD test, were denoted by different letters. The two-way ANOVA test was used to evaluate the significance of light quality (LQ) and intensity (LI) on the activities of enzymes in calli (***, p ≤ 0.001).
Horticulturae 11 01420 g009
Table 1. Effect of cytokinin and NAA on induction frequency and fresh weight of calli induced from the leaf explant of C. turtschaninovii.
Cytokinin (A)Conc. (mg∙L−1)
(B)
NAA Conc. (mg∙L−1) (C)Callus Induction Frequency (%)Fresh Wt. (g)Phenotypic Description
BA z10.255.6 ± 5.6 bcd y0.11 ± 0.01 gCompact, dark yellow
0.588.9 ± 11.1 abc0.26 ± 0.02 cdeCompact, dark yellow
0.872.2 ± 11.1 abcd0.22 ± 0.01 defCompact, dark yellow, slight browning
20.250.0 ± 9.6 cd0.15 ± 0.01 fgFriable, light yellow
0.572.2 ± 11.1 abcd0.21 ± 0.01 defFriable, light yellow
0.894.4 ± 5.6 ab0.23 ± 0.02 defSlight compact, yellow
30.238.9 ± 5.6 d0.18 ± 0.01 efgFriable, yellow
0.572.2 ± 5.6 abcd0.26 ± 0.01 cdeFriable, yellow, slight browning
0.8100.0 ± 0.0 a0.34 ± 0.02 bcFriable, yellow
Kn10.261.1 ± 11.1 abcd0.08 ± 0.01 gCompact with adventitious roots
0.594.4 ± 5.6 ab0.21 ± 0.01 defCompact with adventitious roots
0.866.7 ± 9.6 abcd0.14 ± 0.01 fgCompact with adventitious roots
20.261.1 ± 5.6 abcd0.26 ± 0.02 cdeCompact, yellow
0.566.7 ± 9.6 abcd0.25 ± 0.03 cdeCompact, yellow
0.877.8 ± 5.6 abcd0.28 ± 0.02 bcdCompact, slight browning
30.238.9 ± 5.6 d0.14 ± 0.01 fgCompact, yellow
0.566.7 ± 0.0 abcd0.36 ± 0.02 bCompact, yellow
0.888.9 ± 5.6 abc0.60 ± 0.05 aFriable, light yellow
z BA, 6-benzyladenine; Kn, kinetin; NAA, α-naphthalene acetic acid. y Values represent the mean of three replications ± standard error. Different letters indicate significant differences by the Tukey HSD test (p ≤ 0.05).
Table 2. Effect of cytokinin and NAA on induction frequency and fresh weight of calli induced from the tuber explant of C. turtschaninovii.
Cytokinin (A)Conc. (mg∙L−1)
(B)
NAA Conc. (mg∙L−1) (C)Callus Induction Frequency (%)Fresh Wt. (g)Phenotypic Description
BA z10.272.2 ± 5.6 b y0.36 ± 0.02 efgCompact, dark yellow
0.594.4 ± 5.6 ab0.70 ± 0.01 cSlightly friable, yellow
0.883.3 ± 0.0 ab0.46 ± 0.00 defCompact, slight browning
20.272.2 ± 5.6 b0.30 ± 0.02 gCompact, dark yellow
0.588.9 ± 5.6 ab0.54 ± 0.03 dCompact, dark yellow
0.894.4 ± 5.6 ab1.06 ± 0.05 bFriable, yellow
30.283.3 ± 0.0 ab0.55 ± 0.01 cdCompact, dark yellow
0.5100.0 ± 0.0 a0.59 ± 0.02 cdSlightly friable, yellow
0.8100.0 ± 0.0 a1.58 ± 0.06 aFriable, light yellow
Kn10.272.2 ± 5.6 b0.25 ± 0.01 gCompact, dark yellow
0.594.4 ± 5.6 ab0.33 ± 0.02 efgCompact with adventitious roots
0.894.4 ± 5.6 ab0.26 ± 0.02 gCompact with adventitious roots
20.283.3 ± 9.6 ab0.29 ± 0.02 gSlightly friable, yellow
0.594.4 ± 5.6 ab0.31 ± 0.02 fgSlightly friable, yellow
0.8100 ± 0.0 a0.36 ± 0.01 efgCompact, slight browning
30.283.3 ± 0.0 ab0.49 ± 0.04 deCompact, slight browning
0.594.4 ± 5.6 ab0.49 ± 0.04 deCompact, slight browning
0.8100.0 ± 0.0 a0.57 ± 0.03 cdCompact, yellow
z BA, 6-benzyladenine; Kn, kinetin; NAA, α-naphthalene acetic acid. y Values represent the mean of three replications ± standard error. Different letters indicate significant differences by the Tukey HSD test (p ≤ 0.05).
Table 3. Effect of cytokinin and NAA on induction frequency and fresh weight of calli induced from the petiole explant of C. turtschaninovii.
Cytokinin (A)Conc. (mg∙L−1)
(B)
NAA Conc. (mg∙L−1) (C)Callus Induction Frequency (%)Fresh Wt. (g)Phenotypic Description
BA z10.277.8 ± 5.6 abc y0.06 ± 0.01 fCompact, dark yellow
0.588.9 ± 5.6 abc0.26 ± 0.02 bcFriable, light yellow
0.883.3 ± 0.0 abc0.06 ± 0.01 fFriable, light yellow
20.261.1 ± 5.6 c0.13 ± 0.01 efSlight compact, yellow
0.5100.0 ± 0.0 a0.34 ± 0.01 abFriable, light yellow
0.894.4 ± 5.6 ab0.33 ± 0.01 abSlight compact, yellow
30.266.7 ± 9.6 bc0.22 ± 0.01 cdeFriable, yellow
0.588.9 ± 5.6 abc0.29 ± 0.02 bcFew induced callus tissue was observed
0.894.4 ± 5.6 ab0.33 ± 0.01 abFew induced callus tissue was observed
Kn10.261.1 ± 9.6 c0.25 ± 0.03 bcdFew induced callus tissue was observed
0.594.4 ± 9.6 ab0.33 ± 0.03 abCompact with adventitious roots
0.872.2 ± 9.6 abc0.27 ± 0.02 bcFew and compact
20.266.7 ± 9.6 bc0.14 ± 0.01 efFew induced callus tissue was observed
0.588.9 ± 5.6 abc0.39 ± 0.03 aSlight compact, yellow
0.877.8 ± 5.6 abc0.20 ± 0.02 cdeFew induced callus tissue was observed
30.277.8 ± 5.6 abc0.05 ± 0.01 fFew and compact
0.588.9 ± 5.6 abc0.16 ± 0.01 deSlight compact, yellow
0.894.4 ± 5.6 ab0.21 ± 0.01 cdeFriable, light yellow
z BA, 6-benzyladenine; Kn, kinetin; NAA, α-naphthalene acetic acid. y Values represent the mean of three replications ± standard error. Different letters indicate significant differences by the Tukey HSD test (p ≤ 0.05).
Table 4. Three-way ANOVA test to evaluate the significance of cytokinin type, cytokinin concentration, NAA concentration on the callus induction frequency, and the fresh weight of calli induced from the leaf explant of C. turtschaninovii.
Tested ParametersVariation SourceSum of SquaresF Valuep Value
Callus induction frequency (%)Cytokinin type (A)82.2880.4710.497 ns
Cytokinin conc. (mg∙L−1) (B)277.7780.7940.460 ns
NAA conc.
(mg∙L−1) (C)
10,586.24730.2660.000 ***
A × B133.7000.3820.685 ns
A × C627.5761.7940.181 ns
B × C4969.427.1040.000 ***
A × B × C174.9180.2500.908 ns
Fresh wt. (g)Cytokinin type (A)0.020020.4170.000 ***
Cytokinin conc. (mg∙L−1) (B)0.18391.3350.000 ***
NAA conc.
(mg∙L−1) (C)
0.215107.6960.000 ***
A × B0.06130.6060.000 ***
A × C0.015.0890.011 *
B × C0.14435.9910.000 ***
A × B × C0.06516.2940.000 ***
* Significant at p ≤ 0.05; *** significant at p ≤ 0.001; ns: not significant.
Table 5. Three-way ANOVA test to evaluate the significance of cytokinin type, cytokinin concentration, NAA concentration on the callus induction frequency, and the fresh weight of calli induced from the tuber explant of C. turtschaninovii.
Tested ParametersVariation SourceSum of SquaresF Valuep Value
Callus induction frequency (%)Cytokinin type (A)128.6211.9230.174 ns
Cytokinin conc. (mg∙L−1) (B)627.4844.6920.015 *
NAA conc.
(mg∙L−1) (C)
3528.61926.3840.000 ***
A × B195.5081.4620.245 ns
A × C72.0390.5390.588 ns
B × C236.6150.8850.483 ns
A × B × C113.1830.4230.791 ns
Fresh wt. (g)Cytokinin type (A)1.3508.1360.000 ***
Cytokinin conc. (mg∙L−1) (B)0.975190.4220.000 ***
NAA conc.
(mg∙L−1) (C)
1.095213.9960.000 ***
A × B0.05811.4150.000 ***
A × C0.789154.2340.000 ***
B × C0.80678.7120.000 ***
A × B × C0.49548.3290.000 ***
* Significant at p ≤ 0.05; *** significant at p ≤ 0.001; ns: not significant.
Table 6. Three-way ANOVA test to evaluate the significance of cytokinin type, cytokinin concentration, NAA concentration on the callus induction frequency and the fresh weight of calli induced from the petiole explant C. turtschaninovii.
Tested ParametersVariation SourceSum of SquaresF Valuep Value
Callus induction frequency (%)Cytokinin type (A)82.290.470.497 ns
Cytokinin conc. (mg∙L−1) (B)277.780.790.460 ns
NAA conc.
(mg∙L−1) (C)
10,586.2530.260.000 ***
A × B133.700.380.685 ns
A × C627.581.790.181 ns
B × C4969.427.100.000 ***
A × B × C174.920.250.908 ns
Fresh wt. (g)Cytokinin type (A)0.0220.420.000 ***
Cytokinin conc. (mg∙L−1) (B)0.1891.340.000 ***
NAA conc.
(mg∙L−1) (C)
0.22107.700.000 ***
A × B0.0630.610.000 ***
A × C0.015.090.011 *
B × C0.1435.990.000 ***
A × B × C0.0716.290.000 ***
* Significant at p ≤ 0.05; *** significant at p ≤ 0.001; ns: not significant.
Table 7. Phenotypic description of callus with induced adventitious shoots of C. turtschaninovii after two or six weeks of culture as affected by light quality and intensity.
TreatmentPhenotypic Description
Light qualityLight intensity
(µmol·m−2·s−1 PPFD)
2 weeks of culture6 weeks of culture
Dark (D)
0
Friable, browning, without adventitious shoot emergenceBrowning with withered shoots
White (W)25Slight compact, yellow, without adventitious shootCompact with adventitious shoot emergence, slight browning
50Compact, yellow, with adventitious shoot emergenceCompact, adventitious shoot emergence in clusters, slight browning, some shoots withered
Blue (B)25Compact, yellow, with adventitious shoot emergenceCompact with adventitious shoot emergence and friable green callus
50Compact, light yellow, with adventitious shoot emergenceCompact with adventitious shoot emergence and green nodular callus
Red (R)25Compact, dark yellowCompact, dark yellow, severe browning
50Compact, dark yellowCompact, dark yellow, severe browning with few adventitious shoots
1:1 red/blue (RB) combination25Compact, dark yellow, with adventitious shoot emergenceCompact with adventitious shoot emergence and green nodular callus
50Compact, dark yellow, with adventitious shoot emergenceCompact with adventitious shoot and somatic embryo emergence, as well as green nodular callus
Disclaimer/Publisher’s Note: The statements, opinions and data contained in all publications are solely those of the individual author(s) and contributor(s) and not of MDPI and/or the editor(s). MDPI and/or the editor(s) disclaim responsibility for any injury to people or property resulting from any ideas, methods, instructions or products referred to in the content.