Article

Comparative Evaluation of Quality Traits and Bioactive Compounds in Acca sellowiana (Berg) Peel and Pulp: Effects of Genotype, Harvest Time and Tissue Type

1
Department of Agricultural Sciences, University of Naples Federico II, Via Università 100, 80055 Portici, Italy
2
Department of Agricultural, Food and Environmental Sciences (DSA3), University of Perugia, Via Borgo XX Giugno 74, 06121 Perugia, Italy
3
Department of Pharmacy, University of Naples Federico II, Via Domenico Montesano 49, 80131 Napoli, Italy
4
Department of Molecular Medicine and Medical Biotechnology, University of Naples Federico II, Via Sergio Pansini 5, 80131 Naples, Italy
*
Authors to whom correspondence should be addressed.
Horticulturae 2025, 11(11), 1305; https://doi.org/10.3390/horticulturae11111305 (registering DOI)
Submission received: 24 September 2025 / Revised: 23 October 2025 / Accepted: 29 October 2025 / Published: 31 October 2025
(This article belongs to the Section Fruit Production Systems)

Abstract

Feijoa (Acca sellowiana Berg) is an emerging Mediterranean crop valued for its nutraceutical potential but still underexplored with respect to cultivar and harvest stage. This study investigated two cultivars, ‘Mammoth’ and ‘Apollo’, harvested one week apart (4 and 11 November), to assess morphological traits, phenolic composition, antioxidant activity, vitamin C, and iodine. Fruit morphology, firmness, and basic quality indices (TSS, TA, pH, TSS/TA) were determined, while phenolic compounds were profiled by UHPLC–Q-Orbitrap HRMS. Antioxidant activity was measured by ABTS, DPPH, and FRAP assays; vitamin C by DCPIP titration; and iodine by iodometric analysis. ‘Apollo’ produced larger and firmer fruits, especially at the first harvest (105.6 g), while ‘Mammoth’ showed smaller and softer fruits. TSS remained stable (11 °Brix), whereas TA decreased and pH increased over time, raising the TSS/TA ratio and suggesting improved flavor balance at later harvests. Peel consistently contained higher bioactive levels than pulp, with catechin as the dominant phenolic compounds (up to 345 µg g−1 dw in ‘Apollo’ peel). Antioxidant activity was markedly higher in peel, with ‘Mammoth’ showing stronger early FRAP values and ‘Apollo’ increasing at the later harvest. Vitamin C and iodine were about threefold higher in peel than pulp and increased over time, reaching maxima in late-harvest peel samples. Overall, cultivar and harvest stage significantly influenced fruit quality and nutraceutical value. Peel, particularly that of late-harvested ‘Apollo’, represents a promising resource for functional foods and the valorization of processing by-products.

Graphical Abstract

1. Introduction

Acca sellowiana (O. Berg) Burret, commonly known as feijoa or pineapple guava, is an evergreen shrub or small tree in the Myrtaceae family. Native to the temperate highlands of southern Brazil, eastern Paraguay, Uruguay, and northern Argentina, the species has successfully adapted to a variety of climates and is now cultivated in several regions worldwide, including New Zealand, Australia, California (USA), and parts of southern Europe, such as Italy [1]. In Italy, the cultivation of feijoa is gradually expanding, particularly in Mediterranean regions like Calabria, Sicily, and the coastal zones of Tuscany and Liguria, where the climatic conditions are well-suited to its growth [2]. The plant’s adaptability and low agronomic input requirements make it attractive for niche production and diversification in small-scale fruit systems [3]. Feijoa fruits typically ripen in autumn and develop into oval berries ranging from 4 to 8 cm in length and weighing between 20 and 30 g. Cultivars such as ‘Apollo’, ‘Coolidge’, ‘Gemini’, ‘Mammoth’, and ‘Moore Triumph’ differ in terms of their ripening time, fruit size, and quality characteristics. The fruits are rich in numerous bioactive compounds, including terpenes, tannins, steroidal saponins, pectins, and various phenolic compounds [4,5,6]. Flavones and flavanones have also been identified in multiple plant tissues [7]. Moreover, the fruit’s unique aroma is attributed primarily to a complex profile of volatile compounds: methyl- and ethyl-benzoate represent approximately 90% of its total volatile content [8,9]. Nutritionally, feijoa is a valuable source of vitamin C and essential minerals, and has been reported to contain high levels of iodine [2]. Given its compositional profile, feijoa is increasingly recognized as a functional food with potential uses in health-focused products and dietary supplements. Although still regarded as a minor crop worldwide, it is gaining increasing commercial relevance, particularly in countries such as New Zealand, where cultivars like ‘Apollo,’ ‘Unique,’ ‘Triumph,’ ‘Mammoth’, and ‘Gemini’ are produced on a commercial scale [7]. The fruit is consumed fresh or processed into a wide variety of products, including jams, chutneys, juices, fermented beverages, and yogurt-based preparations. In Italy, the growing interest from both producers and researchers has led to the evaluation of several cultivars in terms of agronomic performance, resistance to environmental stresses [10], and nutraceutical potential under Mediterranean conditions.
The aim of this study was to compare two cultivars of Acca sellowiana (O. Berg), ‘Mammoth’ and ‘Apollo’, with a focus on morphological traits, antioxidant activity, phenolic compounds content, and iodine concentration. These parameters are particularly relevant in the context of functional food development and human health. The fruits were harvested at two distinct stages, one week apart, to evaluate the influence of ripening stage on both morphological and nutraceutical characteristics.
This approach was adopted due to the complexity of determining the optimal harvest time for feijoa and since the evolution of maturation is very rapid. The fruit remains green throughout development and often detaches from the plant before reaching full internal ripeness. Because ripening continues post-harvest, external cues such as color or firmness are unreliable indicators of maturity. In addition, ripening dynamics are strongly affected by genetic differences among cultivars as well as environmental factors such as temperature and altitude. Consequently, the accurate assessment of harvest maturity requires objective measures, including total soluble solids (°Brix), fruit firmness, and biochemical analyses, to ensure optimal fruit quality and the retention of key bioactive compounds.

2. Materials and Methods

2.1. Chemicals and Reagents

Water, methanol, formic acid, and hydrochloric acid were purchased from Merck (Darmstadt, Germany). Polyphenol standards (purity > 98%) were obtained from Sigma-Aldrich (Milan, Italy) and included quinic acid, chlorogenic acid, catechin, epicatechin, caffeic acid, p-coumaric acid, ferulic acid, naringin, ellagic acid, quercetin-3-glucoside, rutin, kaempferol-3-glucoside, isorhamnetin-3-rutinoside, myricetin, daidzein, quercetin, naringenin, luteolin, luteolin-7-glucoside, kaempferol, and syringic acid. Potassium persulfate, ferric chloride, 2,6-dichlorophenolindophenol, sodium acetate, 2,2′-azino-bis(3-ethylbenzothiazoline-6-sulfonic acid) diammonium salt (ABTS), 1,1-diphenyl-2-picrylhydrazyl (DPPH), and 6hydroxy-2,5,7,8-tetramethylchroman-2-carboxylic acid (Trolox®) were obtained from Sigma-Aldrich (Milan, Italy). All reagents and solvents were of analytical grade.

2.2. Experimental Design

The study was conducted in the year 2024, at the germplasm field at the Department of Agricultural Sciences, University of Naples Federico II (40°00′48″ N, 14°01′09″ E, elevation 60 m above sea level), using 20-year-old Acca sellowiana Berg trees trained in an open vase system under traditional cultivation practices. Two cultivars, ‘Apollo’ and ‘Mammoth’, two of the most widespread cultivars in the world, were selected for evaluation. Fruit samples were collected at two different ripening stages, with a 7-day interval between harvests: the first on 4 November and the second on 11 November. For each sampling date, fruits were randomly harvested from four trees per cultivar, ensuring a representative sampling. All trees were managed with standard agronomic practices, including fertilization, irrigation, and pruning.

2.3. Physical-Chemical Analysis of Fruits

Morphological traits were evaluated on the harvested fruits to assess differences between the two cultivars (‘Apollo’ and ‘Mammoth’) and to monitor changes associated with ripening at the two collection dates (4 November and 11 November) (Figure 1).
Two harvest dates, one week apart, were selected to account for the rapid climacteric ripening of feijoa, during which ethylene production and respiration rate increase sharply, significantly affecting fruit quality traits. Morphological analyses were performed on a sample of 30 fruits for each variety and harvest time, collected from three different 20-year-old plants (10 fruits per plant). For chemical analyses (pH, °Brix, and acidity), three fruits per plant were used, resulting in a total of 12 biological replicates. The parameters measured included fruit weight (g), determined with an electronic digital balance (Precisa Instruments AG, model XB220A, Dietikon, Switzerland), and fruit length and diameter (mm), measured with a digital vernier caliper (Mitutoyo, Kawasaki, Japan). Fruit firmness was assessed using an EFFEGI manual penetrometer equipped with an 8 mm diameter tip, applied to two opposite sides of each fruit after removing the peel, and expressed as kg·cm−2. In addition, fruit shape was described using the UPOV (International Union for the Protection of New Varieties of Plants) descriptor for Acca sellowiana, which provides standardized criteria for the characterization of plant varieties (https://www.upov.int/meetings/en/doc_details.jsp?meeting_id=34547&doc_id=290260 (accessed on 28 October 2025)). This comprehensive morphological evaluation allowed for the identification of cultivar-specific traits and ripening-related changes between the two harvest periods. Furthermore, the color attributes of the epicarp were measured using a Minolta CR-400 Colorimeter (Konica Minolta, Inc., Osaka, Japan) to delineate chromaticity values L* (lightness), a* (green to red), and b* (blue to yellow). Total soluble solid (TSS) content was recorded in °Brix using an Atago PR-101a digital refractometer (Tokyo, Japan). We determined pH with a Crison Instruments GLP 21 digital pH meter (Barcelona, Spain). Total acidity was quantified via acid-base titration, using a 0.1 N sodium hydroxide standard solution, and reported as g citric acid per 100 mL. The TSS/TA ratio was subsequently calculated to best express the organoleptic characteristics of fruits.

2.4. Phenolic Compound Extraction

The fruits of the two cultivars, Apollo and Mammoth, harvested at two different ripening stages (4 November and 11 November), were rapidly washed with cold water and subjected to lyophilization by freeze-drying (Christ, Alpha 1–4, Osterode, Germany). The resulting samples were ground into a fine powder using a laboratory mill and stored at −80 °C until analysis. Phenolic compounds extraction was performed following a protocol optimized by Graziani et al. [11], with changes. Specifically, 1 g of lyophilized sample was mixed with 5 mL of a methanol–water solution (80:20, v/v) containing 0.1% formic acid. The mixture was vortexed for 1 min, followed by 15 min of sonication and 10 min of agitation using a rotary shaker. Afterward, the mixture was centrifuged (SL16R Centrifuge; Thermo Fisher Scientific, Milan, Italy) at 5000× g for 5 min at 4 °C to collect the supernatant. The remaining pellet was re-extracted using the same solvent and procedure. Supernatants from both extractions were combined, and an aliquot was filtered and diluted prior to analysis.

2.5. UHPLC Q-Orbitrap HRMS Analysis

Polyphenolic profiling was performed according to Castaldo et al. [12], using an ultra-high-performance liquid chromatography (UHPLC) system (Dionex UltiMate 3000, Thermo Fisher Scientific, Waltham, MA, USA) equipped with a Kinetex Biphenyl column (100 × 2.1 mm, 2.6 µm; Phenomenex, Torrance, CA, USA), maintained at a constant temperature of 30 °C. The mobile phase consisted of water (solvent A) and methanol (solvent B), both acidified with 0.1% formic acid. A gradient elution was applied as follows: initial conditions of 100% A were held for 0.5 min, followed by a linear shift to 30% A within 1 min, which was maintained for 6.5 min, then further reduced to 15% A over the next 3 min, before re-equilibrating to the starting conditions in 2 min. The flow rate was set at 0.5 mL/min with an injection volume of 5 μL. Mass spectrometric detection was performed using a Q-Exactive Orbitrap (Thermo Fisher Scientific) equipped with an electrospray ionization source operating in negative mode. Data acquisition included two scan events: all ion fragmentation (AIF) and full ion MS. AIF parameters were configured as follows: resolution of 17,500 full widths at half-maximum (FWHM), automatic gain control (AGC) target 1 × 10⁵, scan time 0.10 s, maximum injection time to 200 ms, isolation window to 5 m/z, scan range 80–1200 m/z, and retention time to 30 s. The collision energies were included in the range between 15 and 45 eV. For full MS, the resolution was set at 70,000 FWHM, with a scan range 80–1200 m/z, injection time set to 200 ms, AGC target 1 × 10⁶, and scan rate set at 2 scan/s. Ion source settings included a capillary temperature 275 °C, S-lens RF level 50, spray voltage 2.8 kV, sheath gas pressure (N2 > 95%) 35, auxiliary gas (N2 > 95%) 10, and auxiliary gas heather temperature 350 °C. Mass accuracy was ensured by applying a tolerance of 5 ppm. A total of 21 phenolic compounds, comprising both flavonoids and phenolic acids, were identified and quantified across all samples. The developed analytical method achieved optimal chromatographic separation with a total run time of 13 min. All analyses were performed using negative electrospray ionization (ESI) mode. The identification of phenolic compounds was based on retention times, MS/MS fragmentation patterns, and comparison with authentic standards. Structural elucidation of isomeric compounds—catechin and epicatechin (m/z 289.07199); kaempferol and luteolin (m/z 285.04062); and kaempferol-3-O-glucoside and luteolin-7-glucoside (m/z 447.09360)—was achieved by comparing their retention times and fragmentation profiles with reference data reported in the literature. Calibration curves in triplicate at nine different concentration levels were employed to measure the investigated compounds. The quantitative results are reported as micrograms per gram (µg/g) of dry weight. All data were processed using Xcalibur software version 3.1.66.19 (Thermo Fisher Scientific, Waltham, MA, USA). All data were processed using Xcalibur software version 3.1.66.19 (Thermo Fisher Scientific, Waltham, MA, USA).

2.6. Antioxidant Activity Assays

The antioxidant activity of feijoa samples was evaluated through three complementary in vitro assays: ABTS, DPPH, and FRAP. Each method targets different mechanisms of antioxidant action, allowing a more comprehensive assessment of the antioxidant capacity of the matrix. All assays were conducted following previously validated protocols: the ABTS assay presented by Izzo et al. [13], the DPPH assay as described by Brand-Williams et al. [14], and the FRAP assay following the method reported by Rajurkar and Hande [15]. Minor modifications were applied where necessary to adapt the procedures to the specific characteristics of the feijoa matrix. Briefly, 2.5 mL of a 7 mM ABTS solution was mixed with 44 µL of a 2.5 mM potassium persulfate solution. The mixture was then incubated at room temperature for 16 h in the dark to allow radical formation. The resulting ABTS•+ solution was diluted with ethanol to obtain an absorbance of 0.70 ± 0.05 at 734 nm. Subsequently, 100 µL of each diluted extract was added to 1 mL of the ABTS working solution, and the absorbance was measured at 734 nm after 3 min of incubation. A total of 1 mg of DPPH was dissolved in methanol to obtain a solution with an absorbance of 0.90 ± 0.02 at 517 nm. Subsequently, 200 µL of each properly diluted sample was mixed with 1 mL of the DPPH working solution and incubated for 10 min in dark conditions. The absorbance was then recorded at 517 nm. For the FRAP assay, the working reagent was prepared by mixing 1.25 mL of FeCl3 (20 mM), 1.25 mL of TPTZ (10 mM in 40 mM HCl), and 12.5 mL of acetate buffer (0.3 M, pH 3.6). Subsequently, 2.85 mL of the FRAP reagent was combined with 150 µL of each diluted sample, and the absorbance was measured at 593 nm after 4 min of incubation. The results were expressed as mmol Trolox equivalents (TE) per kilogram of dry weight.

2.7. Vitamin C Determination

Vitamin C content was determined through a redox titration method using 2,6-dichlorophenolindophenol (DCPIP) as the titrant, following the protocol described by Vahid [16], with slight modifications. Briefly, 1 g of each lyophilized feijoa sample was extracted with 10 mL of a solution containing metaphosphoric acid and acetic acid. The mixture was shaken for 30 min using a tilting platform shaker and subsequently centrifuged at 4000 rpm for 5 min at 4 °C. For the titration, 5 mL of the metaphosphoric/acetic acid solution and 2 mL of the resulting supernatant were placed in a beaker under magnetic stirring. The mixture was titrated with DCPIP until a persistent light pink endpoint was observed. Ascorbic acid was used as a standard to validate the titration procedure and ensure the accuracy of endpoint detection. Results were expressed as milligrams of vitamin C per 100 g of dry weight (mg/100 g DW) of feijoa sample.

2.8. Determination of Iodine Content

Iodine content was measured on freeze-dried samples of feijoa peel and pulp from the cultivars Apollo and Mammoth, harvested on November 4 and November 11. The analysis was performed using an iodometric titration method, based on the official protocol described in Rapporti ISTISAN 96/34 (Istituto Superiore di Sanità, Roma, Italy 1996) [17]. Samples were solubilized and treated to release iodine, which was then titrated with sodium thiosulfate in the presence of starch as an indicator. All measurements were conducted in triplicate, and results were expressed as mg of iodine per 100 g of dry weight.

2.9. Statistical Analysis

After confirming that the data conformed to a normal distribution through the Kolmogorov–Smirnov test and ensuring variance homogeneity using Levene’s test, a one-way ANOVA was carried out for each parameter to evaluate significant differences across varieties and harvest periods. Post-hoc comparisons were performed using Tukey’s multiple range test (p = 0.05), a method commonly applied in agricultural research. Data processing was conducted with Microsoft Excel and IBM® SPSS Statistics, version 23.0 (Package 6). Additionally, a heatmap was created with the Clustvis online platform, where matrix values were normalized as ln(x + 1), applying Euclidean distance and complete linkage clustering (https://biit.cs.ut.ee/clustvis/ (accessed on 28 October 2025)).

3. Results and Discussion

3.1. Chemical and Physical Quality Traits of the Fruit

A morphological characterization of the fruits was carried out to evaluate the influence of genotype and harvest time on key physical parameters. Specifically, fruit weight, polar and equatorial diameters, and firmness of pulp were measured across two cultivars (‘Apollo’ and ‘Mammoth’) harvested at two different times (Table 1). These traits are essential indicators of fruit development and commercial quality, and are often influenced by both genetic and environmental factors. The results obtained highlight significant differences among the tested groups, providing insights into varietal behavior and harvest-related variations.
Significant differences were observed in fruit weight between cultivars and harvest times (p < 0.001). The cultivar Apollo exhibited the highest fruit weight, particularly at the first harvest on 4 November (105.64 ± 12.46 g), significantly exceeding all other groups. In contrast, Mammoth produced smaller fruits, with the lowest values recorded on 11 November (53.46 ± 6.28 g). These findings suggest that Apollo fruits tend to reach a larger final size compared to Mammoth, potentially due to genotypic differences in growth rate and sink strength. These findings are consistent with those of Pasquariello et al. [18], who reported an average fruit weight of 73.0 ± 16.7 g, with values ranging from 51.8 g (‘Smith’) to 104.8 g (‘Mammoth’). While Mammoth was identified as the heaviest cultivar on average, our results show Apollo producing even larger fruits at specific harvest dates, highlighting the influence of environmental factors and harvest timing, alongside genetic traits, on final fruit size. In Brazil, among commercial varieties, the average fruit weight ranged from 90 g (415-Nonante) to 150 g (SCS 414-Mattos) [19]. In Colombia, the fruit weight of the Quimba cultivar ranged from 21.1 to 52.1 g [20,21]. Furthermore, both cultivars exhibited a noticeable decline in fruit weight between the two harvest dates. This weight loss may be attributable to increased respiration and transpiration rates during late ripening, leading to moisture loss and tissue softening [22]. This trend indicates that delaying harvest beyond a certain physiological maturity stage may compromise fruit quality and postharvest behavior. The L/D values varied between cultivars and harvest times, reflecting differences in fruit morphology. Apollo fruits showed a stable and compact shape (L/D = 1.1), consistent with an oval or nearly round form. In contrast, Mammoth exhibited more elongated fruits, with L/D increasing from 1.3 at the earlier harvest to 1.6 at the later harvest, indicating a shift toward an oblong shape. These differences highlight the influence of both genetic background and ripening stage on fruit morphology. Since fruit size is an appealing trait for consumers, it can serve as an important selection criterion in the breeding of new cultivars. The key variables that distinguish different accessions include fruit length, diameter, weight, and pulp yield [23].
Firmness values declined significantly over time for both cultivars, in agreement with the natural progression of fruit ripening. Apollo fruits maintained a significantly higher firmness at both dates, with values decreasing by 21.6% between the first and second harvest. Mammoth showed lower initial firmness and a more pronounced decrease over time, of about 36.7%. The higher firmness observed in Apollo may indicate a slower softening process or a delayed climacteric peak compared to Mammut, making it potentially more suitable for longer storage or transport. Fruit firmness is one of the most critical quality attributes in fresh produce, closely associated with texture and consumer acceptance [24]. The faster decline observed in Mammut suggests a more rapid ripening process or lower cell wall integrity, possibly due to lower pectin content or higher enzymatic activity, as described by Brummell [25]. The colorimetric analysis of the peel of ‘Apollo’ and ‘Mammoth’ (Table 2) revealed significant percentage changes in the L* and b* parameters, while changes in the a* parameter were not statistically significant.
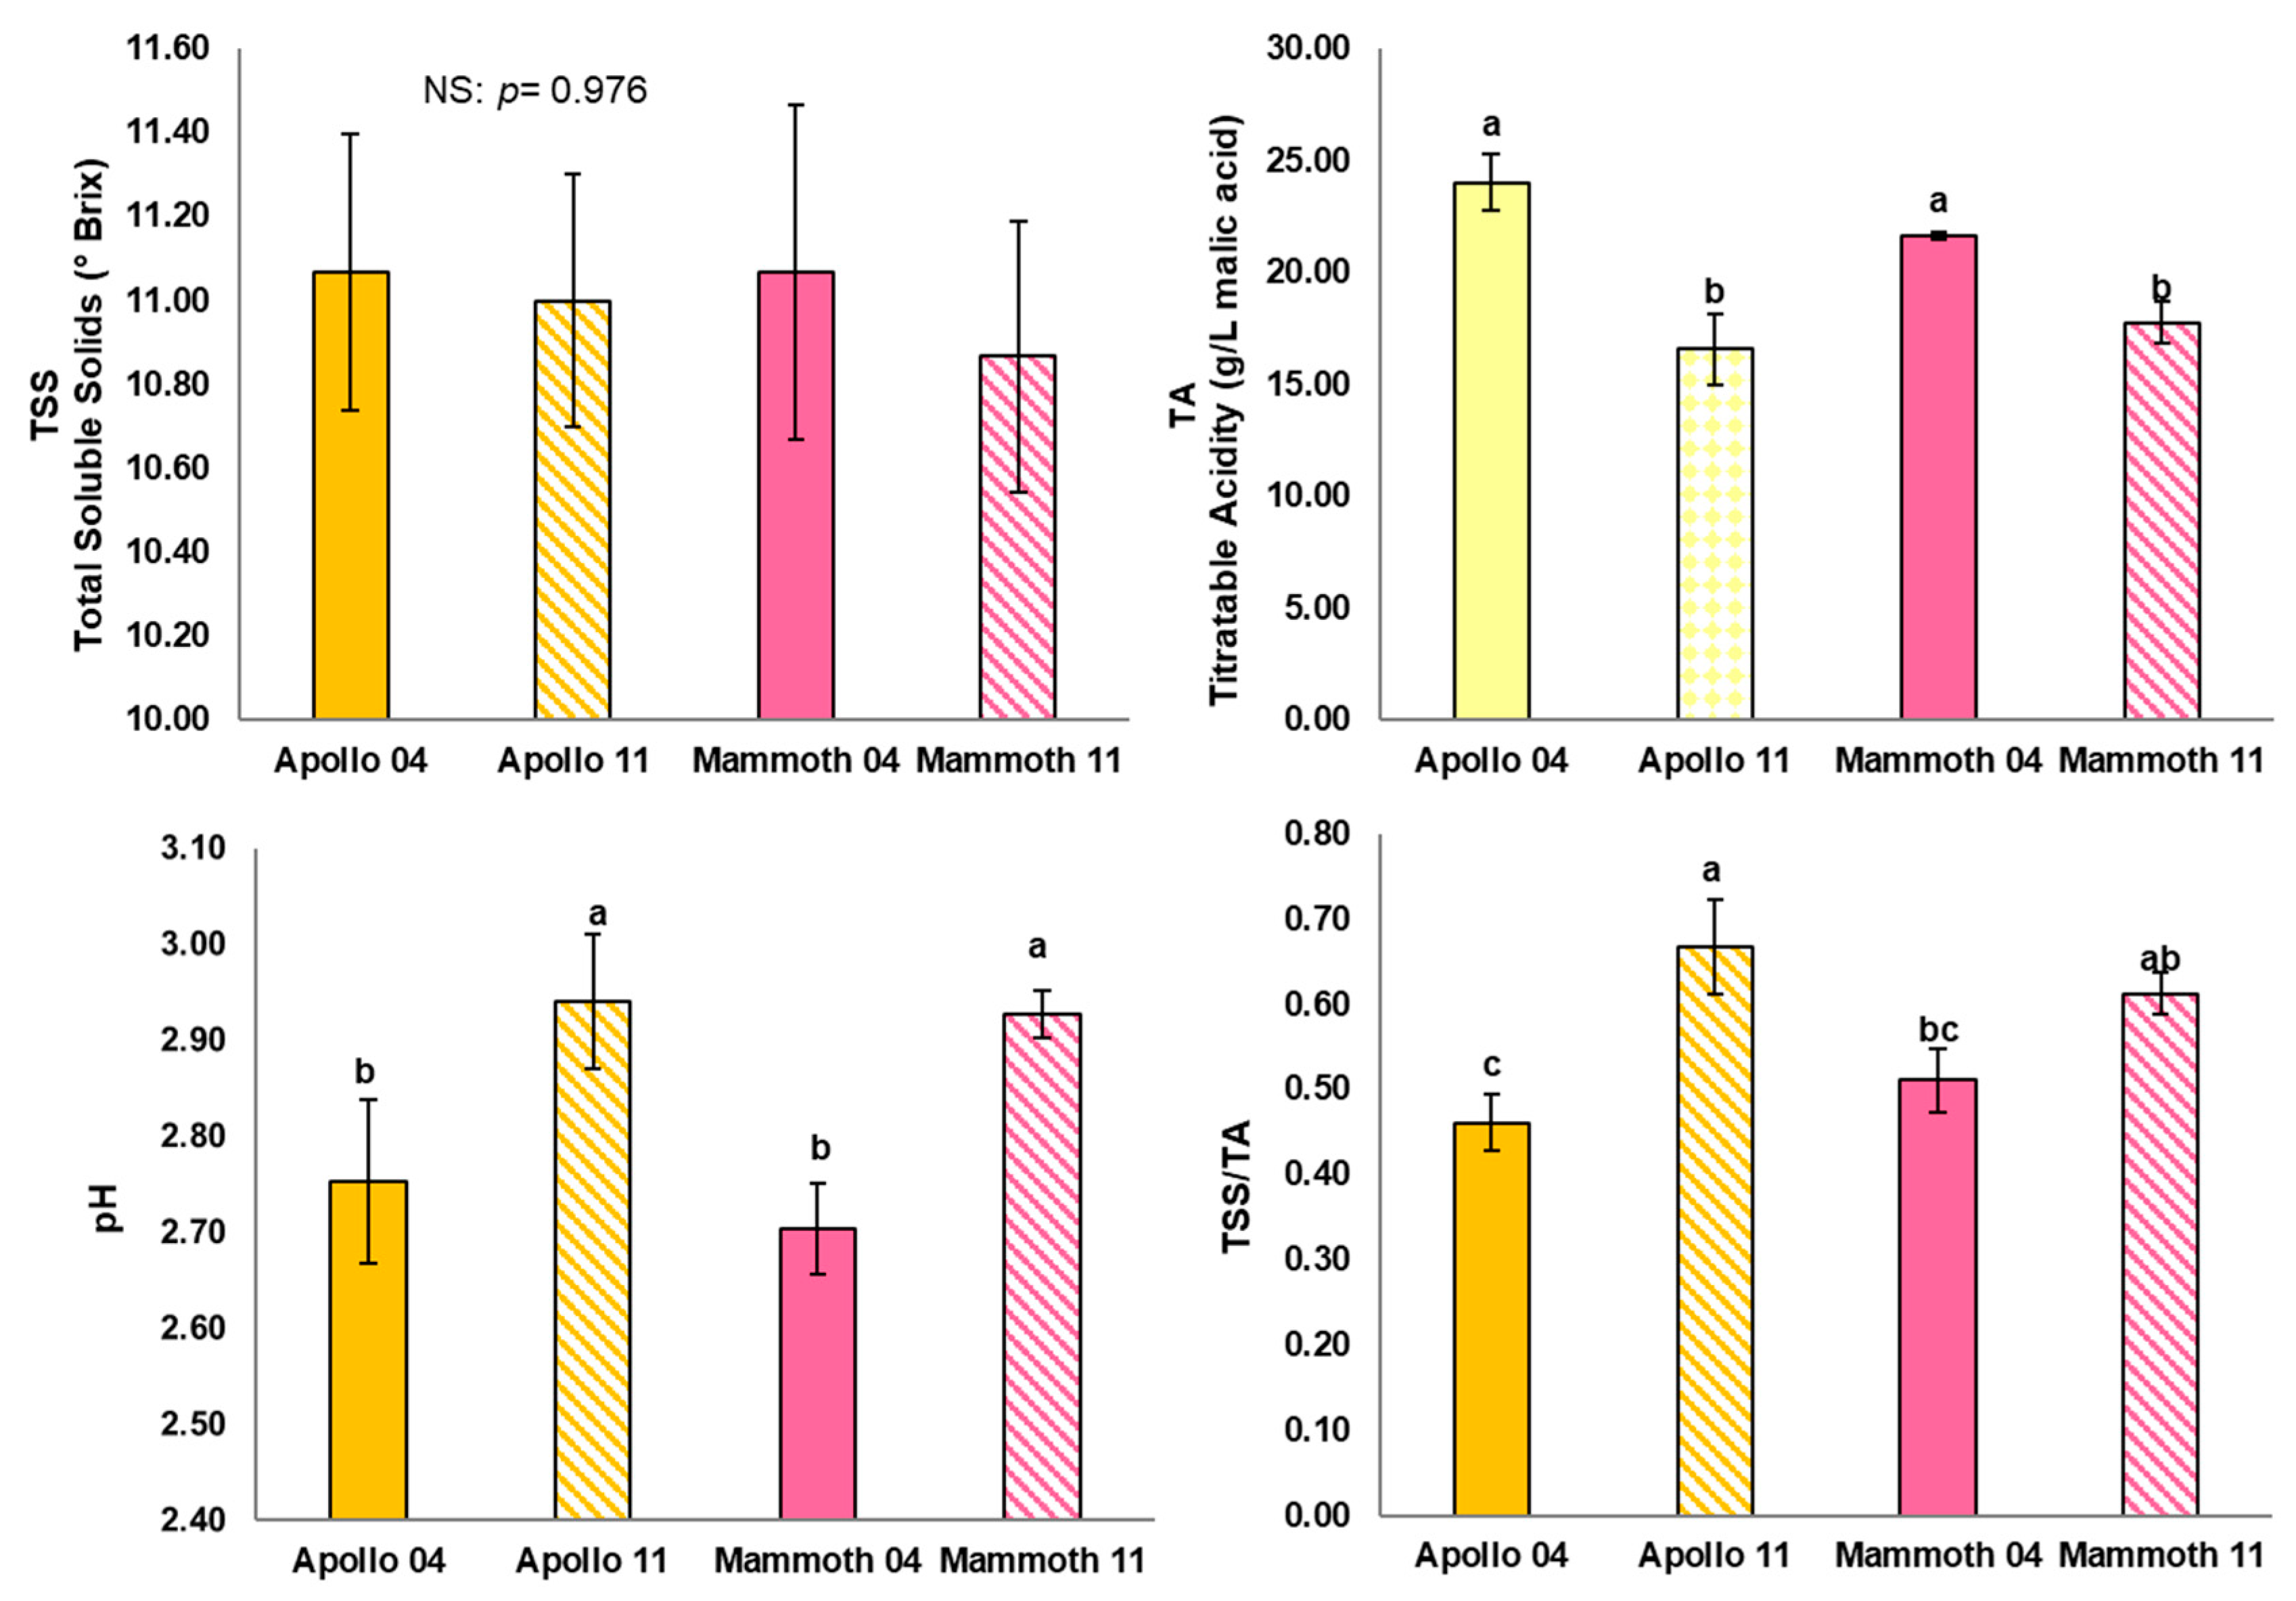
In the Apollo cultivar, the L* value (lightness) increased by about 7.5%, indicating a noticeable lightening of the fruit peel as ripening progressed. Similarly, the b* parameter, associated with the yellow-blue axis, increased by about 17.4%, suggesting an intensification of yellow hues, which is consistent with fruit maturation. The a* value was not statistically significant (ns). In the Mammoth cultivar, L* values remained nearly stable between the two harvests, showing a minimal decrease (−0.18%), indicating that the brightness of the peel remains high and constant even at later maturity stages. The a* value shifted slightly by about +2.9%, which was also non-significant. However, the b* value increased by about 7.1%, confirming a tendency toward increased yellowness during ripening, even in this cultivar. Feijoa fruit undergoes internal ripening, progressing from the core outward. As the fruit overripens, the first noticeable changes include a decline in flavor reflected by reduced soluble solids content and titratable acidity, along with the onset of browning in the pulp. This process eventually leads to flavor loss and flesh discoloration [26]. Because external cues during postharvest ripening are minimal or absent, evaluating maturity through visual inspection, touch, or other non-destructive methods is difficult [27]. Feijoa, a climacteric fruit, must remain on the tree until natural abscission to achieve its characteristic texture and aroma. However, ripening occurs rapidly in the final growth stages, creating considerable variability in fruit maturity within the same tree. Given the lack of reliable external color changes, peel appearance alone is not a trustworthy harvest indicator [27], making destructive measurements more dependable for accurate ripeness assessment. Fruit quality and ripening are commonly evaluated through physicochemical parameters such as pH, total soluble solids (°Brix), and titratable acidity (Figure 2), which provide essential insights into the sugar-to-acid ratio, a key determinant of fruit maturity and consumer acceptability [28].
The interaction between titratable acidity (TA) and total soluble solids (TSS) plays a crucial role in determining the organoleptic quality of feijoa fruits, particularly their flavor and palatability [29]. TSS reflects not only the accumulation of sugars such as sucrose, glucose, and fructose (products of starch hydrolysis during ripening), but also includes other soluble components, such as organic acids, minerals, water-soluble vitamins, and phytochemicals. TA, on the other hand, provides an estimate of total organic acid content, with malic and citric acids being the dominant non-volatile acids in feijoa [30]. In our study, TSS levels remained consistent across samples (p = 0.976), ranging from 10.80 to 11.10 °Brix. A slight, non-significant reduction in TSS was observed from early to late harvest in both Apollo (−1.2%) and Mammoth (−1.5%), suggesting that sugar accumulation stabilizes in the final stages of ripening. These findings align with those of Sánchez-Mora et al. [31], who reported an average TSS of 11.9 °Brix across various feijoa accessions. This stability is consistent with the known postharvest hydrolysis of starch, which contributes to increasing TSS levels during ripening [1,18]. Harman [30] similarly noted an increase in starch content during fruit maturation. In contrast to the relative stability of TSS, titratable acidity showed marked variation both between cultivars and across harvest dates. In Apollo, TA dropped from 25.1 to 18.3 g/L of malic acid (−27.1%) between November 4 and 11. A similar decline was observed in Mammoth, where TA decreased from 24.1 to 20.2 g/L (−16.2%). These reductions are consistent with expected acid degradation processes during ripening. As acidity decreased, pH values exhibited a corresponding increase: Apollo rose from 2.77 to 2.97 (+7.2%), and Mammoth from 2.74 to 2.93 (+6.9%) reflecting the progressive decline in organic acid concentrations. Malic and citric acids are known to occur in comparable concentrations in feijoa, and acidity levels are influenced by both genotype and environmental conditions. For instance, the Brazilian commercial cultivar Nonante exhibited a TA of 28.9 g/L (malic acid equivalent), which was significantly higher than that of cultivars Alcântara, Mattos, and Helena, which averaged 18.0 g/L [32]. Similarly, TA values in four Uruguayan accessions ranged from 2.4 to 19.7 g/L of citric acid, with a mean of 8.5 g/L [23] while in the Colombian cultivar Quimba showed TA values between 17.0 and 19.0 g/L in Tenjo and 16.0 and 19.0 g/L in San Francisco [33]. Sánchez-Mora et al. [31] also documented a wide range of pH values, from 2.5 to 4.5, across 27 accessions, results that correspond well with our own findings. The cultivars Quimba and 8–4, however, showed a pH of 2.5 at harvest [34]. These values align with data from Beyhan and Eyduran [5], who reported a mean pH of 3.8, ranging from 2.8 to 4.6, across 300 Turkish feijoa accessions. Comparable ranges (2.0 to 3.5) were also recorded in Brazilian commercial cultivars [32]. According to Rodríguez et al. [34], pH is influenced by the cultivar, agroecological conditions, and postharvest storage, making it an important industrial parameter due to its impact on processing costs. The ratio of TSS to TA, often used as an indicator of flavor balance between sweetness and acidity, increased in both cultivars over time. In Apollo, the ratio rose from 0.43 to 0.61 (+41.9%), while in Mammoth it increased from 0.46 to 0.56 (+21.7%). This shift indicates enhanced flavor perception in late-harvested fruits, which tend to be less acidic and more palatable. Overall, these findings confirm that both Apollo and Mammoth undergo measurable biochemical changes during ripening, particularly in the degradation of acids and the modulation of taste-related compounds. Notably, Apollo exhibited a more pronounced variation across harvest dates. In line with our observations, Beyhan and Eyduran [5] concluded that high acidity and low TSS are primarily driven by the ecological conditions during fruit development. These two parameters TA and TSS remain fundamental to evaluating fruit quality, as they directly influence flavor perception and consumer acceptance.

3.2. Phenolic Compounds: Analysis by UHPLC-Q-Orbitrap HRMS

The qualitative and quantitative analysis of individual phenolic compounds in Feijoa samples revealed substantial differences between peel and pulp, harvest times, and genotypes. The quantitative results are presented in Table 3 and reported as micrograms per gram (µg/g) of dry weight. Peel samples consistently exhibited higher concentrations of most compounds, notably catechin, epicatechin, ellagic acid, and quinic acid. Catechin emerged as the most abundant phenolic compound, reaching 344.58 µg/g in Apollo peel at the first harvest (4 November), compared to 101.48 µg/g in the corresponding pulp. In peel samples of both genotypes, catechin alone accounted for approximately 45–50% of the total content of phenolic compounds, highlighting its dominant contribution to the overall phenolic profile. This notable concentration of catechin in the peel is consistent with findings by Peng et al. [35], who identified catechin as one of the main phenolic compounds in the peel of New Zealand-grown feijoa cultivars. Epicatechin, quinic acid, and ellagic acid followed similar trends, with significantly higher levels in peel, particularly in the Apollo genotype. These findings align with the phenolic profiles described by Amarante et al. [32], who documented the abundance of flavanols and phenolic acids in Brazilian feijoa genotypes, emphasizing tissue-specific accumulation patterns. Moreover, several phenolic acids, such as caffeic, chlorogenic, p-coumaric, and ferulic acids, were more concentrated in peel samples, especially at the second harvest. This temporal variation in phenolic acid content has been reported in other studies and may be related to fruit maturation and environmental factors influencing phenolic biosynthesis [36]. Genotypic differences were evident, with Apollo peel generally accumulating higher levels of phenolic compounds than Mammoth, while pulp samples remained consistently lower and exhibited minimal variation across genotypes and harvest times. Such genotypic variation in phenolic composition reflects the differential metabolic capacities and regulatory mechanisms governing polyphenol biosynthesis in feijoa cultivars, as highlighted by Amarante et al. [32].
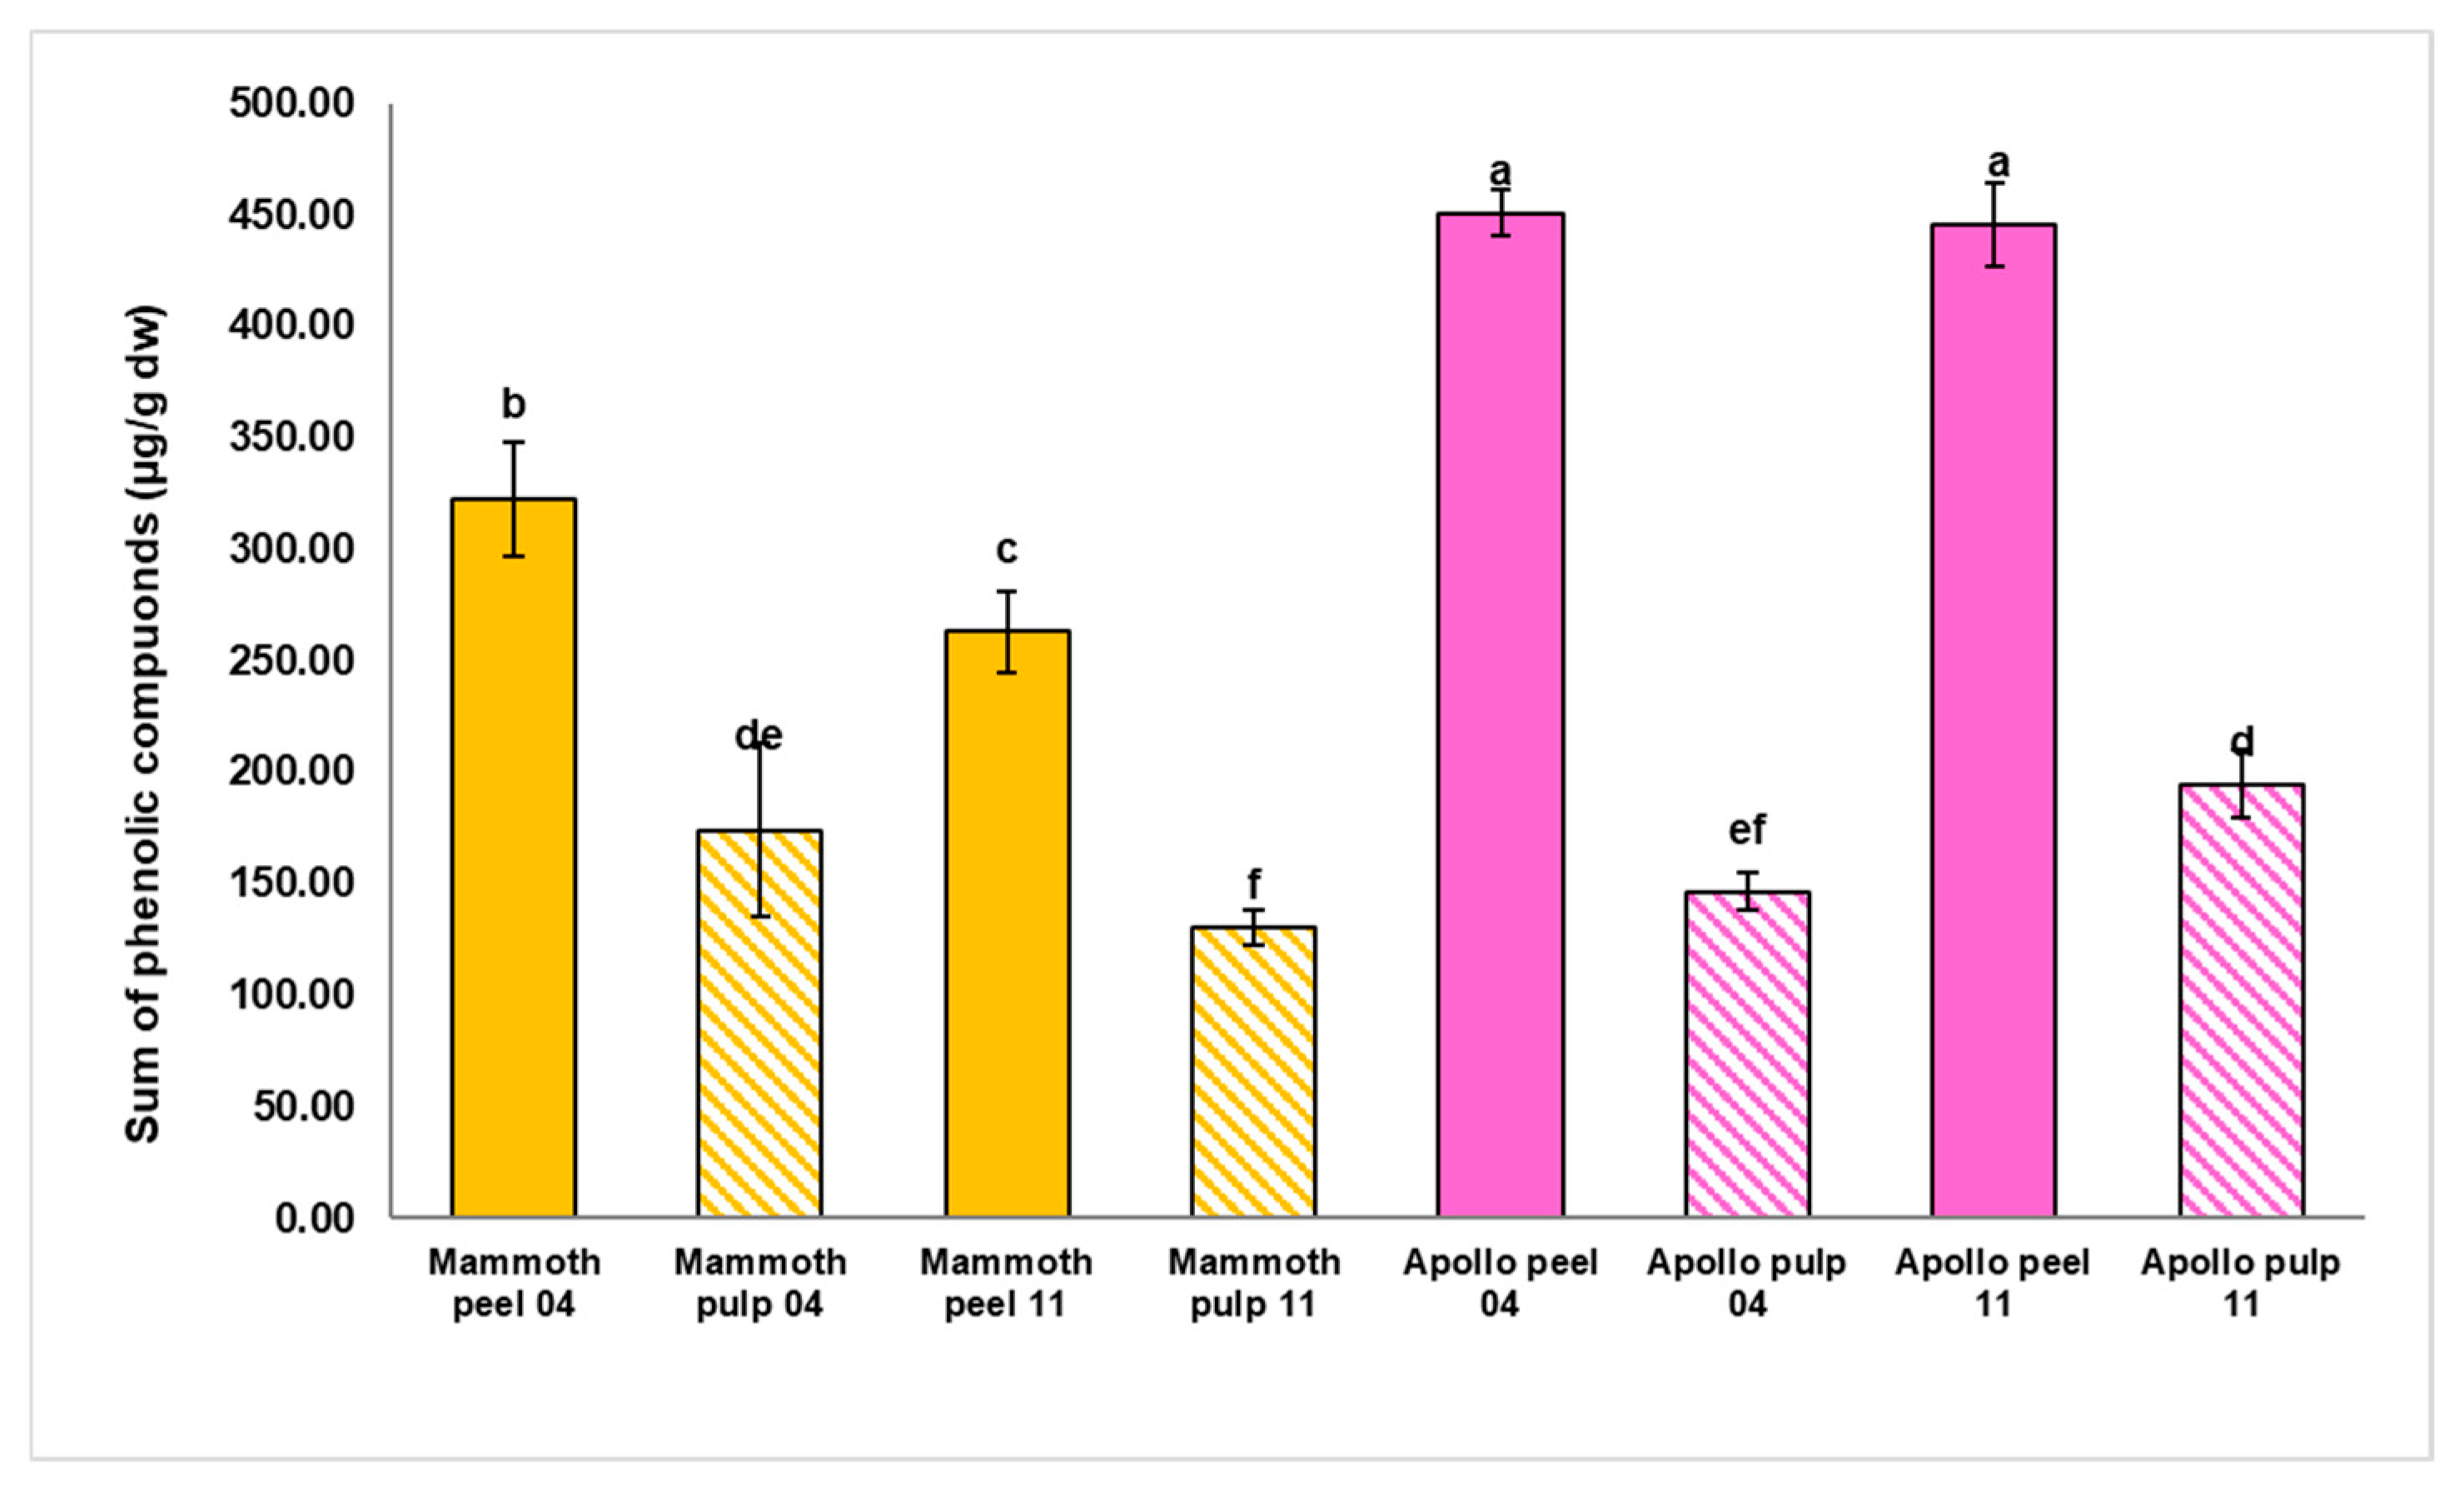
The marked disparity between peel and pulp was further confirmed through the sum of individual phenolic compounds, evaluated by UHPLC Q-Orbitrap HRMS data (Figure 3). Both genotypes displayed significantly higher total phenolic compound levels in peel, with Apollo peel at the second harvest presenting the highest overall value. From harvests 4 to 11, total content of phenolic compound in Apollo peel increased by approximately 14%, while Mammoth showed a more modest rise of around 7%. In contrast, pulp samples from both genotypes exhibited limited variation across harvests and maintained significantly lower total phenolic compound levels than peel. This accumulation pattern emphasizes the impact of harvest timing on phenolic concentration in the peel, suggesting progressive biosynthetic activity or concentration effects during fruit maturation, particularly in Apollo. Similar trends have been reported by Tuncel and Yılmaz [37], who observed increased phenolic content during maturation stages in feijoa peel. Additionally, Amarante et al. [32] noted genotype-dependent differences in total phenolic content and antioxidant activity across harvest times, supporting the influence of genetic and developmental factors on phenolic biosynthesis.

3.3. Antioxidant Activity

The antioxidant capacity of Feijoa sellowiana was evaluated using ABTS, DPPH, and FRAP assays in the two selected cultivars (‘Mammoth’ and ‘Apollo’), across peel and pulp tissues, and at two harvest stages (early and late). Statistically significant differences (p < 0.001) were observed among all samples, with tissue type exerting the strongest influence. In all assays, peel exhibited consistently higher antioxidant values than pulp, regardless of cultivar or harvest time (Table 4).
Within this tissue-dependent pattern, the ‘Mammoth’ cultivar exhibited elevated antioxidant activity across assays, particularly in the peel, which remained relatively consistent between harvest dates. The pulp of Mammoth showed a marked ripening-related variation, with DPPH increasing by 46%, FRAP by 32%, and ABTS by 40%, indicating an enhanced accumulation of antioxidant constituents over time. A similar tissue-specific distribution was observed in ‘Apollo’, though the overall assay responses were less pronounced. In this genotype, peel samples showed increases of approximately 14% in FRAP and 10% in ABTS between early and late harvests, while DPPH activity remained stable. The pulp fraction exhibited minimal variation across harvest time, with only slight fluctuations observed across all antioxidant assays. When comparing cultivars, ‘Mammoth’ peel exhibited FRAP values up to 39% higher than ‘Apollo’ in the early harvest. In the pulp, genotypic differences became more pronounced at the late harvest stage, with ‘Mammoth’ showing DPPH and ABTS values that were 87% and 63% greater than those of ‘Apollo’, respectively. These findings suggest that both genetic background and developmental stage influence antioxidant accumulation, although both cultivars retained notably high antioxidant activity.
The enhanced antioxidant capacity observed in peel tissue aligns with previous reports by Zheng et al. [38] and Amarante et al. [32], who associated this pattern with structural and physiological features of the peel that facilitate the accumulation of bioactive antioxidant compounds. In parallel, the cultivar-related differences observed in the present study are consistent with the findings of Amarante et al. [32], who reported notable variability in antioxidant profiles among feijoa genotypes, although values remained high across all cultivars examined. The ripening-related enhancement in antioxidant activity observed in this study, although not statistically significant, is consistent with previous investigations on feijoa fruit maturation and supports the notion that fruit ripening is generally associated with an increase in antioxidant potential. Vuotto et al. [39] reported increased antioxidant potential in fully ripe feijoa, attributed to the upregulation of biosynthetic enzymes and improved extractability of redox-active constituents. Similarly, Beyhan et al. [5], based on their study of feijoa leaves and fruits at different developmental stages, reported higher antioxidant values in mature samples, supporting the role of fruit ripening in enhancing phytochemical accumulation. Ma et al. [40] further demonstrated that both peel and pulp contribute significantly to the total radical scavenging capacity of feijoa, emphasizing the functional relevance of edible tissues. These findings highlight the multifactorial nature of antioxidant expression in feijoa, shaped by genotype, tissue type, and fruit developmental stage.

3.4. Vitamin C Determination

From the analysis of vitamin C content in Feijoa samples, clear differences emerged based on tissue type and harvest time, while no statistically significant variation was observed between cultivars at the same harvest stage (Figure 4). In both cultivars, peel tissues exhibited markedly higher ascorbic acid concentrations than pulp. At the second harvest (11), vitamin C levels reached 38.7 mg/100 g dw in ‘Apollo’ peel and 36.9 mg/100 g dw in ‘Mammoth’ peel, compared to 27.5 mg/100 g dw and 28.3 mg/100 g dw, respectively, at the first harvest (04), corresponding to increases of approximately 41% in ‘Apollo’ and 30% in Mammoth. In contrast, pulp samples showed much lower values, with second harvest concentrations of 12.2 mg/100 g dw in ‘Apollo’ and 12.7 mg/100 g dw in ‘Mammoth’, increasing only slightly from the first harvest values of 10.5 mg/100 g dw and 10.9 mg/100 g dw, respectively. On average, peel tissues contained ascorbic acid concentrations approximately threefold higher than those of pulp.
This tissue-specific distribution of ascorbic acid is consistent with previous findings on Feijoa, where the peel has been reported as a major reservoir of antioxidants, including vitamin C and phenolic compounds [41,42]. The observed increase in vitamin C content between harvests may reflect the role of ascorbic acid in fruit ripening, as suggested for other tropical and subtropical fruits [43]. Furthermore, the absence of significant differences between genotypes at the same harvest stage suggests that vitamin C accumulation is more responsive to physiological maturity than to genetic background, a trend similarly reported in Brazilian Feijoa genotypes [32] (Amarante et al., 2017).
These results confirm that vitamin C accumulation in Feijoa is primarily influenced by tissue type and harvest time, with the peel representing a key site of ascorbic acid concentration and nutritional relevance, particularly in the context of functional or fresh consumption.

3.5. Determination of Iodine Content

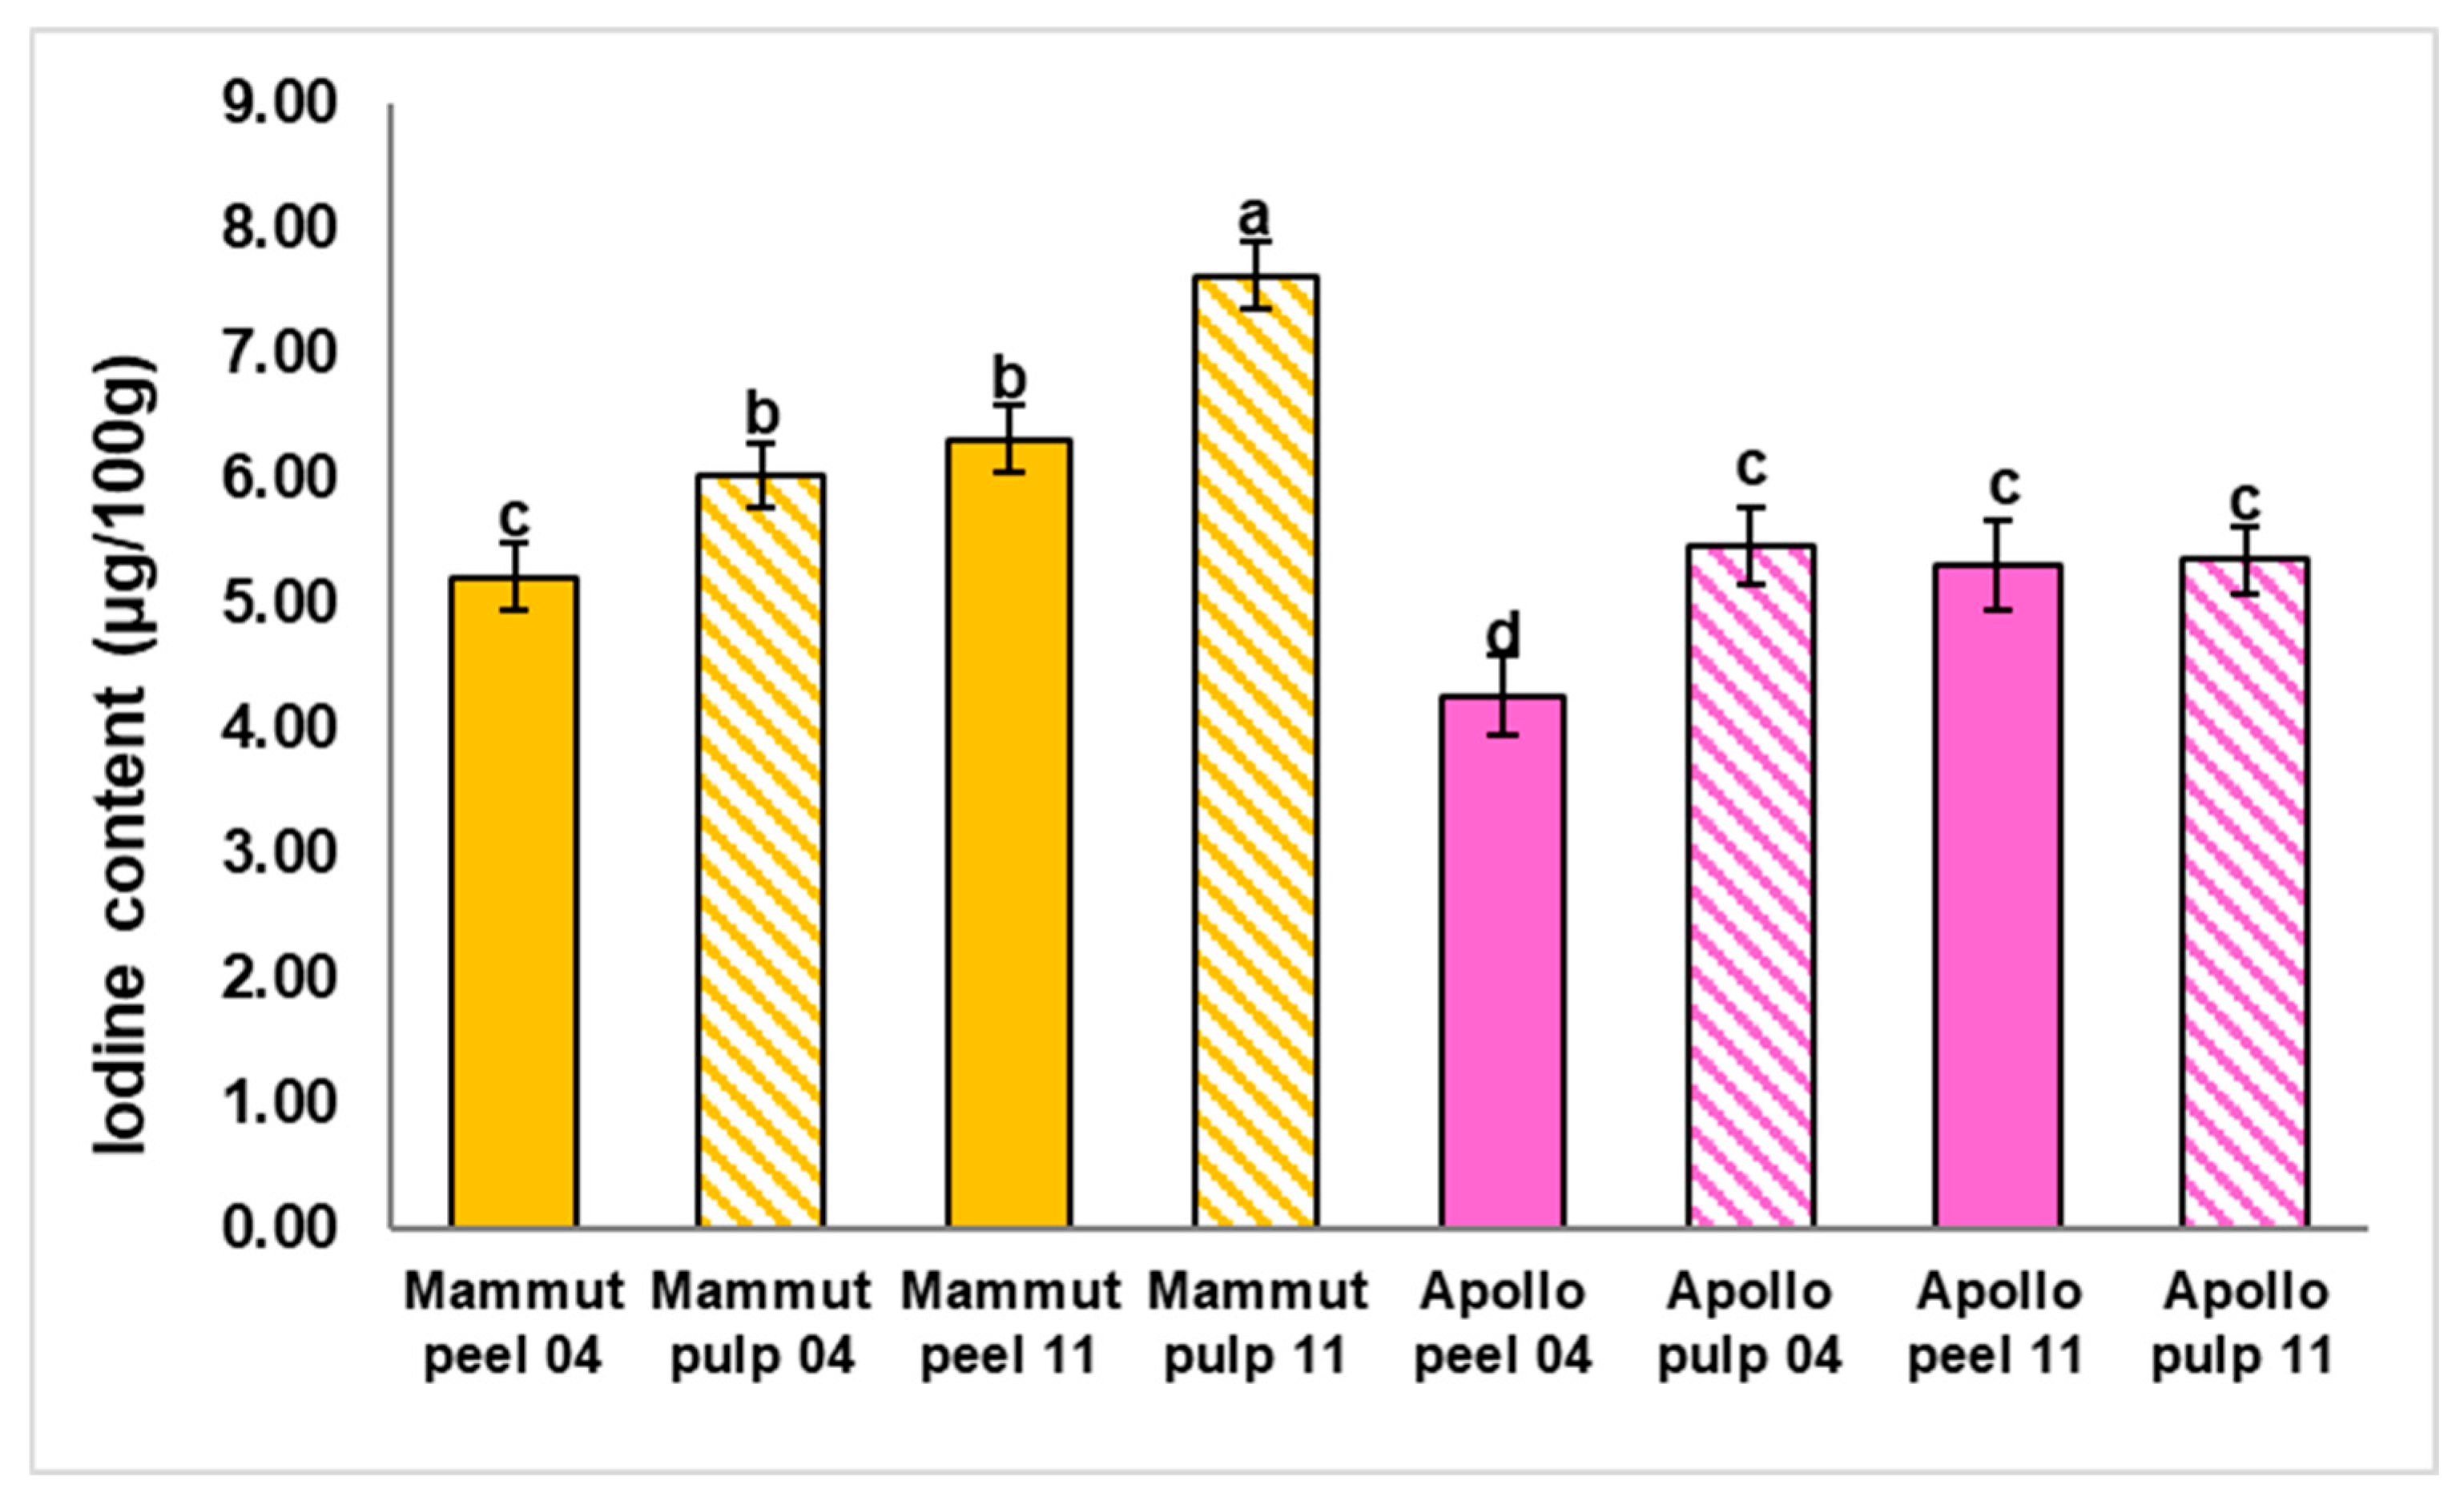
Iodine content was also determined in Feijoa samples from both cultivars and harvest times to evaluate its distribution across tissues and developmental stages. Iodine content (Figure 5) followed a distribution like that of phenolic compounds and vitamin C, with significantly higher levels in peel than in pulp across all samples. A substantial increase in iodine content from harvest 04 to 11 November was observed in both cultivars, with ‘Apollo’ peel showing an approximate 37% rise and ‘Mammoth’ peel a rise of about 30%. In contrast, pulp samples displayed slight changes over time and total content remained markedly lower than that of peel. These findings highlight the peel as the principal site of iodine accumulation, with a clear enhancement at the later harvest stage.
This tissue-specific distribution of iodine aligns with prior evidence that mineral nutrients, including iodine, tend to concentrate in the outer layers of fruits, where metabolic activity and environmental exposure are more pronounced [44]. Ferrara and Montesano [45] previously identified Feijoa sellowiana as a significant source of dietary iodine, with the peel contributing substantially to the total fruit iodine content. Furthermore, the observed increase in iodine concentration at the later harvest time reflects developmental trends reported in other fruit crops, such as apples and pears, where iodine accumulation intensifies with ripening and is influenced by genotype [44]. These results underscore the nutritional value of Feijoa sellowiana, particularly its peel, as a natural dietary source of iodine with potential applications in the formulation of iodine-enriched functional foods.

3.6. Comparative Analysis of Bioactive Compounds and Iodine in Feijoa Tissues Using Heatmap Visualization

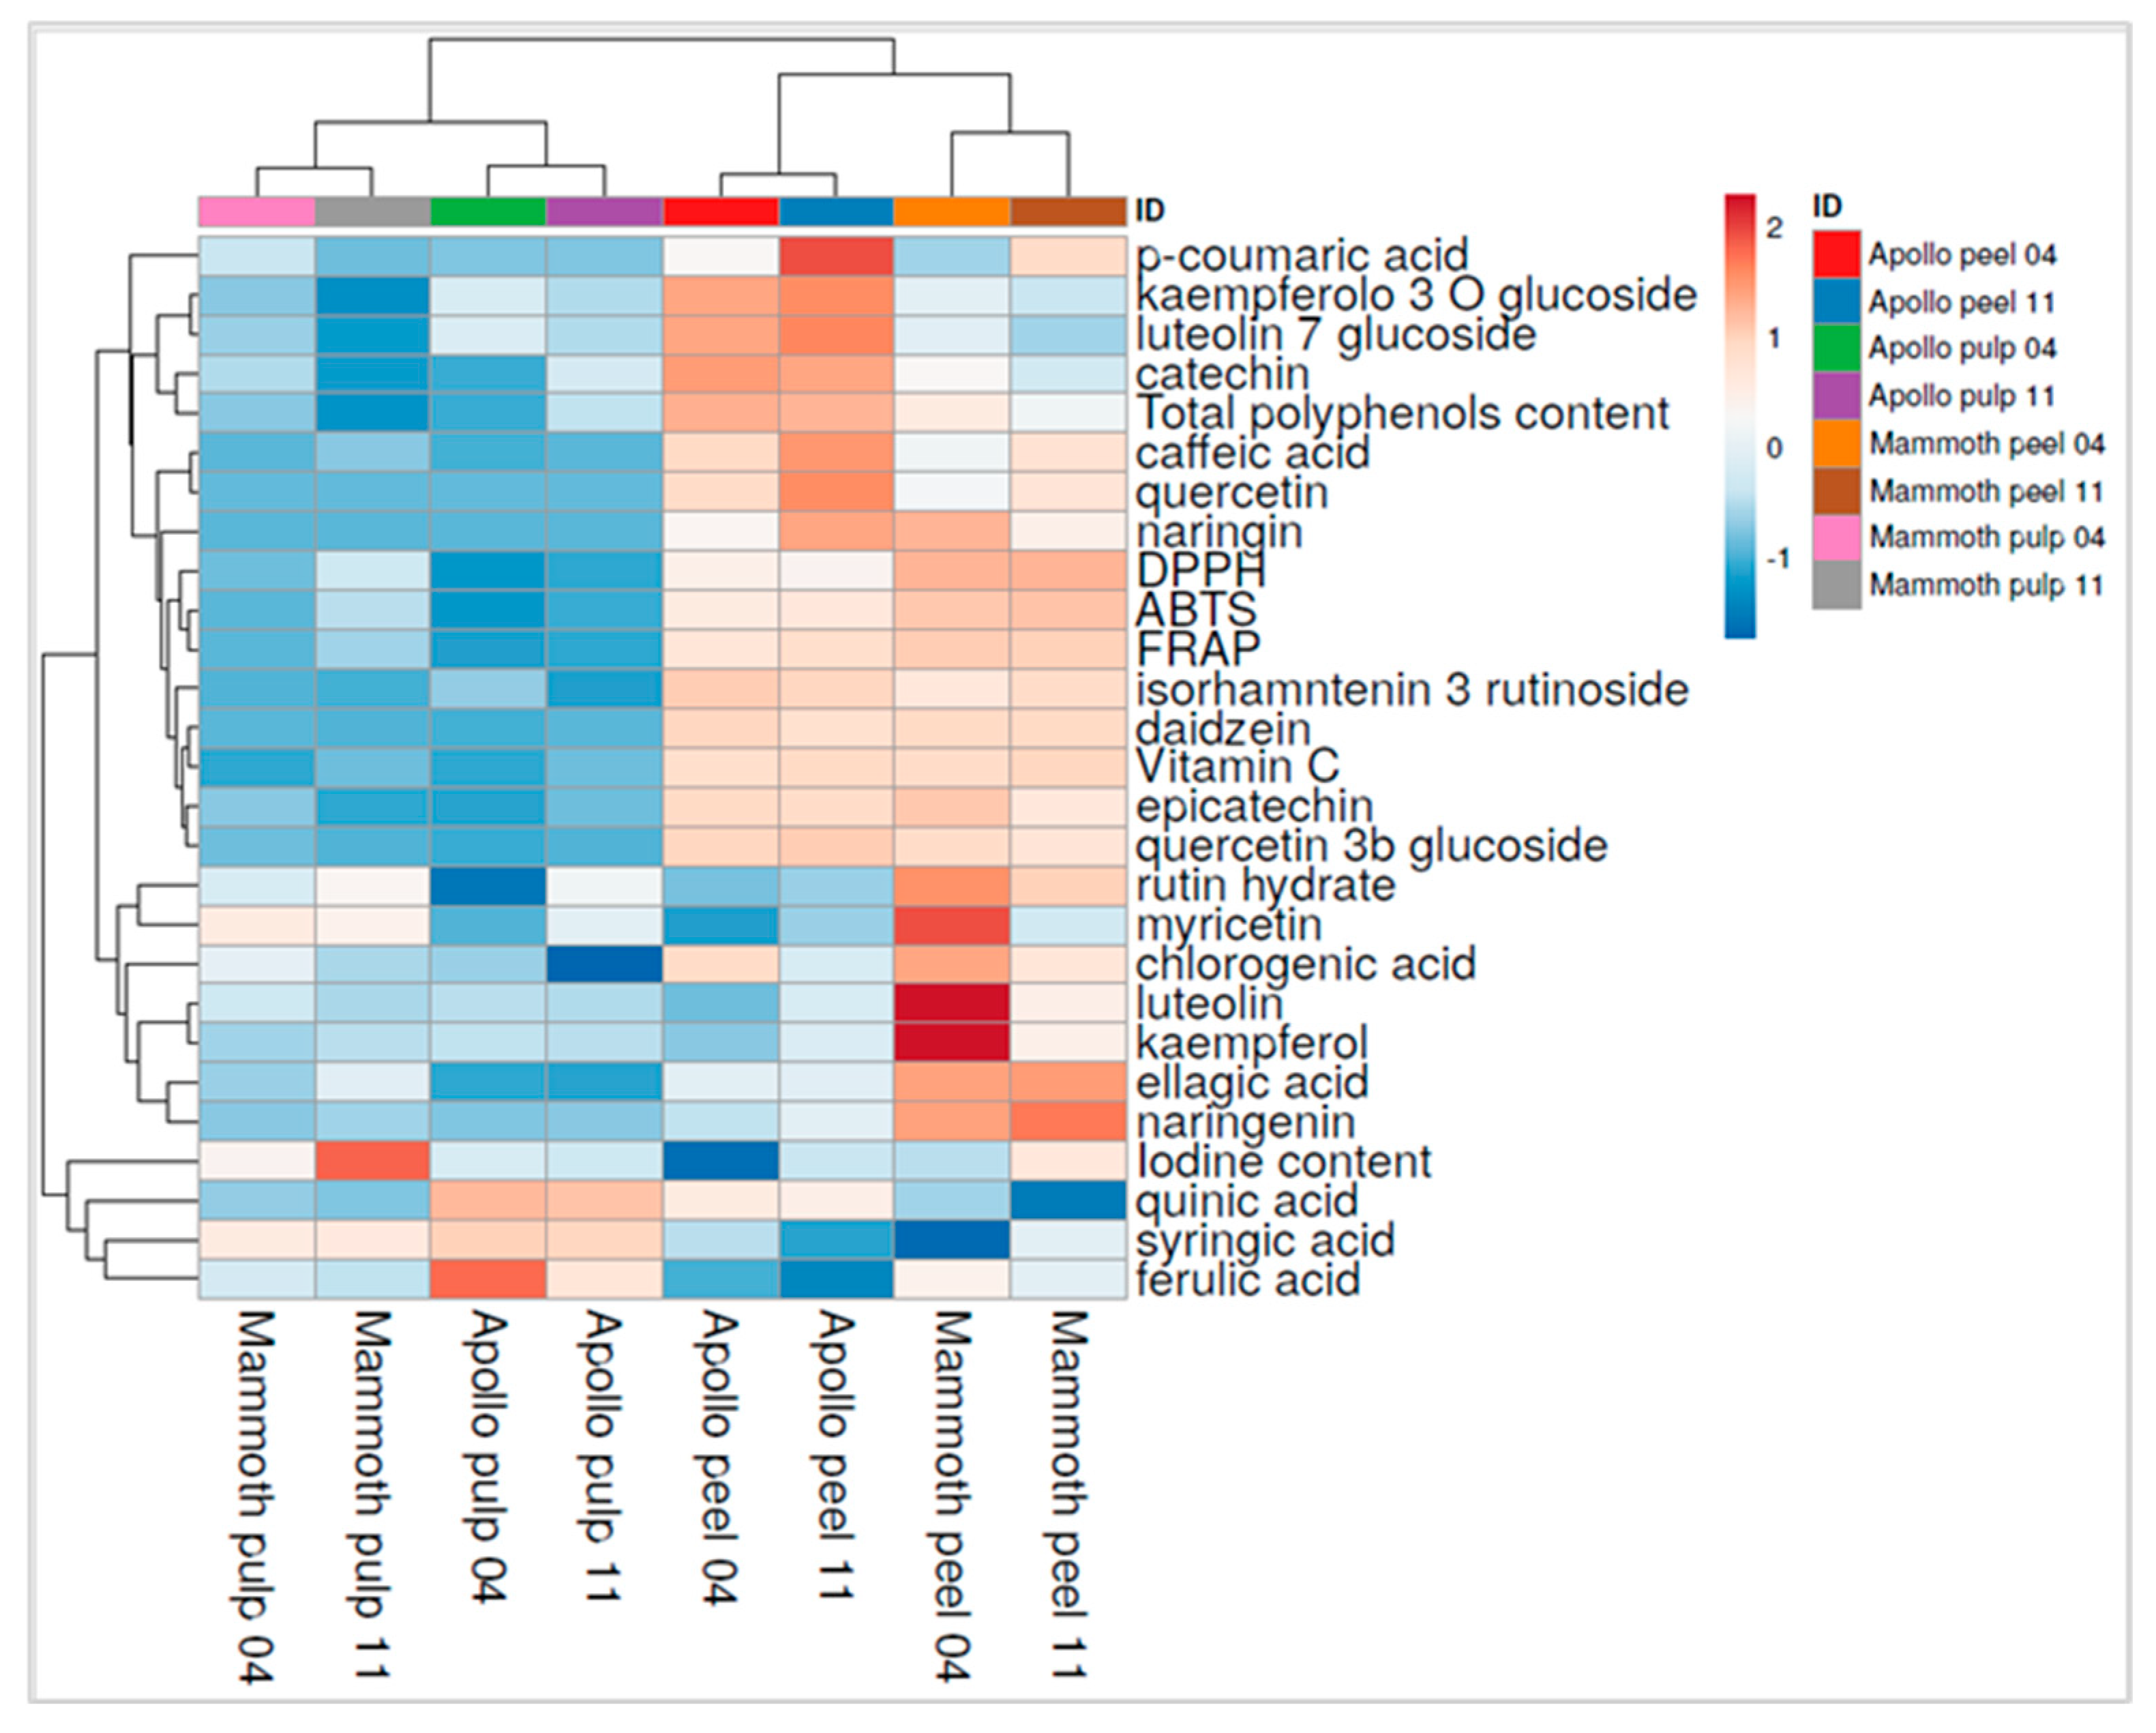
The heat map analysis (Figure 6) provides a comparative overview of bioactive compound profiles and antioxidant parameters across two feijoa cultivars, ‘Apollo’ and ‘Mammoth’, sampled at two harvest times (4 November and 11 November) and separated into peel and pulp fractions. A distinct clustering pattern is evident between the two cultivars and between tissue types. ‘Apollo’ peel samples (both 4 and 11) form a separate cluster from ‘Mammoth’ peel samples, indicating cultivar-specific differences in the accumulation of phenolics and antioxidant capacity in the fruit skin. Likewise, pulp samples from the two cultivars also group separately, particularly noticeable between early and late harvests, suggesting dynamic metabolic shifts over ripening. High intensities (represented by warmer colors) of key antioxidant compounds such as quercetin, rutin hydrate, catechin, and total polyphenol content are predominantly associated with peel tissues, especially in the late harvest samples of both cultivars, highlighting the peel as a rich source of antioxidant compounds. Notably, ‘Apollo’ peel 11 displays elevated levels of quercetin and caffeic acid, whereas ‘Mammoth’ peel 11 is characterized by higher levels of naringenin and ellagic acid. Vitamin C content appears substantially higher in the peel tissues than in the pulp, with ‘Apollo’ peel 11 showing the most pronounced intensity. This highlights the peel as a primary reservoir for ascorbic acid, especially in ‘Apollo’, which may contribute significantly to its antioxidant profile and nutritional value. In contrast, pulp samples, particularly from the early harvest (04), show lower compound concentrations overall (cooler colors), although some exceptions include notable levels of quinic acid and syringic acid. ‘Mammoth’ pulp 11 appears slightly enriched in certain flavonoids such as daidzein and kaempferol and iodine content compared to Mammoth pulp 04. The marked increase at the later harvest stage, particularly in the peel of both cultivars, highlights the role of fruit maturation in iodine accumulation. These findings confirm the peel as the main reservoir of iodine and emphasize the nutritional relevance of Feijoa as a natural dietary source of this essential micronutrient. The clustering structure underscores both temporal and genotypic effects on the phytochemical composition of feijoa, suggesting that both the choice of cultivar and harvest time significantly influence the nutraceutical quality of the fruit. Iodine content in Feijoa samples showed a clear tissue-specific pattern, with consistently higher levels in peel than in pulp.

4. Conclusions

This study provides new insights into the morphological and nutraceutical characterization of two feijoa (Acca sellowiana) cultivars, ‘Apollo’ and ‘Mammoth’, grown under Mediterranean conditions. Significant differences were observed between cultivars and harvest stages. ‘Apollo’ produced larger and firmer fruits, while ‘Mammoth’ displayed smaller size and faster softening, likely associated with more rapid ripening. Basic quality traits such as TSS remained stable across harvests, whereas TA declined and pH increased, resulting in a higher TSS/TA ratio and an improved flavor balance at later harvest stages. The peel was confirmed as the main reservoir of nutraceutical compounds, showing markedly higher concentrations of phenolic compounds, vitamin C, and iodine compared to the pulp. Catechin was identified as the dominant phenolic, particularly abundant in the peel of ‘Apollo’, while antioxidant assays highlighted the superior bioactivity of peel tissues. Antioxidant capacity, vitamin C, and iodine progressively increased between harvest dates, especially in ‘Apollo’, underscoring the influence of ripening stage on phytochemical accumulation. Overall, these findings demonstrate that both cultivar choice and harvest timing are critical for maximizing the nutritional and functional value of feijoa. The peel emerges as a valuable source of bioactive compounds and micronutrients, making it highly suitable for the development of functional foods and the sustainable valorization of fruit by-products. In particular, the consistent enrichment of iodine in peel tissues highlights Feijoa as a natural dietary source of this essential micronutrient, supporting its potential role in strategies aimed at improving iodine intake through functional foods. Future research should further investigate the biochemical mechanisms underlying these differences and explore postharvest strategies to optimize fruit quality and stability.

Author Contributions

Conceptualization, C.D.V. and M.G.; methodology, C.D.V., A.C., L.I. and M.G.; software, A.C.; validation, C.D.V. and M.G.; formal analysis, A.C., R.C., L.I., A.D.M. and L.I.; investigation, M.R., N.C., A.D.M. and R.C.; resources, C.D.V., M.G., A.C. and L.I.; data curation, A.C., L.I. and M.R.; writing—original draft preparation, A.C. and L.I.; writing—review and editing, M.G. and C.D.V.; visualization, C.D.V. and M.G.; supervision, C.D.V. and MG. All authors have read and agreed to the published version of the manuscript.

Funding

This study was carried out within the Agritech National Research Center and received funding from the European Union Next-Generation EU (PIANO NAZIONALE DI RIPRESA E RESILIENZA (PNRR)—MISSIONE 4 COMPONENTE 2, INVESTIMENTO 1.4—D.D. 1032 17 June 2022, CN00000022).

Data Availability Statement

Data are contained within the article.

Conflicts of Interest

The authors declare no conflicts of interest.

References

  1. Fischer, G.; Parra-Coronado, A. Influence of Some Environmental Factors on the Feijoa (Acca sellowiana [Berg] Burret): A Review. Agron. Colomb. 2020, 38, 388–397. [Google Scholar] [CrossRef]
  2. Monforte, M.T.; Lanuzza, F.; Mondello, F.; Naccari, C.; Pergolizzi, S.; Galati, E.M. Phytochemical Composition and Gastroprotective Effect of Feijoa sellowiana Berg Fruits from Sicily. J. Coast. Life Med. 2014, 2, 14–21. [Google Scholar]
  3. Vatrano, T.; Amenta, M.; Copetta, A.; Guardo, M.; Nunziata, A.; Strano, M.C.; Petriccione, M. Multifunctional Role of Acca sellowiana from Farm Management to Postharvest Life: A Review. Agronomy 2022, 12, 1802. [Google Scholar] [CrossRef]
  4. Romero-Rodriguez, M.A.; Vazquez-Oderiz, M.L.; Lopez-Hernandez, J.; Simal-Lozano, J. Composition of Babaco, Feijoa, Passionfruit and Tamarillo Produced in Galicia (North-West Spain). Food Chem. 1994, 49, 23–27. [Google Scholar] [CrossRef]
  5. Beyhan, Ö.; Elmasta, M. Total Phenolic Compounds and Antioxidant Capacity of Leaf, Dry Fruit and Fresh Fruit of Feijoa (Acca sellowiana, Myrtaceae). J. Med. Plants Res. 2010, 4, 1065–1072. [Google Scholar]
  6. Weston, R.J. Bioactive Products from Fruit of the Feijoa (Feijoa sellowiana, Myrtaceae): A Review. Food Chem. 2010, 121, 923–926. [Google Scholar] [CrossRef]
  7. Lapčík, O.; Klejdus, B.; Kokoška, L.; Davidová, M.; Afandi, K.; Kubáň, V.; Hampl, R. Identification of Isoflavones in Acca sellowiana and Two Psidium Species (Myrtaceae). Biochem. Syst. Ecol. 2005, 33, 983–992. [Google Scholar] [CrossRef]
  8. Binder, R.G.; Flath, R.A. Volatile Components of Pineapple Guava. J. Agric. Food Chem. 1989, 37, 734–736. [Google Scholar] [CrossRef]
  9. Shaw, G.J.; Allen, J.M.; Yates, M.K. Volatile flavour constituents in the skin oil from Feijoa sellowiana. Phytochemistry 1989, 28, 1529–1530. [Google Scholar] [CrossRef]
  10. Ruggiero, C.; Rotundo, A.; Di Vaio, C.; Iannini, B. Un triennio di prove sull’esigenze idriche della Feijoa (Acca sellowiana Berg) nell’ambiente mediterraneo. Frutticoltura 1990, 7, 51–56. [Google Scholar]
  11. Graziani, G.; Gaspari, A.; Di Vaio, C.; Cirillo, A.; Ronca, C.L.; Grosso, M.; Ritieni, A. Assessment of In Vitro Bioaccessibility of Phenolic compounds from Annurca, Limoncella, Red Delicious, and Golden Delicious Apples Using a Sequential Enzymatic Digestion Model. Antioxidants 2021, 10, 541. [Google Scholar] [CrossRef] [PubMed]
  12. Castaldo, L.; Toriello, M.; Sessa, R.; Izzo, L.; Lombardi, S.; Narváez, A.; Ritieni, A.; Grosso, M. Antioxidant and Anti-Inflammatory Activity of Coffee Brew Evaluated after Simulated Gastrointestinal Digestion. Nutrients 2021, 13, 4368. [Google Scholar] [CrossRef] [PubMed]
  13. Izzo, L.; Castaldo, L.; Lombardi, S.; Gaspari, A.; Grosso, M.; Ritieni, A. Bioaccessibility and Antioxidant Capacity of Bioactive Compounds From Various Typologies of Canned Tomatoes. Front. Nutr. 2022, 9, 849163. [Google Scholar] [CrossRef] [PubMed]
  14. Brand-Williams, W.; Cuvelier, M.E.; Berset, C. Use of a Free Radical Method to Evaluate Antioxidant Activity. LWT Food Sci. Technol. 1995, 28, 25–30. [Google Scholar] [CrossRef]
  15. Rajurkar, N.; Hande, S. Estimation of Phytochemical Content and Antioxidant Activity of Some Selected Traditional Indian Medicinal Plants. Indian J. Pharm. Sci. 2011, 73, 146. [Google Scholar] [CrossRef]
  16. Vahid, B. Titrimetric determination of ascorbic acid contents in plant samples by 2, 6-dichlorophenolindophenol method. J. Chem. Soc. Pak. 2012, 34, 1510–1512. [Google Scholar]
  17. Istituto Superiore di Sanità. Rapporti ISTISAN 96/34; Istituto Superiore di Sanità: Rome, Italy, 1996. [Google Scholar]
  18. Pasquariello, M.S.; Mastrobuoni, F.; Di Patre, D.; Zampella, L.; Capuano, L.R.; Scortichini, M.; Petriccione, M. Agronomic, Nutraceutical and Molecular Variability of Feijoa (Acca sellowiana (O. Berg) Burret) Germplasm. Sci. Hortic. 2015, 191, 1–9. [Google Scholar] [CrossRef]
  19. Ducroquet, J.-P.H.J.; Nunes Eda, C.; Guerra, M.P.; Nodari, R.O. Novas cultivares brasileiras de goiabeira serrana: SCS 414-Mattos e SCS 415-Nonante. Agropecuária Catarin. 2008, 21, 73–76. [Google Scholar] [CrossRef]
  20. Martínez-Vega, R.R.; Fischer, G.; Herrera, A.; Chaves, B.; Quintero, O.C. Características físico-químicas de frutos de feijoa influenciadas por la posición en el canopi. Rev. Colomb. Cienc. Hortícolas 2011, 2, 21–32. [Google Scholar] [CrossRef]
  21. Borsuk, L.J.; Saifert, L.; Villamil, J.M.O.; Mora, F.D.S.; Nodari, R.O. Phenotypic variability in feijoa fruits [Acca sellowiana (O. Berg.) Burret] on indigenous lands, quilombolas communities and protected areas in the south of Brazil. Rev. Bras. Frutic. 2017, 39, e-699. [Google Scholar] [CrossRef]
  22. Rana, M.K. Ripening changes in fruits and vegetables: A review. Haryana J. Hortic. Sci. 2006, 35, 271–279. [Google Scholar]
  23. Puppo, M.; Rivas, M.; Franco, J.; Barbieri, R.L. Propuesta de descriptores para Acca sellowiana (Berg.) Burret. Rev. Bras. De Frutic. 2014, 36, 957–970. [Google Scholar] [CrossRef]
  24. Szczesniak, A.S. Texture Is a Sensory Property. Food Qual. Prefer. 2002, 13, 215–225. [Google Scholar] [CrossRef]
  25. Brummell, D.A. Cell Wall Disassembly in Ripening Fruit. Funct. Plant Biol. 2006, 33, 103. [Google Scholar] [CrossRef] [PubMed]
  26. Klein, J.D.; Thorp, T.G. Feijoas: Post-Harvest Handling and Storage of Fruit. N. Z. J. Exp. Agric. 1987, 15, 217–221. [Google Scholar] [CrossRef]
  27. Schotsmans, W.C.; East, A.; Thorp, G.; Woolf, A.B. Feijoa (Acca sellowiana [Berg] Burret). In Postharvest Biology and Technology of Tropical and Subtropical Fruits; Elsevier: Amsterdam, The Netherlands, 2011; pp. 115–133, 115e–135e. ISBN 978-1-84569-735-8. [Google Scholar]
  28. Kader, A.A. Flavor Quality of Fruits and Vegetables. J. Sci. Food Agric. 2008, 88, 1863–1868. [Google Scholar] [CrossRef]
  29. Crisosto, C.H.; Crisosto, G.M.; Metheney, P. Consumer Acceptance of ‘Brooks’ and ‘Bing’ Cherries Is Mainly Dependent on Fruit SSC and Visual Skin Color. Postharvest Biol. Technol. 2003, 28, 159–167. [Google Scholar] [CrossRef]
  30. Harman, J.E. Feijoa Fruit: Growth and Chemical Composition during Development. N. Z. J. Exp. Agric. 1987, 15, 209–215. [Google Scholar] [CrossRef]
  31. Sánchez-Mora, F.D.; Saifert, L.; Ciotta, M.N.; Ribeiro, H.N.; Petry, V.S.; Rojas-Molina, A.M.; Lopes, M.E.; Lombardi, G.G.; Dos Santos, K.L.; Ducroquet, J.P.H.J.; et al. Characterization of Phenotypic Diversity of Feijoa Fruits of Germplasm Accessions in Brazil. Agrosyst. Geosci. Environ. 2019, 2, 1–11. [Google Scholar] [CrossRef]
  32. Amarante, C.V.T.D.; Souza, A.G.D.; Benincá, T.D.T.; Steffens, C.A. Fruit Quality of Brazilian Genotypes of Feijoa at Harvest and after Storage. Pesqui. Agropecuária Bras. 2017, 52, 734–742. [Google Scholar] [CrossRef]
  33. Parra C, A.; Fischer, G. Maduración y comportamiento poscosecha de la feijoa (Acca sellowiana (O. Berg) Burret). Una revisión. Rev. Colomb. Cienc. Hortícolas 2013, 7, 98–110. [Google Scholar] [CrossRef]
  34. Rodríguez, M.; Arjona, H.E. Caracterización fisicoquímica del crecimiento y desarrollo de los frutos de feijoa (Acca sellowiana Berg) en los clones 41 (Quimba) y 8-4. Agronomía Colomb. 2006, 24, 54–61. [Google Scholar]
  35. Peng, Y.; Bishop, K.S.; Quek, S.Y. Extraction Optimization, Antioxidant Capacity and Phenolic Profiling of Extracts from Flesh, Peel and Whole Fruit of New Zealand Grown Feijoa Cultivars. Antioxidants 2019, 8, 141. [Google Scholar] [CrossRef] [PubMed]
  36. De Oliveira Schmidt, H.; Rockett, F.C.; Klen, A.V.B.; Schmidt, L.; Rodrigues, E.; Tischer, B.; Augusti, P.R.; De Oliveira, V.R.; Da Silva, V.L.; Flôres, S.H.; et al. New Insights into the Phenolic Compounds and Antioxidant Capacity of Feijoa and Cherry Fruits Cultivated in Brazil. Food Res. Int. 2020, 136, 109564. [Google Scholar] [CrossRef]
  37. Tuncel, N.B.; Yılmaz, N. Optimizing the extraction of phenolics and antioxidants from feijoa (Feijoa sellowiana, Myrtaceae). J. Food Sci. Technol. 2015, 52, 141–150. [Google Scholar] [CrossRef]
  38. Zheng, Z.; Wu, L.; Deng, W.; Yi, K.; Li, Y. Polyphenol Composition, Antioxidant Capacity and Xanthine Oxidase Inhibition Mechanism of Furong Plum Fruits at Different Maturity Stages. Foods 2023, 12, 4253. [Google Scholar] [CrossRef]
  39. Vuotto, M.L.; Basile, A.; Moscatiello, V.; De Sole, P.; Castaldo-Cobianchi, R.; Laghi, E.; Ielpo, M.T.L. Antimicrobial and Antioxidant Activities of Feijoa sellowiana Fruit. Int. J. Antimicrob. Agents 2000, 13, 197–201. [Google Scholar] [CrossRef] [PubMed]
  40. Ebrahimzadeh, M.A.; Hosseinimehr, S.J.; Hamidinia, A.; Jafari, M. Antioxidant and free radical scavenging activity of Feijoa sellowiana fruits peel and leaves. Pharmacologyonline 2008, 1, 7–14. [Google Scholar]
  41. Phan, A.D.T.; Chaliha, M.; Sultanbawa, Y.; Netzel, M.E. Nutritional Characteristics and Antimicrobial Activity of Australian Grown Feijoa (Acca sellowiana). Foods 2019, 8, 376. [Google Scholar] [CrossRef] [PubMed]
  42. Zhu, F. Chemical and Biological Properties of Feijoa (Acca sellowiana). Trends Food Sci. Technol. 2018, 81, 121–131. [Google Scholar] [CrossRef]
  43. Castro, A.M.; Díaz, L.E.; Quintanilla-Carvajal, M.X.; Mayorga, E.Y.; Moreno, F.L. Convective Drying of Feijoa (Acca sellowiana Berg): A Study on Bioactivity, Quality, and Drying Parameters. LWT 2023, 186, 115209. [Google Scholar] [CrossRef]
  44. Budke, C.; Dierend, W.; Schön, H.-G.; Hora, K.; Mühling, K.H.; Daum, D. Iodine Biofortification of Apples and Pears in an Orchard Using Foliar Sprays of Different Composition. Front. Plant Sci. 2021, 12, 638671. [Google Scholar] [CrossRef] [PubMed]
  45. Ferrara, L.; Montesano, D. Caratteristiche nutrizionali del frutto di Feijoa sellowiana. Il contenuto di iodio. LA Riv. DI Sci. Dell’Aliment. 2001, 4, 353–356. [Google Scholar]
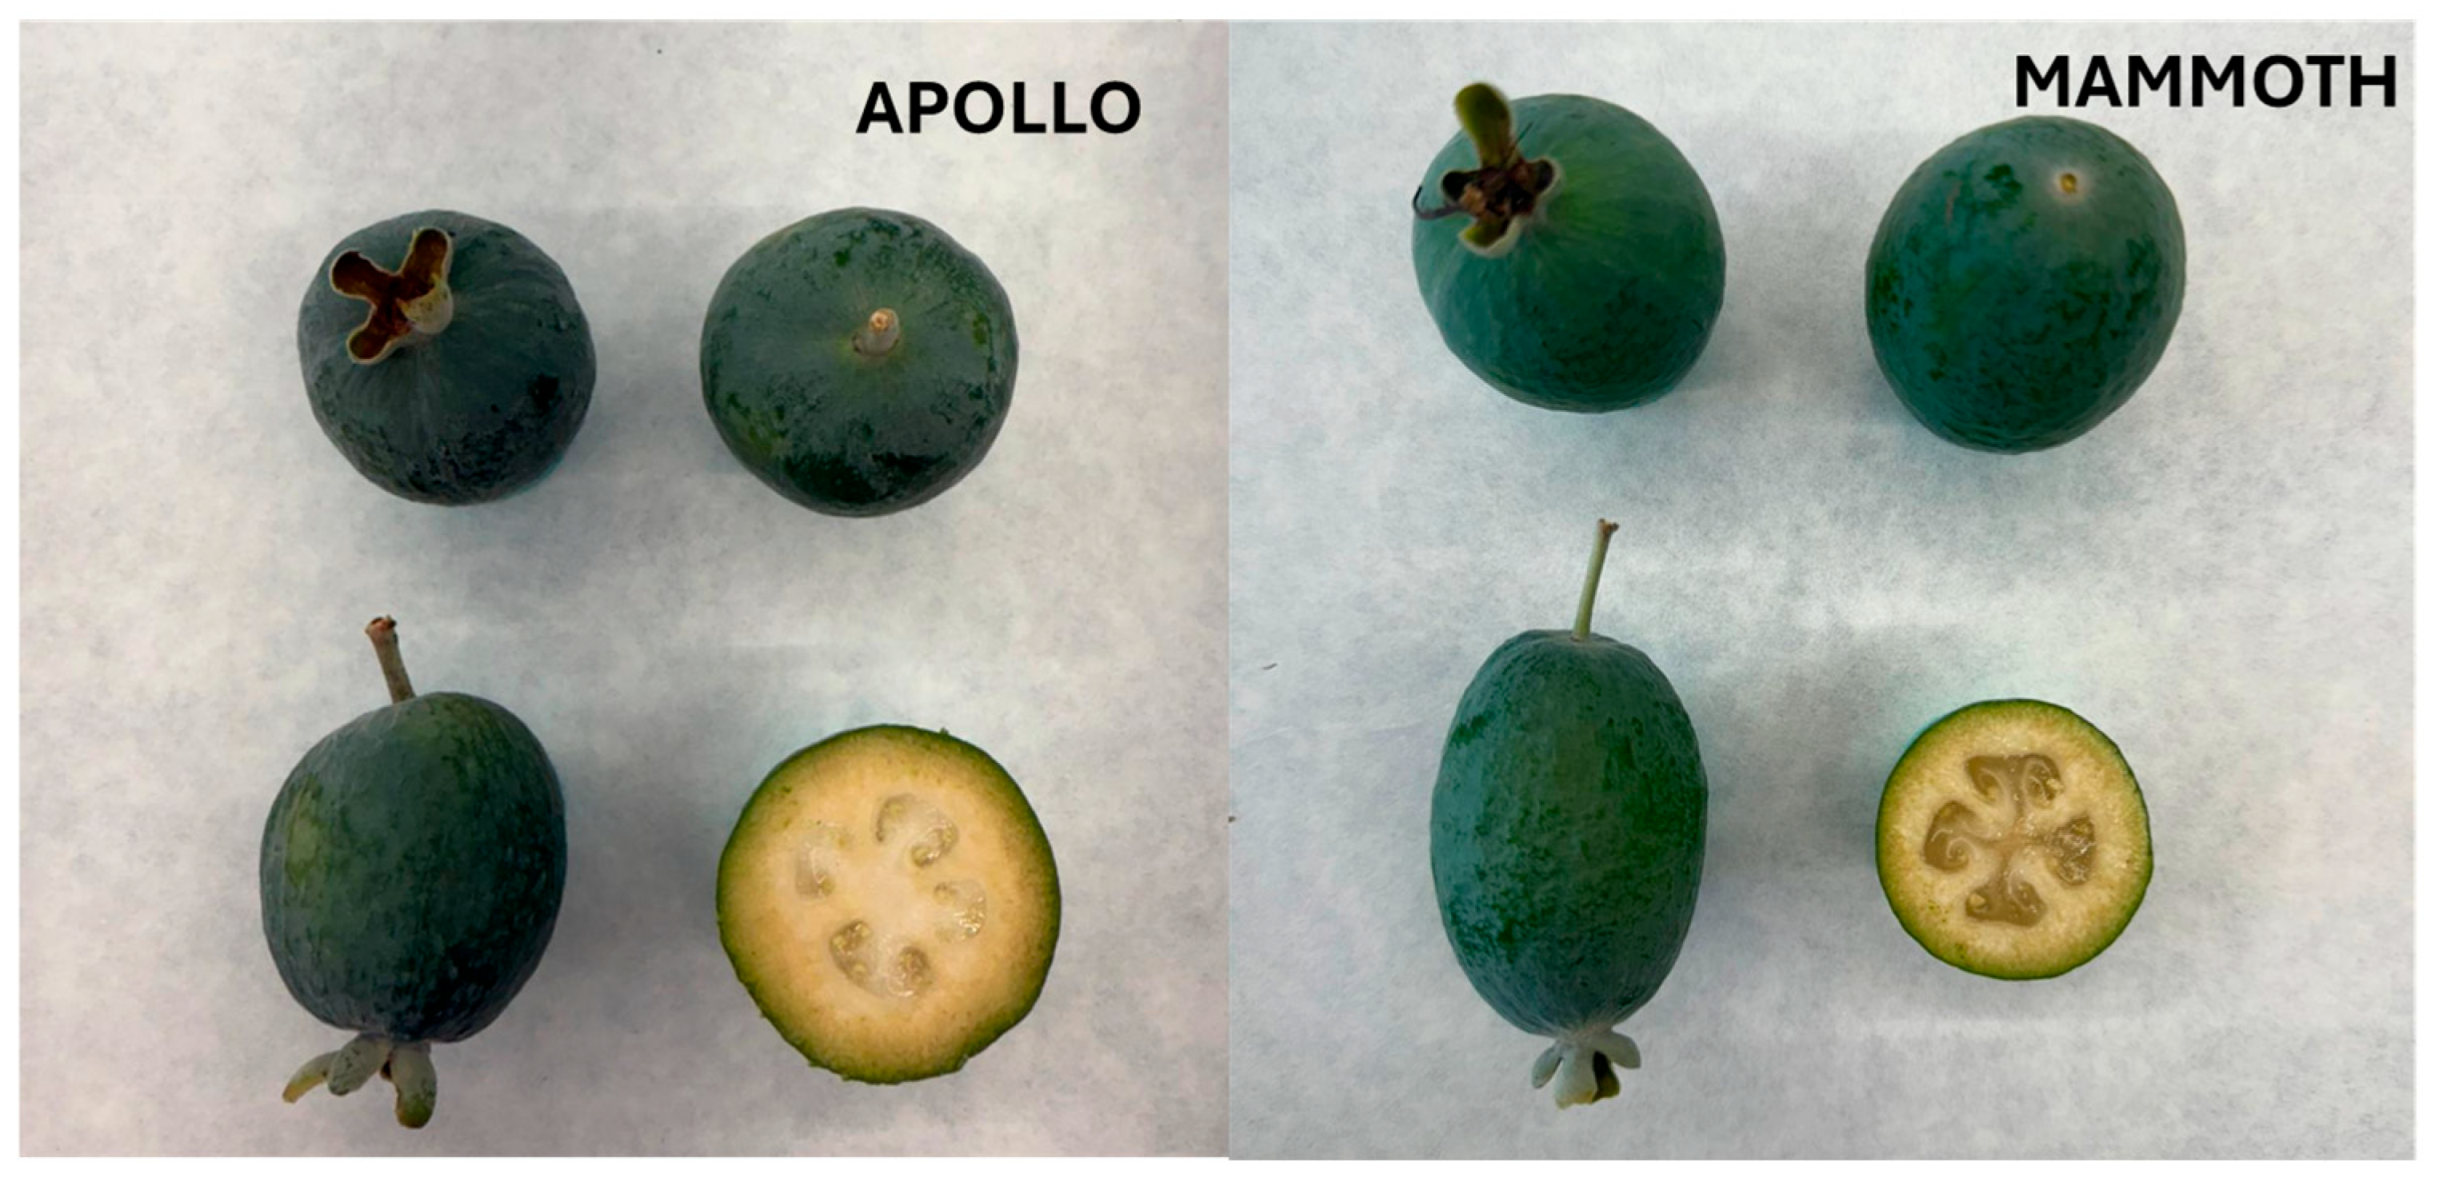
Figure 1. Phenotypic differences between the two varieties analyzed: Apollo and Mammoth.
Horticulturae 11 01305 g001
Figure 2. Total soluble solids (TSS, °Brix), titratable acidity (TA, g/L malic acid), pH, and TSS/TA ratio in fruits from the two different genotypes (‘Apollo’ and ‘Mammoth’) at two harvest times (4 and 11 November). Bars represent mean values ± standard deviation. Different lowercase letters above bars indicate statistically significant differences at p < 0.05 according to Tukey’s HSD test. NS = not significant.
Horticulturae 11 01305 g002
Figure 3. Sum of individual phenolic compounds, evaluated by UHPLC Q-Orbitrap HRMS data in peel and pulp of two genotypes (‘Apollo’ and ‘Mammoth’) harvested at two different times (4 and 11 November). Results are expressed as µg/g dw. Different lowercase letters above the bars indicate statistically significant differences between samples at p < 0.05 according to Tukey’s Honest Significant Difference (HSD) test.
Horticulturae 11 01305 g003
Figure 4. Vitamin C content (mg/100 g dw) in peel and pulp of two genotypes (‘Apollo’ and ’Mammoth) harvested at two different times (4 and 11 November). Bars represent mean values ± standard deviation. Different lowercase letters above the bars indicate statistically significant differences between samples at p < 0.05 according to Tukey’s Honest Significant Difference (HSD) test.
Horticulturae 11 01305 g004
Figure 5. Iodine content (µg/100 g dw) in peel and pulp of two genotypes (‘Apollo’ and ‘Mammoth’) harvested at two different times (4 and 11 November). Bars represent mean values ± standard deviation. Different lowercase letters above the bars indicate statistically significant differences between samples at p < 0.05, according to Tukey’s Honest Significant Difference (HSD) test.
Horticulturae 11 01305 g005
Figure 6. Heatmap showing the average concentrations of phenolic compounds, antioxidant markers (FRAP, ABTS, DPPH and sum of phenolic compounds), and iodine content and Vitamin C content across peel and pulp samples from two feijoa cultivars (Mammoth and Apollo) harvested at different times (04 and 11). Warmer colors (red) indicate higher concentrations, while cooler tones (blue) reflect lower levels.
Horticulturae 11 01305 g006
Table 1. Mean values ± standard error of fruit weight, polar diameter, equatorial diameter, and firmness for the two different genotypes (‘Apollo’ and ‘Mammoth’) and harvest times (4 and 11 November).
Fruit Weight (g)Polar Diameter (mm)Equatorial Diameter (mm)Firmness
(kg × 0.5 cm−2)
Apollo 04105.64 ± 12.46 a60.36 ± 2.95 b56.68 ± 2.77 a8.02 ± 3.36 a
Apollo 1180.63 ± 13.03 b54.60 ± 3.88 c51.28 ± 2.79 ab6.29 ± 2.55 b
Mammoth 0473.67 ± 8.49 b64.52 ± 4.40 a47.98 ± 2.05 b3.95 ± 2.27 c
Mammoth 1153.46 ± 6.28 c59.41 ± 3.57 b37.96 ± 10.04 c2.50 ± 1.94 d
Significance************
Means within each column followed by different letters are significantly different at p < 0.05 according to Tukey’s Honest Significant Difference (HSD) test. Asterisks denote statistically significant differences between the two genotypes and the two harvest times: *** = p < 0.001.
Table 2. Mean values ± standard error of CIELAB color parameters (L*, a*, b*) for the two different genotypes (‘Apollo’ and ‘Mammoth’) and harvest times (4 and 11 November).
L*a*b*
Apollo 0443.92 ± 7.5 b−30.25 ± 14.7932.14 ± 7.39 b
Apollo 1147.21 ± 3.5 ab−25.89 ± 15.6037.72 ± 4.39 a
Mammut 0450.08 ± 0.5 a−32.13 ± 13.0137.91 ± 1.39 a
Mammut 1149.99 ± 1.5 a31.19 ± 11.2140.62 ± 3.39 a
Significance***ns***
Means within each column followed by different letters are significantly different at p < 0.05 according to Tukey’s Honest Significant Difference (HSD) test. Asterisks denote statistically significant differences between the two genotypes and the two harvest times: ns = not significant; *** = p < 0.001.
Table 3. Content of phenolic compounds (µg/g) in the different samples analyzed. Values are expressed as mean ± standard deviation. Quali-quantitative analysis of polyphenolic compounds was performed using UHPLC Q-Orbitrap HRMS.
Mammoth Peel 04Mammoth Pulp 04Mammoth Peel 11Mammoth Pulp 11Apollo Peel 04Apollo Pulp 04Apollo Peel 11Apollo Pulp 11Significance
quinic acid8.28 ± 0.29 ba8.16 ± 0.89 c6.38 ± 1.54 c7.99 ± 0.69 c11.93 ± 2.07 a14.75 ± 4.07 a11.63 ± 0.82 ab14.03 ± 1.28 a***
chlorogenic acid0.78 ± 0.05 a0.59 ± 0.05 bc0.68 ± 0.08 abc0.53 ± 0.12 cd0.71 ± 0.15 ab0.52 ± 0.14 cd0.57 ± 0.09 bcd0.39 ± 0.05 d***
caffeic acid2.42 ± 0.61 c0.23 ± 0.12 d4.85 ± 0.62 b0.47 ± 0.28 d6.05 ± 2.30 b0.12 ± 0.05 d10.64 ± 1.50 a0.19 ± 0.06 d***
catechin194.64 ± 15.69 b135.39 ± 39.53 c147.62 ± 7.90 c92.7 ± 4.67 d344.58 ±9.03 a101.48 ±3.82 d332.99 ± 17.73 a152.71 ±15.34 c***
epicatechin39.41 ± 5.1 a5.4 ± 1.1 d25.0 ± 1.6 c3.4± 0.2 d34.± 2.9 b3.3 ± 0.8 d32.8 ± 3.2 b4.7 ± 0.3 d***
syringic acid3.97 ± 1.12 b7.35 ± 1.00 ab6.42 ± 1.84 ab7.60 ± 2.35 ab5.85 ± 2.54 ab8.59 ± 2.88 a5.32 ± 3.25 ab8.13 ± 0.70 a*
p-coumaric acid0.25 ± 0.03 cd0.28 ± 0.07 cd0.56 ± 0.17 b0.20 ± 0.05 d0.42 ± 0.05 bc0.21 ± 0.04 d0.82 ± 0.20 a0.21 ± 0.06 d***
ellagic acid39.69 ± 5.00 a6.03 ± 3.54 b42.35 ± 8.35 a9.07 ± 0.57 b9.54 ± 1.46 b2.88 ± 0.10 b9.22 ± 0.97 b2.75 ± 0.25 b***
rutin hydrate0.06 ± 0.04 a0.03 ± 0.02 ab0.05 ± 0.03 a0.04 ± 0.03 ab0.02 ± 0.01 ab0.01 ± 0.01 b0.02 ± 0.00 ab0.04 ± 0.03 ab**
quercetin 3b glucoside21.13 ± 4.44 bc2.63 ± 0.30 d17.86 ± 2.84 c2.13 ± 0.56 d22.40 ± 1.16 ab1.89 ± 0.07 d25.14 ± 2.06 a2.11 ± 0.08 d***
ferulic acid4.50 ± 0.70 bc3.51 ± 1.18 bc4.12 ± 2.21 bc3.21 ± 1.02 bc2.99 ± 2.17 bc7.68 ± 0.81 a2.02 ± 0.75 c5.18 ± 1.89 ab***
kaempferolo 3 O glucoside1.60 ± 0.21 b1.13 ± 0.67 bc1.29 ± 0.33 b0.65 ± 0.13 c3.30 ± 0.38 a1.47 ± 0.27 b3.60 ± 0.26 a1.21 ± 0.27 bc***
luteolin 7 glucoside3.63 ± 0.21 b3.02 ± 0.84 bc3.05 ± 0.78 bc2.37 ± 0.20 c5.94 ± 0.42 a3.48 ± 0.29 b6.35 ± 0.34 a3.08 ± 0.33 bc***
isorhamntenin 3 rutinoside0.39 ± 0.12 a0.10 ± 0.10 b0.44 ± 0.16 a0.09 ± 0.05 b0.47 ± 0.13 a0.15 ± 0.07 b0.46 ± 0.09 a0.07 ± 0.03 b***
quercetin0.50 ± 0.55 c0.00 ± 0.00 c1.33 ± 0.52 b0.00 ± 0.00 c1.67 ± 0.52 b0.00 ± 0.00 c3.33 ± 0.52 a0.00 ± 0.00 c***
naringin0.05 ± 0.02 ab0.00 ± 0.00 d0.03 ± 0.01 bc0.00 ± 0.00 d0.03 ± 0.01 c0.00 ± 0.00 d0.06 ± 0.02 a0.00 ± 0.00 d***
luteolin0.09 ± 0.03 a0.03 ± 0.01 ab0.05 ± 0.01 b0.02 ± 0.01 ab0.01 ± 0.01 c0.02 ± 0.01 ab0.03 ± 0.01 ab0.02 ± 0.02 ab***
myricetin0.19 ± 0.12 a0.11 ± 0.10 ab0.07 ± 0.04 ab0.10 ± 0.06 ab0.03 ± 0.01 b0.04 ± 0.02 b0.05 ± 0.03 b0.08 ± 0.05 ab***
daidzein0.23 ± 0.03 a0.01 ± 0.00 b0.23 ± 0.07 a0.01 ± 0.00 b0.23 ± 0.06 a0.00 ± 0.00 b0.22 ± 0.05 a0.01 ± 0.00 b*
kaempferol0.09 ± 0.03 a0.02 ± 0.01 ab0.04 ± 0.01 b0.02 ± 0.01 ab0.01 ± 0.01 c0.02 ± 0.01 ab0.03 ± 0.01 ab0.02 ± 0.02 ab***
naringenin0.12 ± 0.02 a0.01 ± 0.00 b0.13 ± 0.10 a0.01 ± 0.01 b0.02 ± 0.02 b0.01 ± 0.01 b0.04 ± 0.02 b0.01 ± 0.00 b***
Different lowercase letters within the same row indicate statistically significant differences between samples (p < 0.05) according to Tukey’s Honest Significant Difference (HSD) test. Significance levels are indicated as follows: *** p < 0.001; ** p < 0.01; * p < 0.05.
Table 4. Antioxidant activity measured by ABTS, DPPH, and FRAP assays in peel and pulp of two genotypes (‘Apollo’ and ‘Mammoth’) harvested at two different times (4 and 11). Results are expressed as mmol Trolox per kg of dry weight (mmol Trolox/kg DW) and shown as mean ± standard deviation.
ABTSDPPHFRAP
mmol Trolox/Kg
Mammoth peel 4339.86 ± 6.75 a239.35 ± 32.64 a662.70 ± 27.66 a
Mammoth pulp 457.45 ± 20.44 c44.15 ± 14.37 c106.51 ± 18.89 d
Mammoth peel 11357.55 ± 41.42 a242.22 ± 30.56 a643.75 ± 75.03 a
Mammoth pulp 1180.71 ± 5.88 c64.56 ± 4.71 c141.03 ± 8.45 d
Apollo peel 4212.41 ± 21.03 b122.80 ± 9.61 b475.44 ± 21.13 c
Apollo pulp 439.17 ± 1.23 c30.70 ± 3.21 c86.06 ± 0.27 d
Apollo peel 11233.05 ± 49.43 b118.46 ± 28.03 b544.31 ± 38.51 b
Apollo pulp 1149.53 ± 7.53 c34.38 ± 2.52 c91.93 ± 6.69 d
Significance*********
Different lowercase letters within the same row indicate statistically significant differences between samples (p < 0.05) according to Tukey’s Honest Significant Difference (HSD) test. Significance levels are indicated as follows: *** p < 0.001.
Disclaimer/Publisher’s Note: The statements, opinions and data contained in all publications are solely those of the individual author(s) and contributor(s) and not of MDPI and/or the editor(s). MDPI and/or the editor(s) disclaim responsibility for any injury to people or property resulting from any ideas, methods, instructions or products referred to in the content.