Abstract
Glucosinolates are important plant secondary metabolites that are involved in plant defense responses and have beneficial effects on human life and health. Watercress (Nasturtium officinale R. Br.) is an aquatic vegetable rich in glucosinolates. This study utilized ultra-high-performance liquid chromatography–electrospray ionization–tandem mass spectrometry (UHPLC-ESI-MS/MS) to compare and analyze four watercress samples from different origins. A total of 35 glucosinolates were identified, including 33 differential glucosinolates, and their relative content in different samples was determined. Differential metabolite screening revealed significant differences in the watercress from Guangdong, China (GD), compared with other samples. It contained two specific glucosinolates: 2(R)-Hydroxy-2-Phenylethyl glucosinolate and 4-Benzoyloxybutyl glucosinolate. The watercress from the United States of America (MG) had the highest total glucosinolate content. Genes involved in glucosinolate biosynthesis, such as NoCYP83A1 and NoSUR1, were also expressed differently in the four samples. This study provides a reference for further investigation of glucosinolate metabolites in the four watercress samples and the utilization of glucosinolates in watercress.
1. Introduction
Glucosinolates (GSLs) are sulfur-rich secondary metabolites that accumulate mainly in Brassicaceae. According to different side-chain groups, GSLs can be divided into aliphatic, benzenic, and indolic groups [1]. GSLs can alleviate obesity, insulin resistance, and nonalcoholic fatty liver disease [2]. GSL hydrolysates achieve an anti-cancer effect in the human body by protecting against reactive oxygen species, inducing phase II enzymes to change detoxification, inhibiting phase I enzymes, and reducing carcinogen activation [3,4,5,6,7]. In addition, glucoside-derived antimicrobial isothiocyanate can inhibit pathogenic bacteria and fungi in some plants and foods [8,9]. GSLs can also affect the taste of plants, such as moringa wood, and cause a pronounced pungent taste [10]. Studies have shown that some GSLs could be involved in plant responses to abiotic stress [11,12]. Nearly all genes responsible for GSL biosynthesis have been identified. BCAT4, MAM1, and MAM3 are involved in the side-chain elongation of amino acids; GSTF9, SUR1, CYP83B1, and CYP83A1 are involved in the formation of the core GSL structure [13]. GSLs have been studied in broccoli [14], curly kale [15], Chinese cabbage [16], and other crops. However, there are few reports on the metabonomic analysis of GSLs in watercress.
Watercress (Nasturtium officinale R. Br.), a member of the Brassicaceae family, is a perennial aquatic herb that can be eaten raw or used medicinally [17]. Recent studies have shown that the extract of watercress has significant toxicity to cervical cancer cells, has a significant anti-oral-cancer effect, and is beneficial for anti-hyperlipidemia [18,19,20]. These studies reveal the health benefits of watercress in the diet. Voutsina et al. presented the first fully annotated transcriptome of watercress and analyzed the differences between high- and low-glucosinolate samples [21]. Jeon et al. analyzed the metabolome of different organs of watercress and identified eight kinds of glucosinolates, revealing the different accumulation patterns of indole glucosinolates and aliphatic glucosinolates [22]. Liang et al. identified 10 glucosinolates in watercress using HILIC−MS/MS [23]. Kyriakou et al. showed that the glucosinolate content was highest in the flowers of watercress, followed by the leaves and stems [24].
There have been many reports on methods of analyzing glucosinolates in plants. Measurement of enzymatically released glucose has been used to determine the total glucosinolate content [25,26,27]. Theunis et al. expanded the background of analytical methods to identify glucosinolates in watercress [28]. Ultra-high-performance liquid chromatography (UHPLC) is now widely used in compositional analysis, including UHPLC-PDA-ESI-MS [29], UHPLC-Triple-TOF-MS [30], and UHPLC-Q-exactive orbitrap-MS [31]. We used UHPLC-ESI-MS/MS-based, widely targeted metabolomics to determine GSLs in four watercress samples (MG, YD, WH, and GD).
Watercress is an important vegetable crop in the Brassicaceae family. Glucosinolates are crucial for human health. This study analyzed glucosinolate metabolites in watercress samples from different origins to identify the differences in glucosinolates between them and to provide a reference for their utilization.
2. Materials and Methods
2.1. Plant Material
The four watercress samples came from four different origins. MG was provided by Seed Needs Company (Seed Needs LLC, New Haven, CT, United States of America) (https://www.myseedneeds.com/, (accessed on 13 May 2021)); YD was provided by Yangzhou University, Yangzhou, China; GD was provided by Guangdong Academy of Agricultural Sciences, Guangdong, China; and WH was provided by Wuhan Academy of Agricultural Sciences, Wuhan, China. Cuttings of experimental materials were grown in the artificial climate chamber of Nanjing Agricultural University (16 h light/8 h dark photoperiod at 22 °C/18 °C). Forty days after planting cuttings in pots containing a mixture of soil/sand (3:1), leaf tissue was taken and stored in liquid nitrogen. All the leaves were collected from three watercress plants per sample, with each plant serving as one replicate for metabolomic analysis. For the GSL content determination, the leaves of ten watercress plants per sample were mixed and collected as three replicates.
2.2. Determination of Total GSL Content
The quantification of total glucosinolate was slightly modified according to Tian’s method [27]. A 0.05 g freeze-dried sample was weighed, crushed, and mixed with 3 mL deionized water; it was then incubated at 37 °C for 30 min so that the GSL was completely hydrolyzed to glucose under the action of endogenous myrosinase. Another 0.05 g freeze-dried sample was crushed and added to 3 mL 40% acidized methanol (0.5% acetic acid modulation) in an 80 °C bath for 5 min to inhibit myrosinase, as a control. Then, 2 mL 100% methanol and 2–3 mg activated carbon were added to each sample to terminate the reaction and precipitate polyphenol. After centrifugation for 10 min at 10,000× g under 4 °C, the supernatant was collected and the glucose content was determined using a glucose kit (Nanjing Jiancheng Bioengineering Institute, Nanjing, China). The amount of GSL substance is the amount of glucose produced by its hydrolysis.
Total glucosinolate (μmol·g−1):
A (μmol·mL−1): glucose concentration; V (mL): volume of the extract; m (g): mass of the sample.
2.3. Quantitative Real-Time PCR (qRT-PCR) Analysis
Total RNA from the watercress was extracted using a RNA Extraction Kit (ACCURATE BIOTECHNOLOGY, Changsha, China). cDNA was obtained using a RT Mix Kit with gDNA Clean for qPCR Ver.2 (ACCURATE BIOTECHNOLOGY, Changsha, China).
According to the genome data of watercress, the qRT-PCR primers in this study were designed using the Primer-BLAST tool (https://www.ncbi.nlm.nih.gov/tools/primer-blast/, (accessed on 15 March 2023)) and are recorded in Table S1. NoActin served as the reference gene. qRT-PCR reactions were conducted using a CFX96 System (Bio-Rad, Hercules, CA, USA), with 95 °C for 2 min, followed by 40 cycles of 95 °C for 10 s, and 60 °C for 30 s. Data analysis was performed using the 2−∆∆CT method [32].
2.4. Sample Preparation and Extraction for Metabolome Determination
Freeze-dried samples were ground, and 100 mg of the resulting powder was extracted with 1.2 mL of 70% aqueous methanol at 4 °C overnight. After centrifugation at 12,000 rpm for 10 min, the extract was filtered (SCAA-104, 0.22 μm aperture; ANPEL, Shanghai, China, http://www.anpel.com.cn/, (accessed on 13 May 2021)) before UPLC-MS/MS analysis.
2.5. Conditions for UPLC and ESI-Q TRAP-MS/MS
The sample extracts were analyzed using a UPLC-ESI-MS/MS system (UPLC, SHIMADZU Nexera X2, http://www.shimadzu.com.cn/, (accessed on 13 May 2021); MS, Applied Biosystems 4500 Q TRAP).
UPLC analysis was performed using an Agilent SB-C18 column (1.8 µm, 2.1 mm × 100 mm). The mobile phase comprised solvent A (pure water with 0.1% formic acid) and solvent B (acetonitrile with 0.1% formic acid). The elution gradient was 5% B-phase at 0.00 min, increasing linearly to 95% within 9.00 min, holding at 95% for 1 min, then decreasing to 5% from 10.00 to 11.10 min and equilibrating at 5% until 14 min. The column oven was maintained at 40 °C, with a flow rate of 0.35 mL/min and an injection volume of 4 μL.
The effluent was connected to an ESI–triple quadrupole–linear ion trap (QTRAP)–MS LIT, and the triple quadrupole–linear ion trap mass spectrometer was used for triple quadrupole (QQQ) scanning. The mass spectrum operating conditions included a turbo spray ion source with electrospray ionization (ESI) at 550 °C. The ion spray voltage was set to 5500 V for the positive ion mode and 4500 V for the negative ion mode. The ion source gases I (GSI), II (GSII), and curtain gas (CUR) were set to 50, 60, and 25 psi, respectively. The collision-activated dissociation (CAD) parameter was set to high. Instrument tuning and mass calibration were conducted using a 10 μmol/L polypropylene glycol solution in QQQ mode and a 100 μmol/L polypropylene glycol solution in LIT mode. In the multiple reaction monitoring (MRM) experiment, the declustering potential (DP) and collision energy (CE) for each MRM transition were optimized [33].
2.6. Qualitative and Quantitative Determination of Metabolites
The qualitative analysis of the substance was carried out by comparing the retention time (RT) and the fragmentation patterns displayed by the secondary mass spectrometry, based on the self-built database MWDB (Metware Biotechnology Co., Ltd., Wuhan, China). Isotopic and repeated signals, including those with NH4+, K+, and Na+ ions, were excluded during analysis. The quantitative analysis of metabolites was completed by using multiple reaction monitoring (MRM) of the triple quadrupole rod. After acquiring mass spectrum analysis data of metabolites from various samples, the peak areas of all mass spectrum peaks were integrated. The mass spectral peaks corresponding to the same metabolite in different samples were then integrated and corrected, with each chromatographic peak’s area representing the relative content of the corresponding substance [34].
2.7. Statistical Data Analysis
2.7.1. Principal Component Analysis (PCA)
Principal component analysis (PCA) reveals the internal structure of multiple variables through several principal components [35]. Principal component analysis was conducted using the ‘prcomp’ function in R (http://www.r-project.org, (accessed on 10 June 2021)).
2.7.2. Orthogonal Projections to Latent Structures–Discriminant Analysis (OPLS-DA)
Orthogonal projections to latent structures–discriminant analysis (OPLS-DA) [36], a method combining partial least squares discriminant analysis (PLS-DA) and orthogonal signal correction (OSC), was employed to enhance the screening of differential variables. We used the OPLS-DA model to analyze the metabolome data of six combinations: MG versus WH, MG versus GD, GD versus YD, WH versus GD, WH versus YD, and MG versus YD. To validate the OPLS-DA model’s accuracy, we performed 200 random permutation and combination tests on the data. In the experiment, R2X and R2Y denote the interpretation rates of the X and Y matrices of the constructed model, respectively, while Q2 indicates the model’s predictive capability. The OPLS-DA analysis was conducted using the MetaboAnalystR (version 1.0.1) package in R.
2.7.3. Differential Metabolite Screening
Combining univariate and multivariate analyses enables us to screen for differential GSL metabolites. Based on the OPLS-DA results, the variable importance in projection (VIP) from the multivariate analysis can preliminarily identify metabolites that vary among different varieties or tissues. Combining this with a fold change of univariate analysis (VIP ≥ 1 and absolute Log2FC (fold change) ≥ 1) allows for further screening of differential metabolites.
2.7.4. Cluster Analysis
Cluster analysis is a multivariate statistical analysis method that makes it possible to classify individuals, objects, or subjects according to their characteristics. The metabolite content data were normalized with unit variance scaling (UV), and a hierarchical cluster heatmap was drawn with the R package pheatmap (version 1.0.12). We standardized and centralized the relative content of differential metabolites to perform K-means clustering analysis.
3. Results
3.1. Qualitative and Quantitative Analysis of Samples
The metabolites in the samples were analyzed qualitatively and quantitatively using mass spectrometry based on the local metabolic database. The quality control (QC) sample was a mixture of sample extracts. Figure 1A displays the total ions current (TIC) diagram of the mixed QC sample, which depicts the continuous spectrum obtained by adding the intensities of all ions in the mass spectrum at each time point. Figure 1B is a multi-peak map under MRM mode, and each differently colored mass spectral peak represents one of the detected metabolites. A total of 35 GSLs were identified in watercress, of which 23 GSLs were found in all four samples, while 2 GSLs only existed in GD (Figure 2, Table S2). We performed unit variance scaling (UV) normalization for glucosinolate metabolites and plotted a hierarchical cluster heatmap to classify 35 GSLs based on similar characteristics. As shown in Figure S1, GSL metabolites with similar characteristics were clustered together. The TIC maps of different QC samples were overlapped for analysis (Figure S2). The results showed that the TIC maps were highly coincident, indicating that the instrument had good stability and ensuring the reliability of the data.
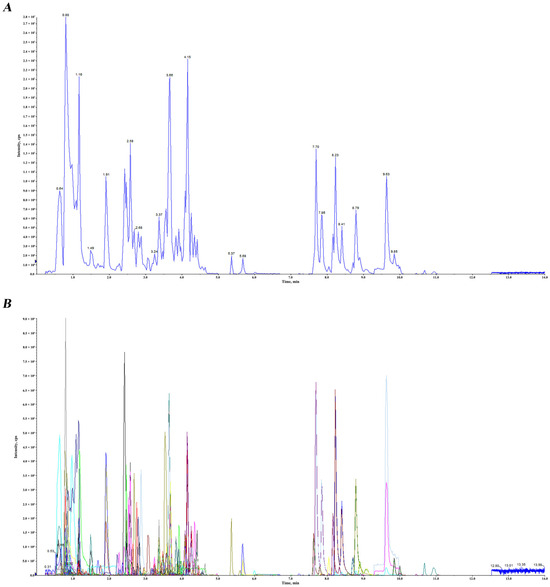
Figure 1.
TIC diagram and multi-peak map under MRM mode. (A) Total ion current (TIC) diagram of mixed quality control samples. (B) Multi-peak detection plot of metabolites under multiple reaction monitoring (MRM) mode. The abscissa is the retention time (Rt) of metabolites; the ordinate is the ion current intensity of ion detection (cps).
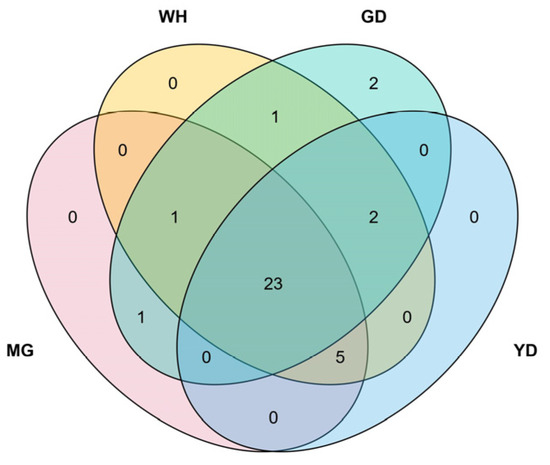
Figure 2.
Venn diagram of the overlap and differences in GSL metabolites between different groups.
3.2. Principal Component Analysis (PCA) among Different Samples
In this study, two principal components were extracted: PC1 and PC2. PC1 represents the most prominent feature in the multidimensional data matrix, while PC2 denotes the next most significant feature, excluding PC1. The interpretation rate of the PC1 and PC2 for the dataset was 47.87% and 21.76%, respectively (Figure 3). Principal component analysis revealed clear separation among the four groups, with duplicate samples clustering closely together. This indicated significant differences in GSLs between groups, but no significant differences within groups. This showed that the experiment had good repeatability.
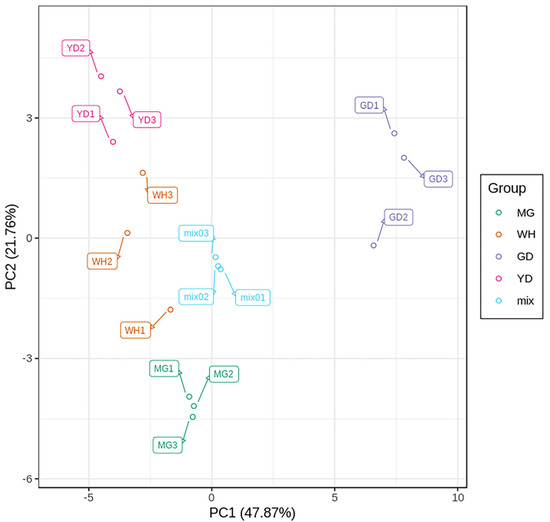
Figure 3.
PCA score chart. PC1 and PC2 represent the first and second principal components, respectively, with the percentage indicating their interpretation rate for the dataset. Each point represents one sample. Mix: QC samples.
3.3. OPLS-DA and Differential Glucosinolate Metabolites Analysis
Figure 4 illustrates significant differences in GSL metabolites within the six combinations. In the OPLS-DA validation diagram (Figure S3), R2X and R2Y denote the interpretation rates of the model’s X and Y matrices, respectively. Q2 indicates the model’s predictive capability. The p-value of Q2 indicates the percentage of random grouping models that have better predictive ability than this OPLS-DA model out of the total number of models, and the p-value for R2Y represents the percentage of the total number of models for which the randomization model explains the Y matrix better than this OPLS-DA model. Q2, R2X, and R2Y values were near 1, and p < 0.05, demonstrating the model’s stability, reliability, and strong predictive and interpretive capabilities.
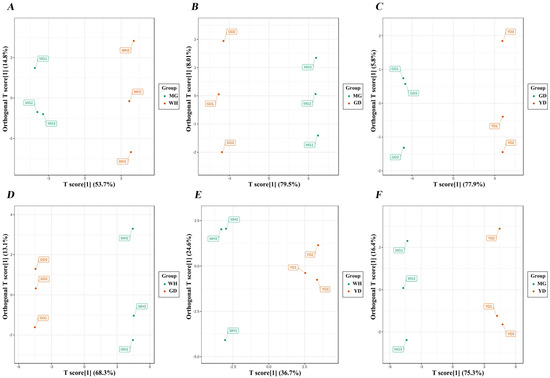
Figure 4.
OPLS-DA score plot. (A) MG versus WH, (B) MG versus GD, (C) GD versus YD, (D) WH versus GD, (E) WH versus YD, (F) MG versus YD. The abscissa represents the predicted principal components, indicating the gap between groups. The ordinate represents the orthogonal principal components, and the direction of the ordinate shows the disparity within the group. The percentages indicate how well that component explains the dataset. Each point in the graph represents one sample.
A total of 33 differential GSL metabolites were screened (Table S3), normalized by unit variance scaling (UV), and a hierarchical cluster heatmap was drawn. As a result, 20 different GSL metabolites were identified between GD and YD (12 up-regulated, 8 down-regulated); 21 between MG and GD (14 up-regulated, 7 down-regulated); 13 between MG and WH (12 up-regulated, 1 down-regulated); 17 between MG and YD (15 up-regulated, 2 down-regulated); 18 between WH and GD (8 up-regulated, 10 down-regulated); and 2 between WH and YD, both of which were up-regulated GSL metabolites (Figure 5; Table S4). Figure S4 presents a bar chart of metabolites with the top 20 FC values in each group, which allows one to more intuitively understand the content differences in GSL metabolites between the samples. As shown in the Venn diagram (Figure 6), the differences in GSL metabolites between the comparison groups had overlapping and independent parts, the three comparison groups containing GD had 13 common GSLs, and the three comparison groups containing YD had no common GSLs.
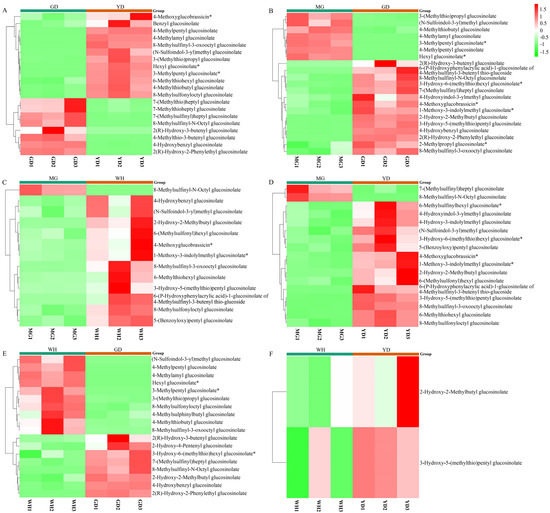
Figure 5.
Hierarchical clustering heatmap of differential GSL metabolites. (A) GD versus YD, (B) MG versus GD, (C) MG versus WH, (D) MG versus YD, (E) WH versus GD, (F) WH versus YD. The horizontal axis is the sample name, and the vertical axis shows information on the differential metabolites. Values obtained after relative content standardization are shown in different colors (the shift from red to green indicates a decrease in content). *: Indistinguishable isomers.
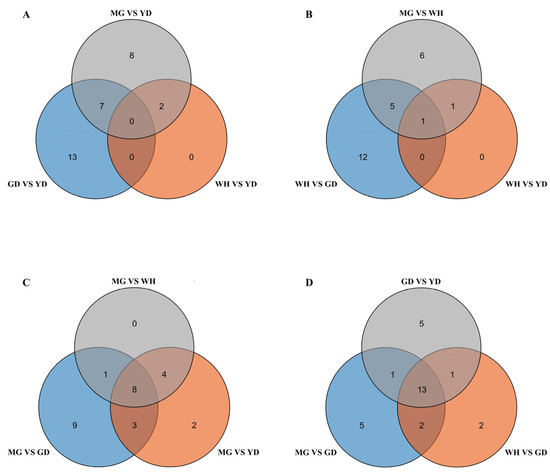
Figure 6.
Venn diagram of the overlap of and differences in GSL metabolites between (A) MG VS YD, GD VS YD and WH VS YD, (B) MG VS WH, WH VS GD and WH VS YD, (C) MG VS WH, MG VS GD and MG VS YD, (D) GD VS YD, MG VS GD and WH VS GD.
K-means cluster analysis was performed to investigate the variation trend of the relative content of differential GSL metabolites in different samples (Figure S5). The differential GSL metabolites contained in each subgroup are shown in Table S5. The results showed that GSL metabolites were divided into nine subgroups, and the variation trend of GSLs in each subgroup was different in the four watercress samples.
3.4. Determination of Total Glucosinolate Content and Expression Analysis of Genes Involved in GSL Biosynthesis
The total glucosinolate content of the four watercress samples (MG, YD, GD, and WH) was determined and was significantly different. The total glucosinolate content in MG was the highest, reaching 107.4 μmol·g−1 DW, while that of GD was the lowest, at 62.4 μmol·g−1 DW (Figure 7).
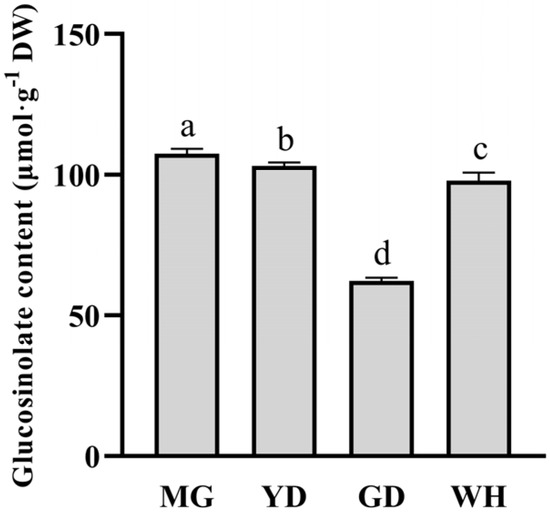
Figure 7.
Total glucosinolate content in the four watercress samples. Error bars indicate the SD of three repeated experiments. Values marked with different letters are significantly different at p < 0.05 as determined by one-way ANOVA.
The qRT-PCR results showed that GSL biosynthesis-related genes exhibited differential expression levels in the four watercress samples. NoMAM1 and NoBCAT4 were expressed significantly higher in GD compared to the other three samples. NoGSTF9, NoSUR1, NoCYP83B1, and NoCYP83A1 showed the lowest expression levels in GD. NoGSTF9 and NoSUR1 were expressed higher in MG than in the other three samples. NoCYP83B1 and NoCYP83A1 had the highest expression levels in YD and WH, respectively (Figure 8).
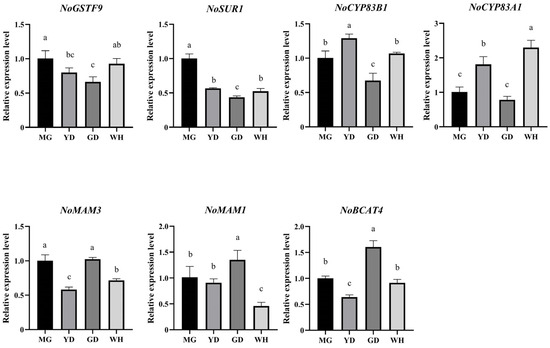
Figure 8.
Expression levels of the biosynthesis-related genes in the four watercress samples. Error bars indicate the SD of three repeated experiments. Values marked with different letters are significantly different at p < 0.05 as determined by one-way ANOVA.
4. Discussion
4.1. Glucosinolate Metabolites in the Four Watercress Samples
This study used UHPLC-ESI-MS/MS-based, widely targeted metabolomics to analyze glucosinolate metabolites in different watercress samples. Previous studies have revealed the differences in GSL metabolites in different parts of watercress using HPLC-UV, and the content of GSLs in watercress has been determined using HILIC-MS/MS [22,23], which detected 8 and 10 GSLs, respectively. However, the differences in GSL metabolites between watercress samples, especially between those from different countries and regions, have not been reported. In this study, four watercress samples from the United States, Yangzhou, China, Wuhan, China, and Guangdong, China, were used as the research objects, and 35 glucosinolates were identified by using a UHPLC-ESI-MS/MS-based, widely targeted metabolome. This study verified and supplemented the list of GSLs in watercress identified by earlier studies.
4.2. Analysis of Differential Glucosinolate Metabolites
Of the 35 glucosinolates identified, there was no significant difference in the content of 4-Methylsulfinylbutyl glucosinolate (glucoraphanin) in any of the four watercress samples. Glucoraphanin can alleviate obesity, insulin resistance, and nonalcoholic fatty liver disease [2]. The hydrolyzed product of glucoraphanin is sulforaphane, which is one of the most potent anti-cancer substances in vegetables and can also improve human sleep quality [37,38]. This suggests that all four watercress samples examined in this study have certain nutritional value and health benefits.
Differential metabolite analysis showed that the number of differential GSLs was the highest between GD and the other three watercress samples (21 between GD and MG; 20 between GD and YD; 18 between GD and WH). Compared with the other three samples, the contents of 8-Methylsulfinyl-N-Octyl glucosinolate, 7-(Methylsulfinyl)heptyl glucosinolate, 4-Hydroxybenzyl glucosinolate (sinalbin), and 2(R)-Hydroxy-3-butenyl glucosinolate in GD were up-regulated. Moreover, 4-Benzoyloxybutyl glucosinolate and 2(R)-Hydroxy-2-Phenylethyl glucosinolate (glucobarbarin) were only detected in the GD group, while the other three watercress samples did not have their own unique glucosinolates. Studies have shown that sinalbin and glucobarbarin can help improve the defense of plants against herbivorous insects [39,40]. The three comparison groups containing GD had the highest number of common differential GSL metabolites, suggesting that GD had similar differential GSLs to the other three samples. In conclusion, the composition of the GSL metabolites of GD was the most distinct among the four watercress samples.
Hierarchical cluster analysis of differential GSL metabolites showed that they were grouped in different patterns among the four watercress samples, which indicated that they had different characteristics and might be different in function.
4.3. Analysis of Total GSL Content and Expression of Genes Involved in GSL Biosynthesis
Significant differences in total GSL content were observed among the four watercress samples. MG exhibited the highest total GSL content, whereas GD had the lowest. To reveal the expression pattern of GSL biosynthesis-related genes, we analyzed the expression levels of NoGSTF9, NoSUR1, NoCYP83B1, NoCYP83A1, NoMAM3, NoMAM1, and NoBCAT4 in the four watercress samples. The results indicated that a reduced expression of NoGSTF9, NoSUR1, NoCYP83B1 and NoCYP83A1, which are involved in the core GSL structure formation, may have contributed to the lower GSL content in GD. High expression of NoGSTF9 and NoSUR1 in MG may have contributed to the higher GSL content of MG.
4.4. Effects of Environmental Conditions on GSLs in Different Samples of Watercress
Watercress is distributed throughout the world, including the Northern Hemisphere and tropical regions [41]. Of the four watercress samples examined in this study, GD was from Southern China, WH was from Central China, YD was from Eastern China, and MG was from the United States. This study revealed that there were significant differences in GSL accumulation among watercress samples from different origins, with GD’s glucosinolate metabolites notably distinct from the other three samples. The selection process carried out in different environments resulted in different genotypes for the four samples, which may be the reason for the different qualitative and quantitative representation of glucosinolates.
5. Conclusions
In this study, the differences in GSLs of four watercress samples (MG, YD, GD, WH) were evaluated using a widely targeted metabolomics method based on UHPLC-ESI-MS/MS. A total of 35 GSLs were identified, of which 33 were identified as differential metabolites. The composition of the GSL metabolites of GD is the most distinct, containing two specific GSLs: 4-Benzoyloxybutyl glucosinolate and 2(R)-Hydroxy-2-Phenylethyl glucosinolate. The content of total GSLs was significantly different between the four samples, with the highest content in MG and the lowest in GD. NoSUR1 had the highest expression level in MG among the four watercress samples. NoGSTF9, NoSUR1, NoCYP83B1, and NoCYP83A1 showed low expression in GD.
Supplementary Materials
The following supporting information can be downloaded at: https://www.mdpi.com/article/10.3390/horticulturae10090968/s1, Figure S1: Overall hierarchical clustering heatmap of metabolism; Figure S2: TIC overlap map of QC Samples; Figure S3: OPLS-DA validation diagram; Figure S4: Bar chart of differential GSL metabolites; Figure S5: K-means clustering map of differential GSL metabolites; Table S1: Primers Used in This Study; Table S2: The number of GSL metabolites; Table S3: Differential GSL metabolites; Table S4: Results of differential GSL metabolites screening; Table S5: K-means cluster GSL metabolites information.
Author Contributions
Funding acquisition, X.H.; conceptualization, X.H.; investigation, S.D. and Q.D.; data curation, S.D. and X.M.; writing—original draft, S.D.; writing—review and editing, X.H. All authors have read and agreed to the published version of the manuscript.
Funding
This research was funded by the China Agriculture Research System (CARS-23-A-16), the Key Projects of the National Key Research and Development Plan (2017YFD0101803), and the Nanjing Science and Technology project (202109022).
Data Availability Statement
The raw data supporting the conclusions of this article will be made available by the authors on request.
Conflicts of Interest
All Authors were also employed by the company Nanjing Suman Plasma Engineering Research Institute Co., Ltd. They declare that the research was conducted in the absence of any commercial or financial relationships that could be construed as a potential conflict of interest.
References
- Mitreiter, S.; Gigolashvili, T. Regulation of glucosinolate biosynthesis. J. Exp. Bot. 2020, 72, 70–91. [Google Scholar] [CrossRef]
- Xu, L.; Nagata, N.; Ota, T. Glucoraphanin: A broccoli sprout extract that ameliorates obesity-induced inflammation and insulin resistance. Adipocyte 2018, 7, 218–225. [Google Scholar] [CrossRef] [PubMed]
- Keck, A.-S.; Finley, J.W. Cruciferous Vegetables: Cancer Protective Mechanisms of Glucosinolate Hydrolysis Products and Selenium. Integr. Cancer Ther. 2004, 3, 5–12. [Google Scholar] [CrossRef] [PubMed]
- Pullar, J.M.; Thomson, S.J.; King, M.J.; Turnbull, C.I.; Midwinter, R.G.; Hampton, M.B. The chemopreventive agent phenethyl isothiocyanate sensitizes cells to Fas-mediated apoptosis. Carcinogenesis 2004, 25, 765–772. [Google Scholar] [CrossRef] [PubMed]
- Zhang, Y.S.; Talalay, P. Mechanism of differential potencies of isothiocyanates as inducers of anticarcinogenic phase 2 enzymes. Cancer Res. 1998, 58, 4632–4639. [Google Scholar]
- Plumb, G.W.; Lambert, N.; Chambers, S.J.; Wanigatunga, S.; Heaney, R.K.; Plumb, J.A.; Aruoma, O.I.; Halliwell, B.; Miller, N.J.; Williamson, G. Are Whole Extracts and Purified Glucosinolates from Cruciferous Vegetables Antioxidants? Free Radic. Res. 1996, 25, 75–86. [Google Scholar] [CrossRef]
- Chinni, S.R.; Li, Y.; Upadhyay, S.; Koppolu, P.K.; Sarkar, F.H. Indole-3-carbinol (I3C) induced cell growth inhibition, G1 cell cycle arrest and apoptosis in prostate cancer cells. Oncogene 2001, 20, 2927–2936. [Google Scholar] [CrossRef]
- Piercey, M.J.; Mazzanti, G.; Budge, S.M.; Delaquis, P.J.; Paulson, A.T.; Truelstrup Hansen, L. Antimicrobial activity of cyclodextrin entrapped allyl isothiocyanate in a model system and packaged fresh-cut onions. Food Microbiol. 2012, 30, 213–218. [Google Scholar] [CrossRef]
- Ugolini, L.; Martini, C.; Lazzeri, L.; D’Avino, L.; Mari, M. Control of postharvest grey mould (Botrytis cinerea Per.: Fr.) on strawberries by glucosinolate-derived allyl-isothiocyanate treatments. Postharvest Biol. Technol. 2014, 90, 34–39. [Google Scholar] [CrossRef]
- Chodur, G.M.; Olson, M.E.; Wade, K.L.; Stephenson, K.K.; Nouman, W.; Garima; Fahey, J.W. Wild and domesticated Moringa oleifera differ in taste, glucosinolate composition, and antioxidant potential, but not myrosinase activity or protein content. Sci. Rep. 2018, 8, 7995. [Google Scholar] [CrossRef]
- Del Carmen Martínez-Ballesta, M.; Moreno, D.A.; Carvajal, M. The Physiological Importance of Glucosinolates on Plant Response to Abiotic Stress in Brassica. Int. J. Mol. Sci. 2013, 14, 11607–11625. [Google Scholar] [CrossRef] [PubMed]
- Salehin, M.; Li, B.; Tang, M.; Katz, E.; Song, L.; Ecker, J.R.; Kliebenstein, D.J.; Estelle, M. Auxin-sensitive Aux/IAA proteins mediate drought tolerance in Arabidopsis by regulating glucosinolate levels. Nat. Commun. 2019, 10, 4021. [Google Scholar] [CrossRef] [PubMed]
- Sonderby, I.E.; Geu-Flores, F.; Halkier, B.A. Biosynthesis of glucosinolates—Gene discovery and beyond. Trends Plant Sci. 2010, 15, 283–290. [Google Scholar] [CrossRef] [PubMed]
- Mølmann, J.A.B.; Steindal, A.L.H.; Bengtsson, G.B.; Seljåsen, R.; Lea, P.; Skaret, J.; Johansen, T.J. Effects of temperature and photoperiod on sensory quality and contents of glucosinolates, flavonols and vitamin C in broccoli florets. Food Chem. 2015, 172, 47–55. [Google Scholar] [CrossRef]
- Steindal, A.L.H.; Rødven, R.; Hansen, E.; Mølmann, J. Effects of photoperiod, growth temperature and cold acclimatisation on glucosinolates, sugars and fatty acids in kale. Food Chem. 2015, 174, 44–51. [Google Scholar] [CrossRef]
- Zhou, B.; Huang, W.; Feng, X.; Liu, Q.; Ibrahim, S.A.; Liu, Y. Identification and quantification of intact glucosinolates at different vegetative growth periods in Chinese cabbage cultivars by UHPLC-Q-TOF-MS. Food Chem. 2022, 393, 133414. [Google Scholar] [CrossRef]
- Gonçalves, E.M.; Cruz, R.M.S.; Abreu, M.; Brandão, T.R.S.; Silva, C.L.M. Biochemical and colour changes of watercress (Nasturtium officinale R. Br.) during freezing and frozen storage. J. Food Eng. 2009, 93, 32–39. [Google Scholar] [CrossRef]
- Nitisha, N.; Sukirti, U.; Mahendra, R. Investigation of In Vitro Anticancer Potential and Phytochemical Screening of Nasturtium officinale. Int. J. Zool. Investig. 2024, 10, 537–544. [Google Scholar] [CrossRef]
- Nilash, A.B.; Jahanbani, J.; Jolehar, M. Effect of Nasturtium Extract on Oral Cancer. Adv. Biomed. Res. 2023, 12, 53. [Google Scholar] [CrossRef]
- Clemente, M.; Miguel, M.D.; Felipe, K.B.; Gribner, C.; Moura, P.F.; Rigoni, A.A.R.; Parisotto, E.B.; Henneberg, R.; Dias, J.D.G.; Piltz, M.T.; et al. Effect of watercress extract supplementation on lipid profile and oxidative stress markers in overweight people with physical disability: A randomized, double-blind, and placebo-controlled trial. Phytother. Res. 2021, 35, 2211–2219. [Google Scholar] [CrossRef]
- Voutsina, N.; Payne, A.C.; Hancock, R.D.; Clarkson, G.J.J.; Rothwell, S.D.; Chapman, M.A.; Taylor, G. Characterization of the watercress (Nasturtium officinale R. Br.; Brassicaceae) transcriptome using RNASeq and identification of candidate genes for important phytonutrient traits linked to human health. BMC Genom. 2016, 17, 378. [Google Scholar] [CrossRef] [PubMed]
- Jeon, J.; Bong, S.J.; Park, J.S.; Park, Y.-K.; Arasu, M.V.; Al-Dhabi, N.A.; Park, S.U. De novo transcriptome analysis and glucosinolate profiling in watercress (Nasturtium officinale R. Br.). BMC Genom. 2017, 18, 401. [Google Scholar] [CrossRef] [PubMed]
- Liang, X.; Lee, H.W.; Li, Z.F.; Lu, Y.H.; Zou, L.; Ong, C.N. Simultaneous Quantification of 22 Glucosinolates in 12 Brassicaceae Vegetables by Hydrophilic Interaction Chromatography-Tandem Mass Spectrometry. ACS Omega 2018, 3, 15546–15553. [Google Scholar] [CrossRef]
- Kyriakou, S.; Michailidou, K.; Amery, T.; Stewart, K.; Winyard, P.G.; Trafalis, D.T.; Franco, R.; Pappa, A.; Panayiotidis, M.I. Polyphenolics, glucosinolates and isothiocyanates profiling of aerial parts of Nasturtium officinale (Watercress). Front. Plant Sci. 2022, 13, 998755. [Google Scholar] [CrossRef] [PubMed]
- Hsu, F.C.; Wirtz, M.; Heppel, S.C.; Bogs, J.; Krämer, U.; Khan, M.S.; Bub, A.; Hell, R.; Rausch, T. Generation of Se-fortified broccoli as functional food: Impact of Se fertilization on S metabolism. Plant Cell Environ. 2011, 34, 192–207. [Google Scholar] [CrossRef]
- Smith, C.A.; Dacombe, C. Rapid method for determining total glucosinolates in rapeseed by measurement of enzymatically released glucose. J. Sci. Food Agric. 1987, 38, 141–150. [Google Scholar] [CrossRef]
- Tian, M.; Xu, X.Y.; Liu, Y.L.; Xie, L.; Pan, S.Y. Effect of Se treatment on glucosinolate metabolism and health-promoting compounds in the broccoli sprouts of three cultivars. Food Chem. 2016, 190, 374–380. [Google Scholar] [CrossRef]
- Theunis, M.; Naessens, T.; Peeters, L.; Brits, M.; Foubert, K.; Pieters, L. Optimization and validation of analytical RP-HPLC methods for the quantification of glucosinolates and isothiocyanates in Nasturtium officinale R. Br and Brassica oleracea. LWT 2022, 165, 113668. [Google Scholar] [CrossRef]
- Sobolewska, D.; Owczarek, A.; Olszewska, M.; Paulino, N.; Podolak, I.; Paśko, P.; Wróbel-Biedrawa, D.; Michalska, K. UHPLC-PDA-ESI-MS profile of phenolic compounds in the aerial parts of Cuphea ingrata Cham. & Schltdl. Nat. Prod. Res. 2022, 36, 3721–3725. [Google Scholar] [CrossRef]
- Li, Z.; Zheng, S.; Liu, Y.; Fang, Z.; Yang, L.; Zhuang, M.; Zhang, Y.; Lv, H.; Wang, Y.; Xu, D. Characterization of glucosinolates in 80 broccoli genotypes and different organs using UHPLC-Triple-TOF-MS method. Food Chem. 2021, 334, 127519. [Google Scholar] [CrossRef]
- Dong, M.; Tian, Z.; Ma, Y.; Yang, Z.; Ma, Z.; Wang, X.; Li, Y.; Jiang, H. Rapid screening and characterization of glucosinolates in 25 Brassicaceae tissues by UHPLC-Q-exactive orbitrap-MS. Food Chem. 2021, 365, 130493. [Google Scholar] [CrossRef] [PubMed]
- Pfaffl, M.W. A new mathematical model for relative quantification in real-time RT-PCR. Nucleic Acids Res. 2001, 29, e45. [Google Scholar] [CrossRef] [PubMed]
- Chen, W.; Gong, L.; Guo, Z.; Wang, W.; Zhang, H.; Liu, X.; Yu, S.; Xiong, L.; Luo, J. A Novel Integrated Method for Large-Scale Detection, Identification, and Quantification of Widely Targeted Metabolites: Application in the Study of Rice Metabolomics. Mol. Plant 2013, 6, 1769–1780. [Google Scholar] [CrossRef] [PubMed]
- Fraga, C.G.; Clowers, B.H.; Moore, R.J.; Zink, E.M. Signature-Discovery Approach for Sample Matching of a Nerve-Agent Precursor Using Liquid Chromatography−Mass Spectrometry, XCMS, and Chemometrics. Anal. Chem. 2010, 82, 4165–4173. [Google Scholar] [CrossRef]
- Eriksson, L.; Andersson, P.L.; Johansson, E.; Tysklind, M. Megavariate analysis of environmental QSAR data. Part I—A basic framework founded on principal component analysis (PCA), partial least squares (PLS), and statistical molecular design (SMD). Mol. Divers. 2006, 10, 169–186. [Google Scholar] [CrossRef]
- Boccard, J.; Rutledge, D.N. A consensus orthogonal partial least squares discriminant analysis (OPLS-DA) strategy for multiblock Omics data fusion. Anal. Chim. Acta 2013, 769, 30–39. [Google Scholar] [CrossRef]
- Kikuchi, M.; Aoki, Y.; Kishimoto, N.; Masuda, Y.; Suzuki, N.; Takashimizu, S.; Yoshida, K.; Aizawa, K.; Suganuma, H.; Nishizaki, Y. Effects of glucoraphanin-rich broccoli sprout extracts on sleep quality in healthy adults: An exploratory study. J. Funct. Foods 2021, 84, 104574. [Google Scholar] [CrossRef]
- Zhang, Y.; Talalay, P.; Cho, C.G.; Posner, G.H. A major inducer of anticarcinogenic protective enzymes from broccoli: Isolation and elucidation of structure. Proc. Natl. Acad. Sci. USA 1992, 89, 2399–2403. [Google Scholar] [CrossRef]
- Bodnaryk, R.P. Developmental profile of sinalbin (p-hydroxybenzyl glucosinolate) in mustard seedlings, Sinapis alba L., and its relationship to insect resistance. J. Chem. Ecol. 1991, 17, 1543–1556. [Google Scholar] [CrossRef]
- Müller, C.; Schulz, M.; Pagnotta, E.; Ugolini, L.; Yang, T.; Matthes, A.; Lazzeri, L.; Agerbirk, N. The Role of the Glucosinolate-Myrosinase System in Mediating Greater Resistance of Barbarea verna than B. vulgaris to Mamestra brassicae Larvae. J. Chem. Ecol. 2018, 44, 1190–1205. [Google Scholar] [CrossRef]
- Blüthner, W.-D. Nasturtium officinale R. Br.: Watercress. In Medicinal, Aromatic and Stimulant Plants; Novak, J., Blüthner, W.-D., Eds.; Springer International Publishing: Cham, Switzerland, 2020; pp. 333–344. [Google Scholar]
Disclaimer/Publisher’s Note: The statements, opinions and data contained in all publications are solely those of the individual author(s) and contributor(s) and not of MDPI and/or the editor(s). MDPI and/or the editor(s) disclaim responsibility for any injury to people or property resulting from any ideas, methods, instructions or products referred to in the content. |
© 2024 by the authors. Licensee MDPI, Basel, Switzerland. This article is an open access article distributed under the terms and conditions of the Creative Commons Attribution (CC BY) license (https://creativecommons.org/licenses/by/4.0/).