Article

Phenolic Compounds in Different Stages of Ontogenesis in Chrysanthemum—A Potential for Thrips-Resistance Characterisation

by
Sina Alexandra Rogge
1,
Susanne Neugart
2,
Monika Schreiner
3 and
Rainer Meyhöfer
1,*
1
Phytomedicine/Applied Entomology, Institute of Horticulture and Production Systems, Gottfried Wilhelm Leibniz University Hannover, Herrenhäuser Str. 2, 30419 Hannover, Germany
2
Division Quality and Sensory of Plant Products, Georg-August Universität Göttingen, 37075 Göttingen, Germany
3
Department of Plant Quality and Food Security, Leibniz Institute of Vegetable and Ornamental Crops e.V., 14979 Grossbeeren, Germany
*
Author to whom correspondence should be addressed.
Horticulturae 2024, 10(8), 822; https://doi.org/10.3390/horticulturae10080822
Submission received: 20 June 2024 / Revised: 17 July 2024 / Accepted: 27 July 2024 / Published: 3 August 2024

Abstract

:
A number of studies have indicated the potential role of secondary metabolites, referred to as ‘resistance factors’, in plant defence against insect pests. Nevertheless, it remains unclear which metabolites serve as predictors of resistance in chrysanthemum cultivars against thrips. In the present study, the phenolic compounds of chrysanthemum leaves at different ontogenetic stages were analysed using high-performance liquid chromatography (HPLC). Furthermore, the relative epidermal flavonol contents in the leaves were quantified using the Dualex® Scientific 4 sensor, and the suitability of this non-destructive method for the rapid discrimination of resistance levels was evaluated. The results demonstrated that the most notable discrepancies in phenolic metabolite profiles were observed in the older leaves and the vegetative state of the chrysanthemum plants. Multiple discriminant analysis was conducted using HPLC-analysed metabolites to predict the importance of metabolites in resistant, susceptible, or highly susceptible plants in the vegetative stage. The results demonstrated that multiple metabolites, rather than a single metabolite, are responsible for thrips resistance in chrysanthemum. However, the relative flavonol content did not reflect the HPLC-analysed flavonoid glycosides or hydroxycinnamic acid derivatives, indicating that the Dualex® sensor is not a suitable device for determining resistance levels in chrysanthemums. Testing is required to extend and analyse the results in greater depth.

1. Introduction

Chrysanthemum plants (Chrysanthemum × morifolium (Ramat.)) are an economically important ornamental for the horticultural industry in many countries, e.g., the Netherlands, China, Japan, Colombia and Mexico [1]. The international trade in cut chrysanthemums is the second largest in the floral industry, which is surpassed only by the trade in roses (Rosa spp.) [1]. Western flower thrips (Frankliniella occidentalis (Pergande)) is an important pest in field and greenhouse production worldwide, for instance in chrysanthemum cultivation [1,2]. Due to its rapid population increase, cryptic lifestyle, and way of feeding, it is difficult to control thrips. The thrips ingest cell contents from epidermal cells as well as from palisade and spongy mesophyll cells [3,4,5]. The typical silver damage symptoms occur after emptying cells due to air-filled spaces [6]. This silver damage can occur anywhere on aboveground plant parts, which leads to a considerable loss of the aesthetic and economic value of the crop. In chrysanthemums, thrips preferentially feed on the older leaves of the plant, which leads to silver damage [7,8], and feeding on young leaves on different hosts causes a distortion of leaf tissue [2,9,10]. In resistant Capsicum accessions, it was shown that the youngest fully expanded leaves were more resistant to thrips larvae than older leaves during the non-flowering phase [11], which was also confirmed for adult thrips on chrysanthemum [8]. Contrary, a similar resistance level at different leaf positions within the vegetative, generative, fruit-ripening stage (ontogenetic stages) of Capsicum was described [12]. Host plant resistance to insects has been rather associated to chemical defence in many host plants [13,14]. Nevertheless, more research is needed on the chemical composition of chrysanthemum leaves in different positions to enhance an early and easy discrimination of resistance levels in these ornamentals. So far, the phenylpropanoids chlorogenic acid and feruloyl acid were found in a higher amount in thrips-resistant chrysanthemum plants in a whole plant experiment [15]. Moreover, thrips resistance in Capsicum plants was associated with two diterpene glycosides and a flavonoid [16]. Phenolics are also known as potential resistance factors for phloem-sucking insects. For instance, Berrueta et al. [17] reported for apple tree cultivars a resistance to the sucking rosy apple aphid based on isomerisation reactions of the two hydroxycinnamic acids 4-caffeoylquinic acid (more in resistant plants) and 4-p-coumaroylquinic acid (more in susceptible plants). Additionally, different flavonoids, like apigenin, quercetin and naringenin showed a negative impact on aphid health [18,19], and Gómez et al. [20] described in Anticarsia gemmatalis-resistant soybeans (Glycine max.) a higher abundance of quercetin glycosides, kaempferol glycosides, genistein glycosides, as well as luteolin glycosides.
In principle, an optical and non-destructive measurement of total flavonol content in leaves could be an easy and rapid method for resistance detection. In a pilot study Rogge and Meyhöfer [21] analysed the relative flavonol contents with the Dualex® Scientific 4 sensor [22] in different chrysanthemum cultivars, but only small differences were detected, which did not allow a clear resistance discrimination. Consequently, in the current study, the phenolic compounds in chrysanthemum leaves were investigated furthermore with high-performance liquid chromatography (HPLC). In addition, different leaf ages and growth stages of the plants were investigated, and differences in the amount and pattern of phenolic compounds were characterised. The aim of the study was to investigate differences in amounts of phenolic compounds in different ontogenetic stages and to show that in leaves of thrips-resistant chrysanthemum cultivars [8,21] a higher content of phenolic compound could be found regardless of developmental stage or leaf position. The results will help to classify new breedings and chrysanthemum cultivars on the market to a pest insect resistance level more easily in the future.

2. Materials and Methods

2.1. Plant Material, Growth Conditions and Leaf Analysis Setup

Chrysanthemum (Chrysanthemum × morifolium) cuttings (N = 5) of 17 cultivars (14 cultivars from the breeder Brandkamp GmbH, Isselburg-Anholt, Germany and cultivars Aviso and Palm Green from the breeder Deliflor Chrysanthemums, Maasdijk, The Netherlands, Table 1) were cultivated in a greenhouse cabin at 22 ± 2 °C under long-day conditions (16:8 h L:D) in Fruhstorfer soil type P substrate (Hawita Group, Vechta, Germany) until they were 3 weeks old. At week four, they were cut between the 2nd and 3rd leaf to induce branching and were transferred to a climate chamber with 18 ± 2 °C under short-day conditions (10:14 h L:D) to induce flowering.
At the beginning, due to the small size of the chrysanthemum plants, the oldest two leaves of the cut branch were collected from each plant and used for the secondary metabolite analysis in the vegetative state (labelled as ‘vegetative-old leaves’; 4 weeks old) of the plants (Figure 1). At this point, flowering has not yet been induced. Four weeks later, the oldest four leaves (labelled as ‘bud stage-old leaves’) as well as the four youngest leaves (labelled as ‘bud stage—intermediate’, 8 weeks old) from each plant were collected for secondary metabolite analysis (branch No. 1 with a mean number of 8 leaves) (Figure 1).
These samples represent the bud stage of the plant. Additionally, four weeks later, the oldest four leaves, four leaves of the intermediate part of the shoot as well as the four youngest leaves (labelled as ‘generative-young leaves’; 12 weeks old) from each plant were collected for the secondary metabolite analysis (branch No. 2 with a mean number of 12 leaves) (Figure 1). These samples represent the generative state of the plant. During the experimental phase, each cutting/plant was collected and analysed individually, with each sample representing a replicate. This resulted in a total of 5 replicates for each plant state, position and cultivar, giving a total of 306 samples.
The used cultivars were characterised according to their resistance level (based on feeding damage on the leaves in the vegetative state of the plants) against F. occidentalis in a separate study before [21] (Table 1). Cultivar Colombo Apricot originally was characterised as highly resistant. For the analysis in the current study, this cultivar was considered to be ‘resistant’, because it was the only cultivar in the classification that was assessed as ‘highly resistant’. For statistical comparisons, the 17 cultivars were grouped as ‘resistant’, ‘susceptible’ and ‘highly susceptible’ (Table 1).

2.2. Method for the Analysis of Phenolic compounds in Leaves

Due to the growth of the plants, not all positions were available at each time. This was because a minimum of two to four leaves was required for analysis with the exact number dependent on the size of the leaf. The leaves per position and growth stage were collected and pooled, respectively. However, each cutting/plant was analysed separately, and each represents a replicate. The samples were frozen in liquid nitrogen, stored on ice and finally stored at −20 °C. The samples were freeze dried with an Alpha 1-4 LSC freeze dryer (Martin Christ Gefriertrocknungsanlagen GmbH, Osterode am Harz, Germany) and afterwards grinded to powder.
Hydroxycinnamic acid derivatives and flavonoid glycosides were extracted according to Schmidt et al. [23] with modifications [24] as follows: from each sample, 0.02 g was mixed with 600 µL of 60% aqueous methanol (Carl Roth) and shaken at 1400 rpm for 40 min at 20 °C before the extract was centrifuged for 10 min at 4500 rpm. The supernatant was removed, collected in a reaction tube and stored at 4 °C. The pellet was used to repeat the extracting step twice, using 300 µL of 60% aqueous methanol, and samples were shaken at 1400 rpm for 15 and 10 min, respectively. The supernatant was collected in the same reaction tube after each extraction step and evaporated in a vacuum centrifuge (THERMO SAVANT SpeedVac Vacuum Concentrator Centrifuge; Thermo Fisher, Waltham, MA, USA). The dried residue was dissolved in 200 µL of 10% aqueous methanol before it was transferred into a Corning® Costar® Spin-X® plastic centrifuge tube filter (Sigma Aldrich Chemical Co., St. Louis, MO, USA) and centrifuged at 3000 rpm at 20 °C for 5 min. The HPLC-MS measurements were carried out according to Santin et al. 2018.

2.3. Relative Epidermal Flavonol Content Measurement

The relative flavonol contents in the leaf epidermis of all leaves were measured before the leaves were collected for the secondary metabolite analysis (HPLC). Non-destructive measurements with the hand-held sensor Dualex® Scientific 4 (FORCE-A, Orsay, France) were taken from the abaxial side of the leaf avoiding inclusion of the middle vein. The abaxial side of the leaf was selected for analysis based on prior evidence indicating a preference for this side by F. occidentalis [8]. The sensor measures leaf epidermal flavonols at 375 nm, using the chlorophyll fluorescence screening method [22,25,26]: the relative flavonol content was calculated with the decadic logarithm of UV excitation ratio of far-red chlorophyll fluorescence (flavonol absorbance). This value is proportional to the flavonol content of the leaves [22,27,28].

2.4. Statistics

Statistical evaluation was conducted using RStudio Version 1.4.1106 (11 February 2021). Differences between flavonoids and hydroxycinnamic acids, as well as the differences between the resistance levels for single metabolites, were analysed by using the generalised linear model (GLM) with quasi-Poisson distribution (link = log) and a post hoc Tukey test. Differences between relative flavonol contents were analysed by using Bayes generalised linear model (Bayes GLM) with quasi-Poisson distribution and a post hoc Tukey test.
Based on the HPLC analysis, we conducted a Multiple discriminant analysis to predict metabolites for the respective resistance level in order to develop a tool for faster classification of the resistance potential of new chrysanthemum cultivars in the future. The measured relative flavonol content and the HPLC-analysed metabolites were compared with each other to investigate the potential of the Dualex sensor for a faster and easier method of metabolite measurements.
Pearson correlation analysis between the relative flavonol content and HPLC-analysed flavonoid glycosides and hydroxycinnamic acid derivatives (both log10-transformed, because data were not normally distributed) was conducted using IBM SPSS® Statistics version 26. A linear discriminant function analysis performs a multivariate test of differences between groups. A stepwise multiple discriminant analysis (according Fisher) was conducted using again IBM SPSS® Statistics version 26. Analysing the data (old, vegetative leaves) revealed a significant value for the Box’s M-Test (vegetative state, old leaves: Box M = 445.25, F value = 6.896, df1 = 56, df2 = 12,624.898, p = 0.000). Hence, all data were (log + 1)-transformed and used for the linear discriminant analysis. As recommended by Hair et al. 2010, for the stepwise method, the Mahalanobis D2 to estimate the discriminant function was used. The variable with the largest F to Enter value was added at each step (entry criterion by default in SPSS = 3.84). The Wilk’s lambda statistic is utilised to assess the extent to which each level of the independent variable contributes to the model. The scale ranges from 0 to 1, with 0 indicating total discrimination and 1 indicating no discrimination. Each independent variable is evaluated by inserting it into the model and then removing it. The significance of the change in lambda is assessed with an F test. If the F value is greater than the critical value, the variable is retained in the model. The determination groups were ‘resistant’, ‘susceptible’ and ‘highly susceptible’. Groups were calculated using 13 secondary metabolites of the classes flavonoids and hydroxycinnamic acids.

3. Results

3.1. Analysis of Flavonoid Glycosides and Hydroxycinnamic Acid Derivatives in Chrysanthemum Leaves of Different Age and Ontogenetic Stage

In total, 13 secondary metabolites in chrysanthemum leaves of different positions (old, intermediate and the young part of the plant) in different ontogenetic stages (vegetative, bud, generative state) were analysed: six of them were flavonoid glycosides: luteolin-3-glucuronide, kaempferol-3-glucuronide, apigenin-3-glucuronide, diosmetin-3-glucuronide, acacetin-3-rutinoside and acacetin-3-glucuronide, and seven of them were hydroxycinnamic acid derivatives: caffeoyl quinic acid, coumaroyl quinic acid isomer 1, coumaroyl quinic acid isomer 2, dicaffeoyl quinic acid isomer 1, dicaffeoyl quinic acid isomer 2, dicoumaroyl quinic acid isomer 1 and dicoumaroyl quinic acid isomer 2. A separate consideration of individual metabolites for each resistance level is given below. In order to find differences between resistant, susceptible and highly susceptible cultivars, flavonoid glycosides and hydroxycinnamic acid derivatives were each grouped together. This grouping should give information on the overall differences in these two metabolite classes.
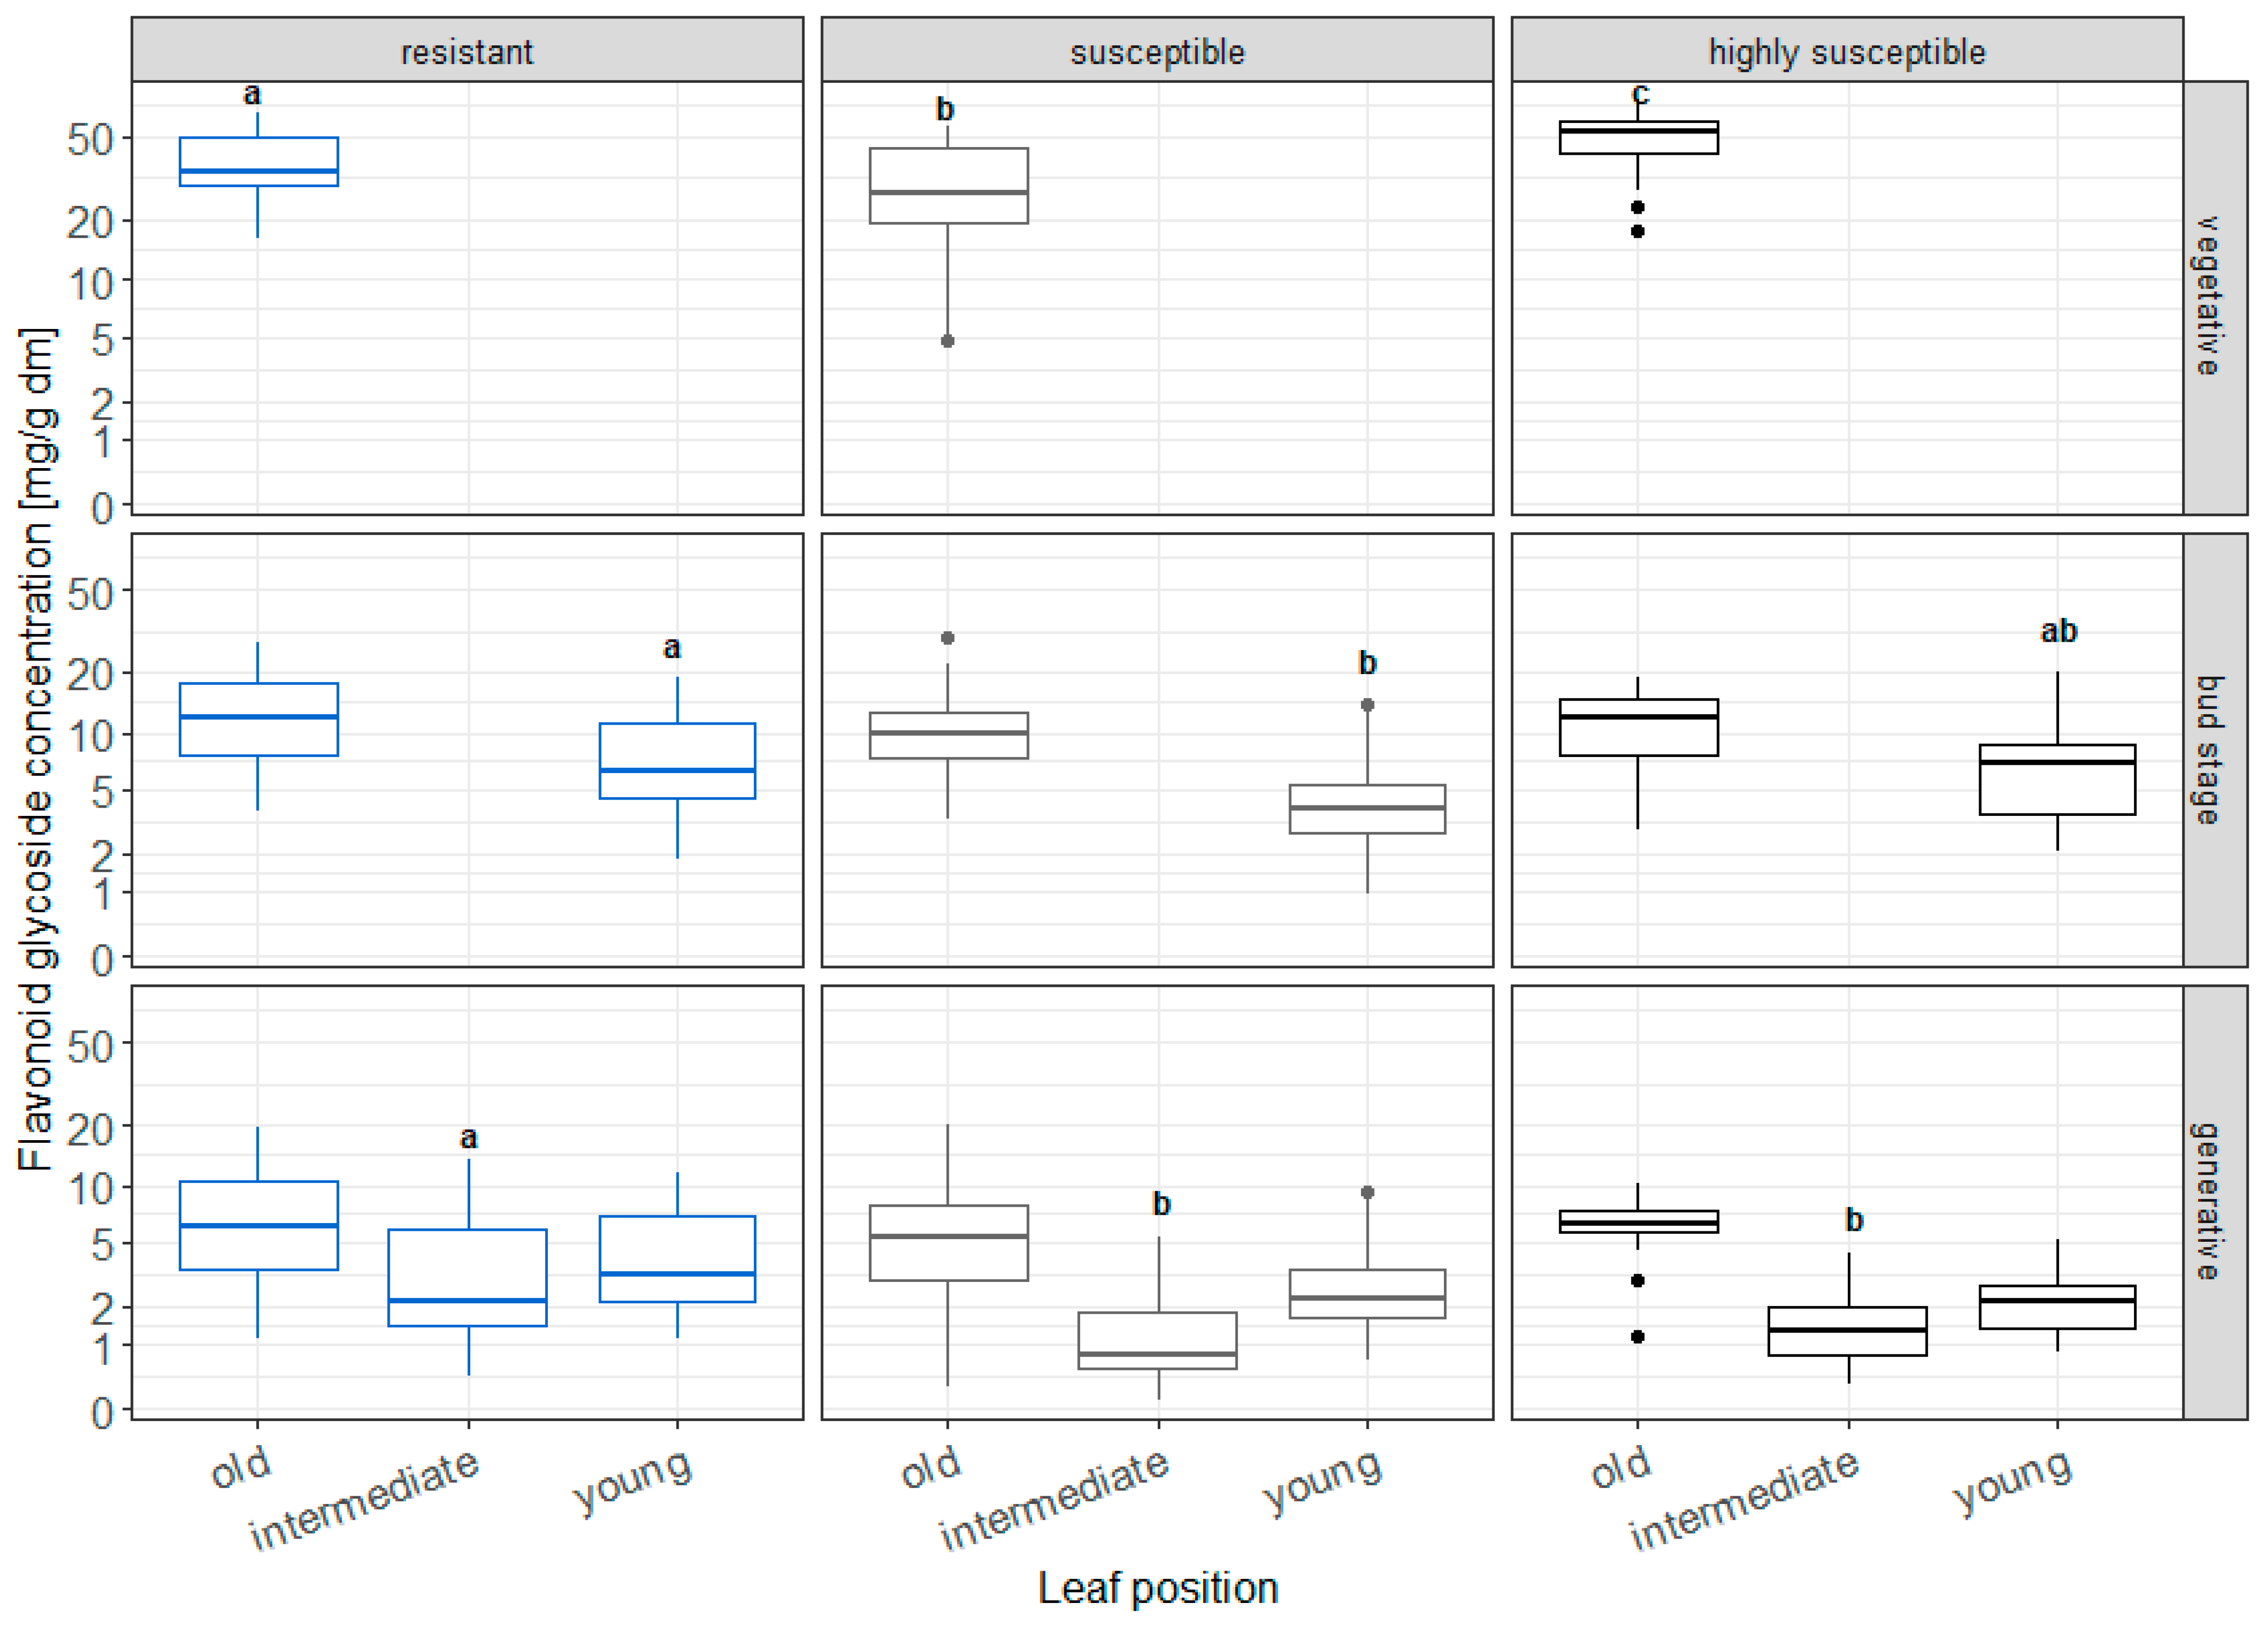
In the vegetative plant state, only old leaves were analysed, and differences between ‘resistant’, ‘susceptible’ and ‘highly susceptible’ were detected. Resistant (38.2 mg/g dm) and susceptible cultivars (30.9 mg/g dm) showed 1.3 to 1.6 times lower flavonoid glycoside concentrations, respectively, than highly susceptible cultivars (49 mg/g dm) (Figure 2). Similarly, the hydroxycinnamic acid derivative concentration was approximately 1.3 to 1.5 times lower in resistant (9.1 mg/g dm) and susceptible cultivars (10.4 mg/g dm) compared to highly susceptible cultivars (13.3 mg/g dm) (Figure 3).
No differences between old leaves of the different resistance levels in the bud state were detected. However, in young leaves, the flavonoid glycosides concentration in resistant cultivars (8.0 mg/g dm) was 1.6 times higher compared to susceptible cultivars (5.0 mg/g dm. Highly susceptible cultivars showed no differences to the aforementioned susceptible cultivars (Figure 2). The hydroxycinnamic acid derivative concentration was 1.8 to 2 times lower in resistant (2.5 mg/g dm) and susceptible cultivars (2.8 mg/g dm), respectively, compared to highly susceptible cultivars (5.0 mg/g dm) (Figure 3).
In the generative state, the flavonoid glycosides concentration in intermediate leaves was 2.6 to 2.8 times higher in resistant cultivars (4.3 mg/g dm) compared to susceptible and highly susceptible cultivars (1.6 mg/g dm), respectively (Figure 2). The hydroxycinnamic acid derivative concentration did not differ between the studied cultivars (Figure 3).
Altogether, the flavonoid glycoside and hydroxycinnamic acid derivative concentrations were highest in old leaves in the vegetative state.
Over time, the concentrations decreased enormously (4.8 to 7.7 times) in old leaves but still were the highest compared to all other leaf ages, keeping in mind that young leaves in the bud stage are in the same position as intermediate leaves in the generative stage. However, over time, the flavonoid glycoside and hydroxycinnamic acid derivative concentrations also decreased (1.8 to 4.6 times) in these young leaves from the bud stage and intermediate leaves of the generative stage (Figure 2 and Figure 3).

3.2. Relative Flavonol Content Measurements

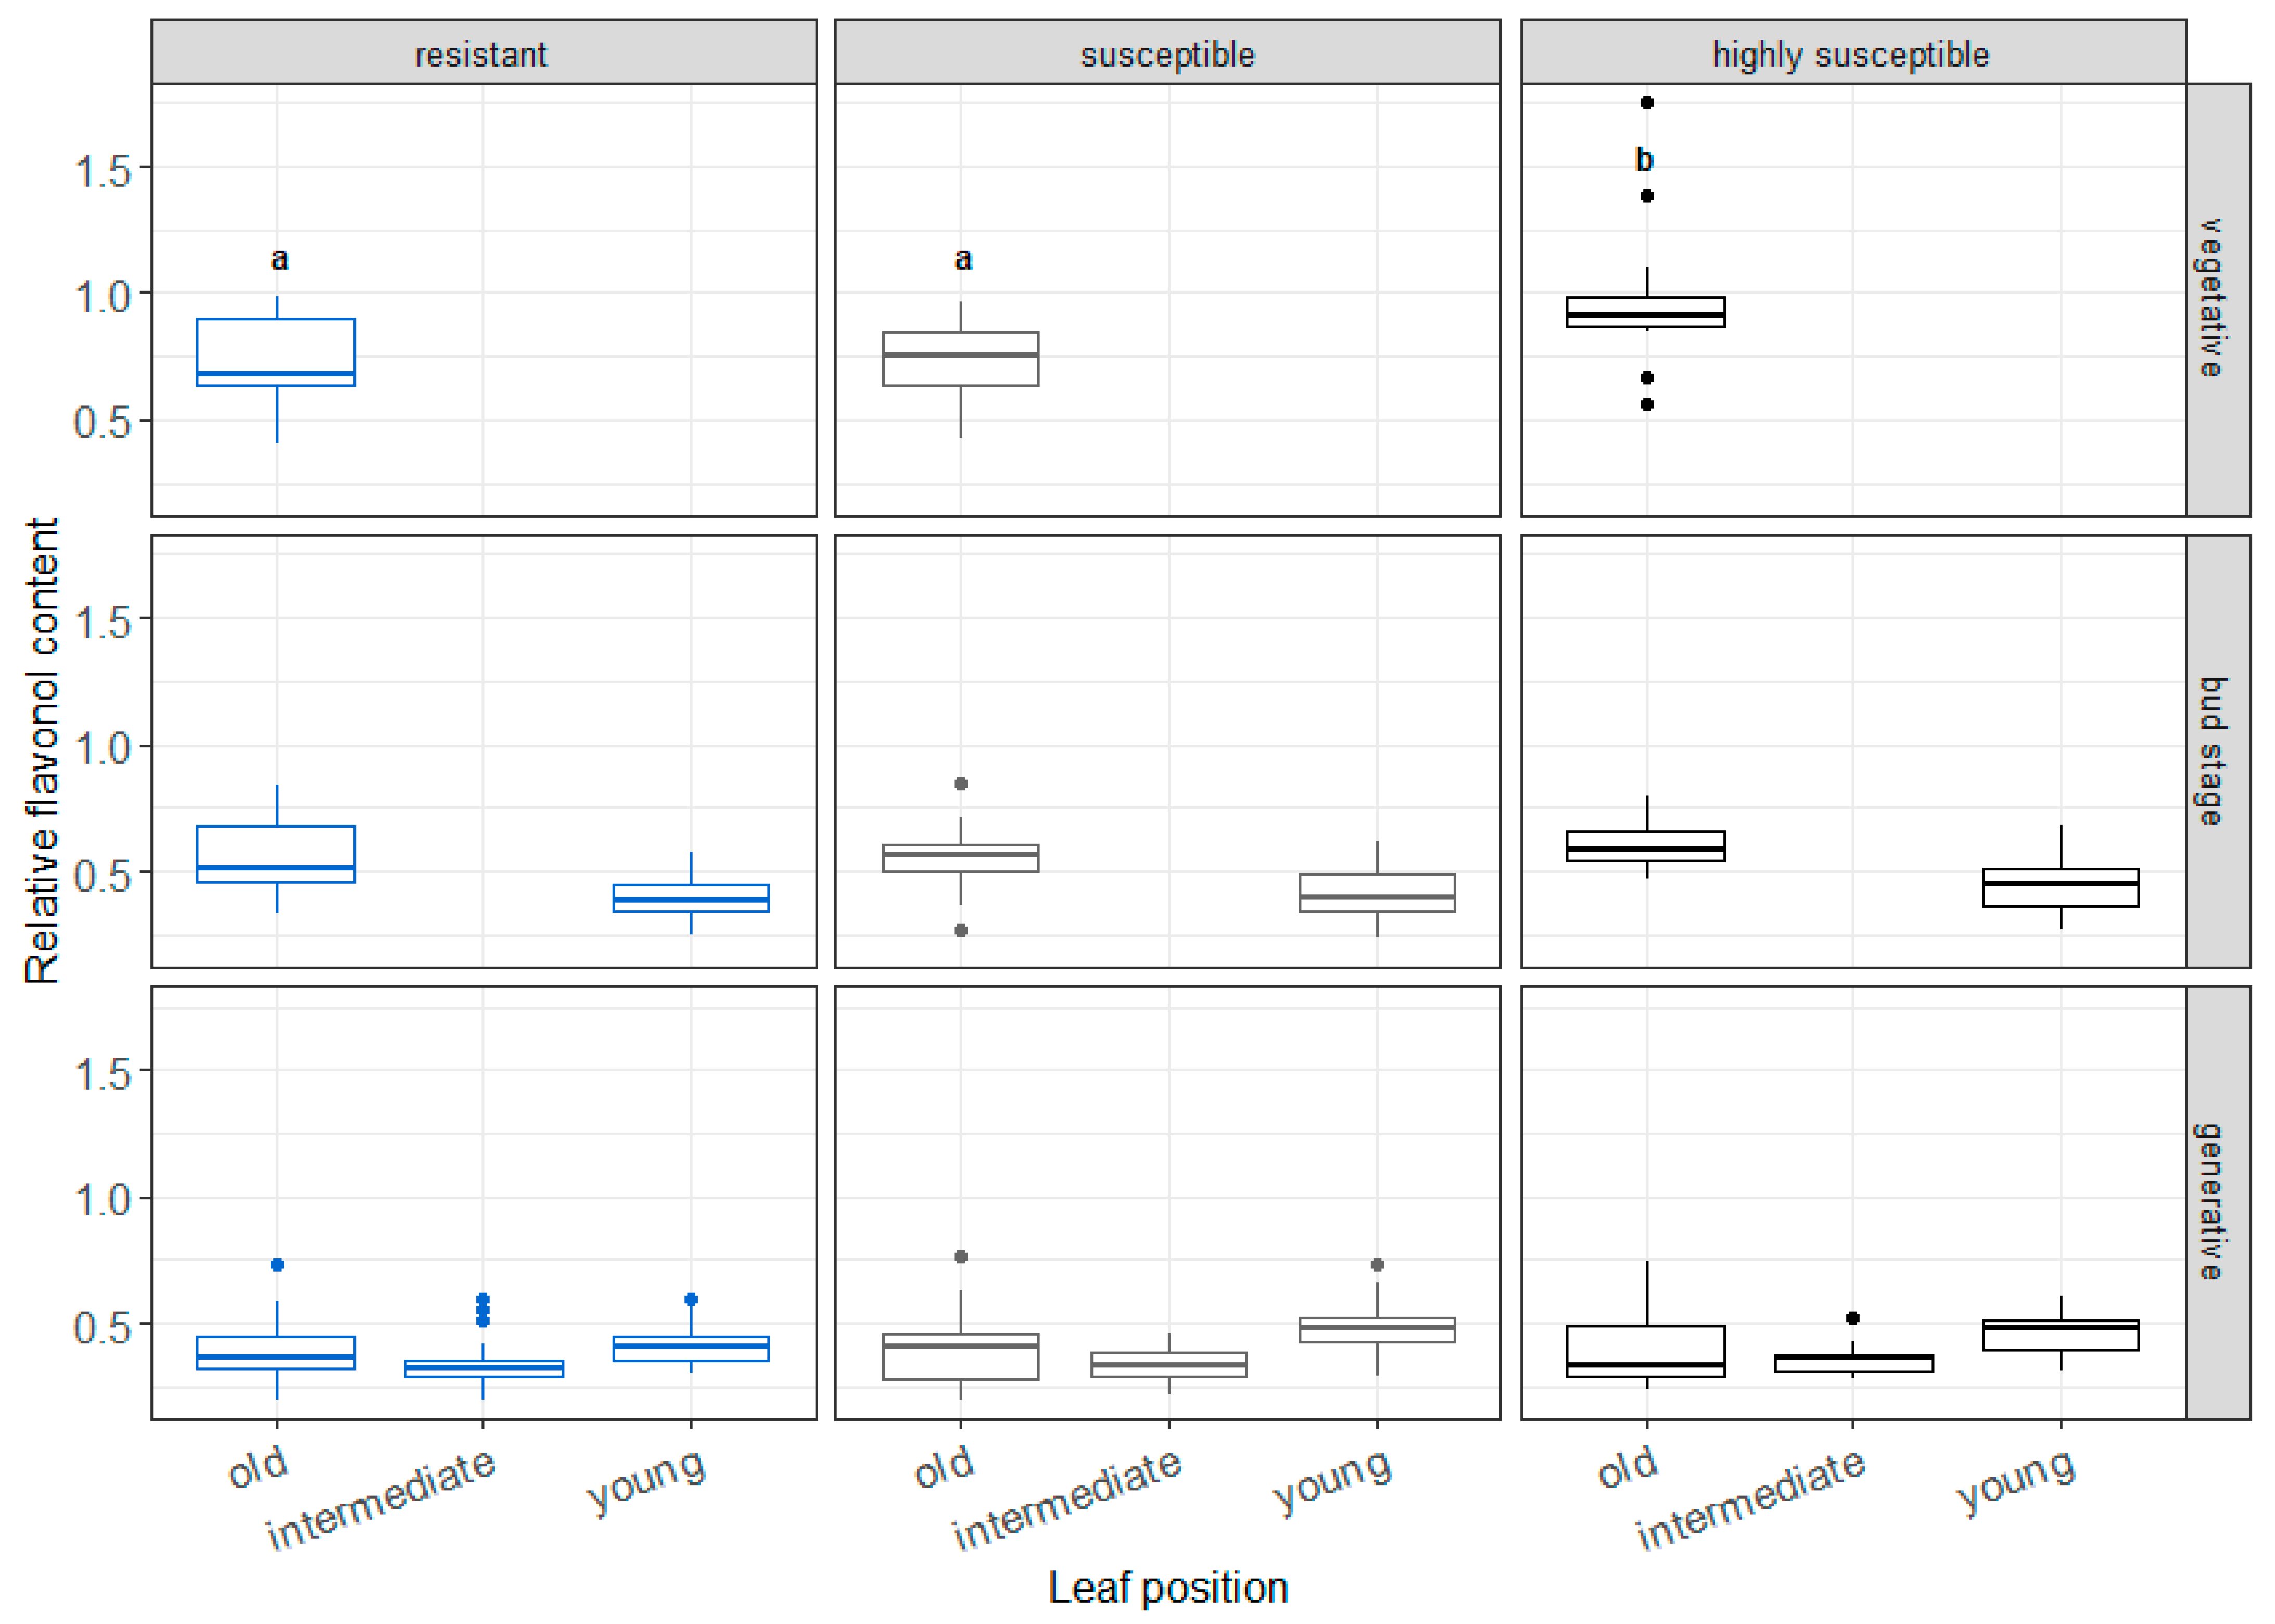
The Dualex sensor was used to measure the flavonol content with a fast, non-destructive and optical method compared to the more complex method using HPLC. In the vegetative plant state, resistant (value 0.74) or susceptible cultivars (value 0.74) showed approximately 1.3 times lower relative flavonol contents than highly susceptible cultivars (value 0.95). In the other plant states, no differences were detected. Altogether, the highest flavonol contents were measured in old leaves. In all three resistance levels, the leaf flavonol content decreased from the vegetative to the generative state by approximately 50% (Figure 4).
Since differences were found especially in the vegetative state, the relative epidermal flavonol contents (Dualex sensor) and the analysed flavonoid contents (HPLC) of this state only were correlated with each other. However, there was no correlation between them (Pearson’s Rho = 0.124, p = 0.275, N = 79). This result was also true for the correlation of the relative flavonol contents with the total amount of metabolites (flavonoid glycosides and hydroxycinnamic acid derivatives) analysed with HPLC (Pearson’s Rho = 0.165, p = 0.145, N = 79). Interestingly, each leaf position analysed separately showed a correlation between relative flavonol contents with the total amount of metabolites for the generative state (old: Pearson’s Rho = 0.331, p = 0.002, N = 85; intermediate: Pearson’s Rho = 0.268, p = 0.013, N = 85; young: Pearson’s Rho = 0.234, p = 0.031, N = 85).

3.3. Multiple Discriminant Analysis Focusing on Old Leaves in Vegetative State

We demonstrated differences of flavonoid glycoside and hydroxycinnamic acid derivative concentrations between resistant, susceptible and highly susceptible cultivars especially in vegetative state in old leaves. Hence, a Fisher’s linear discriminant analysis using all metabolites of old leaves in vegetative state was conducted. Using as prior probability ‘compute from group size’, the test of equality of group means (one-way ANOVA) showed that dicaffeoyl quinic acid isomer 1, dicaffeoyl quinic acid isomer 2, dicoumaroyl quinic acid isomer 2 and acacetin-3-rutinoside did not differ between the groups resistant, susceptible and highly susceptible (p-values higher than 0.05, see Table 2).
The ‘stepwise method’ was used to automatically select the best independent variables to be included in the discriminant function model (see statistics for more details). Although dicoumaroyl quinic acid isomer 2 and acacetin-3-rutinoside were not significant in the test of equality of group means, they were used to compute the discriminant analysis, whereas caffeoyl quinic acid, dicaffeoyl quinic acid isomer 1, dicaffeoyl quinic acid isomer 2 and apigenin-3-glucuronide were excluded.
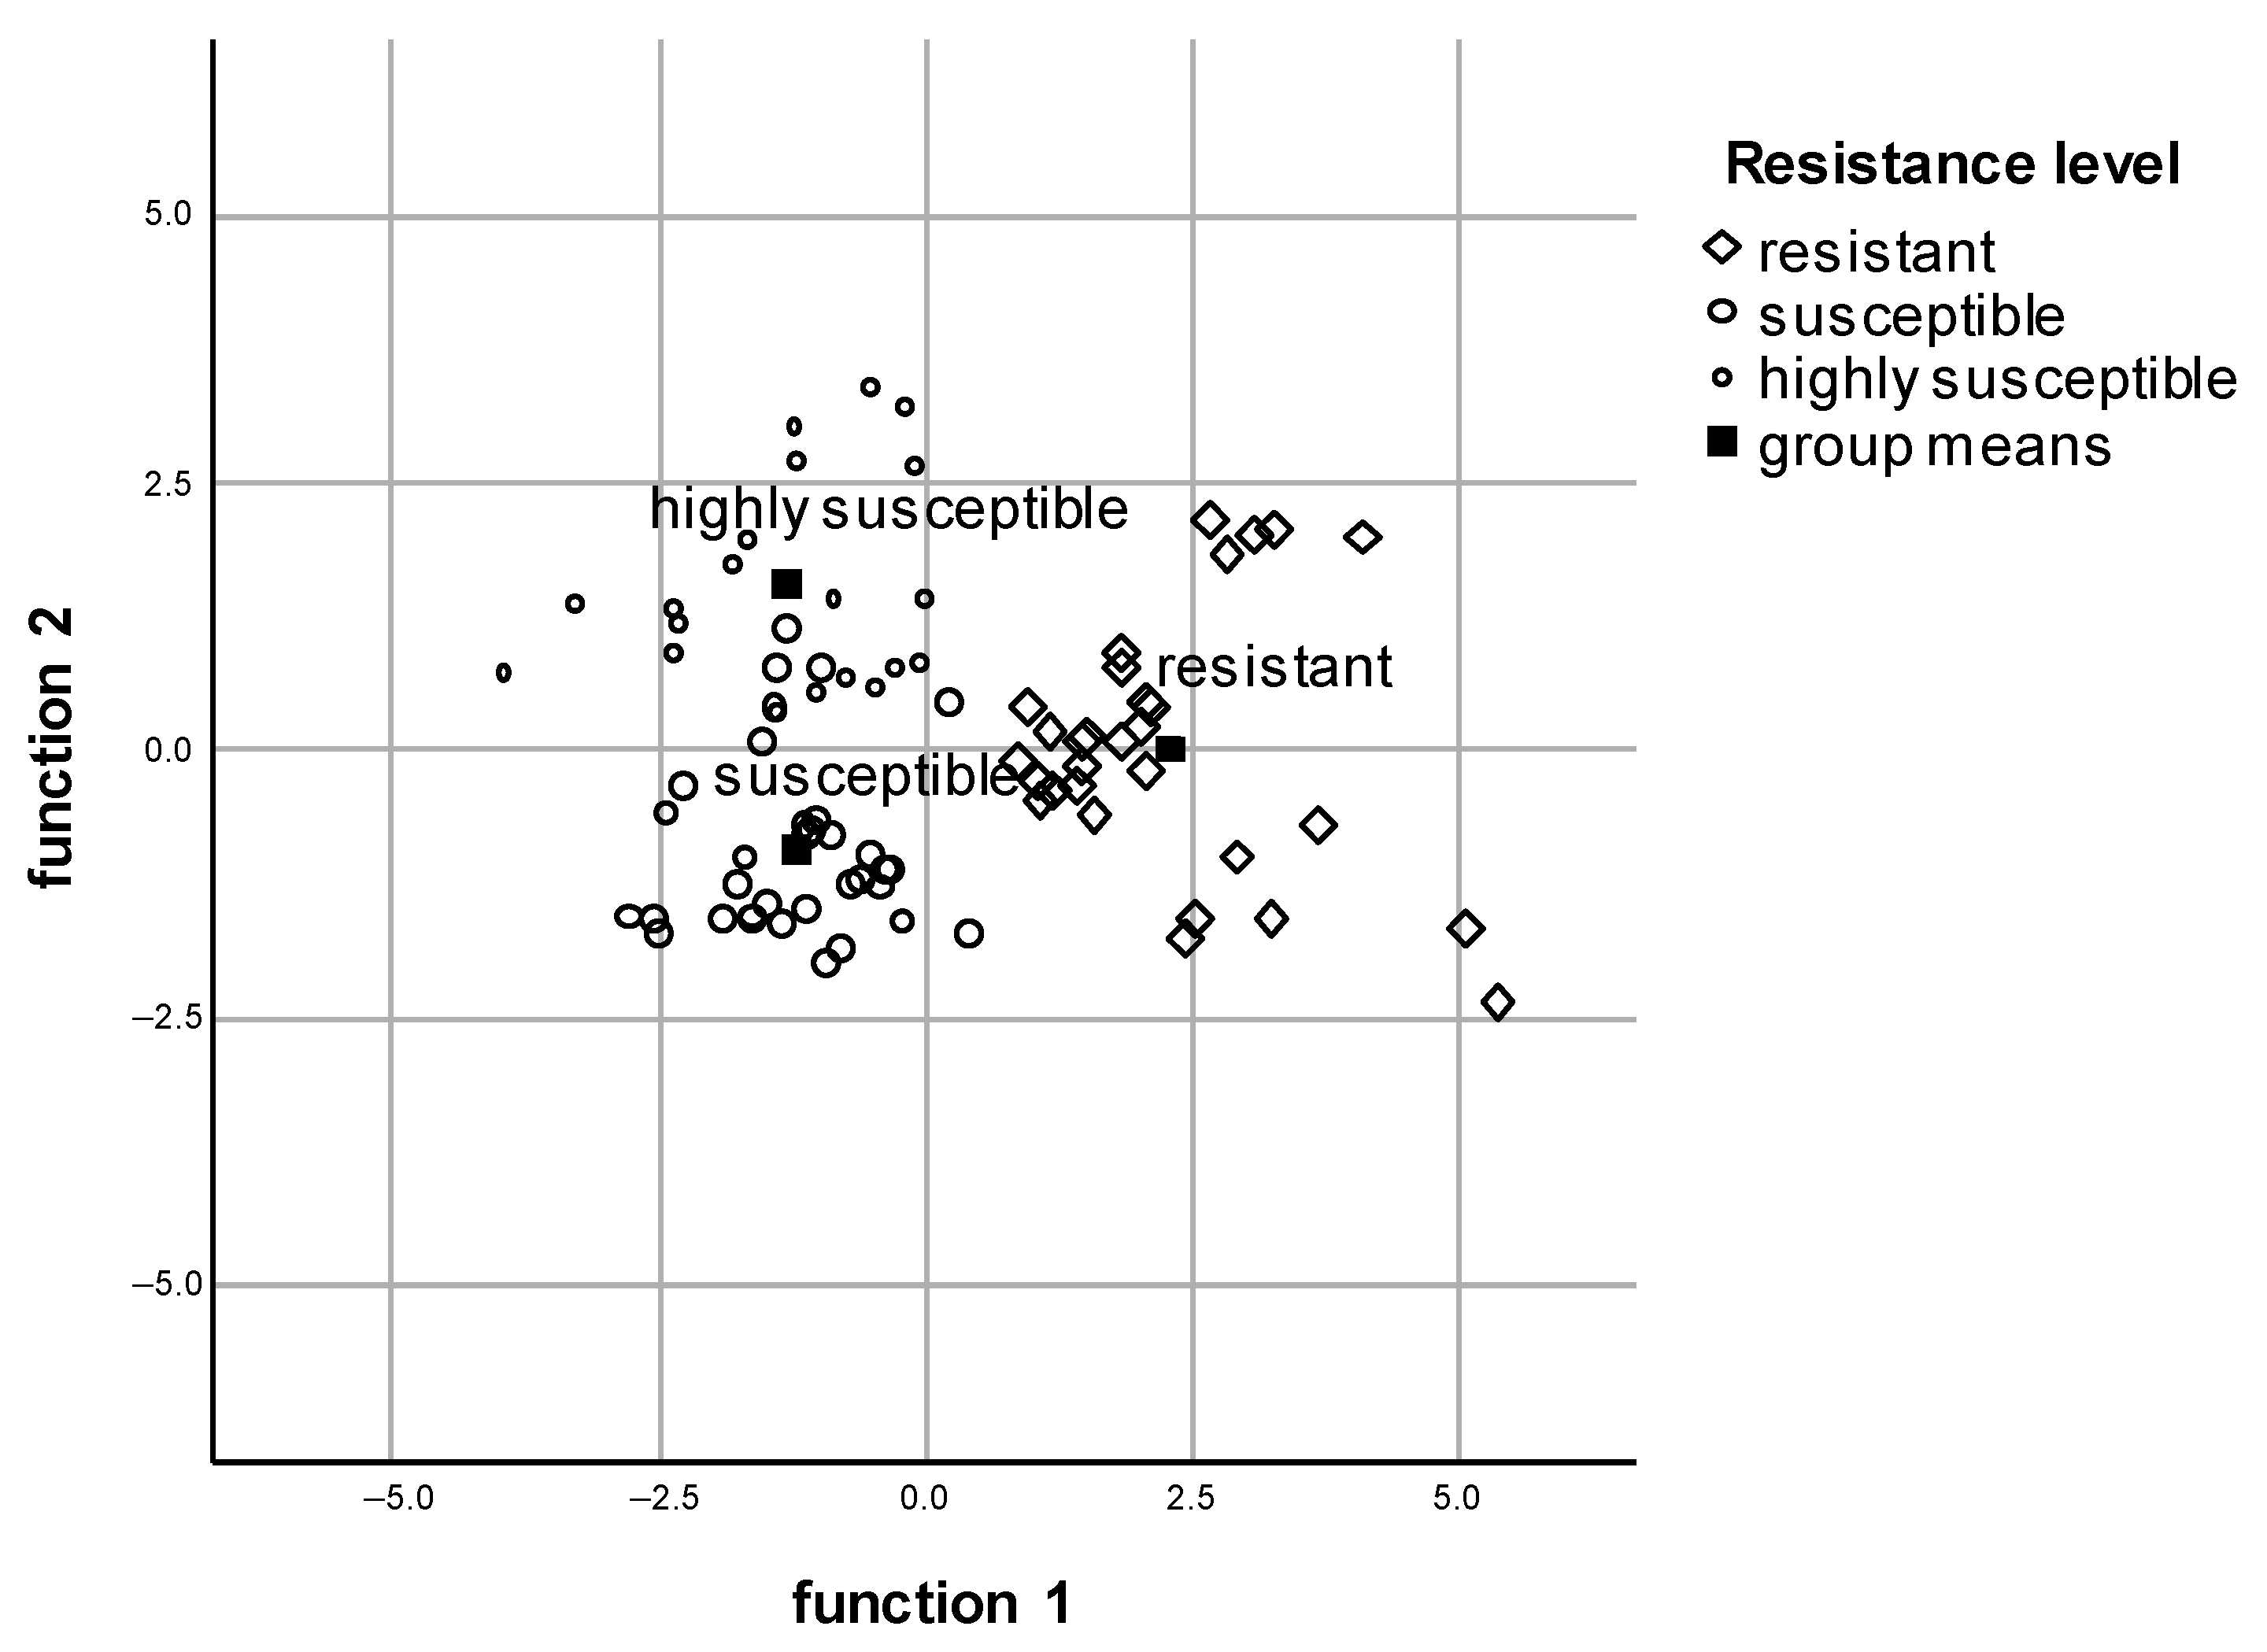
The two discrimination functions were calculated using in total four hydroxycinnamic acid derivatives and five flavonoid glycosides. According to the three groups (resistant, susceptible and highly susceptible), two functions for discriminant analysis were calculated (Figure 5). The Wilks–Lamba test was significant for both functions, and the F tests had a statistically significant contribution to the discriminant functions (function 1: Wilks-λ = 0.131, χ2 = 158.810, df = 18, p < 0.001; function 2: Wilks-λ = 0.516, χ2 = 51.631, df = 8, p < 0.001). The eigenvalues showed a higher relative importance for function 1, and canonical correlations for the two functions were high (function 1: eigenvalue = 2.951, % of variance = 75.9, canonic correlation = 0.864; function 2: eigenvalue= 0.939, % of variance = 24.1, canonic correlation = 0.696). Classification function coefficients represent the included metabolites and to which group they belong (Table S3, Figure 5).
The highest rate of correct cross-validated classifications was observed for the resistant cultivars group (29/30, 96.7%) closely followed by the susceptible cultivars group (30/35, 85.7%). For the highly susceptible cultivar group, the rate was slightly lower (14/20, 70.0%). In addition, 3.3% (1/30) resistant cultivars were wrongly classified as susceptible and 2.9% (1/35) susceptible cultivars were wrongly classified as resistant, whereas none of the highly susceptible cultivars were classified as resistant and 30.0% (6/20) were classified as susceptible only. Overall, the discriminating power is very satisfying and the model classifies 85.9% (cross-validated) of the cultivars correctly in their original groups.

3.4. Distribution of Single Phenolic Compounds in Different Resistance Levels in Old Leaves in the Vegetative State

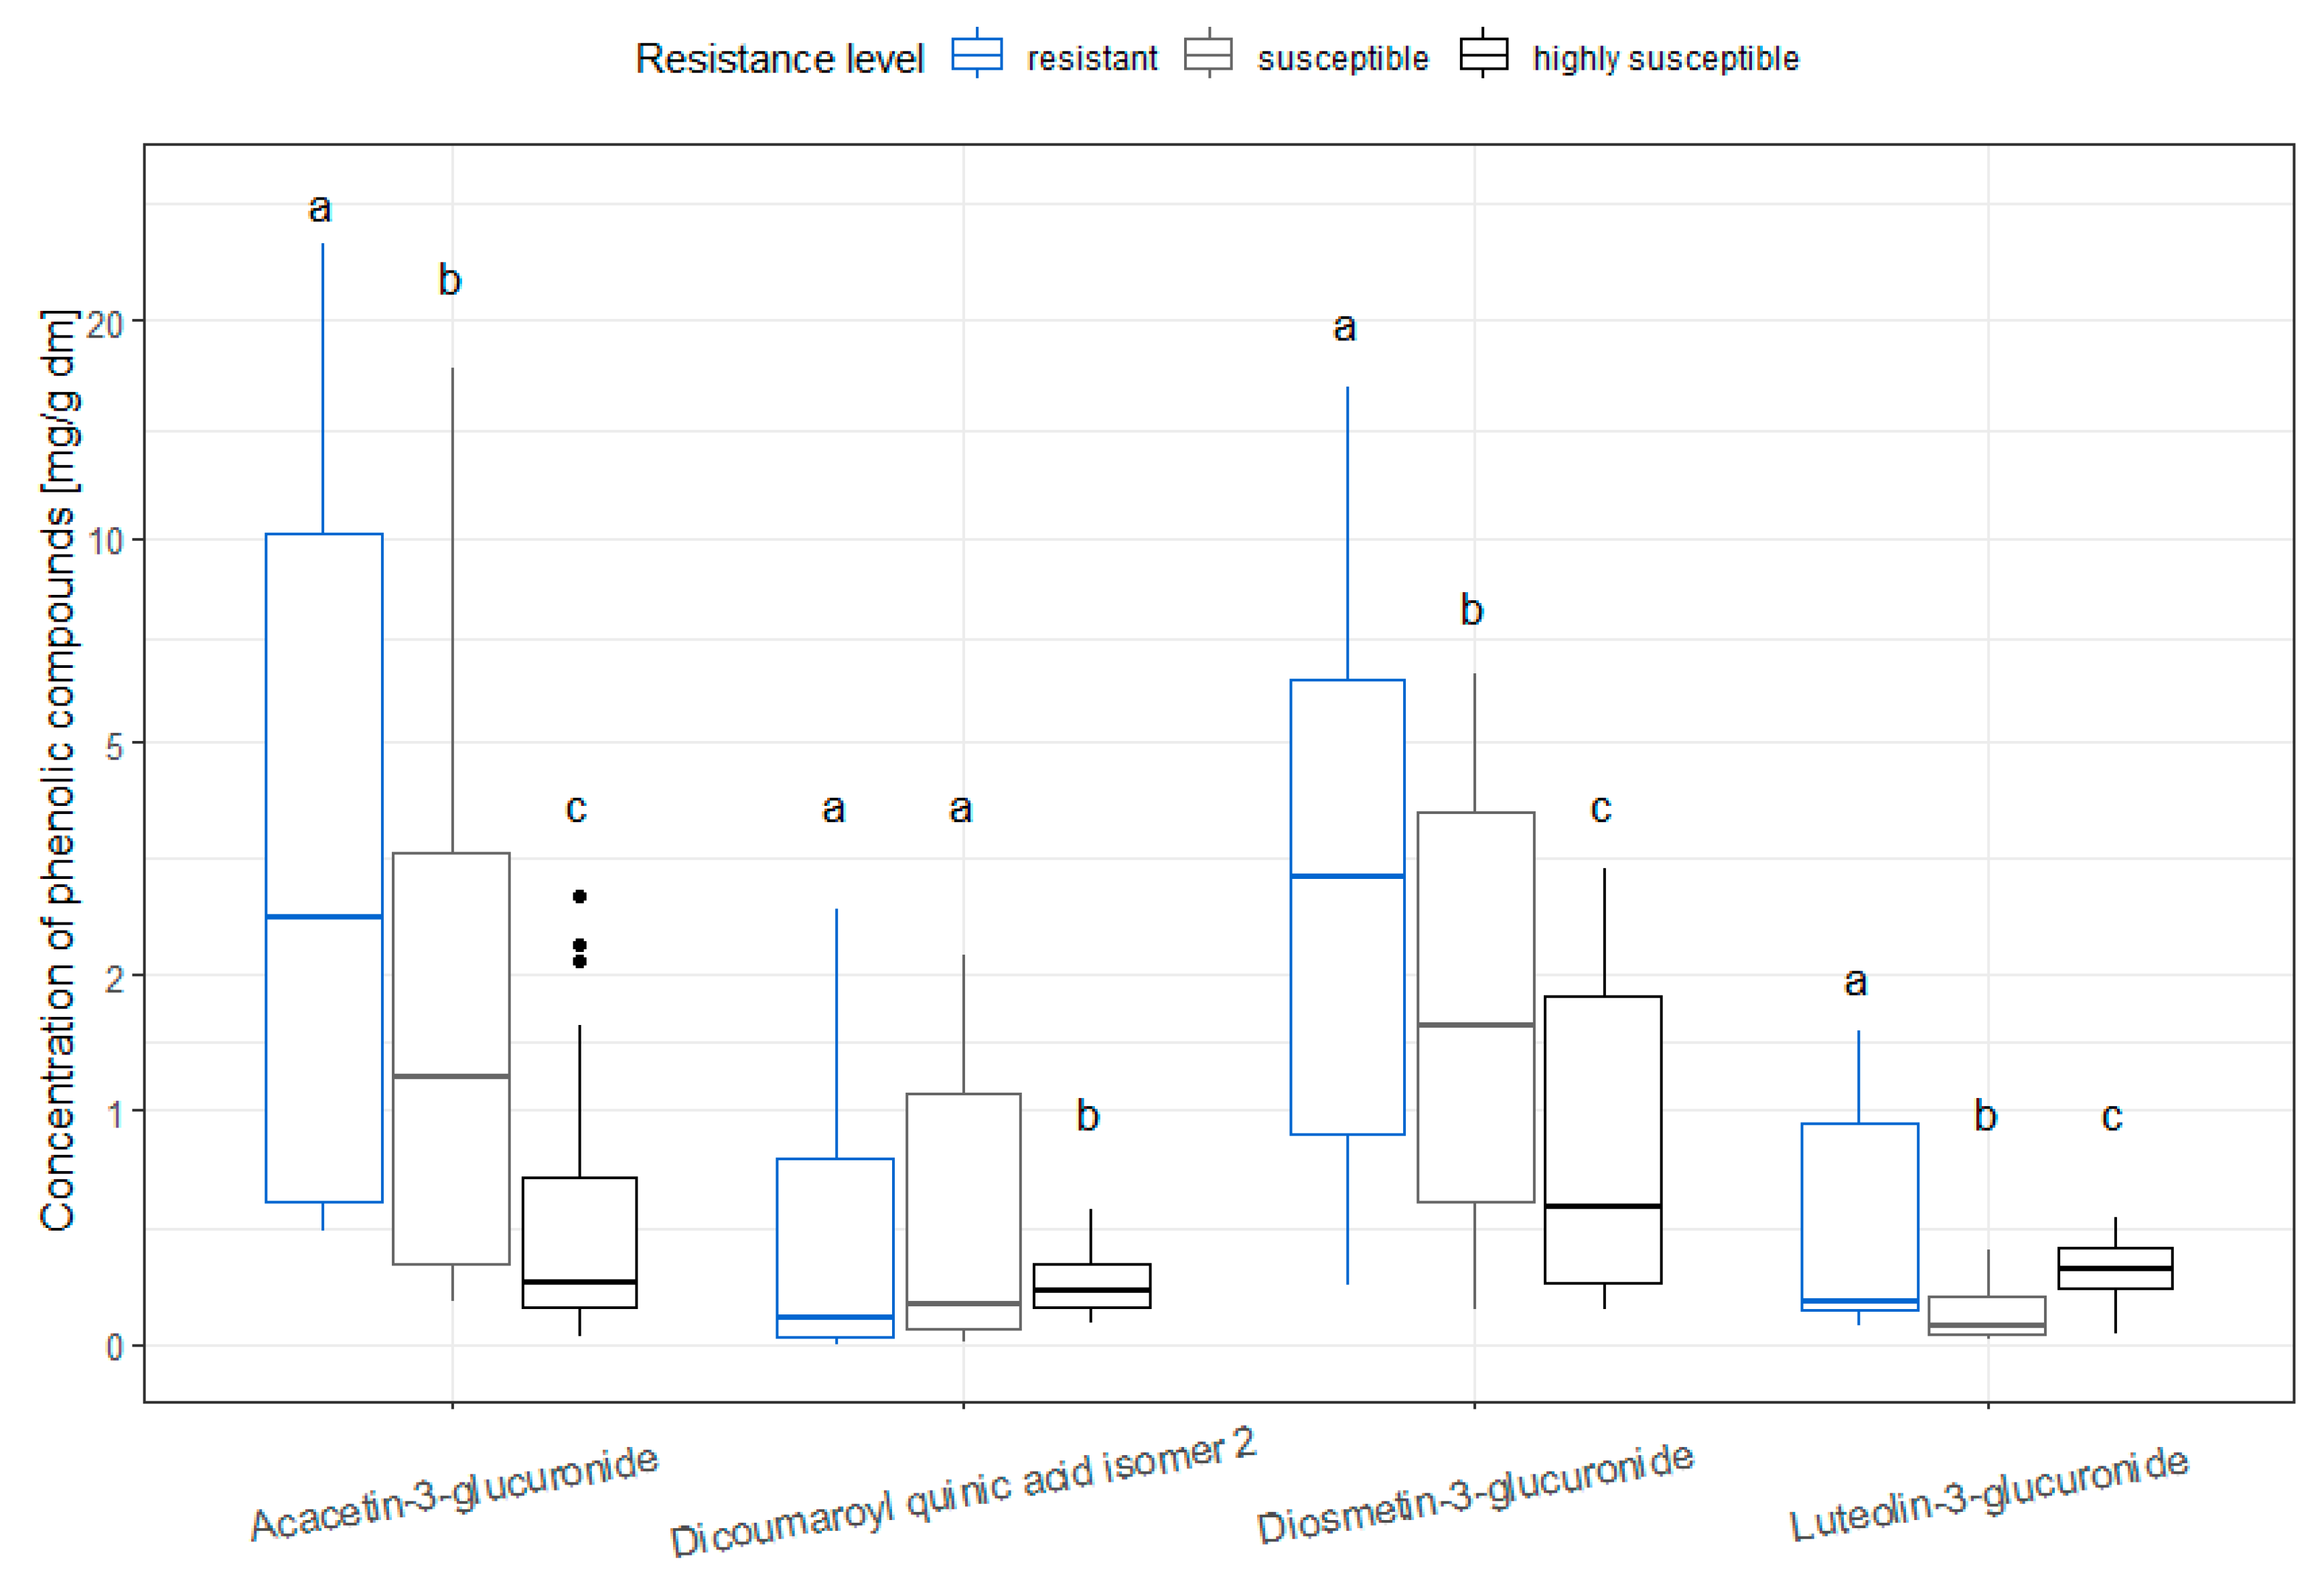
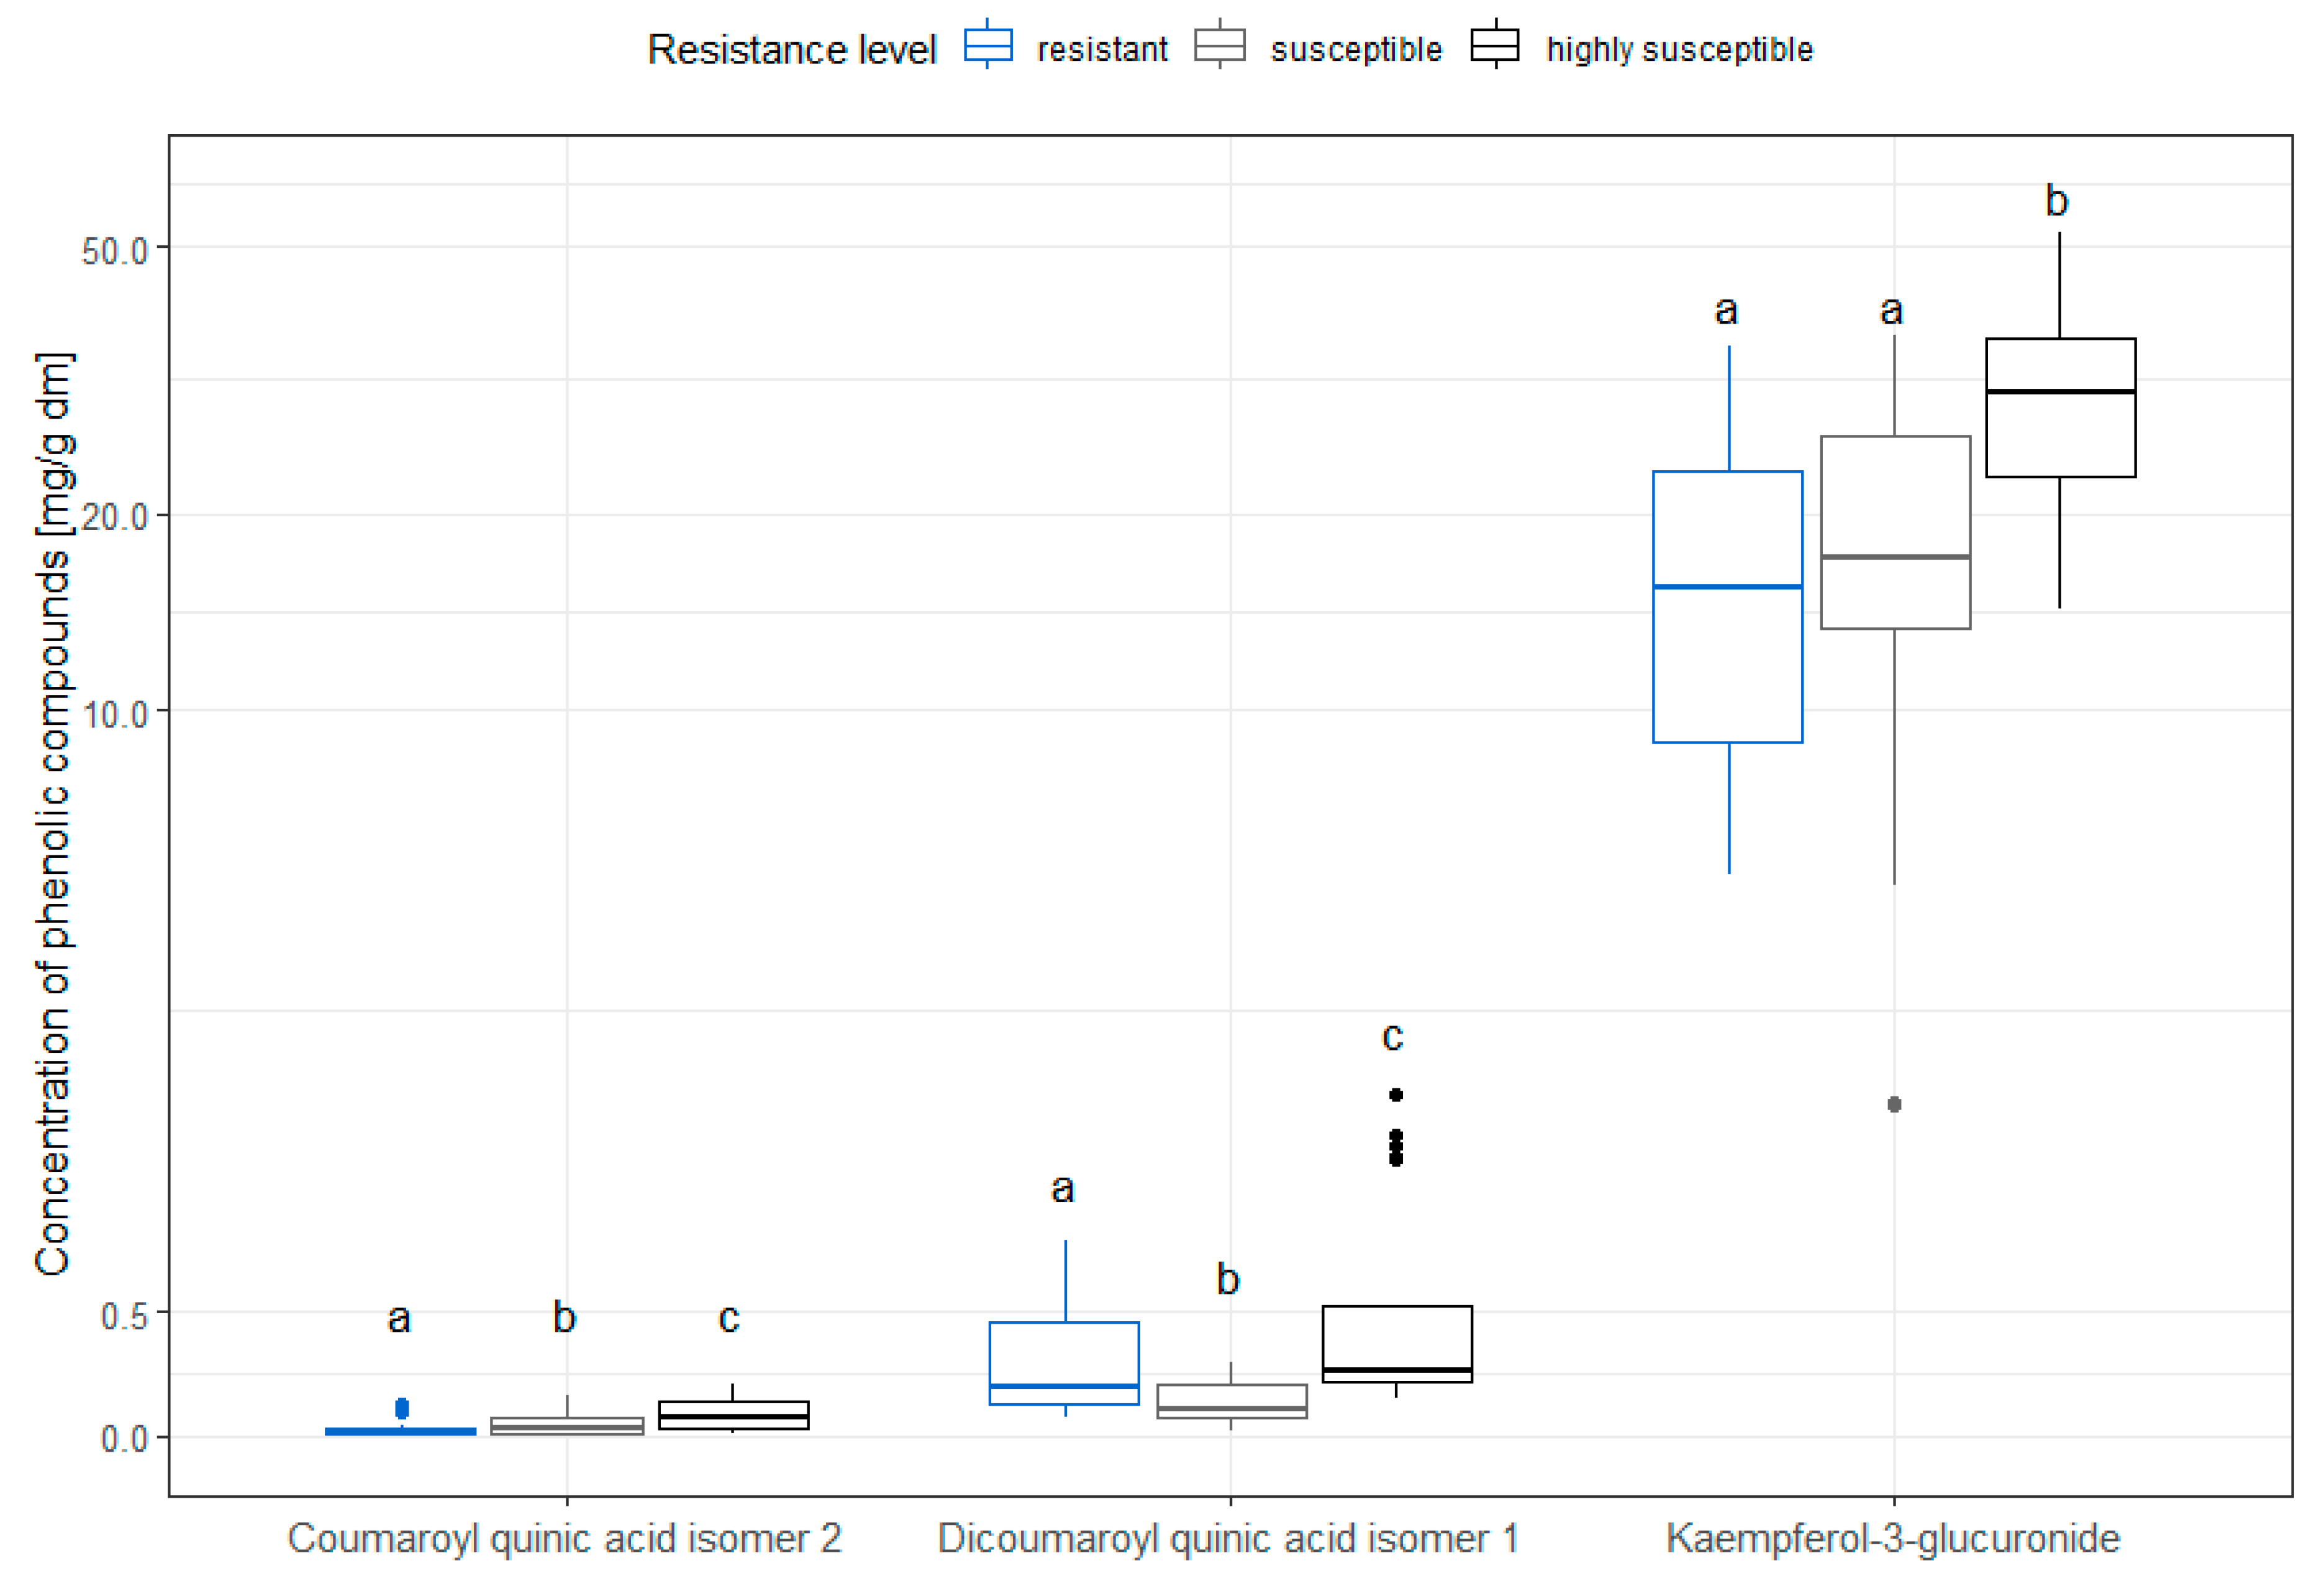
For the discriminant analysis, nine out of thirteen metabolites were used in order to follow the ‘stepwise method’ (Table S1). A detailed look at the metabolites showed differences between the resistance levels and the single metabolites. Luteolin-3-glucuronide, diosmetin-3-glucuronide, and acacetin-3-glucuronide were higher in resistant cultivars compared to susceptible and highly susceptible ones, whereas dicoumaroyl quinic acid isomer 2 was only higher compared to highly susceptible ones (Figure 6). Luteolin-3-glucuronide, diosmetin-3-glucuronide and acacetin-3-glucuronide and dicoumaroyl quinic acid isomer 2 were 1.9 to 4.3 times higher, respectively, in resistant cultivars compared to highly susceptible cultivars. Coumaroyl quinic acid isomer 2 and dicoumaroyl quinic acid isomer 1 and kaempferol-3-glucuronide were higher in highly susceptible cultivars (Figure 7). They were 1.8 to 5.0 times higher, respectively, in highly susceptible cultivars compared to resistant cultivars. Coumaroyl quinic acid isomer 1 was lower in susceptible cultivars compared to resistant and highly susceptible cultivars, and acacetin-3-rutinoside showed no differences between the resistance levels (Figure S1). The F value for a variable indicates its statistical significance in the discrimination between groups (measure of the extent to which a variable makes a unique contribution to the prediction of group membership). Although some metabolites were excluded in the discriminant analysis according to the F value, they showed significant differences between the resistance levels. For instance, dicaffeoyl quinic acid isomer 1 was about 1.6 times higher, caffeoyl quinic acid was about 1.4 times higher, and apigenin-3-glucuronide was even 2.4 times higher in highly susceptible cultivars compared to resistant and susceptible cultivars, while dicaffeoyl quinic acid isomer 2 was about 2.6 times higher in susceptible cultivars compared to resistant and highly susceptible cultivars (Figure S2).
Table S2 gives an overview on the different shares of the 13 analysed metabolites (in percent of 100) of the total amount of flavonoid glycosides or hydroxycinnamic acid derivatives, respectively. Diosmetin-3-glucuronide, acacetin-3-glucuronide and luteolin-3-glucuronide were higher in the resistant chrysanthemum cultivars compared to susceptible and highly susceptible cultivars, whereas kaempferol-3-glucuronide and caffeoylquinic acid were lower in resistant plants.

4. Discussion

Phenolic compounds constitute a major group of plant biochemicals including simple benzoic acids and quinones, flavonoid glycosides and hydroxycinnamic acid derivatives. Among them ferulic acid, p-coumaric acid, chlorogenic acid, and caffeic acid are well-known hydroxycinnamic acids [29,30,31,32]. For instance, caffeic acid acts as a precursor in the biosynthesis of p-coumaric acid and plays a role in plant insect defence, e.g., as anti-feedant against aphids [33]. Additionally, caffeic acid induced conformational changes in proteases and inhibited their enzymatic activity, which led to a delayed pupation and survival of Helicoverpa armigera larvae in artificial diets [34]. Chlorogenic acid, chemically also named 5-O-caffeoylquinic acid, 3-O-caffeoylquinic acid (neocholorogenic acid) or 4-O-caffeoylquinic acid (cryptochlorogenic acid), depended on the position of the ester bond. The isomer 5-O-caffeoylquinic acid was described as positively associated with thrips resistance in chrysanthemum [15]. In Capsicum plants, chlorogenic acid (isomer identity was not mentioned in the study) was not related to resistance against Western flower thrips, because it was particularly abundant in one of the most susceptible C. annuum accessions in the flowering stage [35]. Additionally, no effect of this metabolite was detected in tomato or carrot plants against Western flower thrips [36,37] and chlorogenic acid in tobacco plants showed no effect on caterpillars of generalist tobacco budworm Chloridea virescens and the specialist tobacco hornworm Manduca sexta [38]. The effects of these metabolites do not seem to be consistent across plant and insect species, and might be dependent on the chemical background of the different plant species and ecophysiology of herbivores. Liu et al. [39] suggested that the bioactivity of metabolites is not merely dependent upon the amount and chemical structure of these metabolites but also on the co-occurrence of other metabolites and their interaction between each other: in this study, chlorogenic acid acted as a regulator of pyrrolizidine alkaloids, which acted against Western flower thrips in Jacobaea vulgaris plants. Berrueta et al. [17] described 4-caffeoylquinic acid as an important compound in resistant apple plants, whereas 4-p-coumaroylquinic acid was associated with susceptible plants in resistance against rosy apple aphids. The authors mentioned that the resistance was based on the different isomerisation ratios of caffeoylquinic and p-coumaroylquinic acids. Our study showed higher concentrations of caffeoylquinic acid and one isomer of coumaroylquinic acid in highly susceptible chrysanthemum plants in the vegetative non-flowering stage. They had a share of 36.5% on the total amount of hydroxycinnamic acids in highly susceptible plants, which was 7.9 percentage points higher than in resistant ones. Although we do not know which isomer of each was present, these results agree with Macel et al. [35] and partly with Berrueta et al. [17]. Since Leiss et al. [15] postulated 5-O-caffeoylquinic acid as important for thrips resistance in chrysanthemum, we must assume that another isomer was measured in our study or that other metabolites were more decisive in the present cultivars. This observation may support the hypothesis that other flavonoid compounds are also important in insect–plant interactions [18,19,20] than certain hydroxycinnamic acids. Especially luteolin and apigenin (or their glycosides) were important for a higher resistance in plants against Western flower thrips [35,37]. In our resistant chrysanthemum cultivars, diosmetin-3-glucuronide, acacetin-3-glucuronide and luteolin-3-glucuronide were higher compared to susceptible and highly susceptible cultivars. The summarised shares of these three flavonoid glycosides were 29.1% in resistant cultivars, 14.5% for susceptible plants and 5.0% for highly susceptible cultivars. Interestingly, the total summary of flavonoid glycosides and hydroxycinnamic acid derivatives were the highest in highly susceptible cultivars. These findings raise intriguing considerations regarding the role in resistance against thrips: a combination of certain flavonoid compounds might play a more important role in resistance, but the role of hydroxycinnamic acid derivatives or their isomerisation ratios and hence their interaction with, e.g., flavonoid glycosides remain unclear. It is also not clear whether the quantity in which the metabolites are present and, correspondingly, the combination thereof played a role. Additionally, differences in the enzymatic activity of polyphenolic oxidases were suggested to be involved in processes, which play a determining role of chlorogenic acid in plant–insect interactions [35,40]. The oxidation process of polyphenolic oxidases is influenced by genotypes, developmental stages and plant tissues [40]. Strong enzymatic activity differences between young and mature leaves and fruits [41,42] or between epidermal and mesophyll tissues [43] were described previously. These differences in activity might have had also an influence in chrysanthemum leaves here, but we did not analyse any polyphenol oxidase activity in the present study.
The quality and accumulation of phenolic compounds is influenced by light, which is required for photosynthesis and hence for the growth, development and metabolic composition of plants [44]. Various studies described an influence of light on phenolic compounds [45,46,47] especially due to the photoprotection of flavonol glycosides at strong light radiation (visible light-induced oxidative damage) [48,49,50]. Hence, an important point we need to consider is that the analysis of metabolites and the determination of resistance levels took place at different time points. Resistance level determination was described by Rogge and Meyhöfer [21] with plants cultivated in the greenhouse over the whole time of the experiment. In the present study, plants were grown in the greenhouse for 3 weeks and then transferred to a climate chamber. In the chamber, the light spectrum ranged from 400 to 700 nm (LUMILUX T5 HO W\865, Osram Licht AG, München, Germany) excluding UV radiation. The quantity of metabolites in these plants might be different compared to plants grown in the greenhouse, because flavonoid glycosides accumulate to a larger extent than other phenylpropanoids in response to UV-B radiation [51]. For example, plant resistance against Anticarsia gemmatalis in one soybean cultivar was increased under UV-B radiation. This was also associated with increased flavonol glycoside concentrations [52]. Hence, a comparative study of chrysanthemum leaves with and without UV radiation would be desirable to analyse whether the phenolic compounds are also present in similar amounts or altered evenly under UV radiation.
Flavonol glycosides are distributed in all above-ground plant parts [48] and have been found within leaves in both the mesophyll and epidermal cells [53,54]. Lab analysis of these phenolic compounds is time consuming compared to a non-destructive in vivo measuring method. To avoid a long-lasting and complex analysis of, e.g., flavonol contents for resistance determination, we used in the current study a hand-held sensor. It estimated the relative flavonol contents in the epidermal cell layers [27,28] and is capable of measuring both the upper (adaxial) and the lower (abaxial) epidermal layer of a leaf depending on how the sensor is applied. Various authors described an accumulation of flavonols in the epidermal cell layers. Depending on the sun radiation, flavonols in leaves of Phillyrea latifolia almost exclusively occurred in the adaxial epidermal layer when the plants were shaded. In sun-irradiated leaves, they accumulated in the adaxial epidermal and subepidermal cells followed by a steep gradient passing to the inner spongy layers [55]. Under high sunlight radiation (UV absence), quercetin and luteolin glycosides accumulated in both the epidermal and the mesophyll cells of Ligustrum vulgare leaves [54,56]. We expected a positive correlation of relative flavanol contents and the HPLC-analysed phenolic compounds in chrysanthemum leaves. Nevertheless, this was not confirmed. Our result might be explained by the fact that the sensor measured the flavonol content in the abaxial epidermal cells, and a laboratory method like the HPLC analysed the whole leaf with all the different cell layers. Weissenböck et al. [53] described a higher flavonol content in epidermal cells compared to mesophyll cells in Pisum sativum. This supports the assumption of small amounts of flavonols in the mesophyll cells; nevertheless, they contribute to an increase in the total amount of flavonols and were detected by the laboratory method accordingly. Furthermore, the analysis of the whole leaf also provided information of flavonol content for the abaxial epidermal cell layer and hence, the flavonol content was disproportionally higher compared to the measured relative flavonol contents. Additionally, the sensor, however, might not always have measured increased flavonol contents due to (a) its operation (it only measured the epidermal cells) and (b) the very small area which is measured with the sensor (5 mm in diameter) [57].
Similarly, chrysanthemum plants in the greenhouse measured with a Dualex sensor in the middle part of the plant showed no clear differences between the cultivars according to their resistance level [21]. The relative flavonol contents varied partly between measurements of the cultivars in spring or in summer for both the vegetative and the generative state. A clear determination of resistance levels by means of total flavonol contents was not possible [21]. Accordingly, in the present study, we wanted to find out whether there were differences between flavonoid glycosides and relative flavonol contents in the different leaf levels and whether they provided information on the respective resistance level. Although there was no correlation between relative flavanol contents and the HPLC-analysed flavonoid glycosides and hydroxycinnamic acid derivatives, a positive correlation between relative flavonol contents and the total amount of phenolic compounds was detected for the generative state (flowering). For several Hypericum species, higher amounts of flavonoid glycosides, e.g., rutin, hypericin or quercetin, were described in the ontogenetic stage ‘flowering’ [58,59,60]. In Calluna vulgaris leaves, the content of hydroxycinnamic acid derivatives and flavonoid glycosides increased also from the vegetative stage to the floral budding and floral state [61]. It seems that flowering plants generally have increased phenolic compound concentrations when they are in bloom. Additionally, leaves of Prunella vulgaris grown in a climate chamber showed high differences in metabolite content in vegetative, bud or flowering stage [62], and various other studies showed a variation of secondary metabolites dependent on the plant organ [63,64,65]. As highlighted in these studies, the results of the present study showed differences in phenolic compound concentrations in different plant stages (HPLC). However, the resistant chrysanthemum cultivars did not show a higher phenolic compound concentration in all stages or leaf positions. A resistance discrimination based on total phenolic contents seems not to be possible. The relative flavonol content measured with Dualex sensor seems not to reflect the analysed flavonoid glycosides and hence seems also not suitable for a resistance level determination. Nevertheless, analysis of single phenolic compounds in chrysanthemum leaves with laboratory methods, like HPLC, is a promising method for resistance level determination in chrysanthemum cultivars. The presented results will help in the future determination of other resistant and respectively susceptible cultivars and contribute to the development of new cultivars during the breeding process.

5. Conclusions

In conclusion, the present study analysed 17 chrysanthemum cultivars in order to investigate in detail the differences in the amounts of phenolic compounds, such as secondary metabolites, present at different ontogenetic stages and leaf position. The findings should contribute to an improved categorisation of resistance levels against thrips, which were investigated in an earlier study [21], and enable the classification of cultivars according to these metabolites in the future. Two methods were used for this investigation: the Dualex® Scientific 4 sensor, a non-destructive method which measures local epidermal flavonoid contents, and HPLC to analyse the flavonoid glycoside and hydroxycinnamic acid derivative concentrations in the whole leaf.
The analysis of relative flavonol content conducted with the Dualex sensor demonstrated distinctive outcomes solely in the vegetative stage in old leaves. However, these outcomes did not correlate with the concentration of flavonoid glycosides or hydroxycinnamic acid derivatives as determined by HPLC analysis. Nevertheless, the sensor was more straightforward to operate, and the measurements could be completed rapidly in comparison to the HPLC method. However, the Dualex sensor is not an optimal choice for precisely defining the thrips resistance levels of different cultivars, in comparison to HPLC, due to the limited area measured and the focus on epidermal flavonol content only.
In contrast, the HPLC analysis of the leaves revealed significant differences in the concentration of flavonoid glycoside and hydroxycinnamic acid derivative concentrations at the vegetative stage in the old leaves. Therefore, the focus on the old leaves provided the most reliable pattern. The results indicated that the cultivars with the highest susceptibility exhibited the highest concentrations of total flavonoid glycosides and hydroxycinnamic acid derivatives in comparison to the susceptible and resistant cultivars. However, in these highly susceptible cultivars, only single phenolic compounds of both classes were present in higher concentrations and not the entirety of the metabolites. This indicates a key role for these compounds in highly susceptible cultivars. With regard to certain single flavonoid glycosides, the resistant chrysanthemum cultivars exhibited higher concentrations of diosmetin-3-glucuronide, acacetin-3-glucuronide, and luteolin-3-glucuronide. In light of these findings, it is recommended that these metabolites can be considered as potential candidates for thrips resistance in chrysanthemum plants. The constitutive concentrations of flavonoid glycosides and hydroxycinnamic acid derivatives, as well as certain single phenolic compounds presented in the current study, could be used for further analysis to support breeding programs for thrips resistance in chrysanthemum in the future. Additionally, it is recommended that future experiments include precise information regarding the position of the leaves and the ontogenetic stage of the plants, as this has an impact on the evaluation of resistance against the Western flower thrips in chrysanthemums.

Supplementary Materials

The following supporting information can be downloaded at https://www.mdpi.com/article/10.3390/horticulturae10080822/s1, Figure S1: Phenolic compounds in different resistance levels with few statistical differences in vegetative state in old leaves. The y-axis scale is logarithmic. Different letters indicate significant differences (p ≤ 0.05) between the resistance level for each metabolite (GLM with Quasi-Poisson distribution, resistant plants n = 30, susceptible plants n = 35, and highly susceptible plants n = 20). Circles indicate outliers with more than 1.5 times box lengths from a hinge of the box.; Figure S2: Phenolic compounds in different resistance levels excluded from the discriminant analysis. The y-axis scale is logarithmic. Different letters indicate significant differences (p ≤ 0.05) between the resistance level for each metabolite (GLM with Quasi-Poisson distribution, resistant plants n = 30, susceptible plants n = 35, and highly susceptible plants n = 20). Circles indicate outliers with more than 1.5 times box lengths from a hinge of the box.; Table S1: Metabolites included in the discriminant analysis (stepwise method); Table S2: Shares in percent (%) of the total amount of flavonoids and shares in percent (%) of the total amount hydroxycinnamic acids in different resistance levels in old leaves in the vegetative stage (resistant plants n = 30, susceptible plants n = 35, and highly susceptible plants n = 20); Table S3: Classification coefficients (Fisher’s linear discriminant functions) for the classification of resistance levels according to nine secondary metabolites in old leaves; values were log + 1 transformed for discriminant analysis.

Author Contributions

S.A.R., S.N., M.S. and R.M. conceived and designed the experiments. S.A.R. performed the experiments. S.A.R. and S.N. analysed the data. S.N., M.S. and R.M. contributed reagents, materials, and analysis tools. S.A.R., S.N., M.S. and R.M. contributed to the writing of the manuscript. R.M. obtained funding and provided resources. All authors have read and agreed to the published version of the manuscript.

Funding

The project was supported by funds of the Federal Ministry of Food and Agriculture (BMEL) based on a decision of the Parliament of the Federal Republic of Germany via the Federal Office for Agriculture and Food (BLE) under the innovation support program (ptble) with the funding number: 2818204215.

Data Availability Statement

The data presented in this study are openly available in the LUH Data Repository at https://doi.org/10.25835/6vi6iwzd, reference number [66].

Acknowledgments

The authors acknowledge Christina Paul for her great help in the greenhouse and sample preparation, as well as Sarah Farrherr for technical assistance regarding the analysis of flavonoid glycosides and hydroxycinnamic acid derivatives. Chrysanthemum plants were kindly provided by Deliflor Chrysanthemums (The Netherlands) and Brandkamp GmbH (Germany).

Conflicts of Interest

The authors declare no conflicts of interest. The funders had no role in the design of the study; in the collection, analyses, or interpretation of data; in the writing of the manuscript; or in the decision to publish the results.

References

  1. Spaargaren, J.; van Geest, G. Chrysanthemum. In Ornamental Crops; Van Huylenbroeck, J., Ed.; Springer International Publishing: Cham, Switzerland, 2018; pp. 319–348. ISBN 978-3-319-90697-3. [Google Scholar]
  2. Kos, S.P.; Klinkhamer, P.G.L.; Leiss, K.A. Cross-resistance of chrysanthemum to western flower thrips, celery leafminer, and two-spotted spider mite. Entomol. Exp. Appl. 2014, 151, 198–208. [Google Scholar] [CrossRef]
  3. Kindt, F.; Joosten, N.N.; Peters, D.; Tjallingii, W.F. Characterisation of the feeding behaviour of western flower thrips in terms of electrical penetration graph (EPG) waveforms. J. Insect Physiol. 2003, 49, 183–191. [Google Scholar] [CrossRef] [PubMed]
  4. Fiene, J.; Kalns, L.; Nansen, C.; Bernal, J.; Harris, M.; Sword, G.A. Foraging on individual leaves by an intracellular feeding insect is not associated with leaf biomechanical properties or leaf orientation. PLoS ONE 2013, 8, e80911. [Google Scholar] [CrossRef]
  5. Kumar, N.K.; Ullman, D.E.; Cho, J.J. Resistance Among Lycopersicon Species to Frankliniella occidentalis (Thysanoptera: Thripidae). J. Econ. Entomol. 1995, 88, 1057–1065. [Google Scholar] [CrossRef]
  6. De Jager, C.M.; Butôt, R.P.; De Jong, T.J.; Klinkhamer, P.G.; Van der Meijden, E. Population growth and survival of western flower thrips Frankliniella occidentalis Pergande (Thysanoptera, Thripidae) on different chrysanthemum cultivars: Two methods for measuring resistance. J. Appl. Entomol. 1993, 115, 519–525. [Google Scholar] [CrossRef]
  7. De Jager, C.M.; Butôt, R.P.; Klinkhamer, P.G.; De Jong, T.J.; Wolff, K.; Van der Meijden, E. Genetic variation in chrysanthemum for resistance to Frankliniella occidentalis. Entomol. Exp. Appl. 1995, 77, 277–287. [Google Scholar] [CrossRef]
  8. Rogge, S.A.; Meyhöfer, R. Leaf age is important for assessment of resistance in chrysanthemum against Frankliniella occidentalis. J. Plant Dis. Prot. 2021, 128, 511–516. [Google Scholar] [CrossRef]
  9. Fung, S.Y.; Kuiper, I.; van Dijke-Hermans, C.M.; Van der Meijden, E. Growth damage and silvery damage in chrysanthemum caused by Frankliniella occidentalis is related to leaf food quality. In Thrips and Tospoviruses, Proceedings of the 7th International Symposium on Thysanoptera, Reggio Calabria, Italy 2–7 July 2001; Australian National Insect Collection: Canberra, Australia, 2002; Volume 191. [Google Scholar]
  10. Rhainds, M.; Shipp, L. Dispersal of Adult Western Flower Thrips (Thysanoptera: Thripidae) on Chrysanthemum Plants: Impact of Feeding-Induced Senescence of Inflorescences. Environ. Entomol. 2003, 32, 1056–1065. [Google Scholar] [CrossRef]
  11. Van Haperen, P.; Voorrips, R.E.; van Loon, J.J.A.; Vosman, B. The effect of plant development on thrips resistance in Capsicum. Arthropod-Plant Interact. 2019, 13, 11–18. [Google Scholar] [CrossRef]
  12. Visschers, I.G.S.; Peters, J.L.; van de Vondervoort, J.A.H.; Hoogveld, R.H.M.; van Dam, N.M. Thrips resistance screening is coming of age: Leaf position and ontogeny are important determinants of leaf-based resistance in pepper. Front. Plant Sci. 2019, 10, 510. [Google Scholar] [CrossRef]
  13. Kogan, M. Natural chemicals in plant resistance to insects. Iowa State J. Res. 1986, 60, 501–527. [Google Scholar]
  14. De Jager, C.M.; Butôt, R.P.; Klinkhamer, P.G.; Van der Meijden, E. Chemical characteristics of chrysanthemum cause resistance to Frankliniella occidentalis (Thysanoptera: Thripidae). J. Econ. Entomol. 1995, 88, 1746–1753. [Google Scholar] [CrossRef]
  15. Leiss, K.A.; Maltese, F.; Choi, Y.H.; Verpoorte, R.; Klinkhamer, P.G.L. Identification of chlorogenic acid as a resistance factor for thrips in chrysanthemum. Plant Physiol. 2009, 150, 1567–1575. [Google Scholar] [CrossRef]
  16. Maharijaya, A.; Vosman, B.; Pelgrom, K.; Wahyuni, Y.; de Vos, R.C.H.; Voorrips, R.E. Genetic variation in phytochemicals in leaves of pepper (Capsicum) in relation to thrips resistance. Arthropod-Plant Interact. 2019, 13, 1–9. [Google Scholar] [CrossRef]
  17. Berrueta, L.A.; Sasía-Arriba, A.; Miñarro, M.; Antón, M.J.; Alonso-Salces, R.M.; Micheletti, D.; Gallo, B.; Dapena, E. Relationship between hydroxycinnamic acids and the resistance of apple cultivars to rosy apple aphid. Talanta 2018, 187, 330–336. [Google Scholar] [CrossRef] [PubMed]
  18. Goławska, S.; Sprawka, I.; Łukasik, I. Effect of saponins and apigenin mixtures on feeding behavior of the pea aphid, Acyrthosiphon pisum Harris. Biochem. Syst. Ecol. 2014, 55, 137–144. [Google Scholar] [CrossRef]
  19. Goławska, S.; Łukasik, I.; Kapusta, I.; Janda, B. Do the contents of luteolin, tricin, and chrysoeriol glycosides in alfalfa (Medicago sativa L.) affect the behavior of pea aphid (Acyrthosiphon pisum)? Pol. J. Environ. Stud. 2012, 21, 1613–1619. [Google Scholar]
  20. Gómez, J.D.; Vital, C.E.; Oliveira, M.G.A.; Ramos, H.J.O. Broad range flavonoid profiling by LC/MS of soybean genotypes contrasting for resistance to Anticarsia gemmatalis (Lepidoptera: Noctuidae). PLoS ONE 2018, 13, e0205010. [Google Scholar]
  21. Rogge, S.A.; Meyhöfer, R. The role of plant physiology and cultivar of chrysanthemum in the resistance against Western flower thrips. Entomol. Exp. Appl. 2021, 169, 275–289. [Google Scholar] [CrossRef]
  22. Cerovic, Z.G.; Ounis, A.; Cartelat, A.; Latouche, G.; Goulas, Y.; Meyer, S.; Moya, I. The use of chlorophyll fluorescence excitation spectra for the non-destructive in situ assessment of UV-absorbing compounds in leaves. Plant Cell Environ. 2002, 25, 1663–1676. [Google Scholar] [CrossRef]
  23. Schmidt, S.; Zietz, M.; Schreiner, M.; Rohn, S.; Kroh, L.W.; Krumbein, A. Identification of complex, naturally occurring flavonoid glycosides in kale (Brassica oleracea var. sabellica) by high-performance liquid chromatography diode-array detection/electrospray ionization multi-stage mass spectrometry. Rapid Commun. Mass. Spectrom. 2010, 24, 2009–2022. [Google Scholar] [CrossRef] [PubMed]
  24. Santin, M.; Neugart, S.; Castagna, A.; Barilari, M.; Sarrocco, S.; Vannacci, G.; Schreiner, M.; Ranieri, A. UV-B pre-treatment alters phenolics response to Monilinia fructicola infection in a structure-dependent way in peach skin. Front. Plant Sci. 2018, 9, 1598. [Google Scholar]
  25. Bilger, W.; Veit, M.; Schreiber, L.; Schreiber, U. Measurement of leaf epidermal transmittance of UV radiation by chlorophyll fluorescence. Physiol. Plant. 1997, 101, 754–763. [Google Scholar] [CrossRef]
  26. Agati, G.; Pinelli, P.; Cortés Ebner, S.; Romani, A.; Cartelat, A.; Cerovic, Z.G. Nondestructive evaluation of anthocyanins in olive (Olea europaea) fruits by in situ chlorophyll fluorescence spectroscopy. J. Agric. Food Chem. 2005, 53, 1354–1363. [Google Scholar] [CrossRef] [PubMed]
  27. Cerovic, Z.G.; Masdoumier, G.; Ghozlen, N.B.; Latouche, G. A new optical leaf-clip meter for simultaneous non-destructive assessment of leaf chlorophyll and epidermal flavonoids. Physiol. Plant. 2012, 146, 251–260. [Google Scholar] [CrossRef]
  28. Pfündel, E.E.; Ben Ghozlen, N.; Meyer, S.; Cerovic, Z.G. Investigating UV screening in leaves by two different types of portable UV fluorimeter reveals in vivo screening by anthocyanins and carotenoids. Photosyn. Res. 2007, 93, 205–221. [Google Scholar] [CrossRef]
  29. Ribéreau-Gayon, P. Plant Phenolics; Oliver and Boyd: Edinburgh, UK, 1972; ISBN 0050025120. [Google Scholar]
  30. Pietta, P.; Minoggio, M.; Bramati, L. Plant Polyphenols: Structure, Occurrence and Bioactivity. In Bioactive Natural Products, 1st ed.; Atta-ur-Rahman, Ed.; Digital Print; Elsevier: Amsterdam, The Netherlands, 2005; pp. 257–312. ISBN 9780444514158. [Google Scholar]
  31. Yoneyama, K.; Natsume, M. Allelochemicals for Plant–Plant and Plant–Microbe Interactions. In Comprehensive Natural Products II: Chemistry and Biology; Mander, L.N., Liu, H., Eds.; Elsevier Science: Oxford, UK, 2010; pp. 539–561. ISBN 9780080453828. [Google Scholar]
  32. Marchiosi, R.; dos Santos, W.D.; Constantin, R.P.; de Lima, R.B.; Soares, A.R.; Finger-Teixeira, A.; Mota, T.R.; de Oliveira, D.M.; Foletto-Felipe, M.d.P.; Abrahão, J.; et al. Biosynthesis and metabolic actions of simple phenolic acids in plants. Phytochem. Rev. 2020, 19, 865–906. [Google Scholar] [CrossRef]
  33. Leszczyǹski, B.; Warchoł, J.; Niraz, S. The influence of phenolic compounds on the preference of winter wheat cultivars by cereal aphids. Insect Sci. Appl. 1985, 6, 157–158. [Google Scholar] [CrossRef]
  34. Joshi, R.S.; Wagh, T.P.; Sharma, N.; Mulani, F.A.; Sonavane, U.; Thulasiram, H.V.; Joshi, R.; Gupta, V.S.; Giri, A.P. Way toward “dietary pesticides”: Molecular investigation of insecticidal action of caffeic acid against Helicoverpa armigera. J. Agric. Food Chem. 2014, 62, 10847–10854. [Google Scholar] [CrossRef]
  35. Macel, M.; Visschers, I.G.S.; Peters, J.L.; Kappers, I.F.; de Vos, R.C.H.; van Dam, N.M. Metabolomics of Thrips Resistance in Pepper (Capsicum spp.) Reveals Monomer and Dimer Acyclic Diterpene Glycosides as Potential Chemical Defenses. J. Chem. Ecol. 2019, 45, 490–501. [Google Scholar] [CrossRef]
  36. Mirnezhad, M. Host Plant Resistance of Tomato Plants to Western Flower Thrips. Ph.D. Thesis, Leiden University, Leiden, The Netherlands, 2011. [Google Scholar]
  37. Leiss, K.A.; Cristofori, G.; van Steenis, R.; Verpoorte, R.; Klinkhamer, P.G.L. An eco-metabolomic study of host plant resistance to Western flower thrips in cultivated, biofortified and wild carrots. Phytochemistry 2013, 93, 63–70. [Google Scholar] [CrossRef] [PubMed]
  38. Bi, J.L.; Felton, G.W.; Murphy, J.B.; Howles, P.A.; Dixon, R.A.; Lamb, C.J. Do Plant Phenolics Confer Resistance to Specialist and Generalist Insect Herbivores? J. Agric. Food Chem. 1997, 45, 4500–4504. [Google Scholar] [CrossRef]
  39. Liu, X.; Vrieling, K.; Klinkhamer, P.G.L. Interactions between Plant Metabolites Affect Herbivores: A Study with Pyrrolizidine Alkaloids and Chlorogenic Acid. Front. Plant Sci. 2017, 8, 903. [Google Scholar] [CrossRef] [PubMed]
  40. Appel, H.M. Phenolics in ecological interactions: The importance of oxidation. J. Chem. Ecol. 1993, 19, 1521–1552. [Google Scholar] [CrossRef] [PubMed]
  41. Lanker, T.; King, T.G.; Arnold, S.W.; Flurkey, W.H. Active, inactive and in vitro synthesized forms of polyphenoloxidase during leaf development. Physiol. Plant. 1987, 69, 323–329. [Google Scholar] [CrossRef]
  42. Felton, G.W.; Donato, K.; Del Vecchio, R.J.; Duffey, S.S. Activation of plant foliar oxidases by insect feeding reduces nutritive quality of foliage for noctuid herbivores. J. Chem. Ecol. 1989, 15, 2667–2694. [Google Scholar] [CrossRef] [PubMed]
  43. Kojima, M.; Conn, E.E. Tissue distributions of chlorogenic acid and of enzymes involved in its metabolism in leaves of Sorghum bicolor. Plant Physiol. 1982, 70, 922–925. [Google Scholar] [CrossRef] [PubMed]
  44. Ballaré, C.L. Light regulation of plant defense. Annu. Rev. Plant Biol. 2014, 65, 335–363. [Google Scholar] [CrossRef] [PubMed]
  45. de Castro, E.M.; Pinto, J.; Bertolucci, S.K.V.; Malta, M.R.; Cardoso, M.d.G.; de MSilva, F.A. Coumarin contents in young Mikania glomerata plants (Guaco) under different radiation levels and photoperiod. Acta Farm. Bonaer. 2007, 25, 387. [Google Scholar]
  46. Liu, Y.; Fang, S.; Yang, W.; Shang, X.; Fu, X. Light quality affects flavonoid production and related gene expression in Cyclocarya paliurus. J. Photochem. Photobiol. B 2018, 179, 66–73. [Google Scholar] [CrossRef]
  47. Saijo, R. Effect of shade treatment on biosynthesis of catechins in tea plants. Plant Cell Physiol. 1980, 21, 989–998. [Google Scholar]
  48. Taiz, L.; Zeiger, E. Plant Physiology, 4th ed.; Spektrum Akad. Verl./Springer: Heidelberg, Germany, 2007; ISBN 9783827418654. [Google Scholar]
  49. Agati, G.; Azzarello, E.; Pollastri, S.; Tattini, M. Flavonoids as antioxidants in plants: Location and functional significance. Plant Sci. 2012, 196, 67–76. [Google Scholar] [CrossRef] [PubMed]
  50. Zoratti, L.; Karppinen, K.; Luengo Escobar, A.; Häggman, H.; Jaakola, L. Light-controlled flavonoid biosynthesis in fruits. Front. Plant Sci. 2014, 5, 534. [Google Scholar] [CrossRef] [PubMed]
  51. Agati, G.; Tattini, M. Multiple functional roles of flavonoids in photoprotection. New Phytol. 2010, 186, 786–793. [Google Scholar] [CrossRef] [PubMed]
  52. Dillon, F.M.; Chludil, H.D.; Zavala, J.A. Solar UV-B radiation modulates chemical defenses against Anticarsia gemmatalis larvae in leaves of field-grown soybean. Phytochemistry 2017, 141, 27–36. [Google Scholar] [CrossRef] [PubMed]
  53. Weissenböck, G.; Hedrich, R.; Sachs, G. Secondary phenolic products in isolated guard cell, epidermal cell and mesophyll cell protoplasts from pea (Pisum sativum L.) leaves: Distribution and determination. Protoplasma 1986, 134, 141–148. [Google Scholar] [CrossRef]
  54. Agati, G.; Biricolti, S.; Guidi, L.; Ferrini, F.; Fini, A.; Tattini, M. The biosynthesis of flavonoids is enhanced similarly by UV radiation and root zone salinity in L. vulgare leaves. J. Plant Physiol. 2011, 168, 204–212. [Google Scholar] [CrossRef]
  55. Agati, G.; Galardi, C.; Gravano, E.; Romani, A.; Tattini, M. Flavonoid distribution in tissues of Phillyrea latifolia L. leaves as estimated by microspectrofluorometry and multispectral fluorescence microimaging. Photochem. Photobiol. 2002, 76, 350–360. [Google Scholar] [CrossRef]
  56. Agati, G.; Stefano, G.; Biricolti, S.; Tattini, M. Mesophyll distribution of ‘antioxidant’flavonoid glycosides in Ligustrum vulgare leaves under contrasting sunlight irradiance. Ann. Bot. 2009, 104, 853–861. [Google Scholar] [CrossRef]
  57. Goulas, Y.; Cerovic, Z.G.; Cartelat, A.; Moya, I. Dualex: A new instrument for field measurements of epidermal ultraviolet absorbance by chlorophyll fluorescence. Appl. Opt. 2004, 43, 4488–4496. [Google Scholar] [CrossRef]
  58. Kazlauskas, S.; Bagdonaitė, E. Paprastosios jonažolės (Hypericum perforatum L.) veikliųjų medžiagų kiekybinė analizė efektyviosios skysčių chromatografijos metodu. Medicina 2004, 40, 975–981. [Google Scholar] [PubMed]
  59. Hosni, K.; Msaada, K.; Taârit, M.B.; Marzouk, B. Phenological variations of secondary metabolites from Hypericum triquetrifolium Turra. Biochem. Syst. Ecol. 2011, 39, 43–50. [Google Scholar] [CrossRef]
  60. Cirak, C.; Radusiene, J.; Camas, N.; Caliskan, O.; Odabas, M.S. Changes in the contents of main secondary metabolites in two Turkish Hypericum species during plant development. Pharm. Biol. 2013, 51, 391–399. [Google Scholar] [CrossRef]
  61. Chepel, V.; Lisun, V.; Skrypnik, L. Changes in the content of some groups of phenolic compounds and biological activity of extracts of various parts of heather (Calluna vulgaris (L.) Hull) at different growth stages. Plants 2020, 9, 926. [Google Scholar] [CrossRef] [PubMed]
  62. Petrova, N.V.; Sazanova, K.V.; Medvedeva, N.A.; Shavarda, A.L. Features of Metabolomic Profiles in Different Stages of Ontogenesis in Prunella vulgaris (Lamiaceae) Grown in a Climate Chamber. Russ. J. Bioorganic Chem. 2019, 45, 906–912. [Google Scholar] [CrossRef]
  63. Popović, Z.; Milošević, D.K.; Stefanović, M.; Vidaković, V.; Matić, R.; Janković, J.; Bojović, S. Variability of six secondary metabolites in plant parts and developmental stages in natural populations of rare Gentiana pneumonanthe. Plant Biosyst. 2021, 155, 816–822. [Google Scholar] [CrossRef]
  64. Achakzai, A.K.K.; Achakzai, P.; Masood, A.; Kayani, S.A.; Tareen, R.B. Response of plant parts and age on the distribution of secondary metabolites on plants found in Quetta. Pak. J. Bot. 2009, 41, 2129–2135. [Google Scholar]
  65. Kowalski, R.; Wolski, T. Evaluation of phenolic acid content in Silphium perfoliatum L. leaves, inflorescences and rhizomes. Electron. J. Pol. Agric. Univ. 2003, 6, 3. [Google Scholar]
  66. Rogge, S.; Neugart, S.; Schreiner, M.; Meyhöfer, R. Dataset: Phenolic Compounds in Different Stages of Ontogenesis in Chrysanthemum—A Potential for Thrips-Resistance Characterisation; LUH Data Repository: Hannover, Germany, 2023. [Google Scholar] [CrossRef]
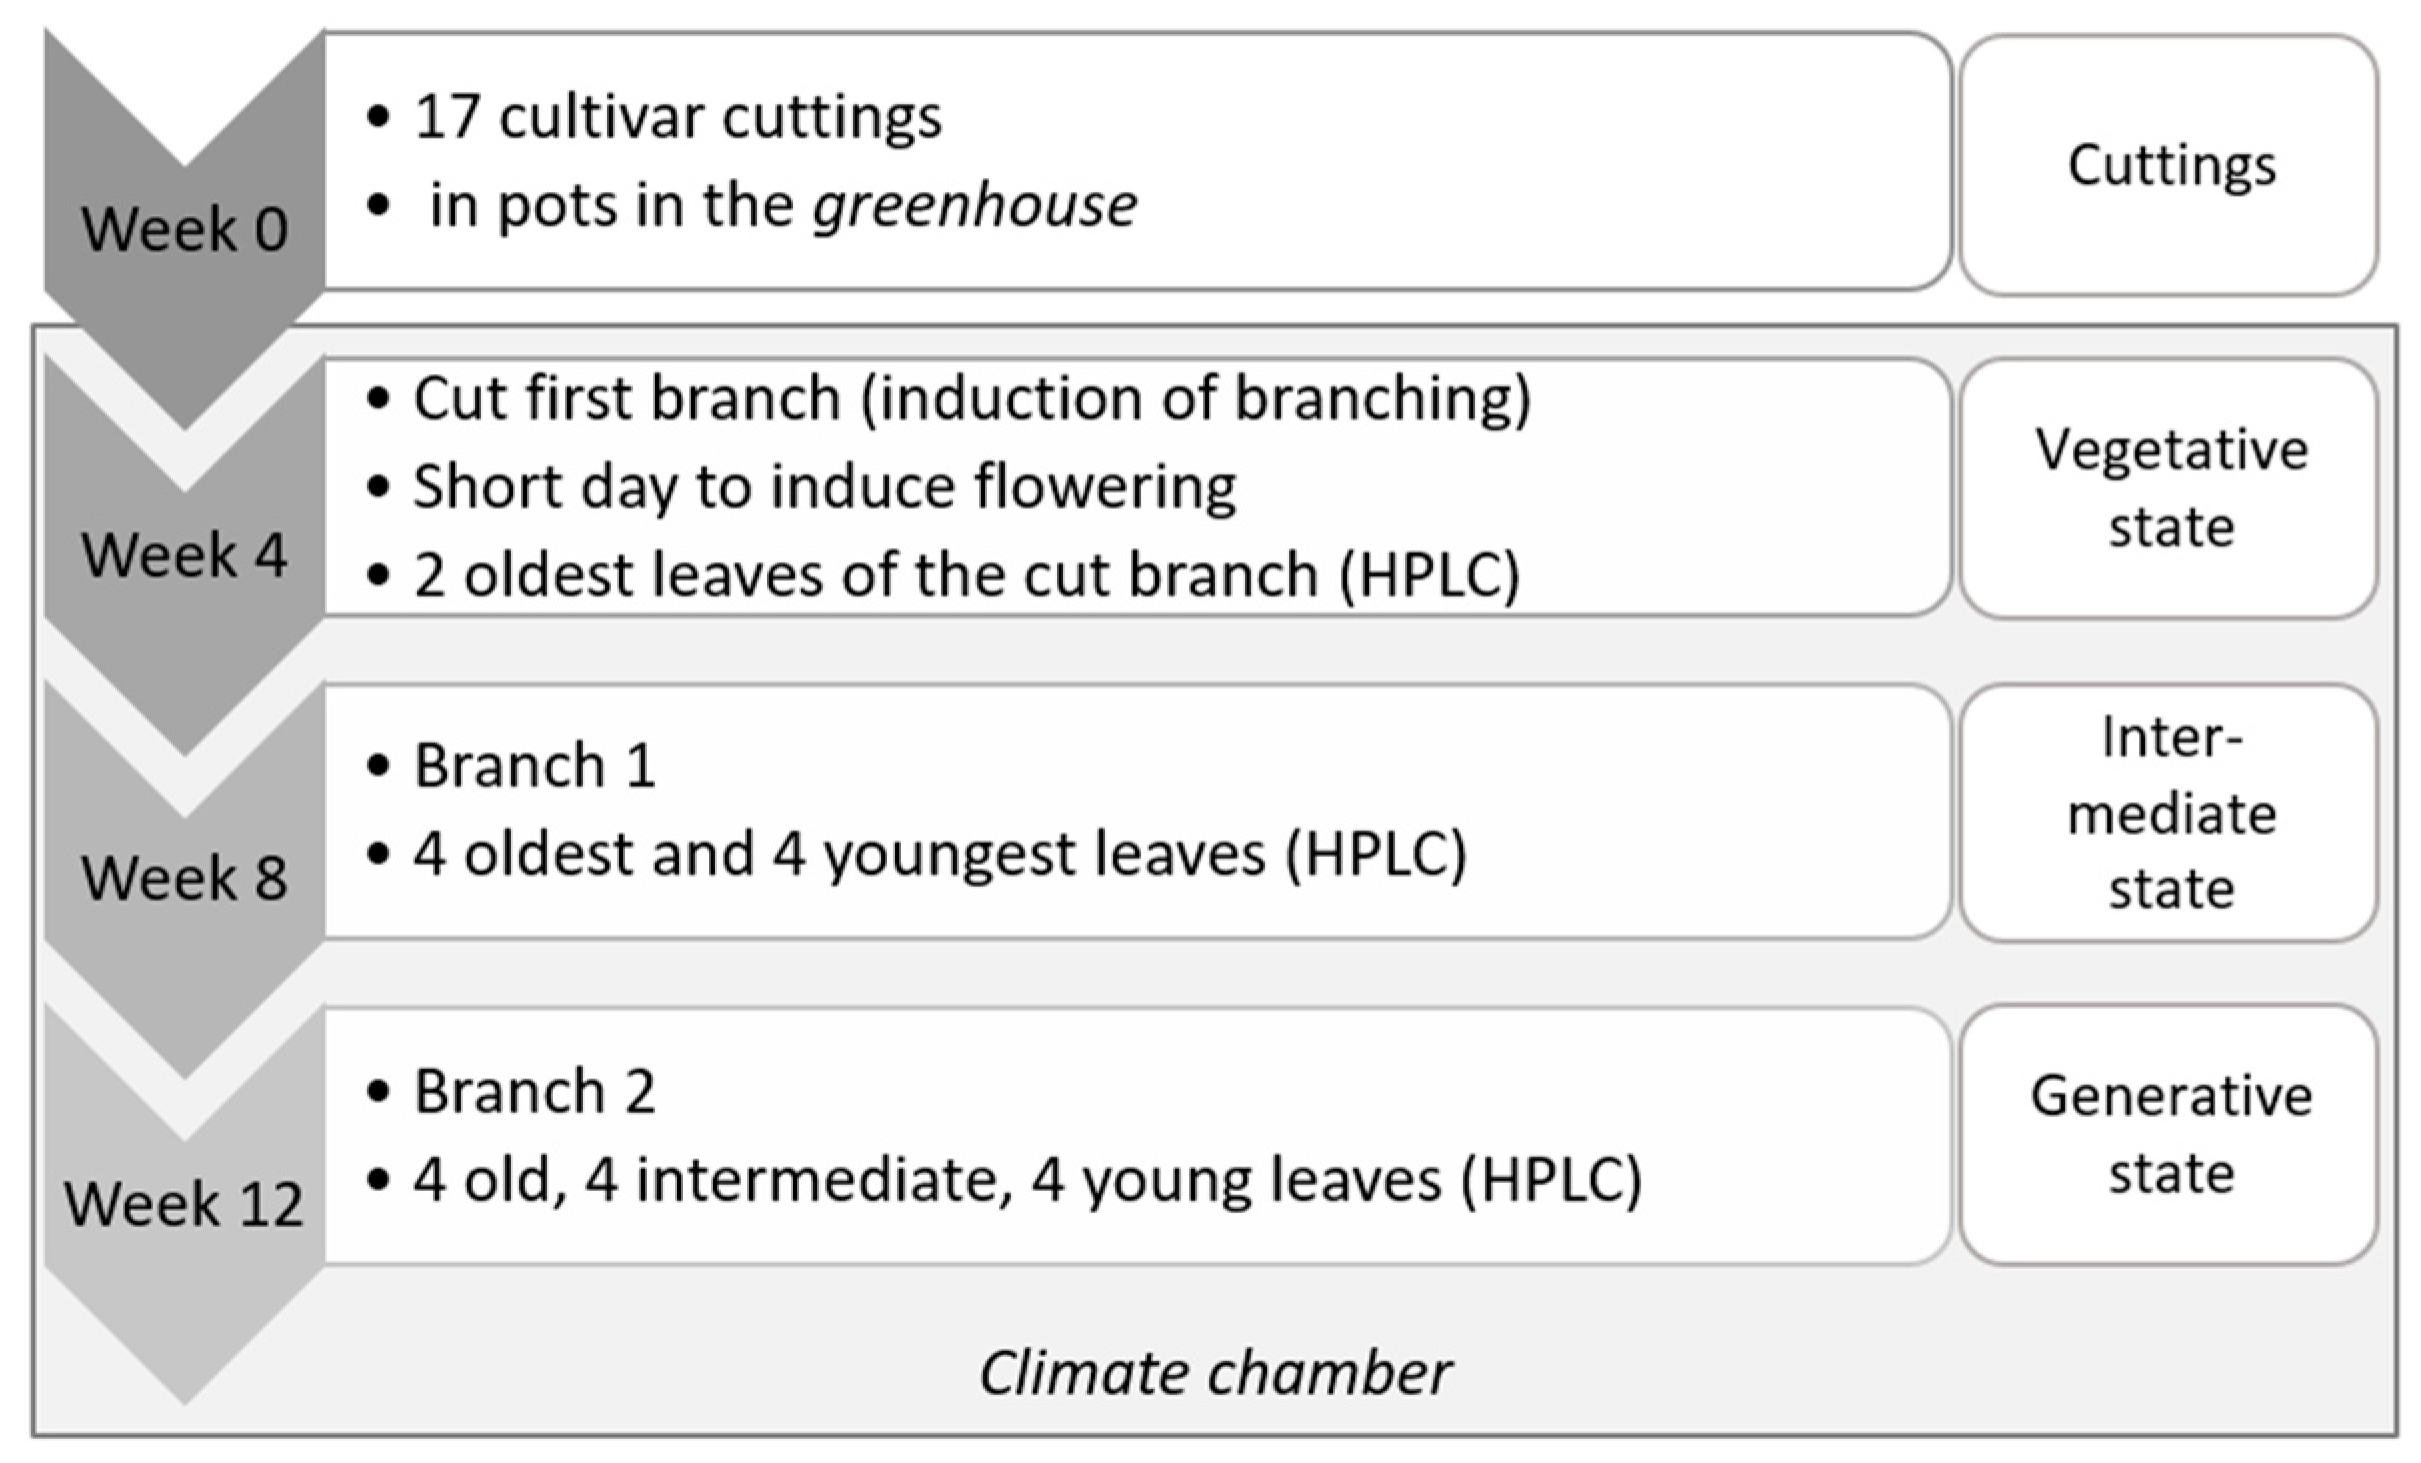
Figure 1. Workflow of the experiment from cutting to the flowering chrysanthemum plants. Week 0 represents the start of the experimental time in the greenhouse, weeks 4 to 12 represent each ontogenetic stage of the plants in the climate chamber. Also shown are the number of leaves that were collected for the HPLC analysis in each week.
Horticulturae 10 00822 g001
Figure 2. Flavonoid glycoside concentration (mg/g dm) in chrysanthemum leaves. Analysed leaf positions were old, intermediate and young in vegetative state, bud state and generative state. Statistical comparison was made within the plant state (vegetative, bud stage, generative) between the resistance levels (resistant, susceptible, highly susceptible) and significant differences are indicated by different letters (GLM with quasi-Poisson distribution, n = 5 for each plant state and position and cultivar). Circles indicate outliers with more than 1.5 times box lengths from a hinge of the box.
Horticulturae 10 00822 g002
Figure 3. Hydroxycinnamic acid derivative concentration (mg/g dm) in chrysanthemum leaves. Analysed leaf positions were old, intermediate and young in vegetative state, bud state and generative state. Statistical comparison was made within the plant state (vegetative, bud stage, generative) between the resistance levels (resistant, susceptible, highly susceptible) and significant differences are indicated by different letters (GLM with quasi-Poisson distribution, n = 5 for each plant state and position and cultivar). Circles indicate outliers with more than 1.5 times box lengths from a hinge of the box.
Horticulturae 10 00822 g003
Figure 4. Relative epidermal flavonol content (abaxial) in chrysanthemum leaves measured with the Dualex device. Analysed leaf positions were old, intermediate and young in vegetative state, bud state and generative state. Statistical comparison was made within the plant state (vegetative, bud stage, generative) between the resistance levels (resistant, susceptible, highly susceptible), and significant differences are indicated by different letters (GLM with quasi-Poisson distribution, n = 5 for each plant state and position and cultivar). Circles indicate outliers with more than 1.5 times box lengths from a hinge of the box.
Horticulturae 10 00822 g004
Figure 5. Scatterplot out of the discriminant analysis with two discriminant function values. Shown are three groups: resistant (n = 30, rhombus), susceptible (n = 35, large circle) and highly susceptible (n = 20, small circle). The discrimination was accomplished using nine secondary metabolites analysed in old leaves of vegetative chrysanthemum plants (log-transformed data).
Horticulturae 10 00822 g005
Figure 6. Phenolic compounds in different resistance levels enhanced in resistant cultivars in vegetative state in old leaves. The y-axis scale is logarithmic. Different letters indicate significant differences (p ≤ 0.05) between the resistance level for each metabolite (GLM with Quasi-Poisson distribution, resistant plants n = 30, susceptible plants n = 35, and highly susceptible plants n = 20). Circles indicate outliers with more than 1.5 times box lengths from a hinge of the box.
Horticulturae 10 00822 g006
Figure 7. Phenolic compounds in different resistance levels enhanced in highly susceptible cultivars in vegetative state in old leaves. The y-axis scale is logarithmic. Different letters indicate significant differences (p ≤ 0.05) between the resistance levels for each metabolite (GLM with quasi-Poisson distribution, resistant plants n = 30, susceptible plants n = 35, and highly susceptible plants n = 20). Circles indicate outliers with more than 1.5 times box lengths from a hinge of the box.
Horticulturae 10 00822 g007
Table 1. Chrysanthemum cultivars with resistance levels according to Rogge and Meyhöfer [21]. Resistance levels were resistant (r), susceptible (s) and highly susceptible (ss). The cultivars were numbered in the former study for data protection reasons. The according number is given in brackets after the cultivar name in the table.
Cultivar NameResistant CultivarsCultivar NameSusceptible CultivarsCultivar NameHighly Susceptible Cultivars
Aviso (8)rKowloon (30)sKanok (9)ss
Colombo Apricot (3)rMumbai
Orange (42)
sMumbai Red (10)ss
Dragona (4)rPalm Green (7)sPemba
Canari (6)
ss
Luzon Pink (2)rPemba Purple (36)sYala (1)ss
Mega Time Gold (5)rPemba Red (38)s
Robinho (26)rSolta (44)s
Vyking (35)s
Table 2. Test of equality of group means (one-way ANOVA, logarithmic values) for metabolites in the vegetative state in old leaves. Wilk’s lambda statistic was used to assess the extent to which each level of the independent variable contributes to the model (value 0 indicating total discrimination and 1 indicating no discrimination).
MetaboliteWilks-LambdaFdf1df2p-Value
caffeoyl quinic acid0.8666.3622820.003
coumaroyl quinic acid isomer 10.8377.9832820.001
coumaroyl quinic acid isomer 20.8437.6392820.001
luteolin-3-glucuronide0.70317.327282<0.001
kaempferol-3-glucuronide0.8059.947282<0.001
dicaffeoyl quinic acid isomer 10.9671.4042820.251
dicaffeoyl quinic acid isomer 20.9751.0502820.355
apigenin-3-glucuronide0.76612.555282<0.001
diosmetin-3-glucuronide0.8467.4562820.001
dicoumaroyl quinic acid isomer 10.66520.630282<0.001
dicoumaroyl quinic acid isomer 2 0.9850.6252820.538
acacetin-3-rutinoside 0.9571.8362820.166
acacetin-3-glucuronide 0.74613.940282<0.001
Disclaimer/Publisher’s Note: The statements, opinions and data contained in all publications are solely those of the individual author(s) and contributor(s) and not of MDPI and/or the editor(s). MDPI and/or the editor(s) disclaim responsibility for any injury to people or property resulting from any ideas, methods, instructions or products referred to in the content.