Article

Genome-Wide Analysis of the TIFY Gene Family in Three Cymbidium Species and Its Response to Heat Stress in Cymbidium goeringii

1
College of Forestry, Fujian Agriculture and Forestry University, Fuzhou 350002, China
2
Key Laboratory of National Forestry and Grassland Administration for Orchid Conservation and Utilization at College of Landscape Architecture and Art, Fujian Agriculture and Forestry University, Fuzhou 350002, China
*
Authors to whom correspondence should be addressed.
Horticulturae 2024, 10(8), 796; https://doi.org/10.3390/horticulturae10080796
Submission received: 1 July 2024 / Revised: 25 July 2024 / Accepted: 26 July 2024 / Published: 27 July 2024
(This article belongs to the Section Genetics, Genomics, Breeding, and Biotechnology (G2B2))

Abstract

:
The TIFY family is a plant-specific gene family that is involved in regulating a variety of plant processes, including developmental and defense responses. The Cymbidium species have certain ornamental and ecological value. However, the characteristics and functions of TIFY genes in Cymbidium remain poorly understood. This study conducted a genome analysis of the TIFY gene family in Cymbidium goeringii, C. ensifolium, and C. sinense and investigated their physicochemical properties, phylogenetic relationships, gene structures, and expression patterns under heat stress in C. goeringii. C. goeringii (26), C. ensifolium (19), and C. sinense (21). A total of 66 TIFY genes were identified, and they were classified into four subfamilies (JAZ, ZML, PPD, and TIFY) based on their systematic evolutionary relationships. Sequence analysis showed that TIFYs contained a conserved TIFY domain and that genes within the same subfamily had structural similarity. Analysis of cis-regulatory elements revealed that these genes contain numerous light-responsive elements and stress-responsive elements. We subjected C. goeringii (16 h light/8 h dark) to 24 h of 38 °C high-temperature stress in a climate chamber. Additionally, results from RT-qPCR experiments showed that under heat stress, the expression levels of eight genes in C. goeringii show significant differences. Among them, the JAZ subfamily exhibited the strongest response to heat stress, initially showing upregulation followed by a downregulation trend. In conclusion, this study investigated the role of TIFY genes in three Cymbidium species, providing insights into C. goeringii under heat stress.

1. Introduction

The TIFY family genes are a characteristic group of transcription factors in plants, initially identified in Arabidopsis thaliana as belonging to the GATA transcription factor family. The TIFY gene family can be further classified into four major subfamilies, including TIFY, JAZ (jasmonate-ZIM-domain), PPD (PEAPOD), and ZML (ZIM/ZIM-like). All TIFY genes contain a highly conserved domain (TIF[F/Y] XG); hence, they are named the TIFY gene family [1]. Proteins within the TIFY subfamily are characterized by the presence of a conserved TIFY domain, which is also shared by the remaining three subfamilies. In addition to the conserved TIFY domain, each of the other three subfamilies possesses unique specific domains that differentiate them from one another. Proteins in the ZML subfamily not only contain the TIFY domain but also possess a CCT and a C2C2-GATA domain [2]. The JAZ subfamily lacks the GATA and CCT domains but contains another conserved Jas domain. Additionally, it harbors a unique conserved sequence SLX2FX2KRX2RX5PY near the C-terminus [3,4]. Proteins in the PPD subfamily possess an N-terminal PPD domain, and PPD proteins are exclusively expressed in dicotyledonous plants [2,3].
TIFY transcription factors play crucial roles in plant growth and development, such as seed development [5,6], flowering [7,8,9,10], and responses to abiotic stress [11,12]. There are numerous reports on their involvement in plant growth and development. For instance, AtTIFY1 in A. thaliana has been shown to be essential for the elongation of petioles and hypocotyls [13]. Currently, the AtTIFY4a and AtTIFY4b genes in A. thaliana have been found to be associated with leaf growth [14], while JAZ4/8 is involved in leaf senescence in A. thaliana [15]. Abiotic stress, including cold, heat, drought, salinity, flooding, and nutrient deficiency, significantly affects wild plants [16]. The TIFY gene family plays a critical role in responding to abiotic stresses. For example, JAZ7 in A. thaliana has been found to be involved in drought stress [17]. In Triticum durum, under high salinity conditions, transgenic lines overexpressing TdTIFY11a exhibit higher germination and growth rates compared to wild-type plants [18]. Additionally, ClJAZ1 and ClJAZ7 in watermelon exhibit the most significant increase in expression under JA and drought treatments, suggesting they may play a significant role in regulating drought stress responses through the JA-mediated signaling pathway [19].
The orchid family is one of the largest and most diverse groups among angiosperms. Cymbidium comprises approximately 80 species and is one of the most highly ornamental and widely cultivated orchid genera, possessing significant ecological and economic value [20]. In 2022, the global orchid market capacity reached up to one hundred million yuan (RMB); at the same time, the Chinese orchid market capacity rose up to one hundred million yuan. Research on the TIFY gene family in Cymbidium has been limited, although there has been an increase in research related to abiotic stress. In recent years, there have been many related studies on the genus orchid, mainly in salt stress [21], plant hormones [22,23], low-temperature stress [24], and high-temperature stress [25]. Previous studies on various stresses affecting orchids have laid the foundation and offered new insights for our research.
This study comprehensively investigated the TIFY gene family in three Cymbidium species using methods such as phylogenetic tree construction, gene structure analysis, collinearity analysis, and cis-regulatory element analysis. Additionally, it analyzed the expression patterns of CgTIFY genes in eight C. goeringii under heat stress. Studying the role of the TIFY gene family in Cymbidium is of significant importance for breeding and innovation of Cymbidium germplasm resources. Investigating the regulatory function of the TIFY gene family in the heat stress response of C. goeringii can fill the research gap in the TIFY gene family in Cymbidium, provide a foundation for studying the stress response in these plants, and offer insights for the selection and innovation of germplasm resources in the Cymbidium species.

2. Methods

2.1. Data Source

The genomes of C. goeringii and C. sinense were retrieved from the National Center for Biotechnology Information (NCBI: https://www.ncbi.nlm.nih.gov/ (accessed on 3 May 2024)), with numbers PRJNA749652 and PRJNA174386, respectively. The genome of C. ensifolium accession number is PRJCA005355 (NGDC). The A. thaliana TIFY protein sequence was downloaded from TAIR, and the O. sativa TIFY protein sequence was downloaded from Phytozome v13. Additionally, the Hidden Markov Model (HMM) for TIFY (PF06200) was downloaded from Pfam (http://pfam.xfam.org/, accessed on 3 May 2024).

2.2. Experimental Materials

The plant materials used in this study were wild-type specimens grown under natural conditions in the greenhouse of the Forest Orchid Garden at Fujian Agriculture and Forestry University. These plants were cultivated at a height of 10 m, with temperatures ranging between 25 °C and 30 °C. This study applied heat stress treatment for 24 h under a photoperiod of 16 h of light and 8 h of dark. Samples were collected at 0 h, 6 h, 12 h, 18 h, and 24 h after exposure to high temperatures of 38 °C, quickly frozen in liquid nitrogen, and stored in a −80 °C freezer.

2.3. Identification and Physicochemical Properties of the TIFY Proteins

We utilized the sequences of 18 AtTIFYs from A. thaliana as probes to conduct Blastp search in TBtools v2.096 software (setting the E-value to 1 × 10⁻⁵) [26] to compare against the genome files of three Cymbidium species. Subsequently, we used the NCBI BlastP function (https://blast.ncbi.nlm.nih.gov/Blast.cgi?PROGRAM=blastp&PAGE_TYPE=BlastSearch&LINK_LOC=blasthome, accessed on 3 May 2024) for further comparison. We employed HMMER to query protein sequences containing the TIFY conserved domain, setting the E-value to 10−5 [27]. Verification of the presence of this domain was performed using NCBI Batch CDD (https://www.ncbi.nlm.nih.gov/Structure/bwrpsb/bwrpsb.cgi, accessed on 25 May 2024). Redundant genes were removed, and genes containing the domain were ultimately identified as members of the TIFY gene family. The obtained proteins were analyzed for their physicochemical properties using the online tool ExPASy (https://www.expasy.org/, accessed on 3 May 2024), including amino acids, isoelectric point (pI), molecular weight (MW), grand average of hydropathicity (GRAVY), instability index (II), and aliphatic index (AI) [28]. We conducted subcellular localization prediction using the online tool Cell-PLoc 2.0 (at http://www.csbio.sjtu.edu.cn/bioinf/Cell-PLoc-2/, accessed on 3 May 2024).

2.4. Phylogenetic Analysis of TIFY Genes

We imported the TIFY protein sequences of C. goeringii (26 CgTIFYs), C. ensifolium (19 CeTIFYs), C. sinense (21 CsTIFYs), A. thaliana (18 TIFYs), and O. sativa (20 OsTIFYs) into MEGA 11.0 software. Multiple sequence alignments were performed using the Muscle program with default settings. We constructed an evolutionary tree comprising 104 protein sequences using the Neighbor-Joining (NJ) method, with 1000 bootstrap replicates. The evolutionary tree was then optimized and annotated using the online tool Evolview 3.0 [29].

2.5. Protein Conservative Domain and Gene Structure Analysis

We analyzed the conserved domains of TIFY genes using the CDD tool provided by the NCBI online platform (https://www.ncbi.nlm.nih.gov/Structure/bwrpsb/bwrpsb.cgi, accessed on 5 May 2024). Subsequently, we identified and downloaded the conserved motifs of the genes using the online software MEME (http://meme-suite.org/, accessed on 5 May 2024) [30]. To integrate a comprehensive comparative map of the phylogenetic tree, conserved proteins, and gene structures, we utilized TBtools v2.096.

2.6. Collinearity and Location Analysis on Chromosome

To analyze the chromosomal locations of TIFY genes in three Cymbidium species, we obtained positional information using TBtools v2.096 software. Subsequently, we constructed physical maps of TIFY genes. We used the TIFY gene location information and genome files of three Cymbidium species: C. goeringii, C. ensifolium, and C. sinense. We constructed the physical maps of these genes. To construct the synteny relationships among the three Cymbidium species, we employed the One-Step MCScanX program in TBtools v2.096 [26].

2.7. Cis-Acting Regulatory Element Analysis of TIFY Genes

To identify potential cis-elements in the promoters, we extracted gene sequences located 2000 bp upstream of the start codon from the genomes of three Cymbidium species [30]. This was conducted to identify potential cis-elements in the promoters. The cis-regulatory elements in the promoter regions of the TIFY genes were analyzed using the PlantCARE online tool (https://bioinformatics.psb.ugent.be/webtools/plantcare/html/, accessed on 6 May 2024) [31]. Next, the data were processed and organized using Excel 2020, and then the results were visualized with TBtools v2.096.

2.8. GO Analysis

To provide a more comprehensive description of the functions and properties of proteins in the three Cymbidium species, we employed the Gene Ontology (GO) method. We retrieved GO protein files for C. goeringii, C. ensifolium, and C. sinense from their genomes in the UniProt database. Using the GOSeq R package 3.5.1, the research conducted GO enrichment analysis on members of the TIFY gene family in these three Cymbidium species, revealing potential biological processes, cellular components, and molecular functions.

2.9. RT-qPCR Analysis

The leaf FPKM values of the screened CgTIFYs were compared, and genes with relatively high expression levels were selected for qRT-PCR analysis. The expression patterns of TIFYs were further analyzed using real-time quantitative PCR (qRT-PCR). Total RNA was extracted from C. goeringii leaves using the FastPure Plant Total RNA Isolation Kit (Vazyme Biotech Co., Ltd., Nanjing, China). Subsequently, first-strand cDNA was synthesized using the TransScript® All-in-One First-Strand cDNA Synthesis SuperMix for qPCR (TransGen Biotech Co., Ltd., Beijing, China). Primers for the candidate genes and the reference gene for qRT-PCR were designed using Primer Premier 5 software. Primer specificity was confirmed using Primer-BLAST on the NCBI website (https://www.ncbi.nlm.nih.gov/tools/primer-blast/, accessed on 20 May 2024). qRT-PCR detection was performed using Hieff® qPCR SYBR Green Master Mix (Low Rox Plus) (Yeasen Biotech Co., Ltd., Shanghai, China). The gene CgActin served as the internal reference gene (sequences shown in Table S5) [32]. The relative expression of target genes was determined using the 2−ΔΔCT method (using 0 h as a reference). All RT-qPCR analyses were conducted with three technical replicates.

3. Results

3.1. Identification and Physicochemical Properties of the TIFYs

We screened the whole genomes of C. goeringii, C. ensifolium, and C. sinense, identifying 26, 19, and 21 TIFY genes using local BLAST programs and the Pfam tool in tbtools v2.096. Based on their chromosomal distribution from top to bottom, they were respectively named CgTIFY1–CgTIFY26, CeTIFY1–CeTIFY19, and CsTIFY1–CsTIFY21. Additionally, we analyzed the physicochemical properties of the TIFY proteins using the Expasy online tool (Table S1). The TIFY proteins showed significant variation in amino acid (AA) length, ranging from 108 AA (CgTIFY2) to 494 AA (CgTIFY16), with an average of 260 AA. The molecular weight (MW) of the 66 TIFY genes ranged from 11.60 kDa (CgTIFY1 and CgTIFY2) to 55.84 kDa (CgTIFY16), with an average of 28 kDa. The theoretical isoelectric point (pI) ranged from 5.50 (CeTIFY16) to 10.03 (CeTIFY11), with 45 TIFYs having a pI greater than 7.0, indicating they are basic, while the remaining 21 TIFY genes had a pI less than 7.0, indicating they are acidic. The instability index (II) varied from 36.98 (CsTIFY21) to 77.49 (CgTIFY26). The aliphatic index (AI) ranged from 52.87 (CgTIFY10, CeTIFY8, and CsTIFY10) to 80.99 (CsTIFY9). The obtained grand average of hydropathy (GRAVY) scores were all negative, indicating that TIFY proteins are predominantly hydrophilic (GRAVY < 0). The subcellular localization prediction results for 66 TIFY proteins indicate nuclear distribution, suggesting that these genes may be involved in transcriptional regulation.

3.2. Phylogenetic Analysis of TIFY Genes

To better analyze and classify the phylogenetic relationships of TIFY genes in the three Cymbidium species, we constructed a phylogenetic tree comprising TIFY genes from C. goeringii (26 CgTIFYs), C. ensifolium (19 CeTIFYs), C. sinense (21 CsTIFYs), A. thaliana (18 TIFYs), and O. sativa (20 OsTIFYs). The 104 TIFY genes were divided into four subfamilies: ZML (15 genes), TIFY (seven genes), PPD (five genes), and JAZ (77 genes) (Figure 1). Notably, the JAZ subfamily had the most members, with seventy-seven TIFY genes, while the PPD subfamily had the fewest members, with only five TIFY genes.

3.3. Gene Structure and Motif Analysis of TIFY Genes

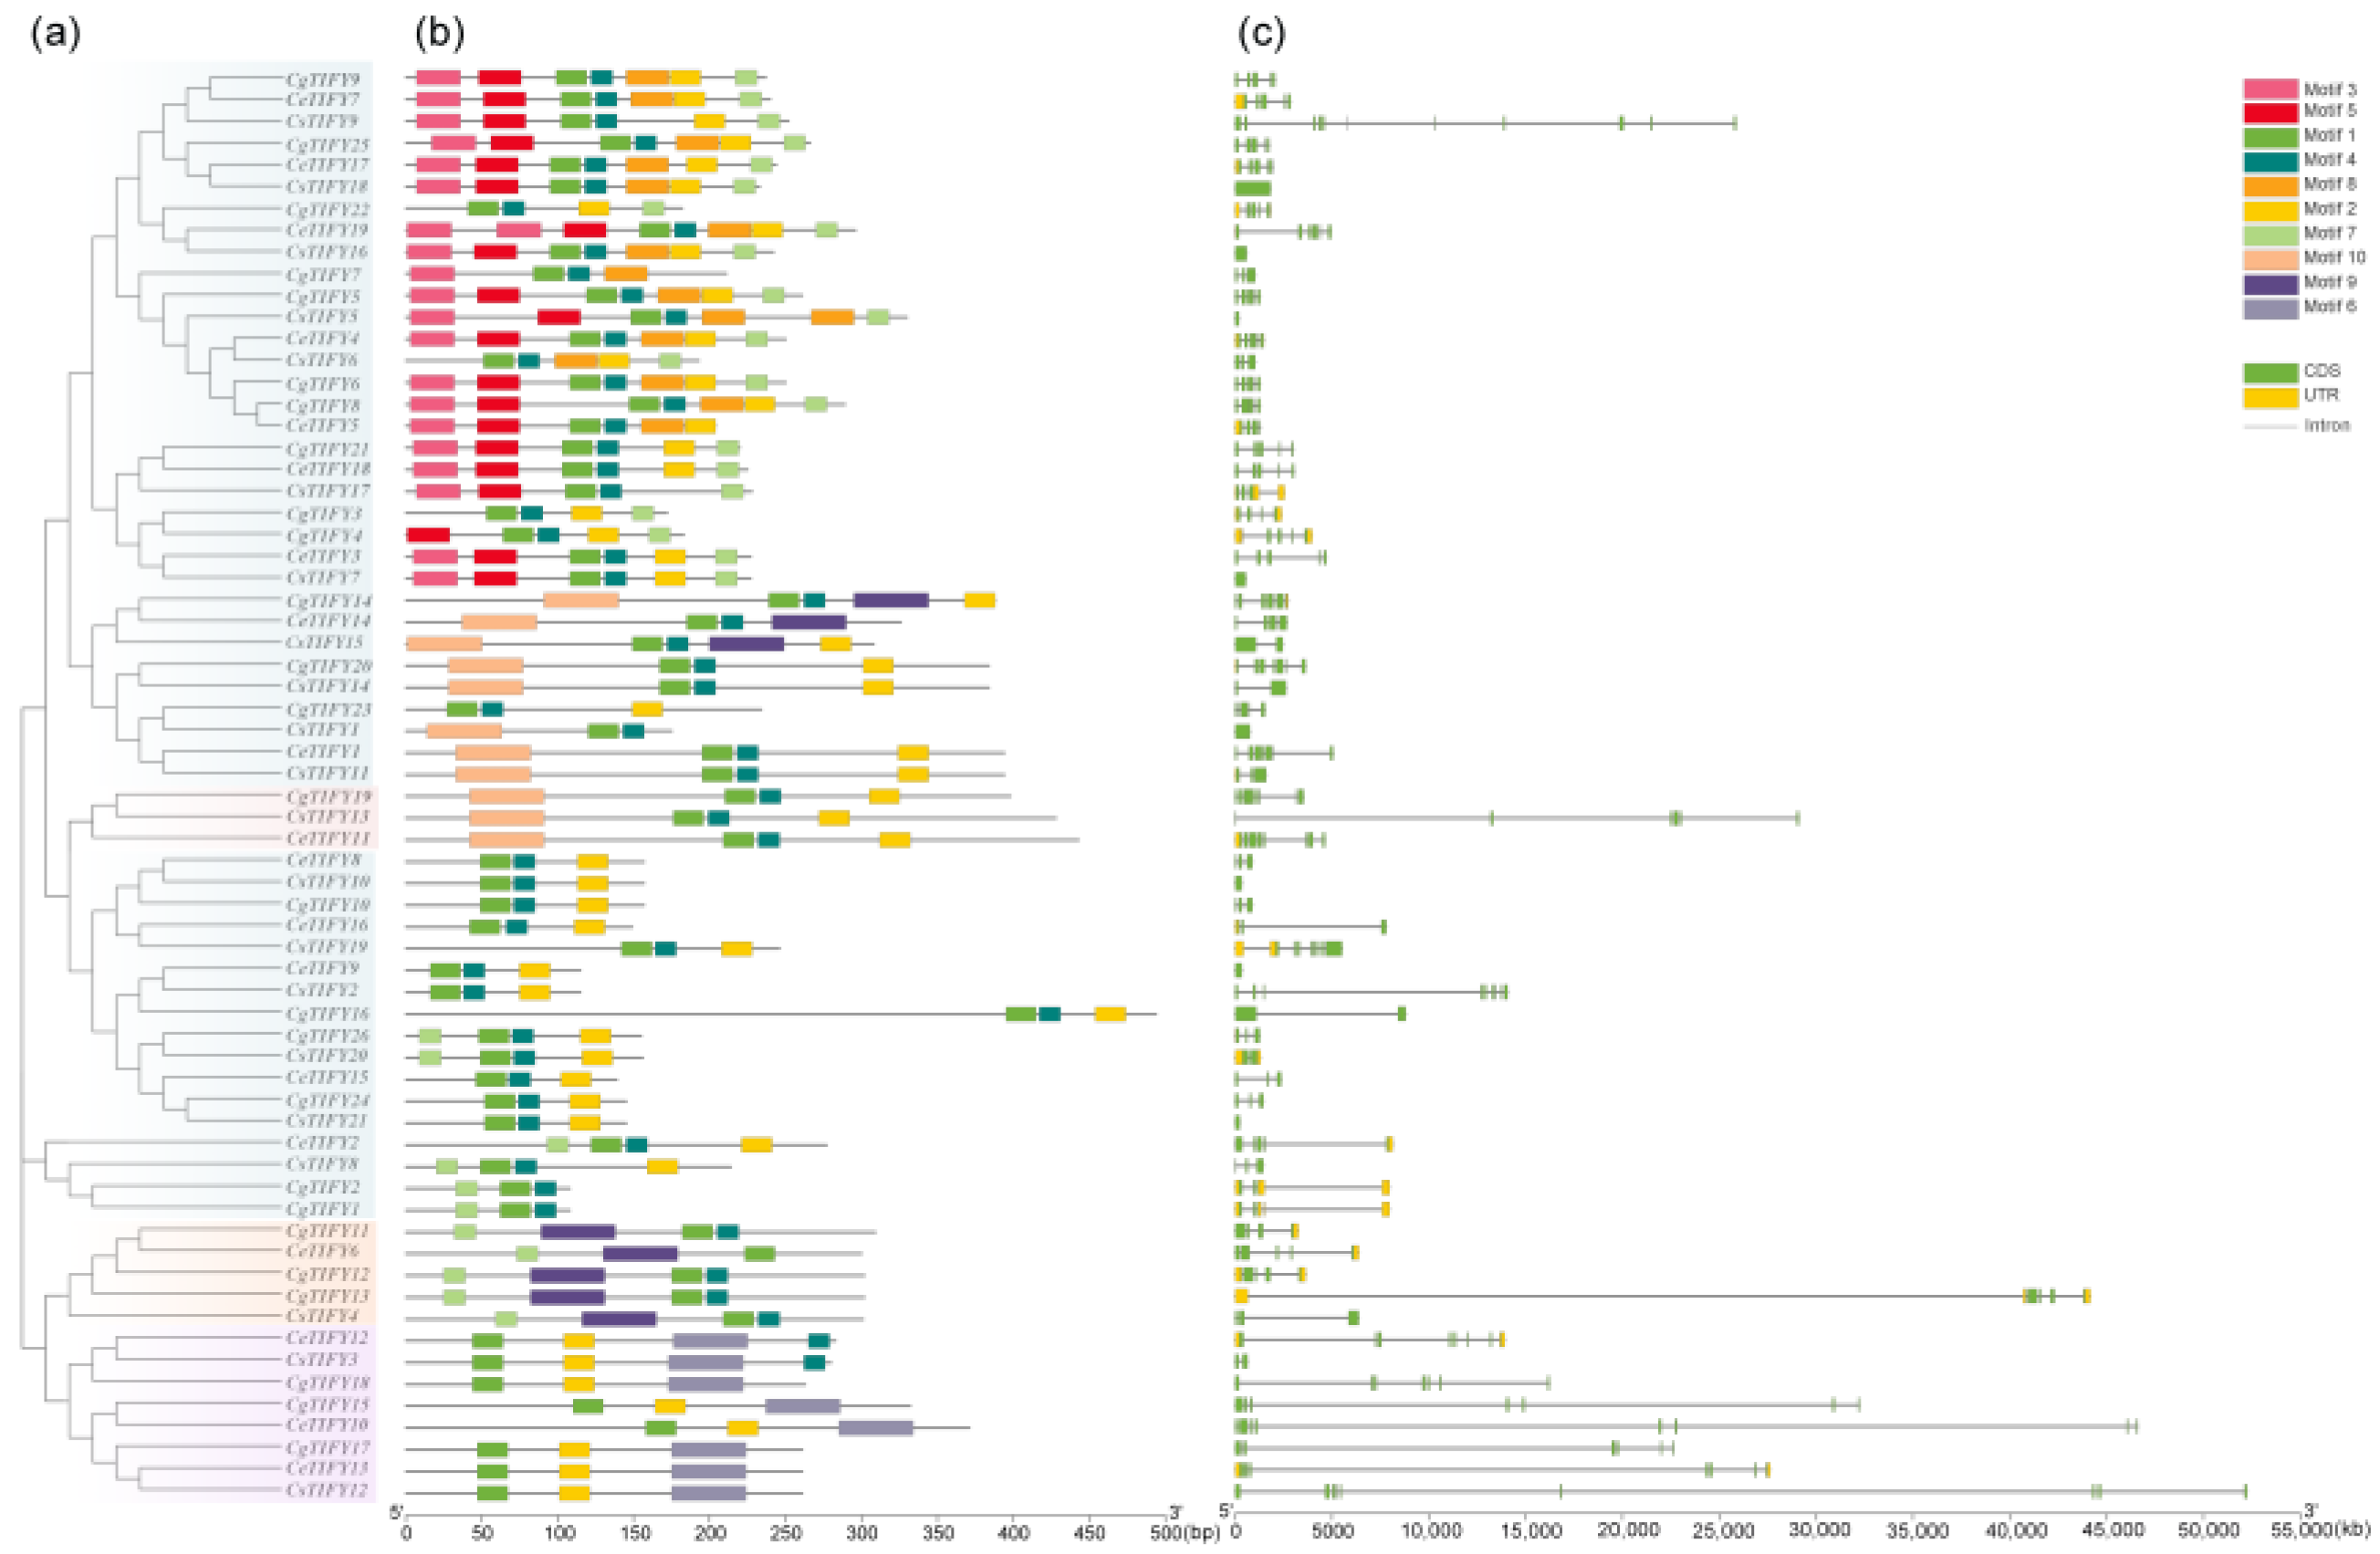
We analyzed their conserved protein motifs using the MEME website, naming them motif1 to motif10, and obtained their sequences and logos. This allowed us to gain deeper insights into the genetic structure of TIFY genes in the three Cymbidium species (Table S2). Among these motifs, motif1 was the most conserved, as it was present in all 66 TIFY members (Figure 2b). On the contrary, motif6 is exclusive to members of the ZML subfamily, while motif2 is exclusive to members of the JAZ subfamily. Motif3 is present in the C-terminus of certain JAZ subfamily members, while motif6 is located in the N-terminus of the TIFY subfamily. The range and order of the motif supply more possibilities for protein functions. To explore the structural diversity of TIFY genes, we conducted an analysis of the exon-intron structure (Figure 2c). The number of introns in TIFY genes ranged from 0 to 10. In general, the number and structure of exons and introns are similar within the same subfamily. Among them, seven genes lack introns, accounting for 10% of the total. The TIFY subfamily exhibits longer introns compared to other subfamilies. Sequence alignments from the three Cymbidium species indicate that members of the TIFY gene family in these three Cymbidium species possess a conserved TIFY domain. Furthermore, proteins belonging to the JAZ subfamily include not only the TIFY domain but also the Jas domain (Figure 3).

3.4. Collinearity and Location Analysis on Chromosome

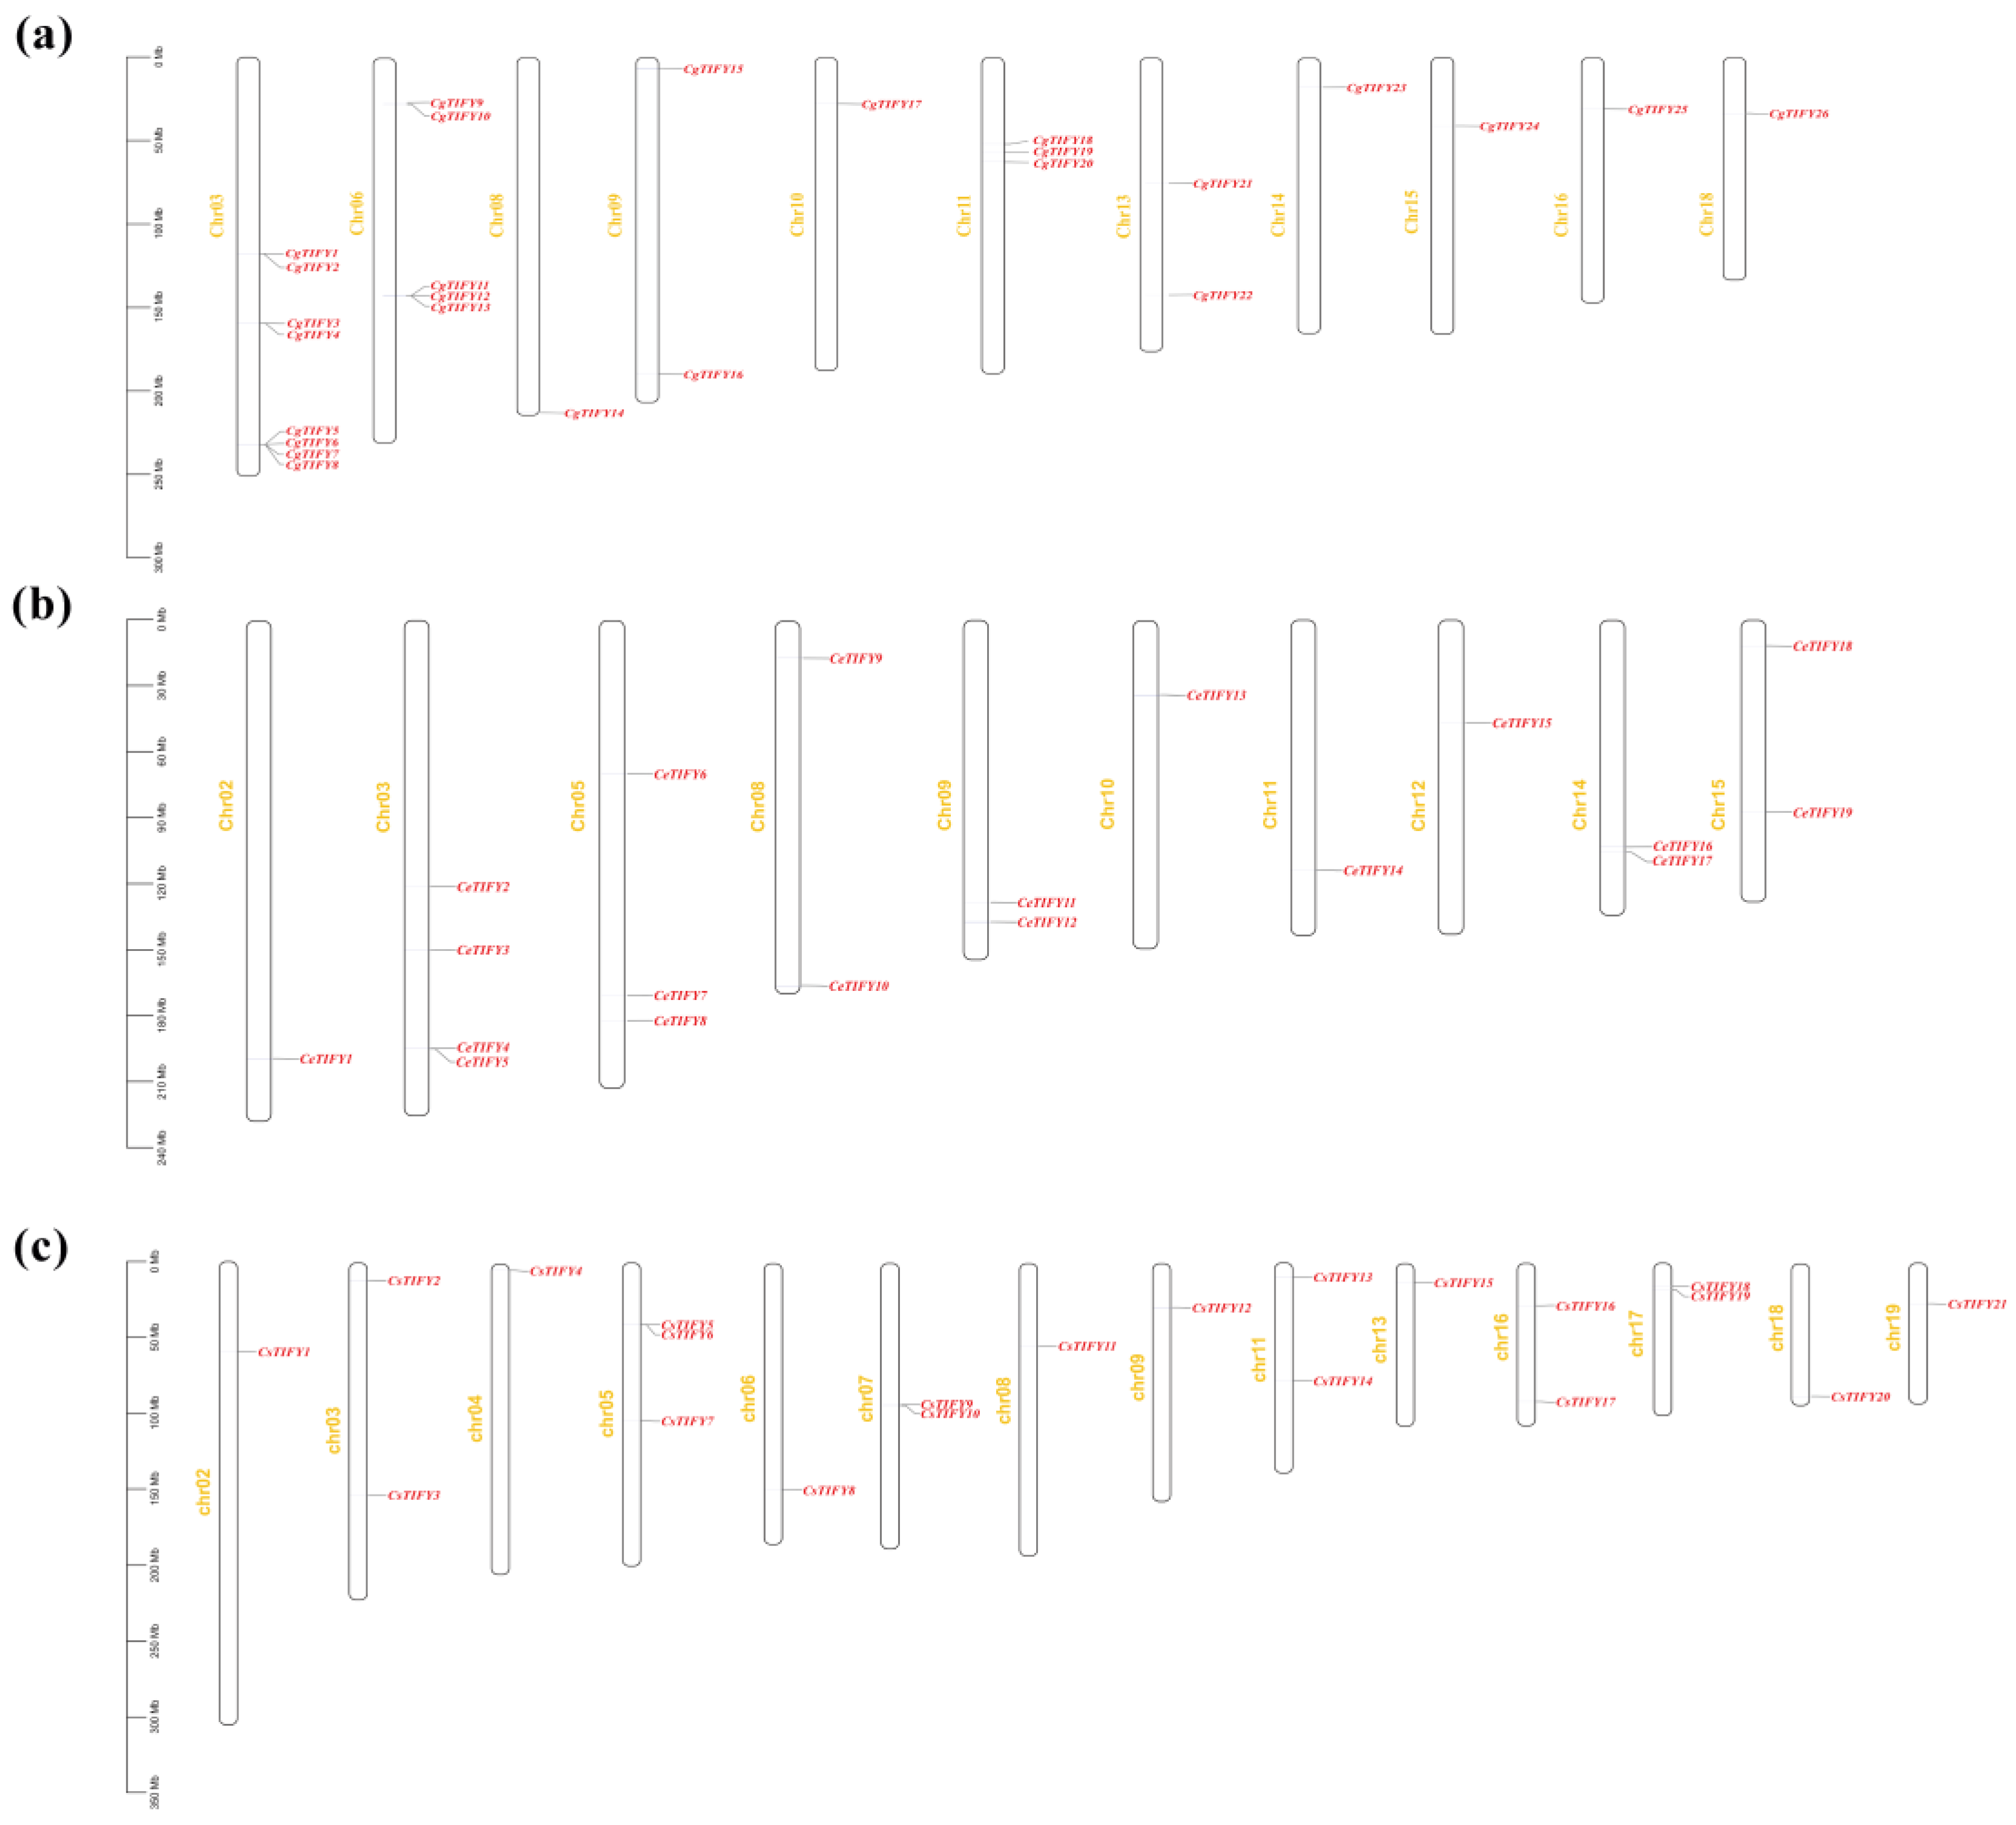
Using TBtools for visualization, we mapped the distribution of 66 TIFY genes from three Cymbidium species onto different chromosomes (Figure 4). The twenty-six CgTIFYs were distributed across 11 chromosomes, with Chr03 harboring eight CgTIFYs, the highest number among all chromosomes in C. goeringii. The 19 CeTIFYs were evenly distributed across 10 chromosomes, averaging one to two genes per chromosome. Chromosomes Chr03 and Chr05 had a higher number of genes. The 21 CsTIFYs were distributed across fourteen chromosomes, with two chromosomes showing tandem repeats.
Furthermore, to elucidate potential duplication events during the evolutionary process of TIFY genes in Cymbidium, we analyzed the collinearity relationships among C. goeringii, C. ensifolium, and C. sinense. Most TIFY genes showed collinearity across the three Cymbidium species, suggesting a high degree of homology among TIFY genes in three Cymbidium species. (Figure 5). Additionally, we combined gene positions on chromosomes to identify potential duplication events. This revealed fewer direct orthologous recombination events and more genome rearrangements during the evolution of TIFY genes in the three Cymbidium species.

3.5. Cis-Element Analysis

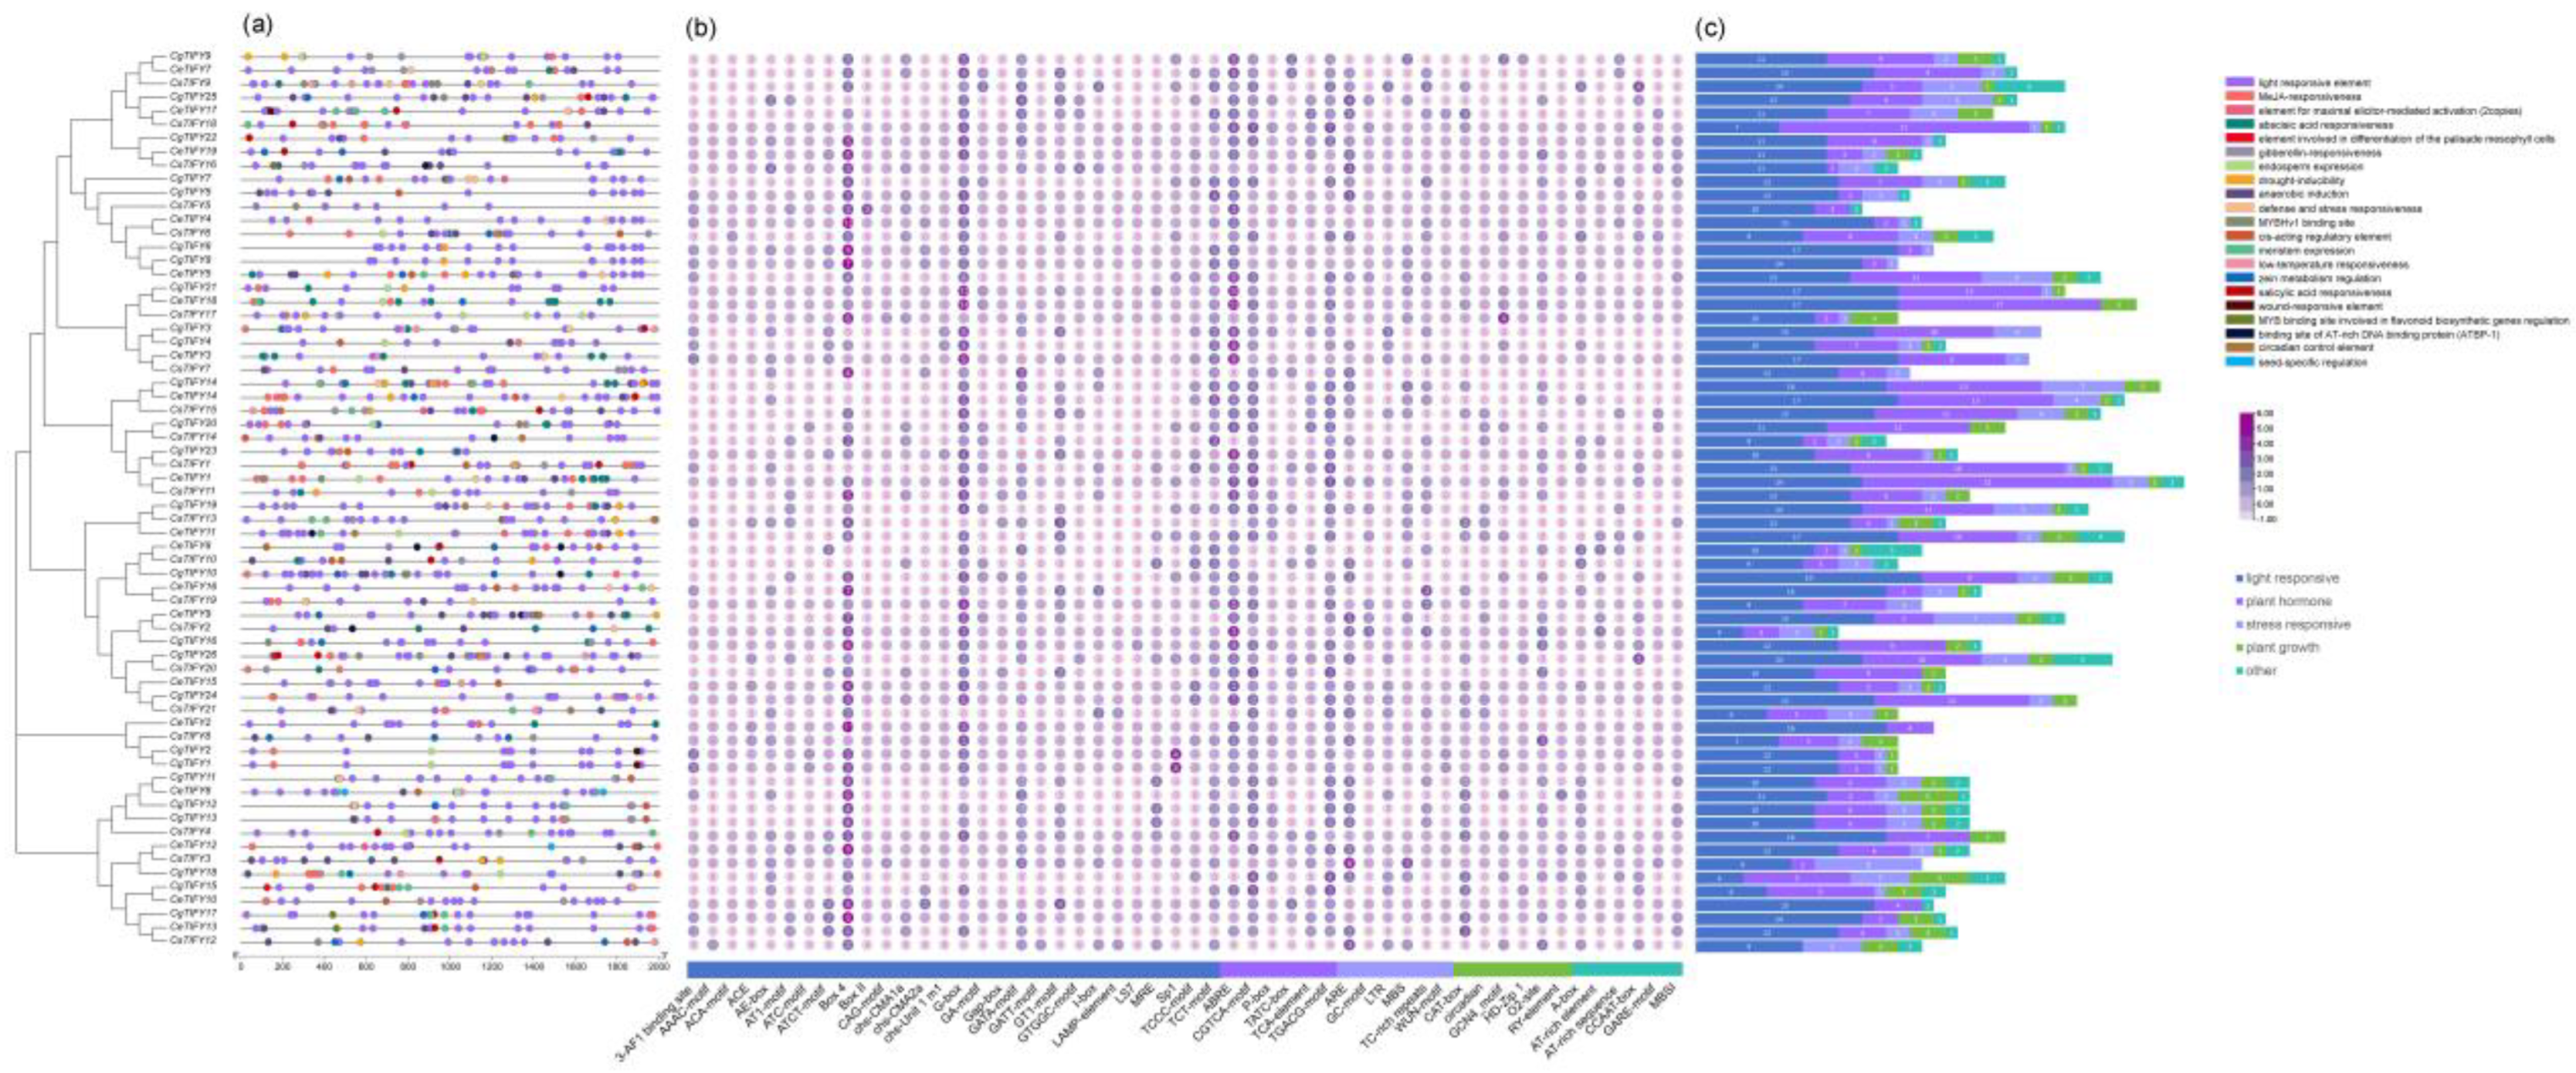
A search was conducted for cis-regulatory elements within the 2000 bp upstream promoter regions of 66 genes to further investigate the regulatory functions of TIFYs in Cymbidium. Through this study, a total of 1607 cis-regulatory elements were identified (Table S3). Among them, the highest numbers of Box 4 (223), G-box (198), and ABRE (179) elements indicate that TIFY genes play significant roles in light response, abiotic stress, and hormone signaling. Notably, CeTIFY1 contained the highest number of cis-regulatory elements, with 41 occurrences (Figure 6a). Elements related to light response were the most abundant, accounting for 50% of the total cis-regulatory elements, appearing in 801 occurrences. This was followed by elements related to plant hormones, which accounted for 28% with 460 occurrences, and those related to stress response (162) and plant growth (103) (Figure 6b). Furthermore, among the identified elements, light response-related elements exhibited the highest diversity, with a total of 28 types. Additionally, six cis-regulatory elements were identified in each of the three aspects: plant hormone regulation, stress response, and plant growth.

3.6. GO Analysis

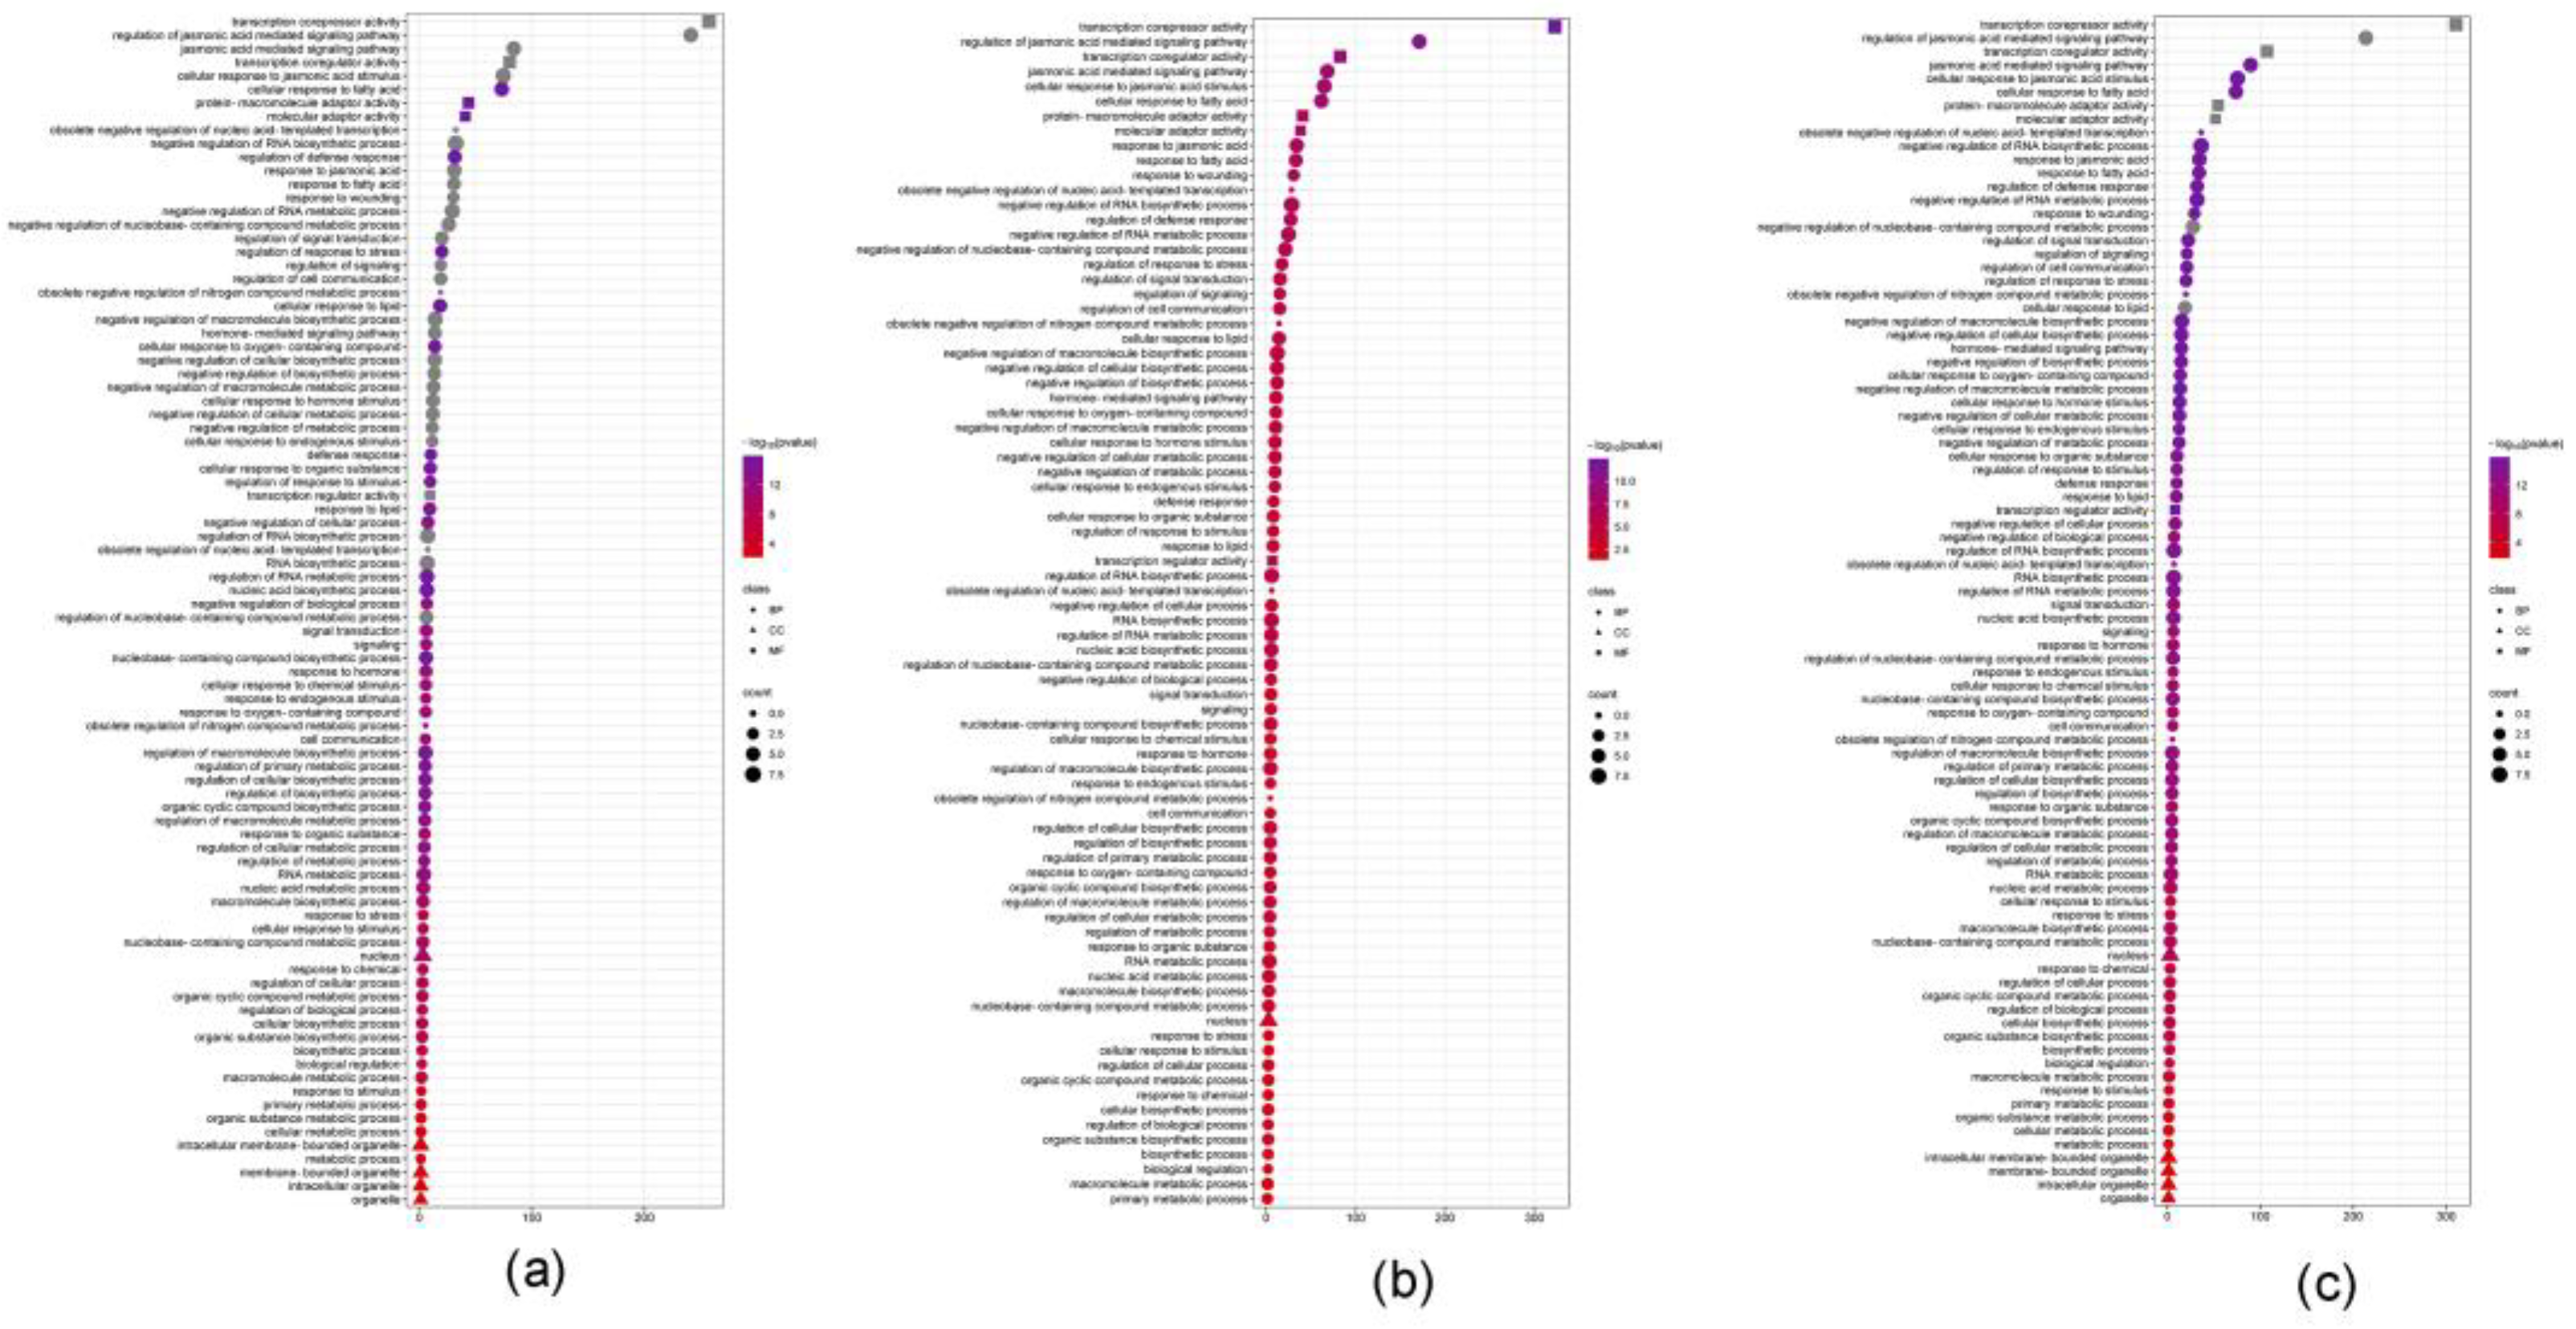
The research utilized Gene Ontology (GO) analysis to comprehensively describe the functions and properties of TIFY proteins in the three Cymbidium species, revealing their potential involvement in a range of biological processes (BPs), cellular components (CCs), and molecular functions (MFs). The results indicated that the enrichment patterns were relatively similar across the three different lifestyles of Cymbidium species, with a significant proportion of genes enriched in BP, although some proteins did not show significant enrichment. Similar to most plants, there were relatively fewer members enriched in CC, but their enrichment was significant and primarily associated with cellular organelles. Proteins enriched in MF mostly possessed the ability to interact with other proteins (Figure 6). Their functions are primarily associated with plant cell signaling, hormone regulation, and stress responses.

3.7. qRT-PCR Analysis of TIFYs

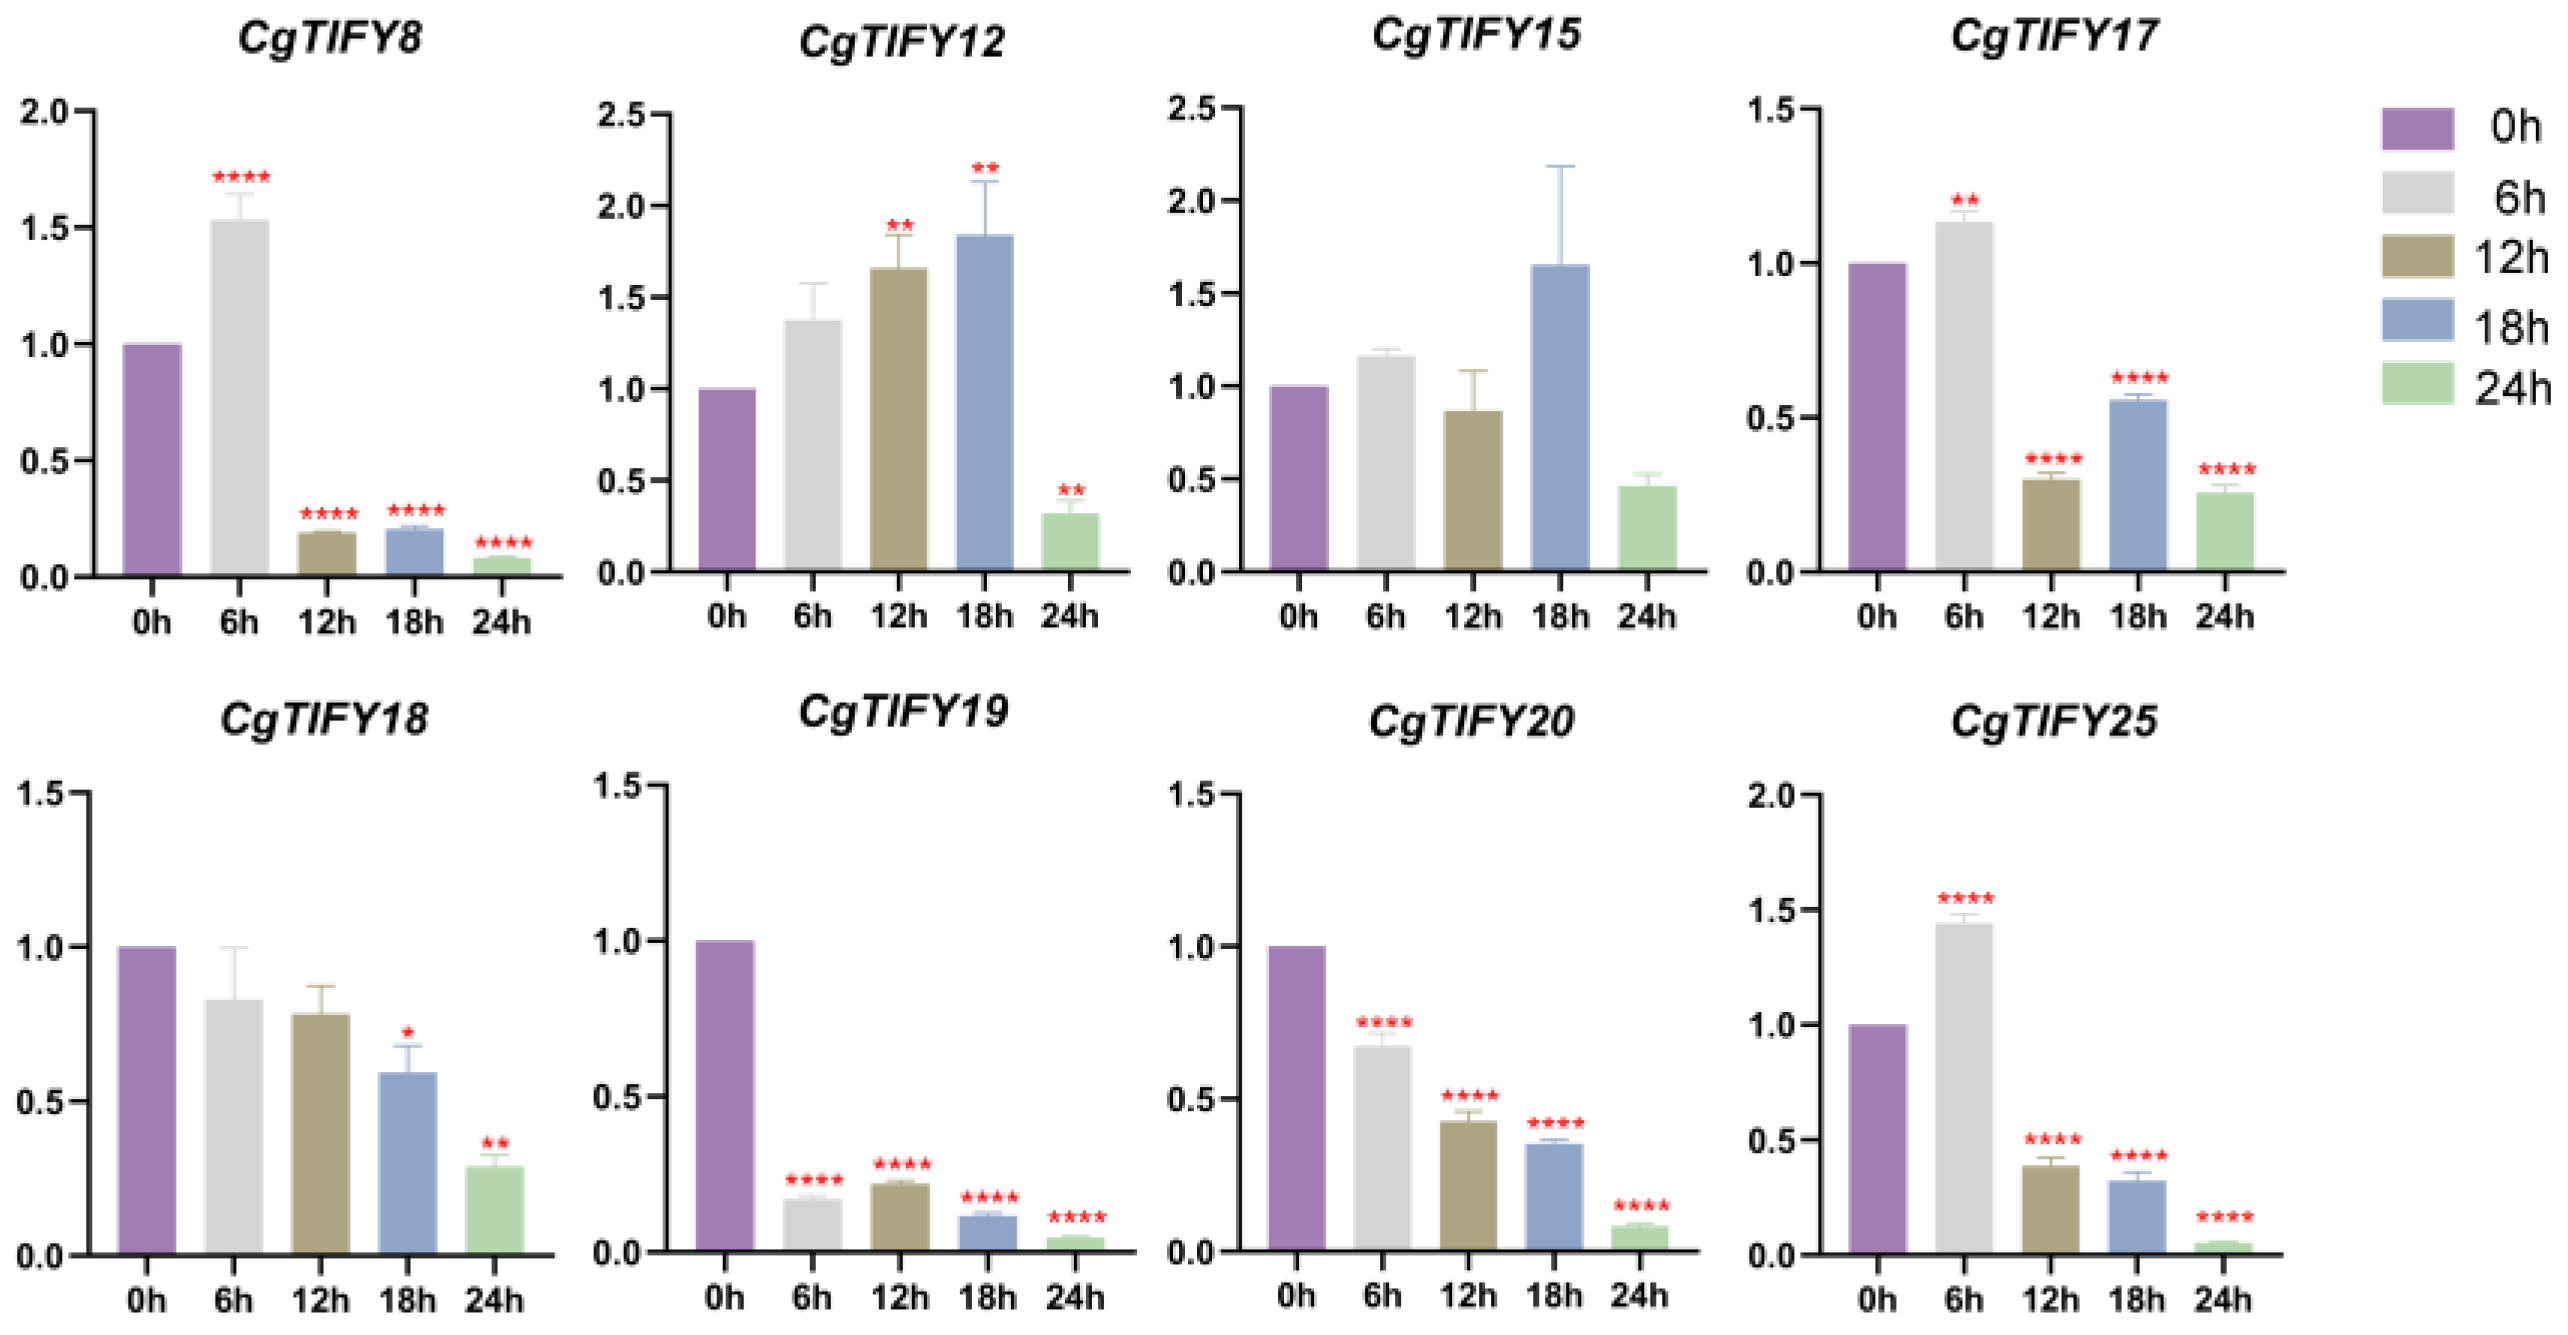
To investigate the expression patterns of CgTIFYs under heat stress, we selected eight genes with relatively high expression levels from four subfamilies based on transcriptomic data from C. goeringii leaves grown under natural conditions (Table S6) for qRT-PCR analysis. This study analyzed the expression patterns of these eight CgTIFY members in response to heat treatment in leaves using qRT-PCR (Figure 7). Notably, the overall trend in the expression levels of TIFY genes subjected to heat stress showed that some genes increased early in the experiment while others rapidly decreased from an initial peak. CgTIFY8, CgTIFY17, and CgTIFY25 exhibited upregulation at 6 h, followed by a subsequent decrease. In contrast, CgTIFY18, CgTIFY19, and CgTIFY20 showed a direct downregulation trend in response to heat stress. Expression levels within the same subfamily were generally similar, although some differences were observed. Under heat stress, members of the JAZ subfamily showed an upregulation trend, followed by a downregulation after 6 h, while the ZML subfamily showed fluctuations in expression levels under heat stress but also exhibited a downward trend. Interestingly, members of the PPD subfamily, specifically CgTIFY19, exhibited a downregulation trend under heat stress. In contrast, the TIFY subfamily member CgTIFY12 initially showed an upregulation trend, followed by a significant decrease at 24 h.

4. Discussion

The Orchid family is one of the largest and most species-rich families of flowering plants in the world. Despite its immense diversity, it is susceptible to environmental changes [20,33]. TIFY proteins are crucial transcription factors playing essential roles in plant growth and development. In recent years, TIFY genes have been extensively studied, including their roles in plant growth [34] and abiotic stress [35]. However, research on the TIFY gene family in Cymbidium is limited. Therefore, we employed multiple approaches to analyze the evolution and functions of the TIFY gene family in Cymbidium, as well as to investigate the expression patterns of C. goeringii under heat stress. These genes are all located within the nucleus, exhibiting differences in amino acid sequence length, isoelectric point, and intron count [36].
In this study, we systematically classified 66 TIFY genes identified in the genomes of C. goeringii, C. ensifolium, and C. sinense into four subfamilies (Figure 1). The JAZ subfamily comprises 75% of the total TIFY gene family, with 50 genes, making it the largest subfamily. The TIFY gene family has been identified in multiple species, with 18 TIFY members in A.thaliana [1], 20 in O. sativa [37], 30 in apple [38], 25 in P. trichocarpa [39], and 19 in P. Aphrodite [40]. This indicates that gene duplication events have occurred and expanded during the evolution of Cymbidium. We identified 26 CgTIFYs, 19 CeTIFYs, and 21 CsTIFYs (Table S1). The number of TIFY genes is similar to that in P. aphrodite. However, research on the TIFY gene family in Cymbidium remains limited. Therefore, we employed multiple approaches to analyze the evolution and functions of the TIFY gene family in Cymbidium, as well as to investigate the expression patterns of C. goeringii under heat stress. In A. thaliana, JAZ proteins have been shown to be crucial repressors in the jasmonic acid (JA) signaling pathway. Additionally, in Solanum lycopersicum, SlJAZ genes play roles in JA-mediated responses and abiotic stress responses [41]. In Gossypium hirsutum, GhJAZ genes are likely important in the initiation and development of cotton fibers by regulating JA signaling and some fiber-related proteins [42]. The ZML subfamily contains eight genes, accounting for 12% of the total. Studies have found that the interaction between PpJAZ3 and PpZML4 in Prunus persica suggests the formation of a ZML–JAZ–MYC complex in the JA signaling pathway [43]. Five genes were identified in the TIFY subfamily. In A. thaliana, TIFY8 plays a significant role in nuclear signal transduction [44]. The PPD subfamily has the fewest genes, with only one gene identified in each Cymbidium species. In A. thaliana, PPD proteins are involved in the regulation of the cell cycle and cell growth [14]. In apples, MdPPD1 is upregulated under drought and high-salt conditions [38].
Motif 1 is present in TIFY proteins of all three Cymbidium species, and the alignment of amino acid sequences revealed that the TIFY domain is present in all members of the TIFY gene family. This indicates that the main motif of the TIFY gene family in Cymbidium is highly conserved throughout evolution. In this study, it was found that the JAZ subfamily contains the Jas conserved domain in addition to the TIFY motif (Figure 3). Moreover, it is consistent with previous studies, which reported that TIFY subfamily members are the most abundant [45]. Members of the PPD subfamily also clustered with those of the JAZ subfamily (Figure 2a). Previous studies suggest that PPD proteins might be evolutionary precursors of JAZ proteins and may have evolved into two distinct subfamilies in vascular plants through gene duplication [2,11]. This study found that members of the same subfamily typically exhibit similar motif distributions, comparable gene structures, and a similar number of introns (Figure 2). This phenomenon is consistent with findings in other plants, such as Camellia sinensis, and may be related to the evolution of the gene family [11].
In the evolutionary history of plants, the presence of numerous duplicated genes suggests ancient genome duplication events. These duplicated genes facilitate the emergence of new functions and play a crucial role in evolution, such as adapting to diverse environments. Based on our analysis, we further demonstrated that they exhibit a high degree of evolutionary conservation, which has significantly promoted the expansion of the TIFY gene family in C. goeringii, C. ensifolium, and C. sinense (Figure 5). The results of the collinearity analysis indicate that the majority of TIFY genes are located in collinear regions, suggesting that these genes share a common ancestor [46].
Cis-acting regulatory elements regulate gene expression by interacting with transcription factors, enabling plants to adapt to various environmental changes. Understanding these elements is crucial for unraveling gene expression regulatory mechanisms. Elements associated with light response and stress response dominate the cis-regulatory elements identified in the promoter regions of the 66 TIFY genes analyzed in three Cymbidium species (Figure 6), finding a significant number of elements related to light response and stress response. Notably, the abundance of ABRE elements suggests that this gene family plays a crucial role in stress response, similar to findings in the study of VcTIFY genes in highbush blueberry. Previous studies on TIFY gene promoters in recent years have identified cis-elements involved in various plant hormones, abiotic stress conditions, and developmental regulation [47,48,49]. Many cis-regulatory elements related to GA signaling [50] and hormone metabolism regulation [37] were identified, which is consistent with our findings. To better understand the distribution and enrichment of TIFY genes in biological processes, cellular components, and molecular functions, the research conducted GO analysis (Figure 8). The results indicate that TIFY genes are involved in plant cell signaling, hormone regulation, and stress responses, similar to findings in maize and tomato [47]. Through GO analysis, we gained a more comprehensive view of the functional characteristics of the gene set, aiding in a better understanding of the roles and regulatory mechanisms of these genes in specific biological processes.
The TIFY gene family has been extensively studied in plants under various stresses, but research specifically on heat stress is limited, especially in Cymbidium plants. Our study reveals that heat stress predominantly downregulates CgTIFYs in the leaves of C. goeringii. Specifically, genes CgTIFY8, CgTIFY17, and CgTIFY25 show initial upregulation at 6 h, followed by a decrease. Our study results indicate that changes in JAZ subfamily members under heat stress are more pronounced, which is consistent with findings in Zea mays and tomato [47]. The trend of initial upregulation followed by downregulation of JAZ subfamily members is similar to the behavior of the JrTIFY gene in walnuts [49] and VvJAZ11 in grapes [46]. From this, we can infer that the JAZ subfamily likely plays a role in plant resistance to abiotic stressors. This work presents information that provides a foundation for further exploration of the role of TIFY genes in heat stress responses in Cymbidium.

5. Conclusions

In this study, we identified 66 TIFY genes from C. goeringii, C. ensifolium, and C. sinense for the first time and classified them into four subfamilies through phylogenetic analysis. We analyzed the physicochemical properties, phylogenetic relationships, gene structures, and cis-regulatory elements of the TIFY gene family in these three Cymbidium species. Additionally, we discussed the expression profiles of eight CgTIFY genes in C. goeringii under heat stress. Under heat stress treatment, the JAZ subfamily exhibited the strongest response to heat stress, initially showing an upregulation followed by a downregulation trend. This study enriched our understanding of this gene family in Cymbidium and provided new directions for future research on the TIFY family in Cymbidium under heat stress.

Supplementary Materials

The following supporting information can be downloaded at https://www.mdpi.com/article/10.3390/horticulturae10080796/s1, Table S1: Characteristics of the TIFY proteins from three Cymbidium species.; Table S2: Sequence and logo of motif1-10; Table S3: Information of cis-acting elements of three Cymbidium species; Table S4: Cis-acting elements analysis of three Cymbidium species; Table S5: qRT-PCR primers; Table S6: FPKM value of CgTIFY genes in leaf of C. goeringii; Table S7: Protein sequences from three Cymbidium species.

Author Contributions

Conceptualization, S.L. and Z.-J.L.; methodology and writing—original draft preparation, M.-M.Z.; investigation, X.H. and Y.H.; data curation, Q.Z. and X.Z.; formal analysis, Y.H. and X.Z.; writing—review and editing, L.W. All authors have read and agreed to the published version of the manuscript.

Funding

Scientific funding of Fujian Agriculture and Forestry University (115-KH240047A).

Data Availability Statement

The genome sequence of C. goeringii, C. ensifolium, and C. sinense and the annotation files were downloaded from the National Center for Biotechnology Information (NCBI) (accession number: PRJNA749652 and PRJNA174386). The genome of C. ensifolium accession number is PRJCA005355 (NGDC). And the protein sequence of TIFY of A. thaliana and O. sativa were downloaded from Tair (https://www.arabidopsis.org, accessed on 1 February 2024) and Phytozome v13 (https://phytozome-next.jgi.doe.gov, accessed on 1 May 2024), respectively.

Conflicts of Interest

The authors declare no conflicts of interest.

References

  1. Vanholme, B.; Grunewald, W.; Bateman, A.; Kohchi, T.; Gheysen, G. The Tify Family Previously Known as ZIM. Trends Plant Sci. 2007, 12, 239–244. [Google Scholar] [CrossRef]
  2. Bai, Y.; Meng, Y.; Huang, D.; Qi, Y.; Chen, M. Origin and Evolutionary Analysis of the Plant-Specific TIFY Transcription Factor Family. Genomics 2011, 98, 128–136. [Google Scholar] [CrossRef] [PubMed]
  3. Chung, H.S.; Niu, Y.; Browse, J.; Howe, G.A. Top Hits in Contemporary JAZ: An Update on Jasmonate Signaling. Phytochemistry 2009, 70, 1547–1559. [Google Scholar] [CrossRef] [PubMed]
  4. Staswick, P.E. JAZing up Jasmonate Signaling. Trends Plant Sci. 2008, 13, 66–71. [Google Scholar] [CrossRef] [PubMed]
  5. Figueroa, P.; Browse, J. Male Sterility in A Rabidopsis Induced by Overexpression of a MYC 5-SRDX Chimeric Repressor. Plant J. 2015, 81, 849–860. [Google Scholar] [CrossRef] [PubMed]
  6. Ju, L.; Jing, Y.; Shi, P.; Liu, J.; Chen, J.; Yan, J.; Chu, J.; Chen, K.; Sun, J. JAZ Proteins Modulate Seed Germination through Interaction with ABI 5 in Bread Wheat and Arabidopsis. New Phytol. 2019, 223, 246–260. [Google Scholar] [CrossRef] [PubMed]
  7. Kim, K.C.; Han, J.-A.; Lee, J.; Maeng, J.; Hur, Y. Gene Encoding PnFL-2 with TIFY and CCT Motifs May Control Floral Induction in Pharbitis Nil. Genes Genom. 2011, 33, 229–236. [Google Scholar] [CrossRef]
  8. Song, S.; Qi, T.; Huang, H.; Ren, Q.; Wu, D.; Chang, C.; Peng, W.; Liu, Y.; Peng, J.; Xie, D. The Jasmonate-ZIM Domain Proteins Interact with the R2R3-MYB Transcription Factors MYB21 and MYB24 to Affect Jasmonate-Regulated Stamen Development in Arabidopsis. Plant Cell 2011, 23, 1000–1013. [Google Scholar] [CrossRef]
  9. Cai, Q.; Yuan, Z.; Chen, M.; Yin, C.; Luo, Z.; Zhao, X.; Liang, W.; Hu, J.; Zhang, D. Jasmonic Acid Regulates Spikelet Development in Rice. Nat. Commun. 2014, 5, 3476. [Google Scholar] [CrossRef]
  10. Tian, J.; Cao, L.; Chen, X.; Chen, M.; Zhang, P.; Cao, L.; Persson, S.; Zhang, D.; Yuan, Z. The OsJAZ1 Degron Modulates Jasmonate Signaling Sensitivity during Rice Development. Development 2019, 146, dev173419. [Google Scholar] [CrossRef]
  11. Zhang, X.; Ran, W.; Zhang, J.; Ye, M.; Lin, S.; Li, X.; Sultana, R.; Sun, X. Genome-Wide Identification of the Tify Gene Family and Their Expression Profiles in Response to Biotic and Abiotic Stresses in Tea Plants (Camellia sinensis). Int. J. Mol. Sci. 2020, 21, 8316. [Google Scholar] [CrossRef] [PubMed]
  12. Liu, X.; Zhao, C.; Yang, L.; Zhuang, M.; Zhang, Y.; Wang, Y.; Fang, Z.; Lv, H. A Time-Resolved Dual Transcriptome Analysis Reveals the Molecular Regulating Network Underlying the Compatible/Incompatible Interactions between Cabbage (Brassica oleracea) and Fusarium oxysporum f. Sp. Conglutinans. Plant Soil 2020, 448, 455–478. [Google Scholar] [CrossRef]
  13. Shikata, M. Characterization of Arabidopsis ZIM, a Member of a Novel Plant-Specific GATA Factor Gene Family. J. Exp. Bot. 2004, 55, 631–639. [Google Scholar] [CrossRef] [PubMed]
  14. White, D.W.R. PEAPOD Regulates Lamina Size and Curvature in Arabidopsis. Proc. Natl. Acad. Sci. USA 2006, 103, 13238–13243. [Google Scholar] [CrossRef] [PubMed]
  15. Jiang, Y.; Liang, G.; Yang, S.; Yu, D. Arabidopsis WRKY57 Functions as a Node of Convergence for Jasmonic Acid- and Auxin-Mediated Signaling in Jasmonic Acid–Induced Leaf Senescence. Plant Cell 2014, 26, 230–245. [Google Scholar] [CrossRef] [PubMed]
  16. Saijo, Y.; Loo, E.P. Plant Immunity in Signal Integration between Biotic and Abiotic Stress Responses. New Phytol. 2020, 225, 87–104. [Google Scholar] [CrossRef] [PubMed]
  17. Meng, L.; Zhang, T.; Geng, S.; Scott, P.B.; Li, H.; Chen, S. Comparative Proteomics and Metabolomics of JAZ7-Mediated Drought Tolerance in Arabidopsis. J. Proteom. 2019, 196, 81–91. [Google Scholar] [CrossRef]
  18. Ebel, C.; BenFeki, A.; Hanin, M.; Solano, R.; Chini, A. Characterization of Wheat (Triticum aestivum) TIFY Family and Role of Triticum Durum TdTIFY11a in Salt Stress Tolerance. PLoS ONE 2018, 13, e0200566. [Google Scholar] [CrossRef] [PubMed]
  19. Yang, Y.; Ahammed, G.J.; Wan, C.; Liu, H.; Chen, R.; Zhou, Y. Comprehensive Analysis of TIFY Transcription Factors and Their Expression Profiles under Jasmonic Acid and Abiotic Stresses in Watermelon. Int. J. Genom. 2019, 2019, 6813086. [Google Scholar] [CrossRef]
  20. Zhang, D.; Zhao, X.-W.; Li, Y.-Y.; Ke, S.-J.; Yin, W.-L.; Lan, S.; Liu, Z.-J. Advances and Prospects of Orchid Research and Industrialization. Hortic. Res. 2022, 9, uhac220. [Google Scholar] [CrossRef]
  21. Li, X.; Liu, L.; Sun, S.; Li, Y.; Jia, L.; Ye, S.; Yu, Y.; Dossa, K.; Luan, Y. Transcriptome Analysis Reveals the Key Pathways and Candidate Genes Involved in Salt Stress Responses in Cymbidium ensifolium Leaves. BMC Plant Biol 2023, 23, 64. [Google Scholar] [CrossRef] [PubMed]
  22. Wei, Y.-L.; Jin, J.-P.; Liang, D.; Gao, J.; Li, J.; Xie, Q.; Lu, C.-Q.; Yang, F.-X.; Zhu, G.-F. Genome-Wide Identification of Cymbidium sinense WRKY Gene Family and the Importance of Its Group III Members in Response to Abiotic Stress. Front. Plant Sci. 2022, 13, 969010. [Google Scholar] [CrossRef] [PubMed]
  23. Liu, H.; Wang, L.; Jing, X.; Chen, Y.; Hu, F. Functional Analysis of CgWRKY57 from Cymbidium goeringii in ABA Response. PeerJ 2021, 9, e10982. [Google Scholar] [CrossRef]
  24. Lai, H.; Wang, M.; Yan, L.; Feng, C.; Tian, Y.; Tian, X.; Peng, D.; Lan, S.; Zhang, Y.; Ai, Y. Genome-Wide Identification of bZIP Transcription Factors in Cymbidium ensifolium and Analysis of Their Expression under Low-Temperature Stress. Plants 2024, 13, 219. [Google Scholar] [CrossRef] [PubMed]
  25. Zheng, R.; Chen, J.; Peng, Y.; Zhu, X.; Niu, M.; Chen, X.; Xie, K.; Huang, R.; Zhan, S.; Su, Q.; et al. General Analysis of Heat Shock Factors in the Cymbidium ensifolium Genome Provided Insights into Their Evolution and Special Roles with Response to Temperature. Int. J. Mol. Sci. 2024, 25, 1002. [Google Scholar] [CrossRef] [PubMed]
  26. Chen, C.; Wu, Y.; Li, J.; Wang, X.; Zeng, Z.; Xu, J.; Liu, Y.; Feng, J.; Chen, H.; He, Y.; et al. TBtools-II: A “One for All, All for One” Bioinformatics Platform for Biological Big-Data Mining. Mol. Plant 2023, 16, 1733–1742. [Google Scholar] [CrossRef]
  27. Mistry, J.; Chuguransky, S.; Williams, L.; Qureshi, M.; Salazar, G.A.; Sonnhammer, E.L.L.; Tosatto, S.C.E.; Paladin, L.; Raj, S.; Richardson, L.J.; et al. Pfam: The Protein Families Database in 2021. Nucleic Acids Res. 2021, 49, D412–D419. [Google Scholar] [CrossRef] [PubMed]
  28. Duvaud, S.; Gabella, C.; Lisacek, F.; Stockinger, H.; Ioannidis, V.; Durinx, C. Expasy, the Swiss Bioinformatics Resource Portal, as Designed by Its Users. Nucleic Acids Res. 2021, 49, W216–W227. [Google Scholar] [CrossRef]
  29. He, Z.; Zhang, H.; Gao, S.; Lercher, M.J.; Chen, W.-H.; Hu, S. Evolview v2: An Online Visualization and Management Tool for Customized and Annotated Phylogenetic Trees. Nucleic Acids Res 2016, 44, W236–W241. [Google Scholar] [CrossRef]
  30. Bailey, T.L.; Boden, M.; Buske, F.A.; Frith, M.; Grant, C.E.; Clementi, L.; Ren, J.; Li, W.W.; Noble, W.S. MEME SUITE: Tools for Motif Discovery and Searching. Nucleic Acids Res. 2009, 37, W202–W208. [Google Scholar] [CrossRef]
  31. Lescot, M. PlantCARE, a Database of Plant Cis-Acting Regulatory Elements and a Portal to Tools for in Silico Analysis of Promoter Sequences. Nucleic Acids Res. 2002, 30, 325–327. [Google Scholar] [CrossRef]
  32. Huang, Y.; Zheng, Q.; Zhang, M.-M.; He, X.; Zhao, X.; Wang, L.; Lan, S.; Liu, Z.-J. Genome-Wide Identification and Expression Analysis of the GRAS Gene Family and Their Responses to Heat Stress in Cymbidium goeringii. Int. J. Mol. Sci. 2024, 25, 6363. [Google Scholar] [CrossRef]
  33. Chase, M.W.; Cameron, K.M.; Freudenstein, J.V.; Pridgeon, A.M.; Salazar, G.; Van Den Berg, C.; Schuiteman, A. An Updated Classification of Orchidaceae: Updated Classification of Orchidaceae. Bot. J. Linn. Soc. 2015, 177, 151–174. [Google Scholar] [CrossRef]
  34. Demianski, A.J.; Chung, K.M.; Kunkel, B.N. Analysis of Arabidopsis JAZ Gene Expression during Pseudomonas syringae Pathogenesis. Mol. Plant Pathol. 2012, 13, 46–57. [Google Scholar] [CrossRef] [PubMed]
  35. Zheng, Y.; Chen, X.; Wang, P.; Sun, Y.; Yue, C.; Ye, N. Genome-Wide and Expression Pattern Analysis of JAZ Family Involved in Stress Responses and Postharvest Processing Treatments in Camellia Sinensis. Sci. Rep. 2020, 10, 2792. [Google Scholar] [CrossRef]
  36. Tao, J.; Jia, H.; Wu, M.; Zhong, W.; Jia, D.; Wang, Z.; Huang, C. Genome-Wide Identification and Characterization of the TIFY Gene Family in Kiwifruit. BMC Genom. 2022, 23, 179. [Google Scholar] [CrossRef]
  37. Ye, H.; Du, H.; Tang, N.; Li, X.; Xiong, L. Identification and Expression Profiling Analysis of TIFY Family Genes Involved in Stress and Phytohormone Responses in Rice. Plant Mol. Biol. 2009, 71, 291–305. [Google Scholar] [CrossRef]
  38. Li, X.; Yin, X.; Wang, H.; Li, J.; Guo, C.; Gao, H.; Zheng, Y.; Fan, C.; Wang, X. Genome-Wide Identification and Analysis of the Apple (Malus × Domestica Borkh.) TIFY Gene Family. Tree Genet. Genomes 2015, 11, 808. [Google Scholar] [CrossRef]
  39. Wang, H.; Leng, X.; Xu, X.; Li, C. Comprehensive Analysis of the TIFY Gene Family and Its Expression Profiles under Phytohormone Treatment and Abiotic Stresses in Roots of Populus trichocarpa. Forests 2020, 11, 315. [Google Scholar] [CrossRef]
  40. Guan, Y.; Zhang, Q.; Li, M.; Zhai, J.; Wu, S.; Ahmad, S.; Lan, S.; Peng, D.; Liu, Z.-J. Genome-Wide Identification and Expression Pattern Analysis of TIFY Family Genes Reveal Their Potential Roles in Phalaenopsis Aphrodite Flower Opening. Int. J. Mol. Sci. 2024, 25, 5422. [Google Scholar] [CrossRef]
  41. Chini, A.; Ben-Romdhane, W.; Hassairi, A.; Aboul-Soud, M.A.M. Identification of TIFY/JAZ Family Genes in Solanum lycopersicum and Their Regulation in Response to Abiotic Stresses. PLoS ONE 2017, 12, e0177381. [Google Scholar] [CrossRef] [PubMed]
  42. Li, W.; Xia, X.-C.; Han, L.-H.; Ni, P.; Yan, J.-Q.; Tao, M.; Huang, G.-Q.; Li, X.-B. Genome-Wide Identification and Characterization of JAZ Gene Family in Upland Cotton (Gossypium hirsutum). Sci. Rep. 2017, 7, 2788. [Google Scholar] [CrossRef] [PubMed]
  43. Sheng, Y.; Yu, H.; Pan, H.; Qiu, K.; Xie, Q.; Chen, H.; Fu, S.; Zhang, J.; Zhou, H. Genome-Wide Analysis of the Gene Structure, Expression and Protein Interactions of the Peach (Prunus persica) TIFY Gene Family. Front. Plant Sci. 2022, 13, 792802. [Google Scholar] [CrossRef] [PubMed]
  44. Cuéllar Pérez, A.; Nagels Durand, A.; Vanden Bossche, R.; De Clercq, R.; Persiau, G.; Van Wees, S.C.M.; Pieterse, C.M.J.; Gevaert, K.; De Jaeger, G.; Goossens, A.; et al. The Non-JAZ TIFY Protein TIFY8 from Arabidopsis Thaliana Is a Transcriptional Repressor. PLoS ONE 2014, 9, e84891. [Google Scholar] [CrossRef] [PubMed]
  45. Zhao, C.; Pan, X.; Yu, Y.; Zhu, Y.; Kong, F.; Sun, X.; Wang, F. Overexpression of a TIFY Family Gene, GsJAZ2, Exhibits Enhanced Tolerance to Alkaline Stress in Soybean. Mol. Breed. 2020, 40, 33. [Google Scholar] [CrossRef]
  46. Lyons, E.; Pedersen, B.; Kane, J.; Alam, M.; Ming, R.; Tang, H.; Wang, X.; Bowers, J.; Paterson, A.; Lisch, D.; et al. Finding and Comparing Syntenic Regions among Arabidopsis and the Outgroups Papaya, Poplar, and Grape: CoGe with Rosids. Plant Physiol. 2008, 148, 1772–1781. [Google Scholar] [CrossRef] [PubMed]
  47. Heidari, P.; Faraji, S.; Ahmadizadeh, M.; Ahmar, S.; Mora-Poblete, F. New Insights Into Structure and Function of TIFY Genes in Zea mays and Solanum lycopersicum: A Genome-Wide Comprehensive Analysis. Front. Genet. 2021, 12, 657970. [Google Scholar] [CrossRef]
  48. Lv, G.; Han, R.; Shi, J.; Chen, K.; Liu, G.; Yu, Q.; Yang, C.; Jiang, J. Genome-Wide Identification of the TIFY Family Reveals JAZ Subfamily Function in Response to Hormone Treatment in Betula platyphylla. BMC Plant Biol. 2023, 23, 143. [Google Scholar] [CrossRef] [PubMed]
  49. Liu, X.; Yu, F.; Yang, G.; Liu, X.; Peng, S. Identification of TIFY Gene Family in Walnut and Analysis of Its Expression under Abiotic Stresses. BMC Genom. 2022, 23, 190. [Google Scholar] [CrossRef]
  50. Chung, H.S.; Howe, G.A. A Critical Role for the TIFY Motif in Repression of Jasmonate Signaling by a Stabilized Splice Variant of the JASMONATE ZIM-Domain Protein JAZ10 in Arabidopsis. Plant Cell 2009, 21, 131–145. [Google Scholar] [CrossRef]
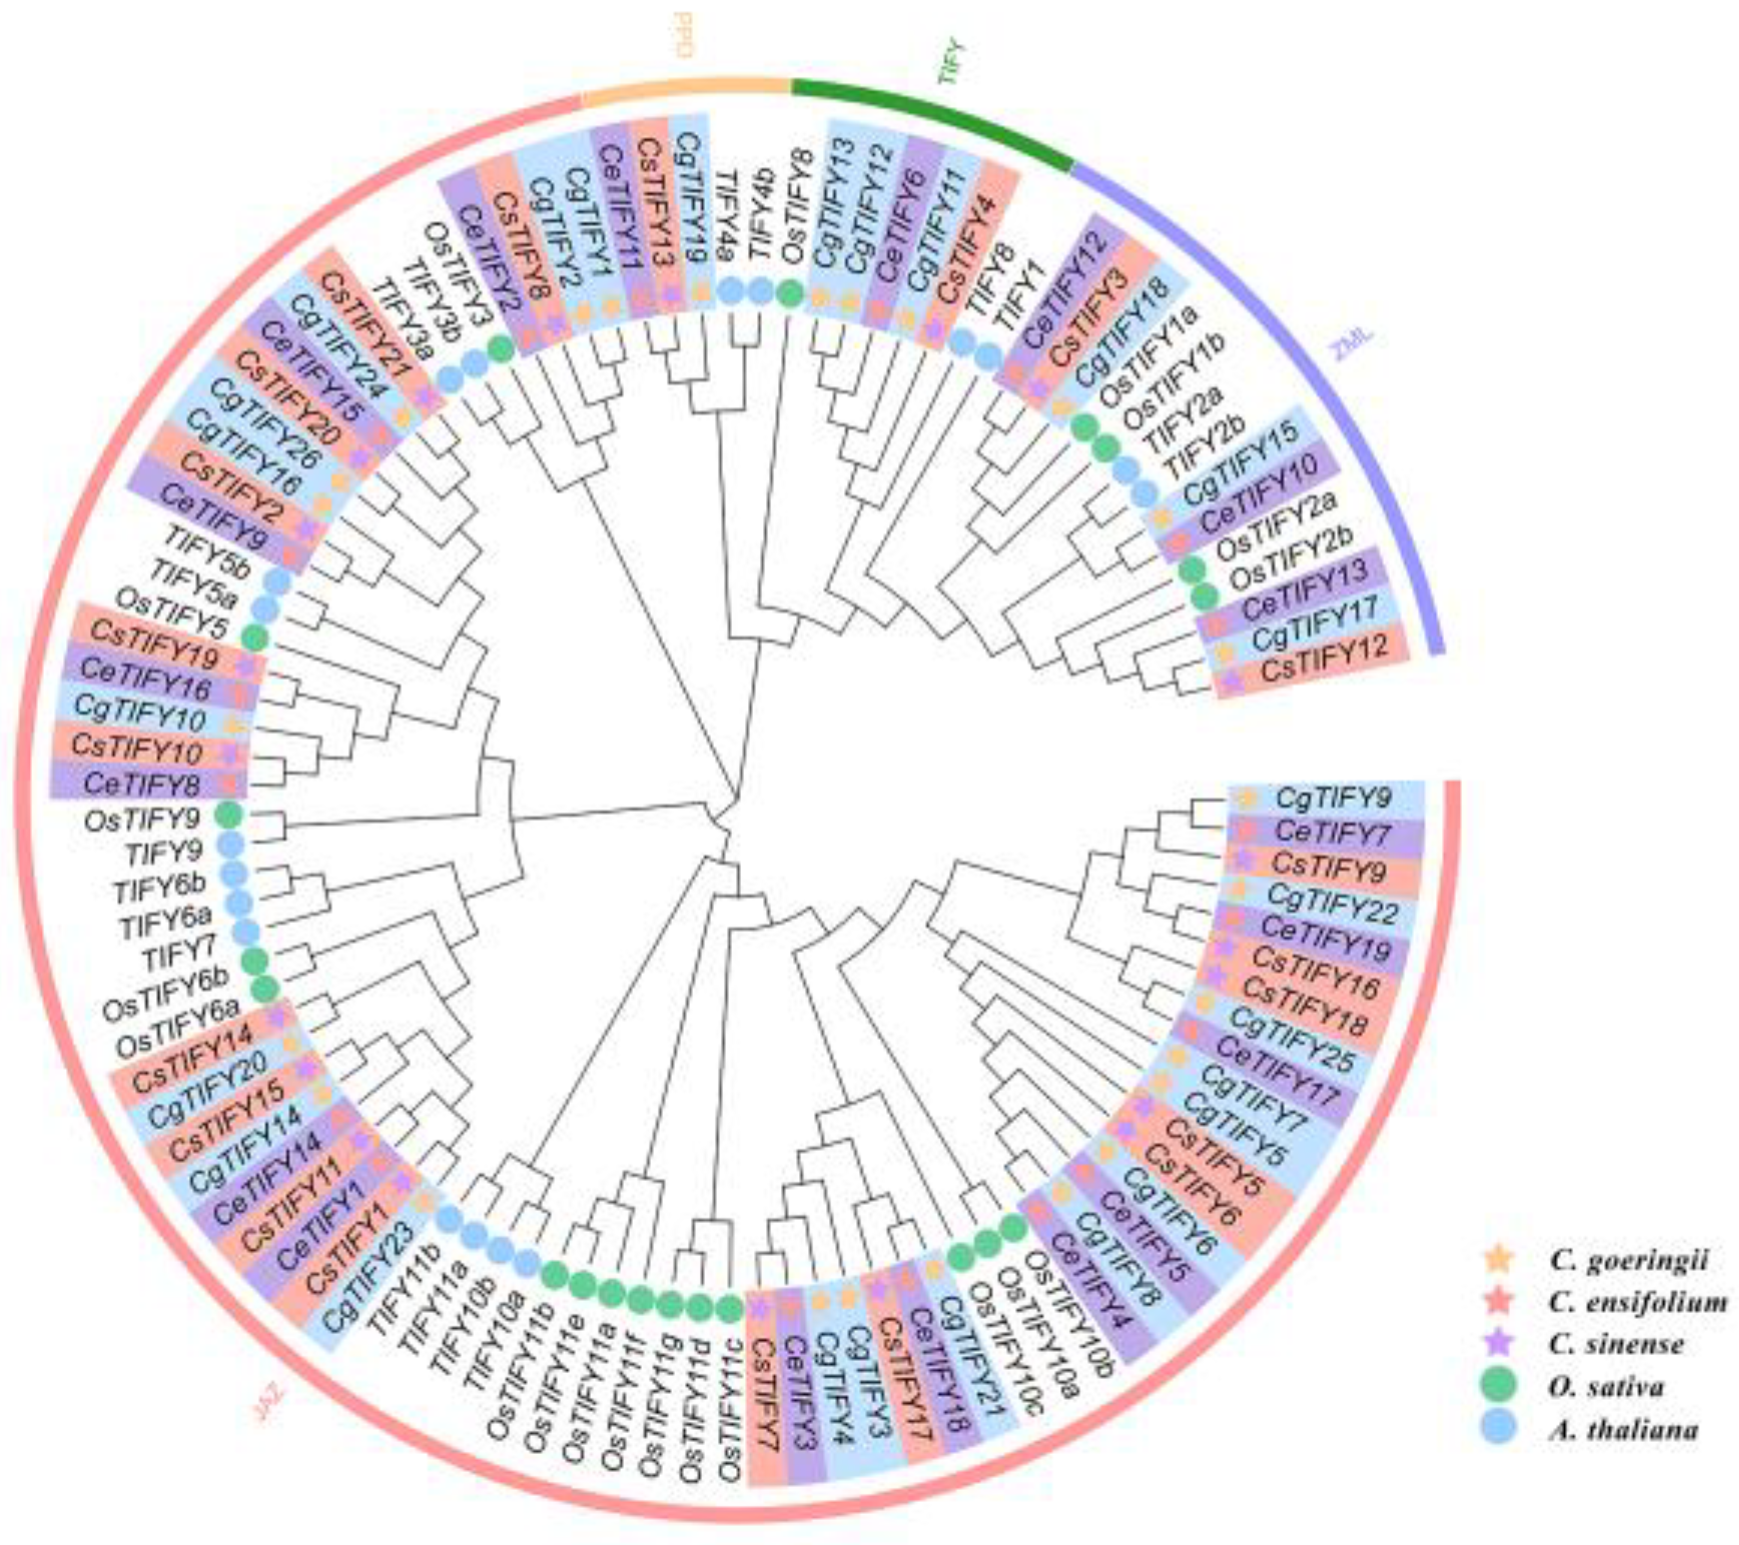
Figure 1. Phylogenetic tree of TIFY genes based on the TIFY protein sequences of C. goeringii, C. ensifolium, C. sinense, A. thaliana, and O. sativa.
Horticulturae 10 00796 g001
Figure 2. Analysis of the motif and gene structure of the TIFY gene family. (a) Phylogenetic tree of 66 TIFYs. (b) Determination of conserved motifs in the TIFY proteins. (c) Gene structure of TIFYs.
Horticulturae 10 00796 g002
Figure 3. Conserved motif in the amino acid sequence of TIFY proteins. (a) TIFY domain protein sequence alignment. (b) Sequence flags for TIFY and Jas domains.
Horticulturae 10 00796 g003
Figure 4. TIFY gene distribution on chromosomes in three Cymbidium species. (a) C. goeringii, (b) C. ensifolium, and (c) C. sinense.
Horticulturae 10 00796 g004
Figure 5. Synteny analysis of TIFYs in three Cymbidium species. The positions of TIFYs are marked with red triangles, and blue lines indicate syntenic relationships of TIFYs between different species.
Horticulturae 10 00796 g005
Figure 6. Cis− acting elements in the promoter regions of TIFY genes. (a) Distribution of cis-acting elements within 2000 bp upstream of TIFY genes; (b) Number of cis-acting elements in the promoter regions; (c) Quantitative analysis of light response, plant hormone response, plant growth, and stress response elements for each TIFY gene. Titles on the right indicate the types and quantities of cis-acting elements, as detailed in Tables S3 and S4.
Horticulturae 10 00796 g006
Figure 7. Validation of the effect of heat stress on the development of C. goeringii leaves through real-time quantitative PCR (qRT-PCR) analysis of CgTIFYs. The Y-axis represents the relative expression levels (2−ΔΔCT). Bars represent the mean ± SE of three technical replicates. Red asterisks indicate significance levels (* p < 0.05, ** p < 0.01 and **** p < 0.0001). Primers for CgTIFYs are listed in Table S5.
Horticulturae 10 00796 g007
Figure 8. Gene ontology (GO) terms of three Cymbidium species. C. goeringii (a), C. ensifolium (b), and C. sinense (c). BPs (Biological Processes), CCs (Cellular Constituents), and MFs (Molecular Functionalities).
Horticulturae 10 00796 g008
Disclaimer/Publisher’s Note: The statements, opinions and data contained in all publications are solely those of the individual author(s) and contributor(s) and not of MDPI and/or the editor(s). MDPI and/or the editor(s) disclaim responsibility for any injury to people or property resulting from any ideas, methods, instructions or products referred to in the content.