Abstract
Among the many inputs, nitrogen fertilizers are the main yield-limiting factor in agriculture. Liquid fractions of digestates can be a most promising substitute to synthetic nitrogen fertilizers, using little energy to turn waste into valuable fertilizers. In this study, the efficacy of five digestates from different origin (C, cow slurry; P, pig slurry; PCE, pig slurry, cow slurry, energy crops; SS, sewage sludge; W, organic fraction of municipal waste) were assessed as fertilizers for the cultivation of Lactuca sativa L., compared to traditional mineral fertilization. Digestates showed promising results as fertilizers for Lactuca sativa L., as yield and chemical parameters were overall comparable to the mineral fertilizer. Analysis of nitrogen evolution showed that most digestates showed higher nitrates in the substrates than the mineral fertilizers at earlier stages. Another topic investigated in the study is the effect of the digestates on the bacterial populations of the growth substrate, investigated through quantification and sequencing of 16S gene. These results varied based on the digestate considered, but, in general, an increase in biodiversity could be linked to use of digestates. These results suggest that digestates might become an alternative to mineral fertilizers, contributing to the circular economy and waste reduction.
1. Introduction
The human population on Earth is at the highest documented level and is expected to further increase to 9.7 billion in 2050, peaking at nearly 10.4 billion in the mid-2080s [1]. This enormous growth is causing a constant increase in food demand and a crushing pressure on farmers to increase yields and reduce production costs. Maintaining or increasing yields requires many inputs: energy, pesticides, water, and fertilizers, with nitrogen fertilizers being the main yield-limiting factor for plant growth [2]. The synthesis of mineral fertilizers requires a lot of primary resources representing an important bottleneck for food production and this reliance on high energy consumption makes this sector vulnerable to external fluctuations: for example, the energy crisis caused by the Russia/Ukraine conflict of 2022 influenced the prices of fertilizers, inducing a consumption decrease of 11% for nitrogen, 16% for phosphate and 15% for potash fertilizers [3].
An alternative to mineral fertilizers is organic fertilizers, produced from organic waste. The biomasses produced by livestock activity varies significantly across Europe, mainly due to substantial differences in the number and kind of animals present on the national territories. Livestock effluents production, for example, amounts for 1.4 billion tons of biomass each year in Europe [4]. In this frame, the European Union considers the adoption of a model of circular economy as the most promising strategy to increase the sustainability of this sector [5]. Circular economy approaches, in particular regarding fertilization, have been identified as beneficial as they would on one hand reduce the environmental impact of the production of fertilizers [6] and on the other reduce the risk of pollution caused by nutrients present in by-products that are now treated as waste [7]. This model promotes the maximum usage of raw materials reducing the consumption of non-renewable resources and adding value to waste products by using them as the starting material in different applications. Among these, anaerobic digestion (AD) is a process that enables the further valorization and use of biodegradable wastes of various origins, breaking down organic matter through a series of biochemical reactions generating biogas and a final and stabilized by-product known as digestate [8]. This process permits not only obtaining a final by-product with a much higher nutrient concentration than the original biomass, but it also permits the further valorization of the carbon contained within the manure, through its conversion into methane [8].
Several different biomasses can be employed for anaerobic digestion, including wastes related to agriculture such as food wastes, animal manures, and urban solid wastes [9]. Thus, this process is suitable to be included on a farm, or near it, to implement a circular economy and to fully valorize its by-products. The produced digestates can be considered as organic amendments or as organic fertilizers [10]; if correctly processed, digestates present a fertilizer value that lies between that of raw feedstock manures and mineral fertilizers [8,10,11]. A common treatment used achieve optimal fertilizer potential is solid–liquid separation [12]. Following this treatment, the solid fraction contains high organic matter and organic nitrogen; thus, it can be considered as a soil amendment that can increase overall soil fertility [13,14]; the liquid fraction is instead best suited to be considered as a fertilizer due to the higher concentration of available nitrogen in the N-NH4 form [15,16,17]. Several studies have shown that the liquid fraction of digestates has a greater crop performance than the corresponding undigested manures and that they are at least as effective as mineral fertilizers [10,15,18].
The main form of nitrogen present in digestates is ammonia and the mineralization of the nutrients is very similar both in quality and in quantity to that of urea [12,16,19]. Therefore, the nitrogen contained can be considered short-acting and readily available to the plant, an optimal predisposition for its utilization in fertigation. The fast availability also means that this kind of fertilization could be suited for short-cycle crops like leafy greens.
While the effect of digestates on plant nutrition has been studied in detail, their effect on soil microorganisms is less characterized [20]. The microorganisms present in the soil are fundamental in determining the availability and nature of nutrients in the soil, and this is particularly true for nitrogen considering that nitroreductor and nitrifying bacteria can alter the form of nitrogen. Considering that these digestates deliver both a great quantity of nutrients and their own microbial community to the soil and rhizosphere, determining how and how much the treatments with digestates influence the soil microbial community is important to develop effective waste recycling processes and sustainable soil management strategies.
Despite the interest on digestates as potential fertilizers, there is still overall little information on the effect that they can have on soil microbial communities and their efficacy compared to standard, mineral nutrition. As such, the objective of this paper is to assess the suitability of the liquid fraction of digestates, originated from different streams, as fertilizers for Lactuca sativa L. studying both nitrogen evolution and whether the microbial community involved in the nitrogen cycle is affected, in comparison to mineral fertilization.
2. Materials and Methods
2.1. Liquid Fractions of Digestate
Five samples of digestate liquid fraction, obtained by mechanical solid/liquid separation, were taken directly from full anaerobic digestion plants located in the Lombardy Region (Northern Italy). These plants were representative, both in terms of infeed biomass composition and power installed, for the anaerobic digestion plants in the Lombardy Region. Screw press separation systems were used in all plants. In detail, the respective origin of the samples was: C, cow slurry; P, pig slurry; PCE, pig slurry, cow slurry and energetic crops; SS, sewage sludge; W, organic fraction of municipal solid waste. The location of the five plants were: province of Cremona, for C and P, province of Brescia for PCE and W and province of Pavia for SS. This geographical area is environmentally risky due to the high nutrient load from intensive livestock farms. Many anaerobic digestion plants have been installed and solid–liquid separation is a common technique. This is a virtuous process because it allows better management of the solid fraction, which can be displaced to non-livestock areas. The liquid fraction is easier to be managed on the farm and can be used in fertigation. For each plant, about 500 mL of liquid fraction were sampled. Samples were then stored in 500 mL bottles without headspace for subsequent characterization. The main chemical characteristics of these samples such as dry matter (DM), total nitrogen (TKN), ammonia nitrogen (N-NH4), and pH [21] have been determined (Table 1). All analyses were performed in triplicate.

Table 1.
Characteristics of the digestates used for the experiment: total solids calculated as percentage of fresh matter (%FM), a measure of how acidic or basic a substance or solution is (pH), ammonium (N-NH4), total nitrogen (TKN), and ashes calculated as percentage of dry matter (%DM).
2.2. Agronomic Trial
Lettuce (Lactuca sativa L. cultivar Canasta) was cultivated in 2 L closed pots, to avoid nitrate losses during the experiment.
The substrate used was a commercial peat (Vigorplant Italia s.r.l., Fombio, Italy) calcinated with CaCO3 (Merck/Sigma-Aldrich, Milan, Italy) to reach a pH value of 6.53 ± 0.08. For the experiment, the dose of digestates has been calibrated so that each provided a typical dose of nitrogen of 1.1 g/pot to fertilize lettuce. The digestates have been compared with a non-fertilized (Ø) and a mineral-fertilized treatment (M) employing and NPK 20-20-20 fertilizer (Kinglife, Geosism & Nature, Bibbiano, Italy).
The study was performed inside an experimental greenhouse (45.47647 N, 9.22702 E), under controlled conditions (25 ± 3 °C, 70% hygrometry, 14 h photoperiod with Powerstar hqi-bt 400 w/d pro lights (OSRAM)). To detect a possible plant’s effect on nitrogen speciation and microbial evolution, the pots were further divided into two groups: pots with plants and pots only with substrate and fertilizers (digestates and mineral fertilizer). The pots were filled with peat, and after that, the respective fertilizers were added and the substrate mixed. Finally, young lettuce plants (about 15 days) were transplanted. Special precautions were taken during the watering of the plants to avoid an excess of water that could have led to anoxia and ammonia volatilization. The losses of nitrogen from the system are therefore negligible.
Each combination of treatment (digestate, non-fertilized, mineral fertilization) and condition (planted or unplanted) was carried out in four replicate pots.
2.3. Substrate Sampling
For the chemical characterization, 20 g of substrate were sampled using a corer burrowing in various positions in the pot in order to increase the homogeneity of the sampling. The samples were frozen until further analyses were performed. Successively, to compare the results, they were recalculated and expressed on the base of the dry matter content.
For the microbiological analysis, 3 g were collected from a depth of around 3 cm below the substrate surface using a spatula. The substrate sampling was performed at 0, 3, 7, 20, and 30 days after transplant (DAT) for both planted and unplanted pots, and also at 60 and 90 DAT for unplanted pots only. The sampling of the substrate for the chemical analysis coincided with the sampling completed for the microbiological evaluation.
2.4. Agronomic and Physiological Measurements
The diameter and the height of each plant were measured weekly for each treatment. The highest leaf protruding from the plant was chosen to measure the height, and the width was measured as the distance between the two tips of the most horizontal leaves passing through the center of the plant. Chlorophyll a fluorescence was measured in vivo weekly using the Handy Plant Efficiency Analyzer (PEA, Hansatech, Pentney, UK) portable fluorometer. Two leaves for each replicate were randomly analyzed for each treatment. Leaves were dark adapted for 30 min using leaf clips with a 4 mm diameter. A 3000 μmol/m2 s (600 W/m2) light intensity was administered to the leaf to measure the chlorophyll a fluorescence and calculate the derived parameters.
Plants were harvested after 30 days from transplant by cutting them at the collar. After harvest, they were weighed, and leaf discs of 5 mm were taken for phenolic index, anthocyanins, chlorophylls, and carotenoids quantification. About 1 g of tissue was also sampled to analyze sugar and nitrate concentration. The remaining biomass was then dried at 65 °C for 24 h.
The phenolic index and the anthocyanin concentrations were determined by a spectrophotometric direct method by the measurement of a leaf methanolic extract absorbance as previously described in [22].
Chlorophylls and carotenoids were extracted from approximately 50 mg of fresh tissue using 99.9% methanol as the solvent. After one night at 4 °C in the dark, the supernatant was read with the spectrophotometer at the following wavelengths: 665.2 nm for chlorophyll a, 652.4 nm for chlorophyll b and 470 nm for carotenoids. Pigment concentrations were calculated using Lichtenthaler’s formulas [23].
The salicylsulfuric acid method was used to determine the leaves’ nitrate content, as described in [24]. Briefly, samples weighing 1 g (oven-dried at 80 °C for 48 h) were mixed with 3 mL of distilled water. Subsequently, 20 μL of supernatant of each sample were mixed with 80 μL of 5% salicylic acid in sulfuric acid and 3 mL of 1.5 N NaOH. After cooling to room temperature, spectrophotometric readings were taken at 410 nm. Nitrate content was calculated using a calibration curve based on KNO3 standards.
The total sugar content was obtained by the anthrone method, as described in [25].
To measure elements concentrations in plant tissues, the dried biomass obtained at harvest was ground and an aliquot of 0.3 g mineralized in 65% HNO3 in microwave. Mineral elements concentration was measured by Inductively Coupled Plasma—Mass Spectrometry (BRUKER Aurora-M90 ICP-MS, Thermo Fisher Scientific, Waltham, MA, USA). Standard samples (National Institute of Standards and Technology, Gaithersburg, MD, USA) and blanks were run with all samples to ensure precision in the analyses.
2.5. Substrate Chemical Analysis
2.5.1. Nitrate, Ammonia, Total Nitrogen, and pH Determination
Ammonium and nitrate concentrations were obtained, after extraction in KCl 1 N, as reported in [16]. In brief, extraction on the fresh sample by using KCl 1 N (sample to solvent ratio of 1:10 w/w) for 1 h and determination of ammonium by direct distillation and titration by H2SO4 0.01 N. For nitrate method with Devarda’s alloy, total N concentration was detected on substrate samples using an elementary analyzer (Elementar Rapid max N exceed, Thermo Fisher Scientific, Waltham, MA, USA), based on the analytical method of combustion “Dumas” and equipped with a thermal conductivity detector (TCD). The pH was measured after water extraction with a digital pH meter (Edge Multiparameter pH Meter-HI2020, Sigma-Aldrich, Milan, Italy).
2.5.2. Substrates Respiration
To determine the rate of mineralization of the five digestates used in the experiment, and consequentially the release of nutrients, a respiration test in controlled conditions was performed in parallel adding digestates to the substrate used for the agronomic trial. In brief, CO2 release of the substates added with digestates was measured through the titration static method [26].
2.6. Substrate Bacterial Analysis
For DNA extraction from the substrate and amplification approximately 0.200 g of dried substrate was placed in an Eppendorf vial, the extraction was performed using DNeasy PowerSoil Pro Kit (QIAGEN, Hilden, Germany). The nucleic acids concentration and purity were measured using a nanodrop ND-1000 spectrophotometer (Thermo Fisher Scientifics, Waltham, MA, USA). The DNA extract, diluted 1:10 to reduce the concentration of possible inhibitors from substrate, was used for two different microbial community investigations: (i) a quantitative characterization of the community, using a 16S rDNA quantification carried out combining real-time PCR (qPCR) and digital PCR (dPCR) results using the primer pair 16S_1055F/16S_1392R and the TaqMan probe 1115P [27]; (ii) a qualitative characterization of the community made by amplifying the 16S rDNA gene using the primer pair 27F/1492R [28] and using the amplicons to prepare an ONT MinION library to then sequence it.
2.6.1. Quantification of 16S Copy Number
DNA samples were used to carry out amplification in a qPCR, using a reaction mix consisting of TaqMan Universal Master Mix No Amperase (Applied Biosystems, Foster, CA, USA) 1×, 900 nmol of each primer, 200 nmol of probe, 2 µL of DNA solution and water to reach a volume of 12 µL, carried out in StepOnePlus Real-Time PCR thermocycler (Thermo Fisher Scientific, Waltham, MA, USA). Each sample was assayed in triplicate and an average CT was calculated for each sample. The thermal cycle included an initial denaturation at 95 °C for 10 min, followed by 40 cycles of 95 °C for 30 s, 50 °C for 30 s, and 72 °C for 45 s.
Then, a subset of samples that showed different CT values after qPCR were quantified through dPCR, using a reaction mix that contained 1× QIAcuity Probe PCR master mix (QIAgen, Hilden, Germany), 900 nmol of each primer, 200 nmol of probe, 2 µL of DNA solution and water to reach a volume of 12 µL, carried out in a QIAcuity instrument (Qiagen, Hilden, Germany). The thermal cycle included an initial denaturation at 95 °C for 2 min, followed by 35 cycles of 95 °C for 15 s, 50 °C for 15 s, and 72 °C for 30 s.
Comparing the results of the two assays, it was possible to make a calibration line and associate the absolute copy number value obtained from the dPCR assay to a corresponding CT value from the qPCR, therefore obtaining an equation to convert CT into a copy number.
2.6.2. Bacterial Community Characterization
Each DNA extracted from substrate sample was amplified using the 27F/1492R primer pair [28]. The PCR reaction was carried out using a reaction mix composed as follows: GoTaq Flexi (Promega, Madison, WI, USA) 1×, MgCl2 1.24 µM, primers 0.2 µM each, dNTPs 0.1 µM, GoTaq DNA Polymerase 1U, DNA template 2 µL, and water to reach a volume of 50 µL. The thermal cycle included an initial denaturation at 95 °C for 2 min, 35 cycles of denaturation at 95 °C for 1 min, annealing at 50 °C for 1.5 min, extension at 72 °C for 2 min, and a final extension at 72 °C for 10 min. The amplicons obtained from the 4 replicates of each treatment/plant/sampling time combination were pooled to obtain a single sample for each condition and time point (7 time points for unplanted pots, 4 time points for planted pots), for a total of 77 samples. These pooled samples were used to prepare the sequencing libraries, pooling up to 24 samples per library, following the Native Barcoding Kit 24 V14 protocol (Oxford Nanopore Tecnologies, Oxford, UK) and were then sequenced on a MinION Mk1C device using an R9.4.1 flowcell. The sequencing run was set to have a duration of 2 h and to filter out reads below 1000 bp in length, as the expected length for the amplicon is around 1400 bp. Basecalling was performed using the standard minKNOW settings. The fastQ files obtained from the basecalling step were loaded into the EPI2ME software version 3.7.3 and analyzed using the “Fastq 16S” algorithm, set to consider only reads between 1000 and 2000 bp, minimum of 80% coverage and 88% identity, to assign a taxonomy to each read produced. The output was converted into an OTU table format file using the following script available on GitHub (https://github.com/fgeuna/MinION2metagenomics.git, accessed on 20 May 2024).
The obtained OTU table was used as a starting point for microbiota analyses in R version 4.3.3 [29]. The following packages were employed: Phyloseq version 1.46.0 [30] and ggplot2 version 3.5.0 [31]. The sequencing reads utilized in this analysis are available at ENA PRJEB75794, while the files and script—OTU table, mapping files, R script—are available on GitHub (https://github.com/AlessandroPasser/Digestates_Soil_Bacteria, last accessed on 20 May 2024).
2.7. Statistical Analysis
All statistical analyses were performed using the Rstudio Program 2022.07.0. An ANOVA test was performed (p < 0.05) after testing for normality (Shapiro–Wilk test, p > 0.05) and for homoscedasticity (Levene test, p > 0.05). The post hoc test was then performed using the Tukey test for the p-value adjustments.
3. Results
3.1. Liquid Fractions of Digestate Characteristics
The main characteristics of digestate liquid fractions are reported in Table 1. The samples show similar pH values but differ for total nitrogen content and especially for the N-NH4 ratio of total nitrogen (from 38.3 to 69.9). This data suggests a very high fertilizer power of the liquid fraction tested.
3.2. Agronomic and Physiological Measurements
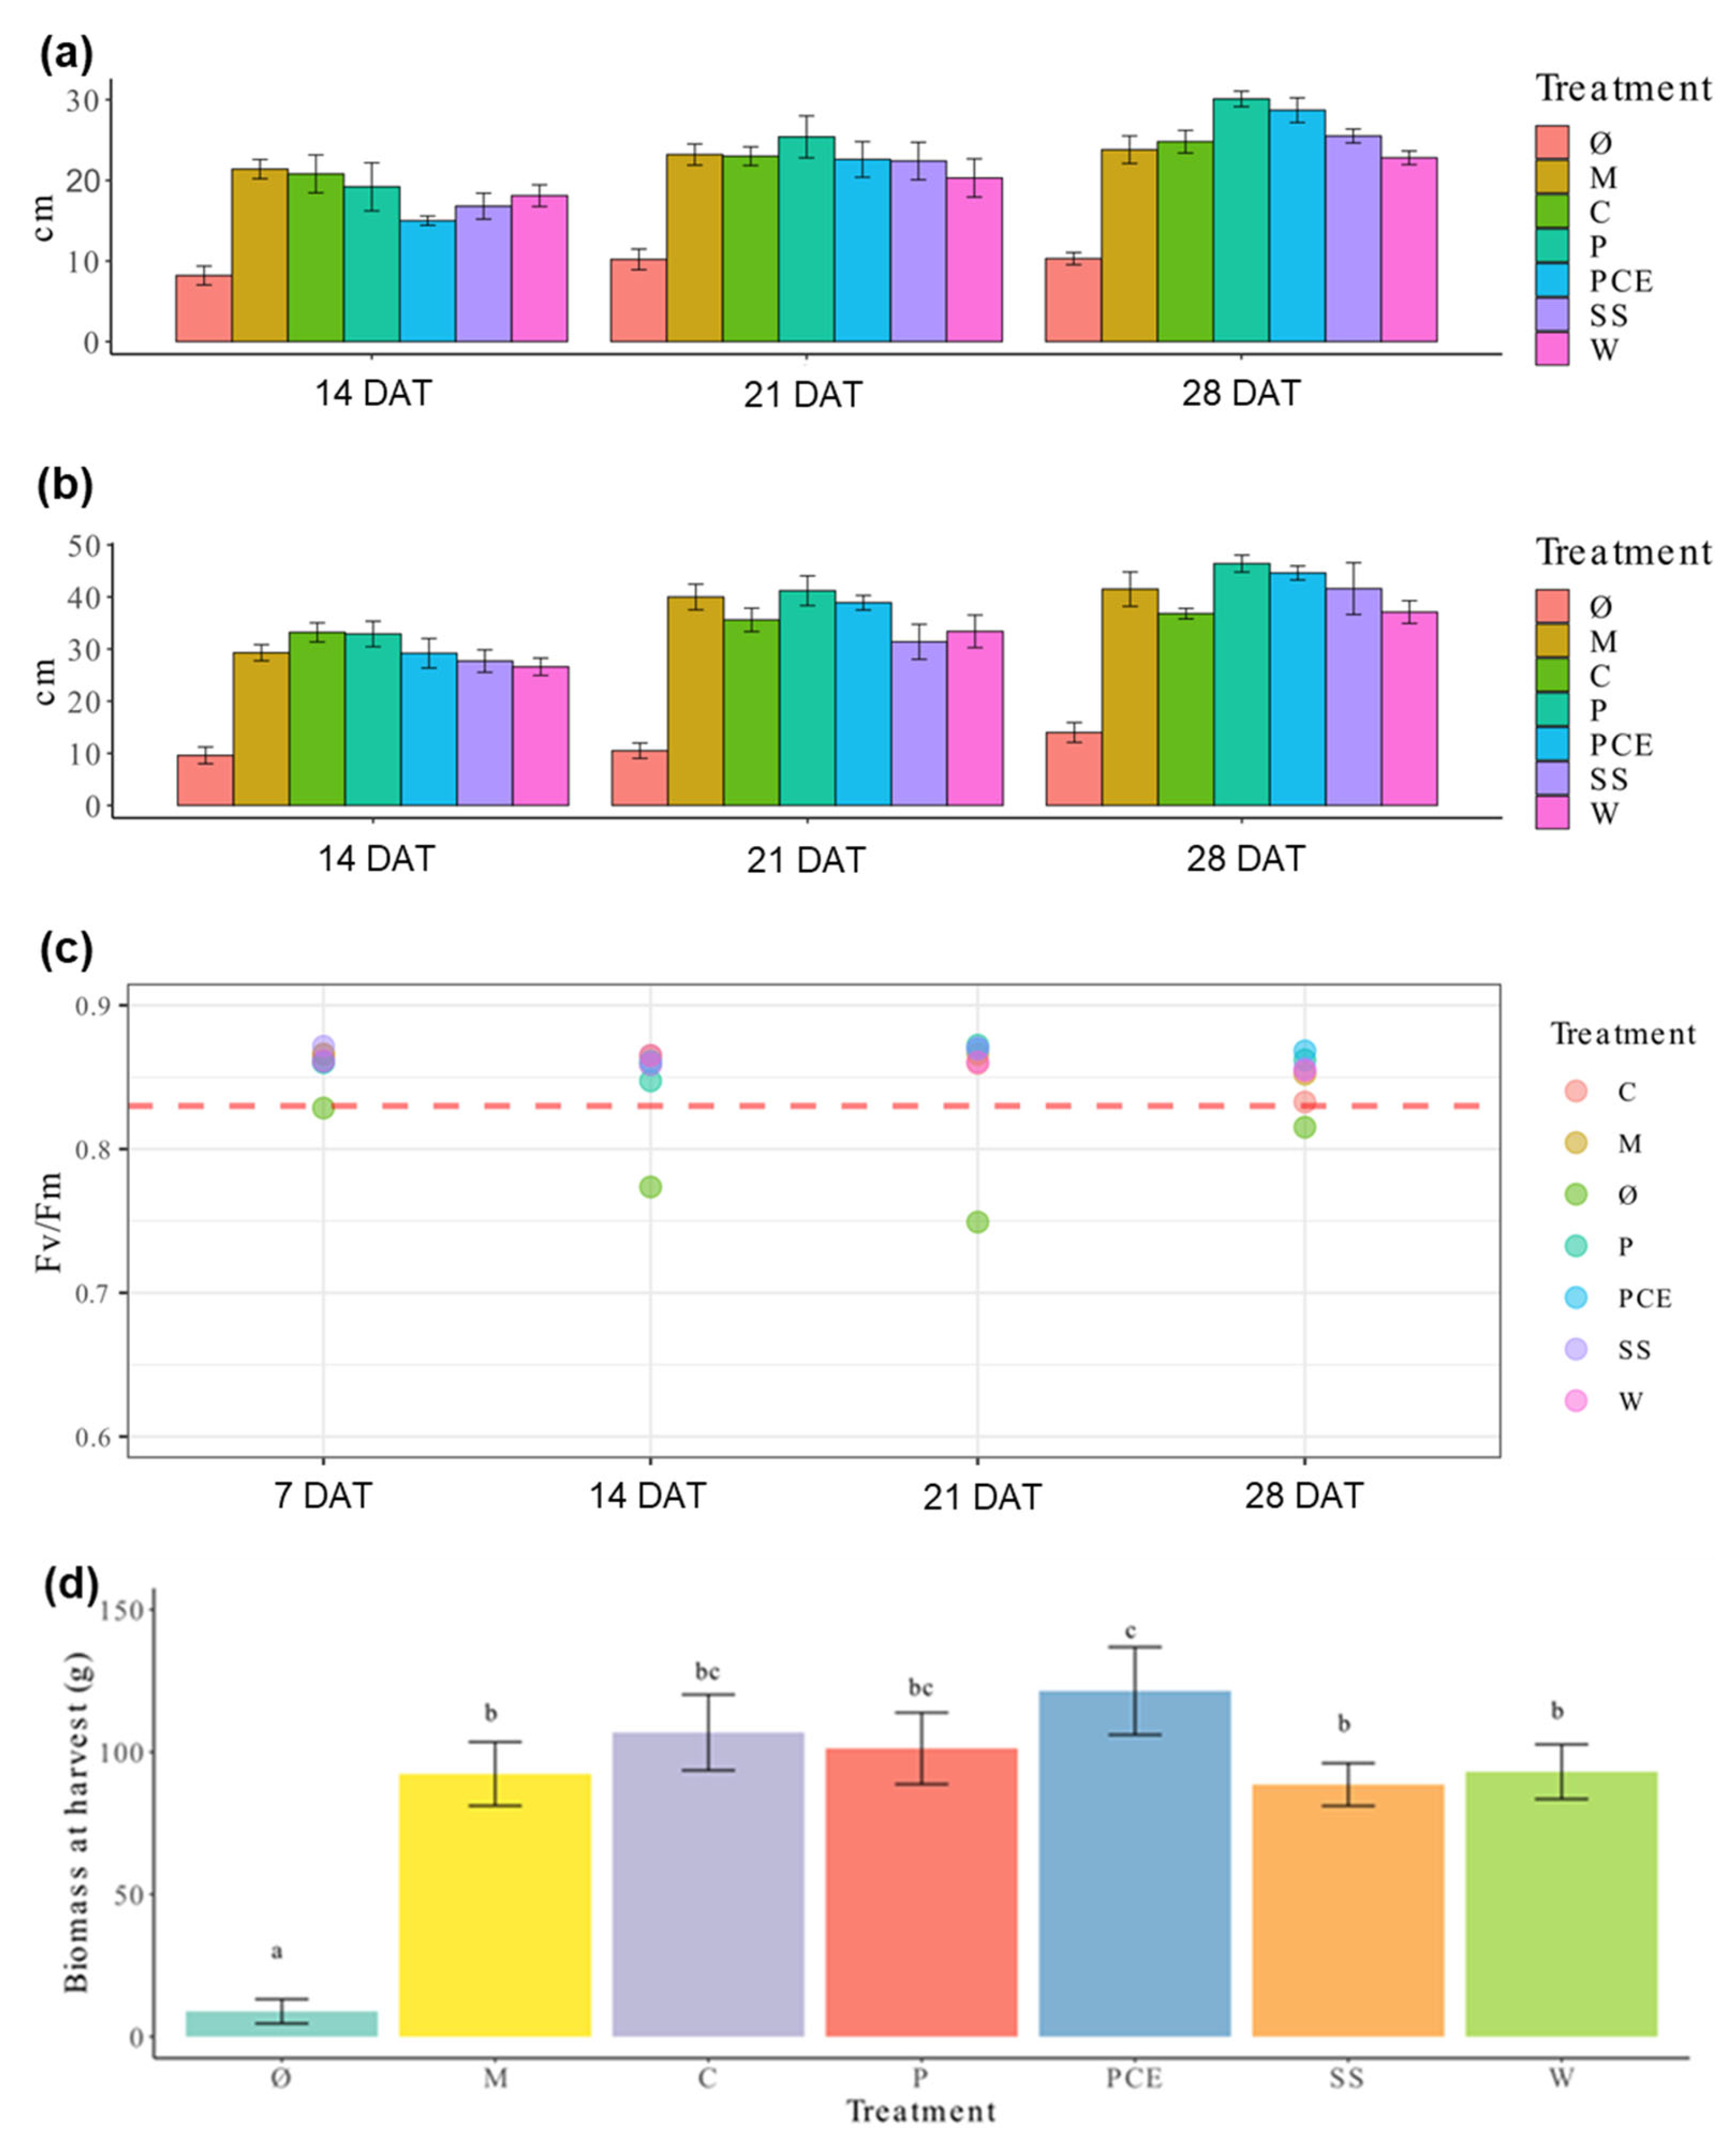
The height and diameter of lettuce plants recorded throughout the experiment is reported in Figure 1a,b. The data shows that, while there is a clear difference between the fertilized plants and the non-fertilized control Ø, there is no relevant difference between the mineral fertilization and digestates.
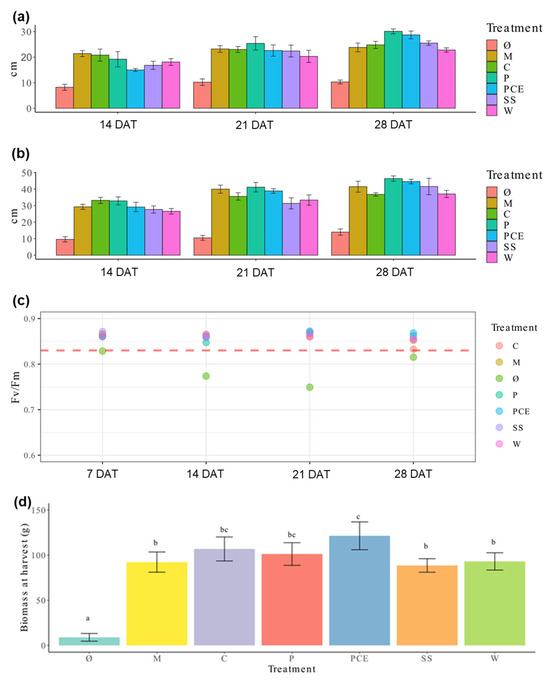
Figure 1.
Graphs reporting the measurement collected during plant growth. (a) Height and (b) diameter of lettuce plants during the cultivation trial. Each cluster of bars represents the average measure of the treatments at 14, 21, and 28 days after transplant (DAT), respectively. (c) graph reporting the Fv/Fm ratio measured for each treatment at 7, 14, 21, and 28 DAT, respectively. Each dot represents the average measure of a treatment, as indicated by the color legend. (d) Fresh weight at harvest. Each bar represents the average measure of a treatment, with the error bars reporting standard deviation. Different letters above a bar (a, b, c) indicate statistically significant differences in the results according to a one-way ANOVA followed by a Tukey’s post hoc test (p < 0.05). Treatments are (1) Ø, non-fertilized treatment; (2) M, mineral fertilized treatment; (3) C, cow slurry digestate; (4) P, pig slurry digestate; (5) PCE, pig slurry, cow slurry and energy crop digestate; SS, sewage sludge; W, organic fraction of municipal solid waste.
The non-destructive measurement of chlorophyll a fluorescence provided information on leaf functionality and maximum quantum efficiency of photosystem II (Fv/Fm). This parameter represents an estimation of light use efficiency and of plants’ stress conditions. Values recorded for all fertilization treatments were higher than 0.83, while those measured for the untreated control are lower (Figure 1c). Again, no difference was found among the different fertilization treatments.
Biomasses obtained at harvest are reported in Figure 1d. Once again, the Ø plants showed very low values, while all the fertilized ones were comparable to the mineral fertilization, except PCE, which outperforms M on this parameter.
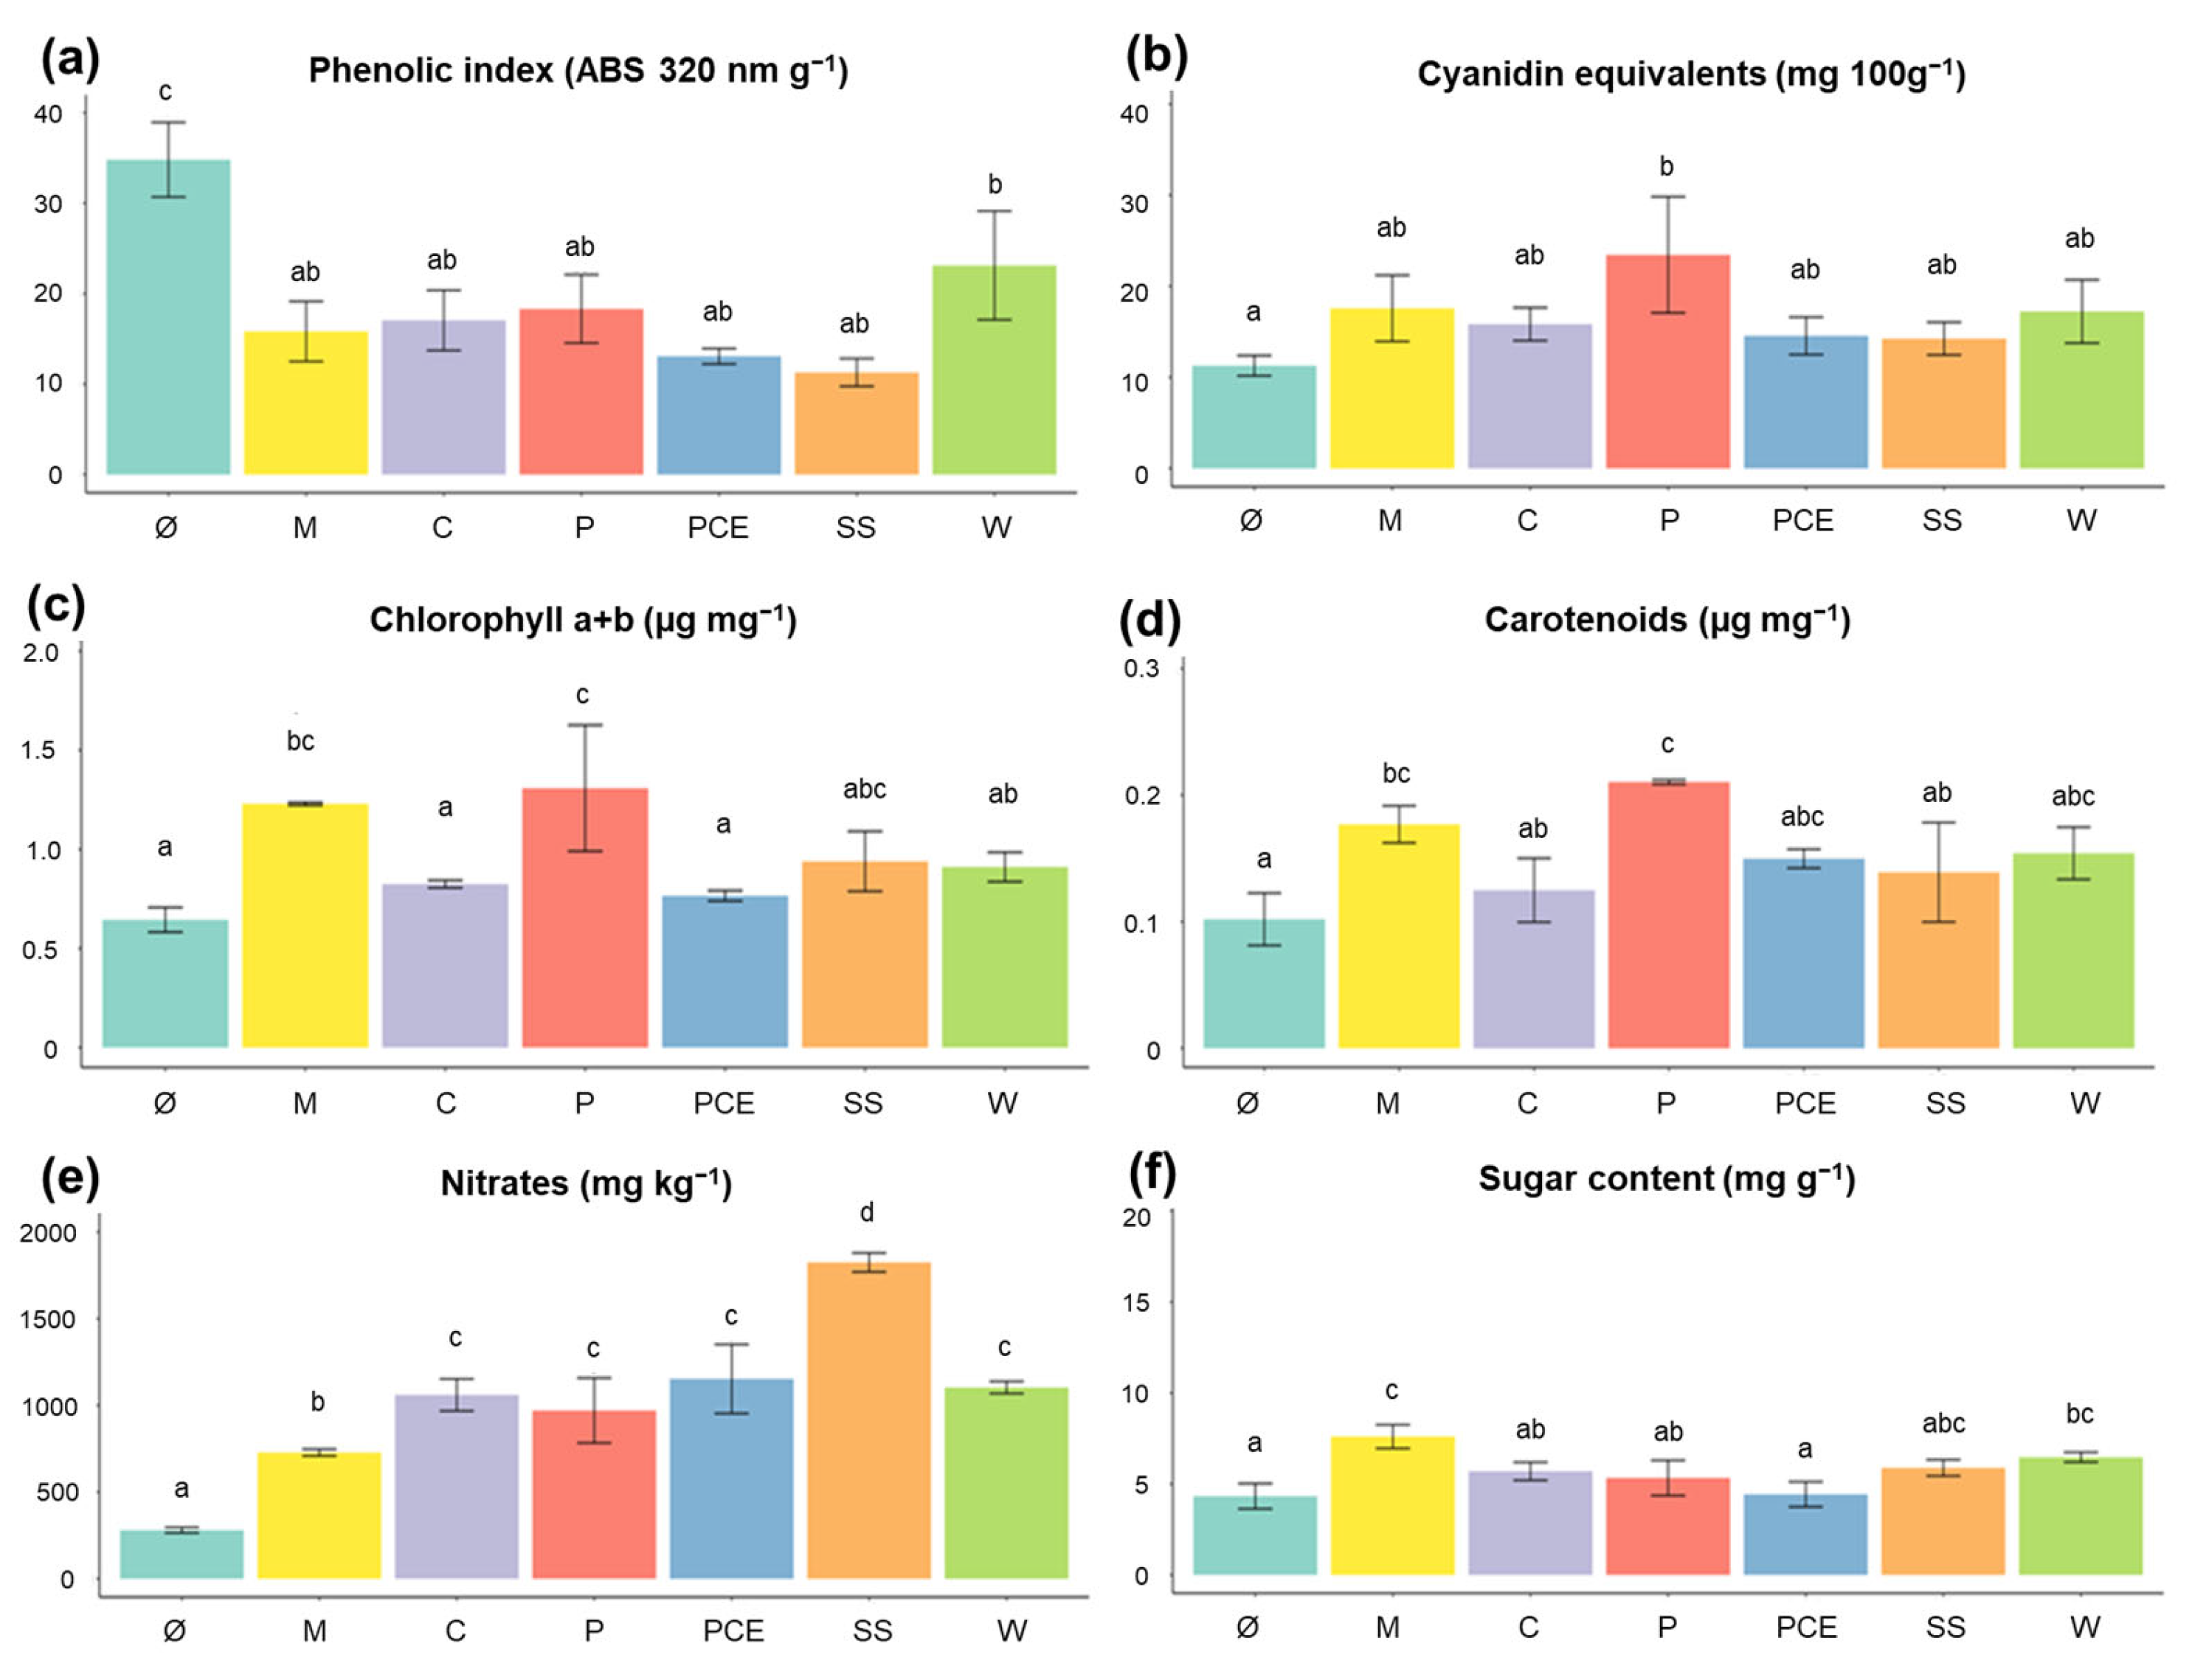
Figure 2 reports the content of different relevant molecules in the biomass at harvest.
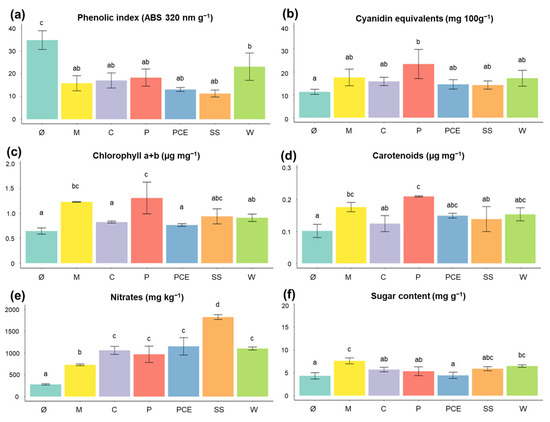
Figure 2.
Graphs reporting the characterization of molecules in the lettuce at harvest: (a) phenolic compounds, reported as absorbance at 320 nm per gram; (b) anthocyanins, reported as cyanidin equivalents; (c) chlorophyll a + b, reported as µg mg−1; (d) carotenoids, reported as µg mg−1; (e) nitrates, reported as mg kg−1; (f) sugar content, reported as mg g−1. Each bar represents the average measure of a treatment, with the error bars reporting standard deviation. Different letters above a bar (a, b, c, d) indicate statistically significant differences in the results according to a one-way ANOVA followed by a Tukey’s post hoc test (p < 0.05). Treatments are (1) Ø, non-fertilized treatment; (2) M, mineral fertilized treatment; (3) C, Cow slurry digestate; (4) P, Pig slurry digestate; (5) PCE, Pig slurry, Cow slurry and Energy Crop digestate; SS, Sewage Sludge; W, organic fraction of municipal solid Waste.
As seen in Figure 2a, the total phenolic compounds content is very high in the non-fertilized Ø plants. All other treatments, however, do not differ from treatment M. The high level of phenolic compounds in Ø could be due to their role as stress-response molecules and be highly concentrated in a starving plant [32].
Anthocyanins concentration, reported in Figure 2b, shows no significant difference among treatments when compared to the mineral fertilizer (p > 0.05).
Regarding leaf pigments, for both chlorophyll (Figure 2c) and carotenoids (Figure 2d), only the P digestate reached values comparable to that of the mineral fertilization, while all other treatments showed similar values to those of Ø.
Nitrate concentrations were quantified since the accumulation of this compound can compromise the commercial quality as it is regulated by European legislation [31]. As expected, the Ø plants had the lowest value of nitrates, having received no nitrogen fertilization (Figure 2e). The digestates had higher values of nitrates compared to M, especially the SS digestate which showed values 60% higher than M. Despite this, all plants were way below the limit of 4000 mg kg−1 reported by the European Commission.
Regarding the sugar content in the leaves, no treatment performed better than M, with PCE in particular having the lowest level, comparable to those of non-fertilized Ø plants (Figure 2f).
Possible accumulation of micropollutants, such as heavy metals, was determined but the concentrations were below the detection limits of the ICP-MS used for the determination.
The concentration of other nutrients appears to undergo variations depending on the fertilizer used, as reported in Table 2. There is no clear pattern that ties the treatment with the concentration of nutrients: for some nutrients, like Ca and Fe, the non-fertilized plants show the highest values, while for P they show the lowest. Mineral nutrition often shows extreme values, having the lowest value for Ca, Mg, and Na and the highest for P. All the digestates show intermediary values between these two extremes, with different high or low values depending on the single digestate.

Table 2.
Nutrient concentrations in the lettuce plants at harvest, expressed as average mg g−1 DW ± standard deviation. Treatments are (1) Ø, non-fertilized treatment; (2) M, mineral fertilized treatment; (3) C, cow slurry digestate; (4) P, pig slurry digestate; (5) PCE, pig slurry, cow slurry and energy crop digestate; SS, sewage sludge; W, organic fraction of municipal solid waste. Different letters after a value (a, b, c, d, e) indicate statistically significant differences in the results according to a one-way ANOVA followed by a Tukey’s post hoc test (p < 0.05).
3.3. Substrate Chemical Analysis: Nitrate, Ammonia, Total Nitrogen Determination and pH
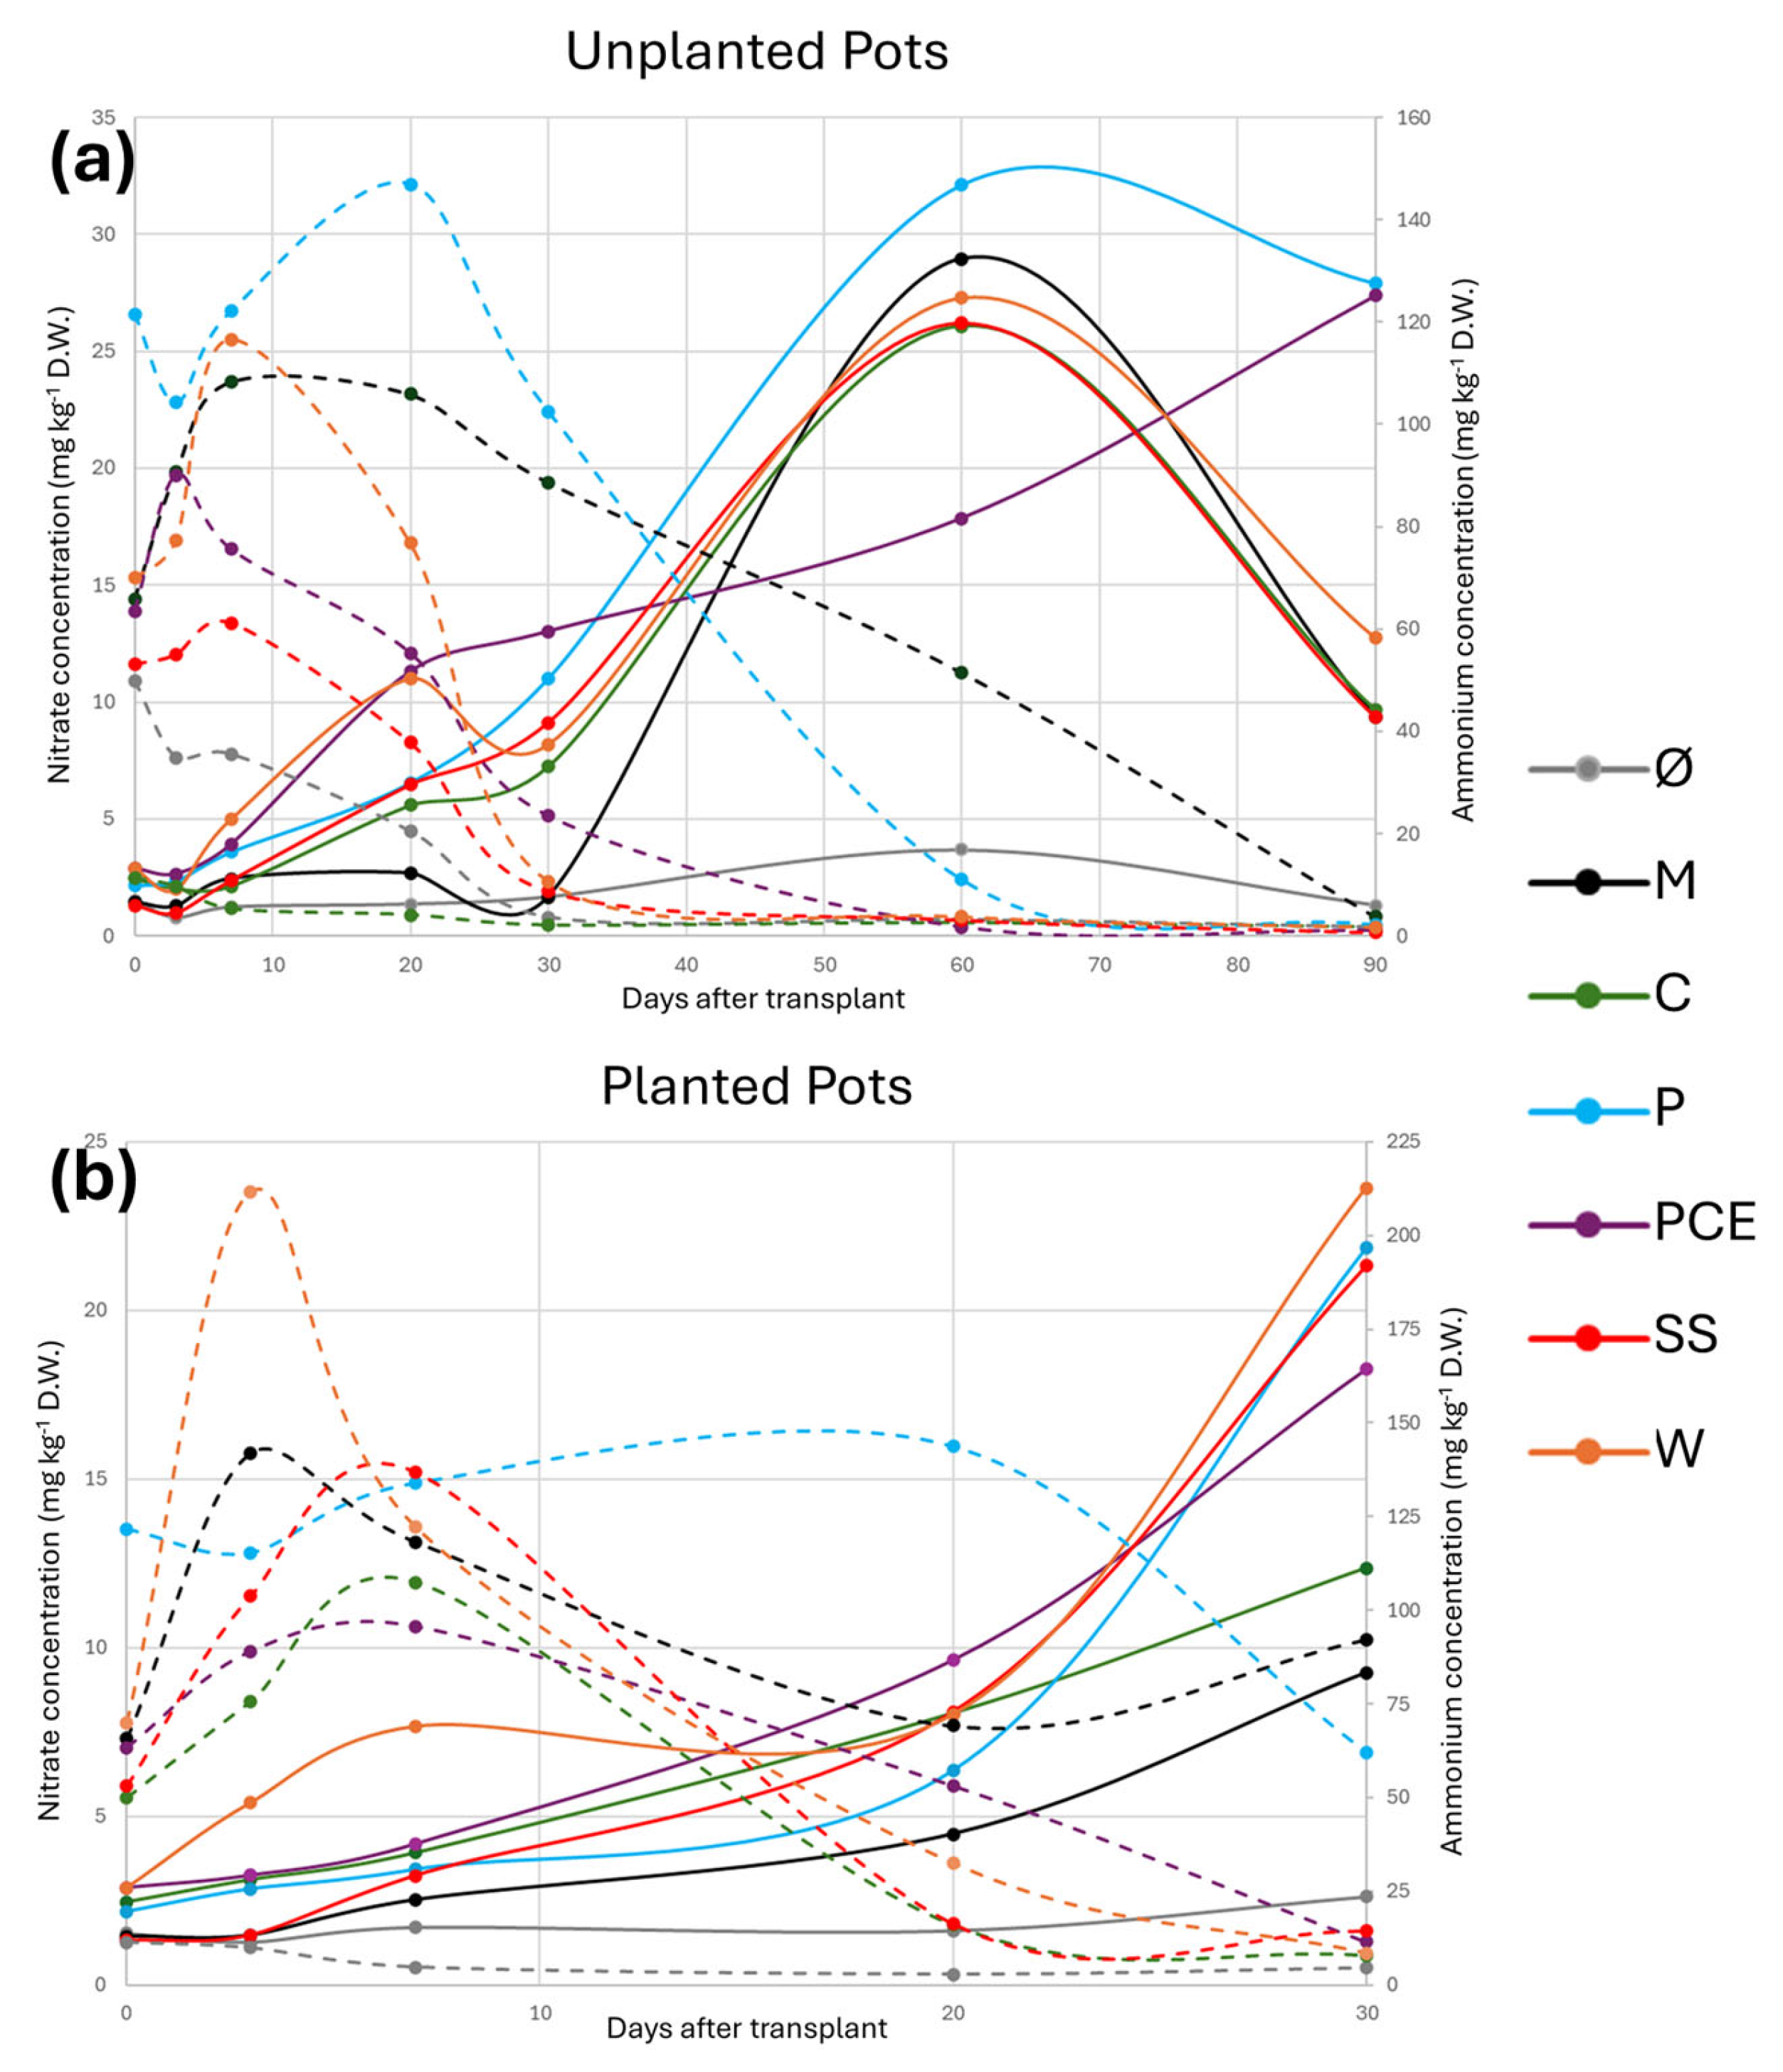
The overall trend for nitrate evolution is reported in Figure 3.
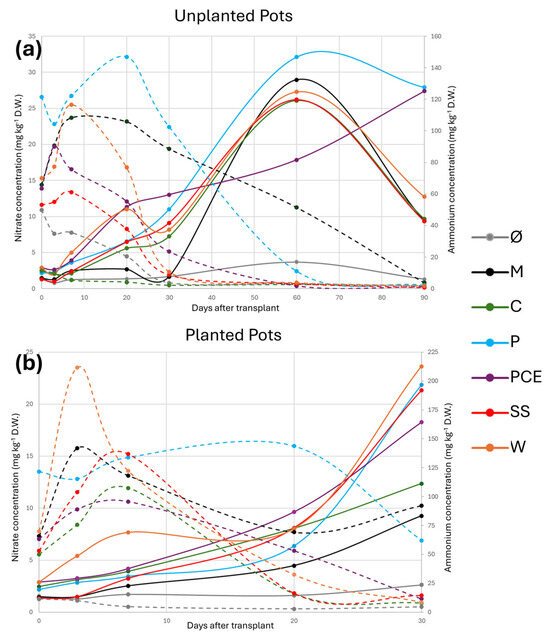
Figure 3.
Graphs reporting the nitrate and ammonium evolution during the trial in (a) unplanted and (b) planted pots. In the graphs, the X-axis reports the days after transplant (DAT), the main Y-axis reports the concentration of nitrate, and the secondary Y-axis reports the concentration of ammonium. Each line represents a different treatment, as reported in the legend. The full lines report the nitrate concentration, while the dashed lines report the ammonium concentration. Treatments are (1) Ø, non-fertilized treatment; (2) M, mineral fertilized treatment; (3) C, cow slurry digestate; (4) P, pig slurry digestate; (5) PCE, pig slurry, cow slurry and energy crop digestate; SS, sewage sludge; W, organic fraction of municipal solid waste.
The general trend of nitrates, both with and without plants, shows the lowest concentration at the beginning of the trial. The concentration of nitrates starts to increase around 10 DAT and progresses until 30 DAT. For the unplanted pots (Figure 3a), the peak of nitrates was reached at 60 DAT and, for all treatments except PCE, it then decreased at 90 DAT. Overall, as expected, the Ø treatment showed the lowest nitrate concentration, close to 0, both with and without plants. When plants were present (Figure 3b), all treatments showed nitrate values higher than the M control and, even at the end of the longer experiment with unplanted substrate, all digestates showed nitrate levels equal or higher than the M control.
The situation was the opposite when considering ammonium evolution: the peak concentration was reached around 10–20 DAT and it then decreased over time. All treatments except M and P reached values close to zero in the 30 days of the trial.
Overall, at the end of the trial, all digestates showed a higher concentration of nitrates compared to M, particularly P and PCE that showed the highest values.
The total nitrogen contents due to the closed pots, the sub-acid pH and the appropriate oxygen concentration, which would not have allowed any losses, did not show a change in the concentration.
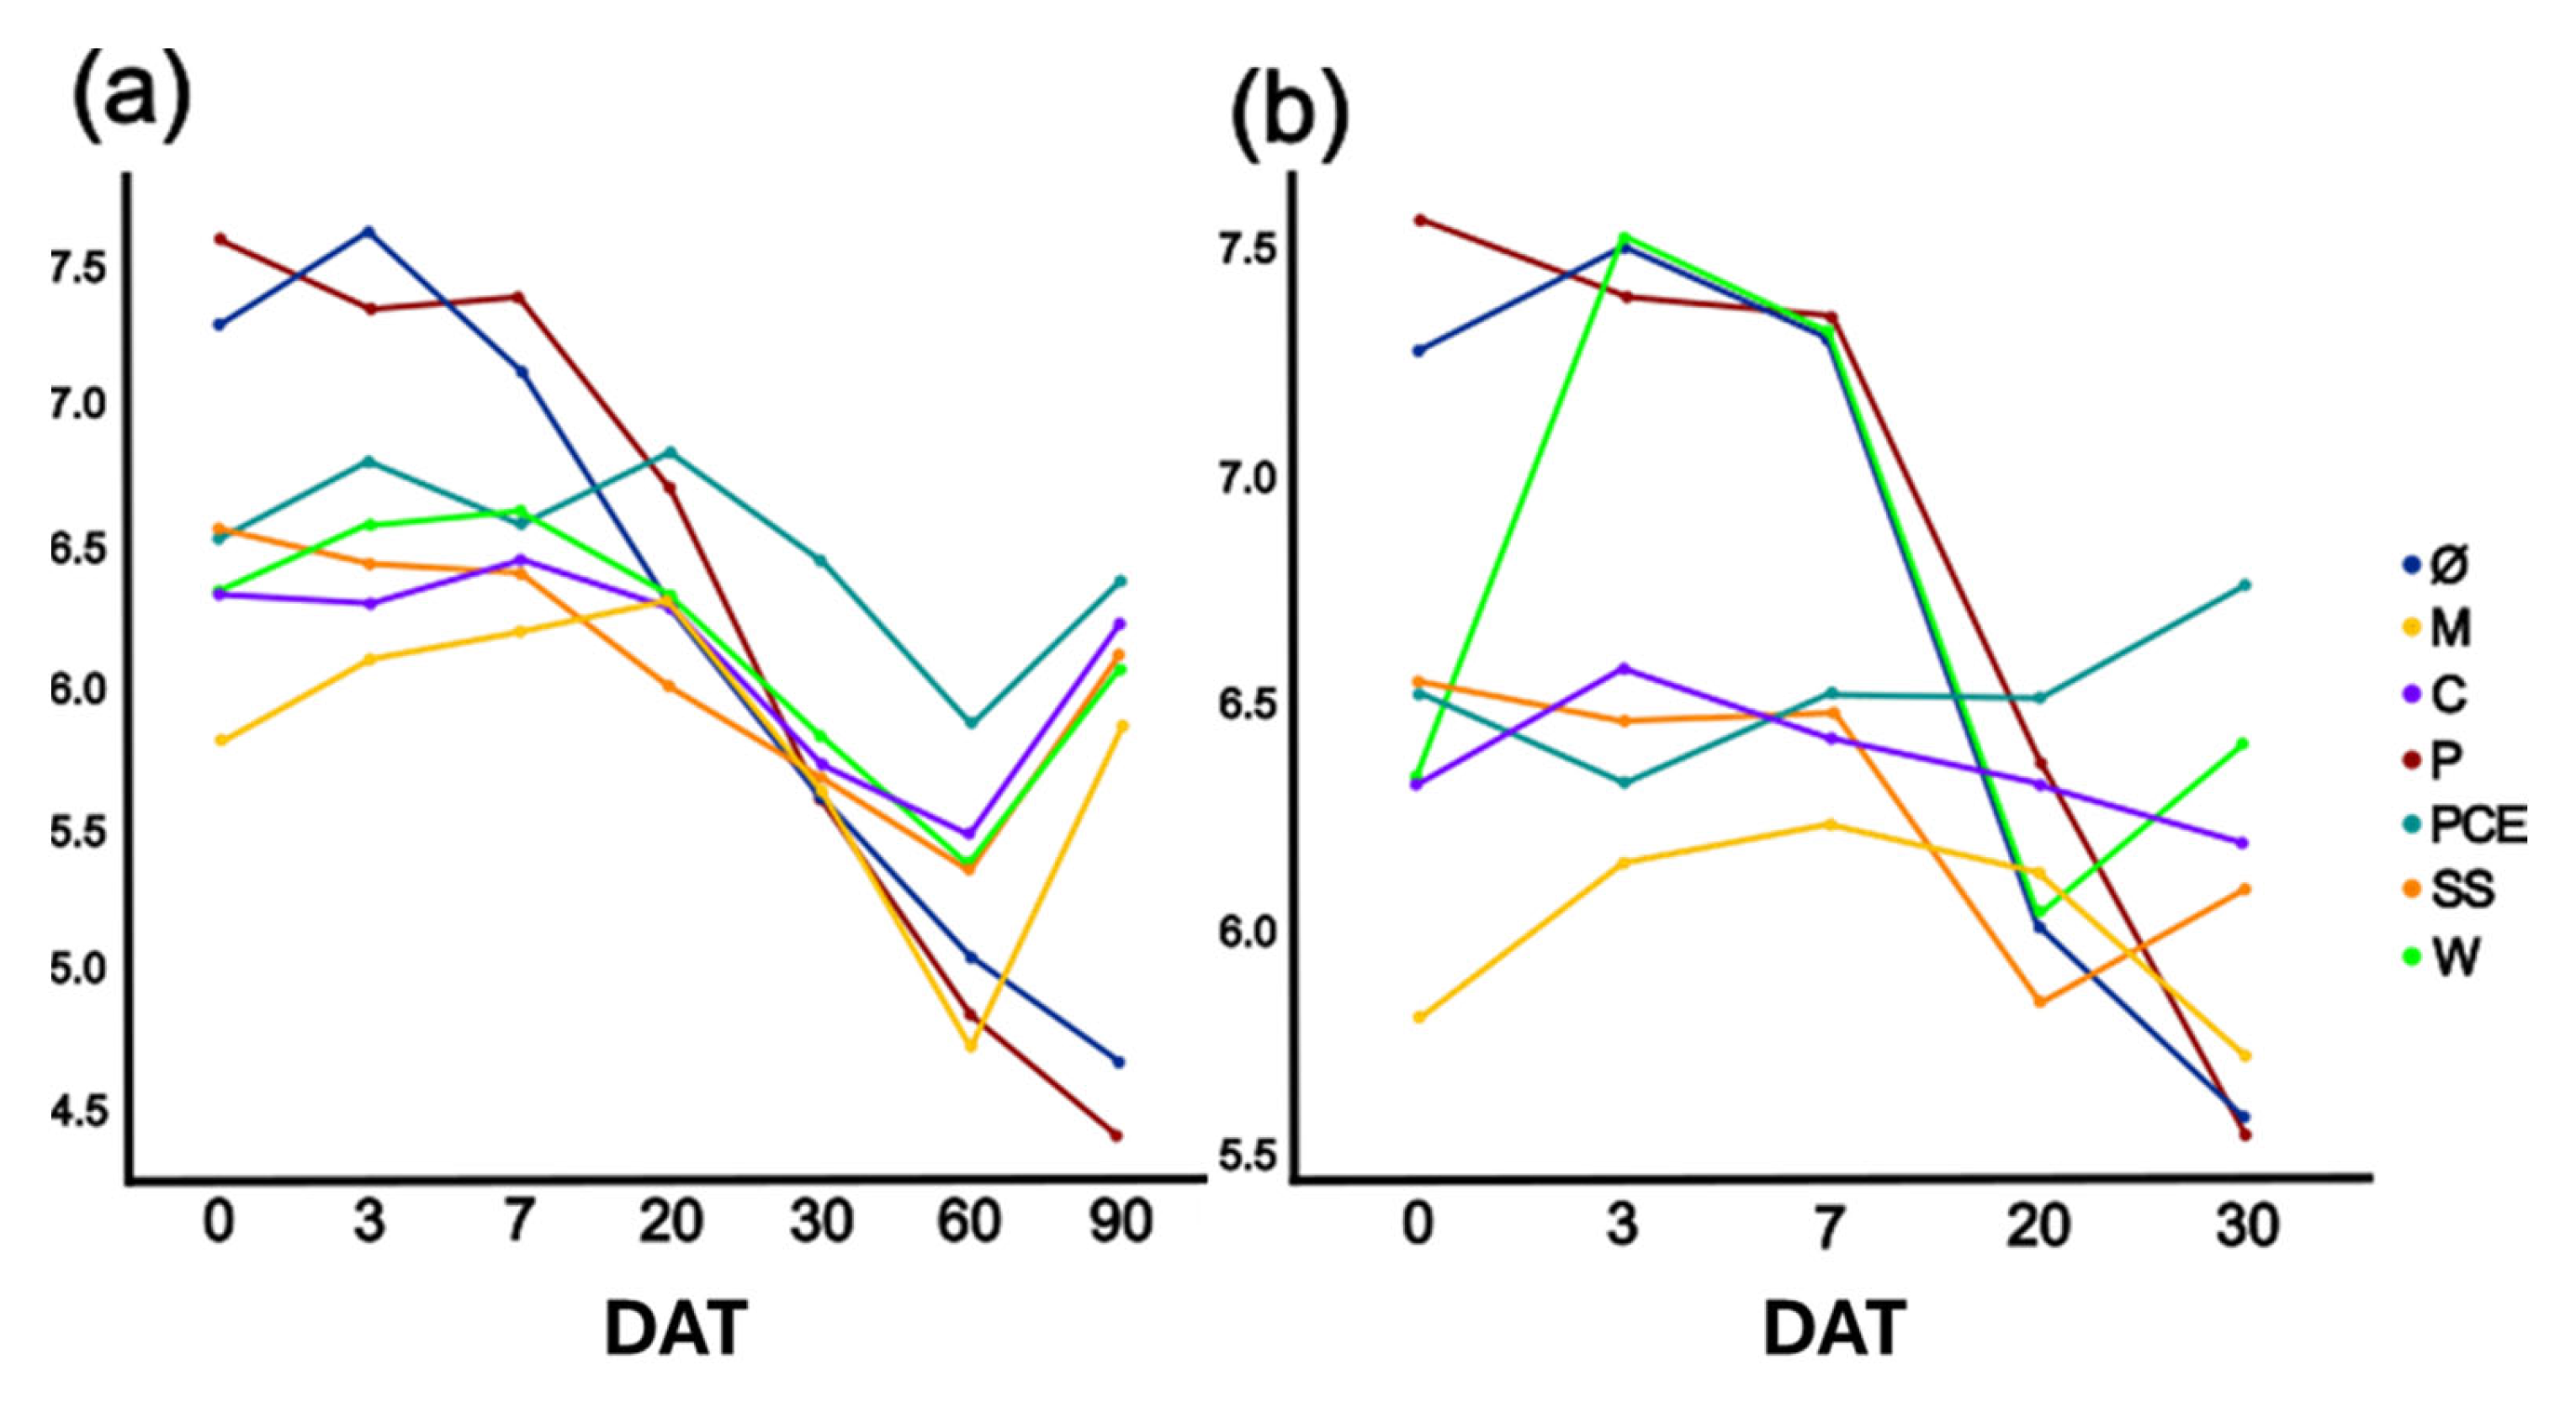
The substrate nitrification process is generally accompanied by a lowering of pH. For this reason, its progress was monitored during the test. As reported in Figure 4 the pH dropped over time but, in most treatments, it returned almost to its original value by the end of the trial. The main difference was with the P and PCE treatments for which, both with and without plant, the pH consistently diminished with the progress of the experiment. These treatments started from the highest pH between 7.0–7.5 and reached a final value between 4.5 and 5.5.
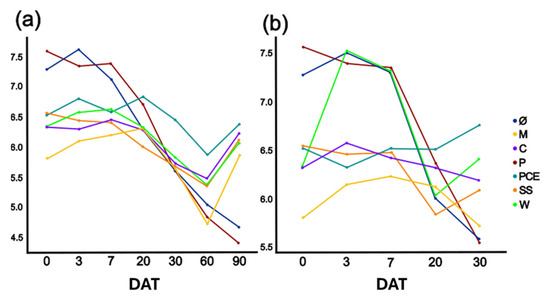
Figure 4.
Graphs reporting the pH evolution in the (a) unplanted or (b) planted pots. The X-axis reports the days after transplant (DAT), while the Y-axis reports the pH value in the substrates. Each color represents a different treatment, as reported in the legend. Treatments are (1) Ø, non-fertilized treatment; (2) M, mineral fertilized treatment; (3) C, cow slurry digestate; (4) P, pig slurry digestate; (5) PCE, pig slurry, cow slurry and energy crop digestate; SS, sewage sludge; W, organic fraction of municipal solid waste.
3.4. Substrates Respiration
Substrate respiration can be used both as a measure of the degradability of organic matter and as an index of nutrient release by a biomass. As shown in Figure 5, there is a significant difference among the various treatments, M had the same respiration as SS and Ø while C displayed the highest of all. As shown in Figure 5, there is no significant difference among digestates used in the experiment.

Figure 5.
Graph reporting the respiration of the substrates. Each bar represents a different treatment, and the height of the bar represents the cumulative mg of CO2 per gram of substrates. The numbers on top of the bars report the average value for each treatment. Different letters above a bar (a, b, c) indicate statistically significant differences in the results according to a one-way ANOVA followed by a Tukey’s post hoc test (p < 0.05). Treatments are (1) Ø, non-fertilized treatment; (2) M, mineral fertilized treatment; (3) C, cow slurry digestate; (4) P, pig slurry digestate; (5) PCE, pig slurry, cow slurry and energy crop digestate; SS, sewage sludge; W, organic fraction of municipal solid waste.
3.5. Bacterial Quantification
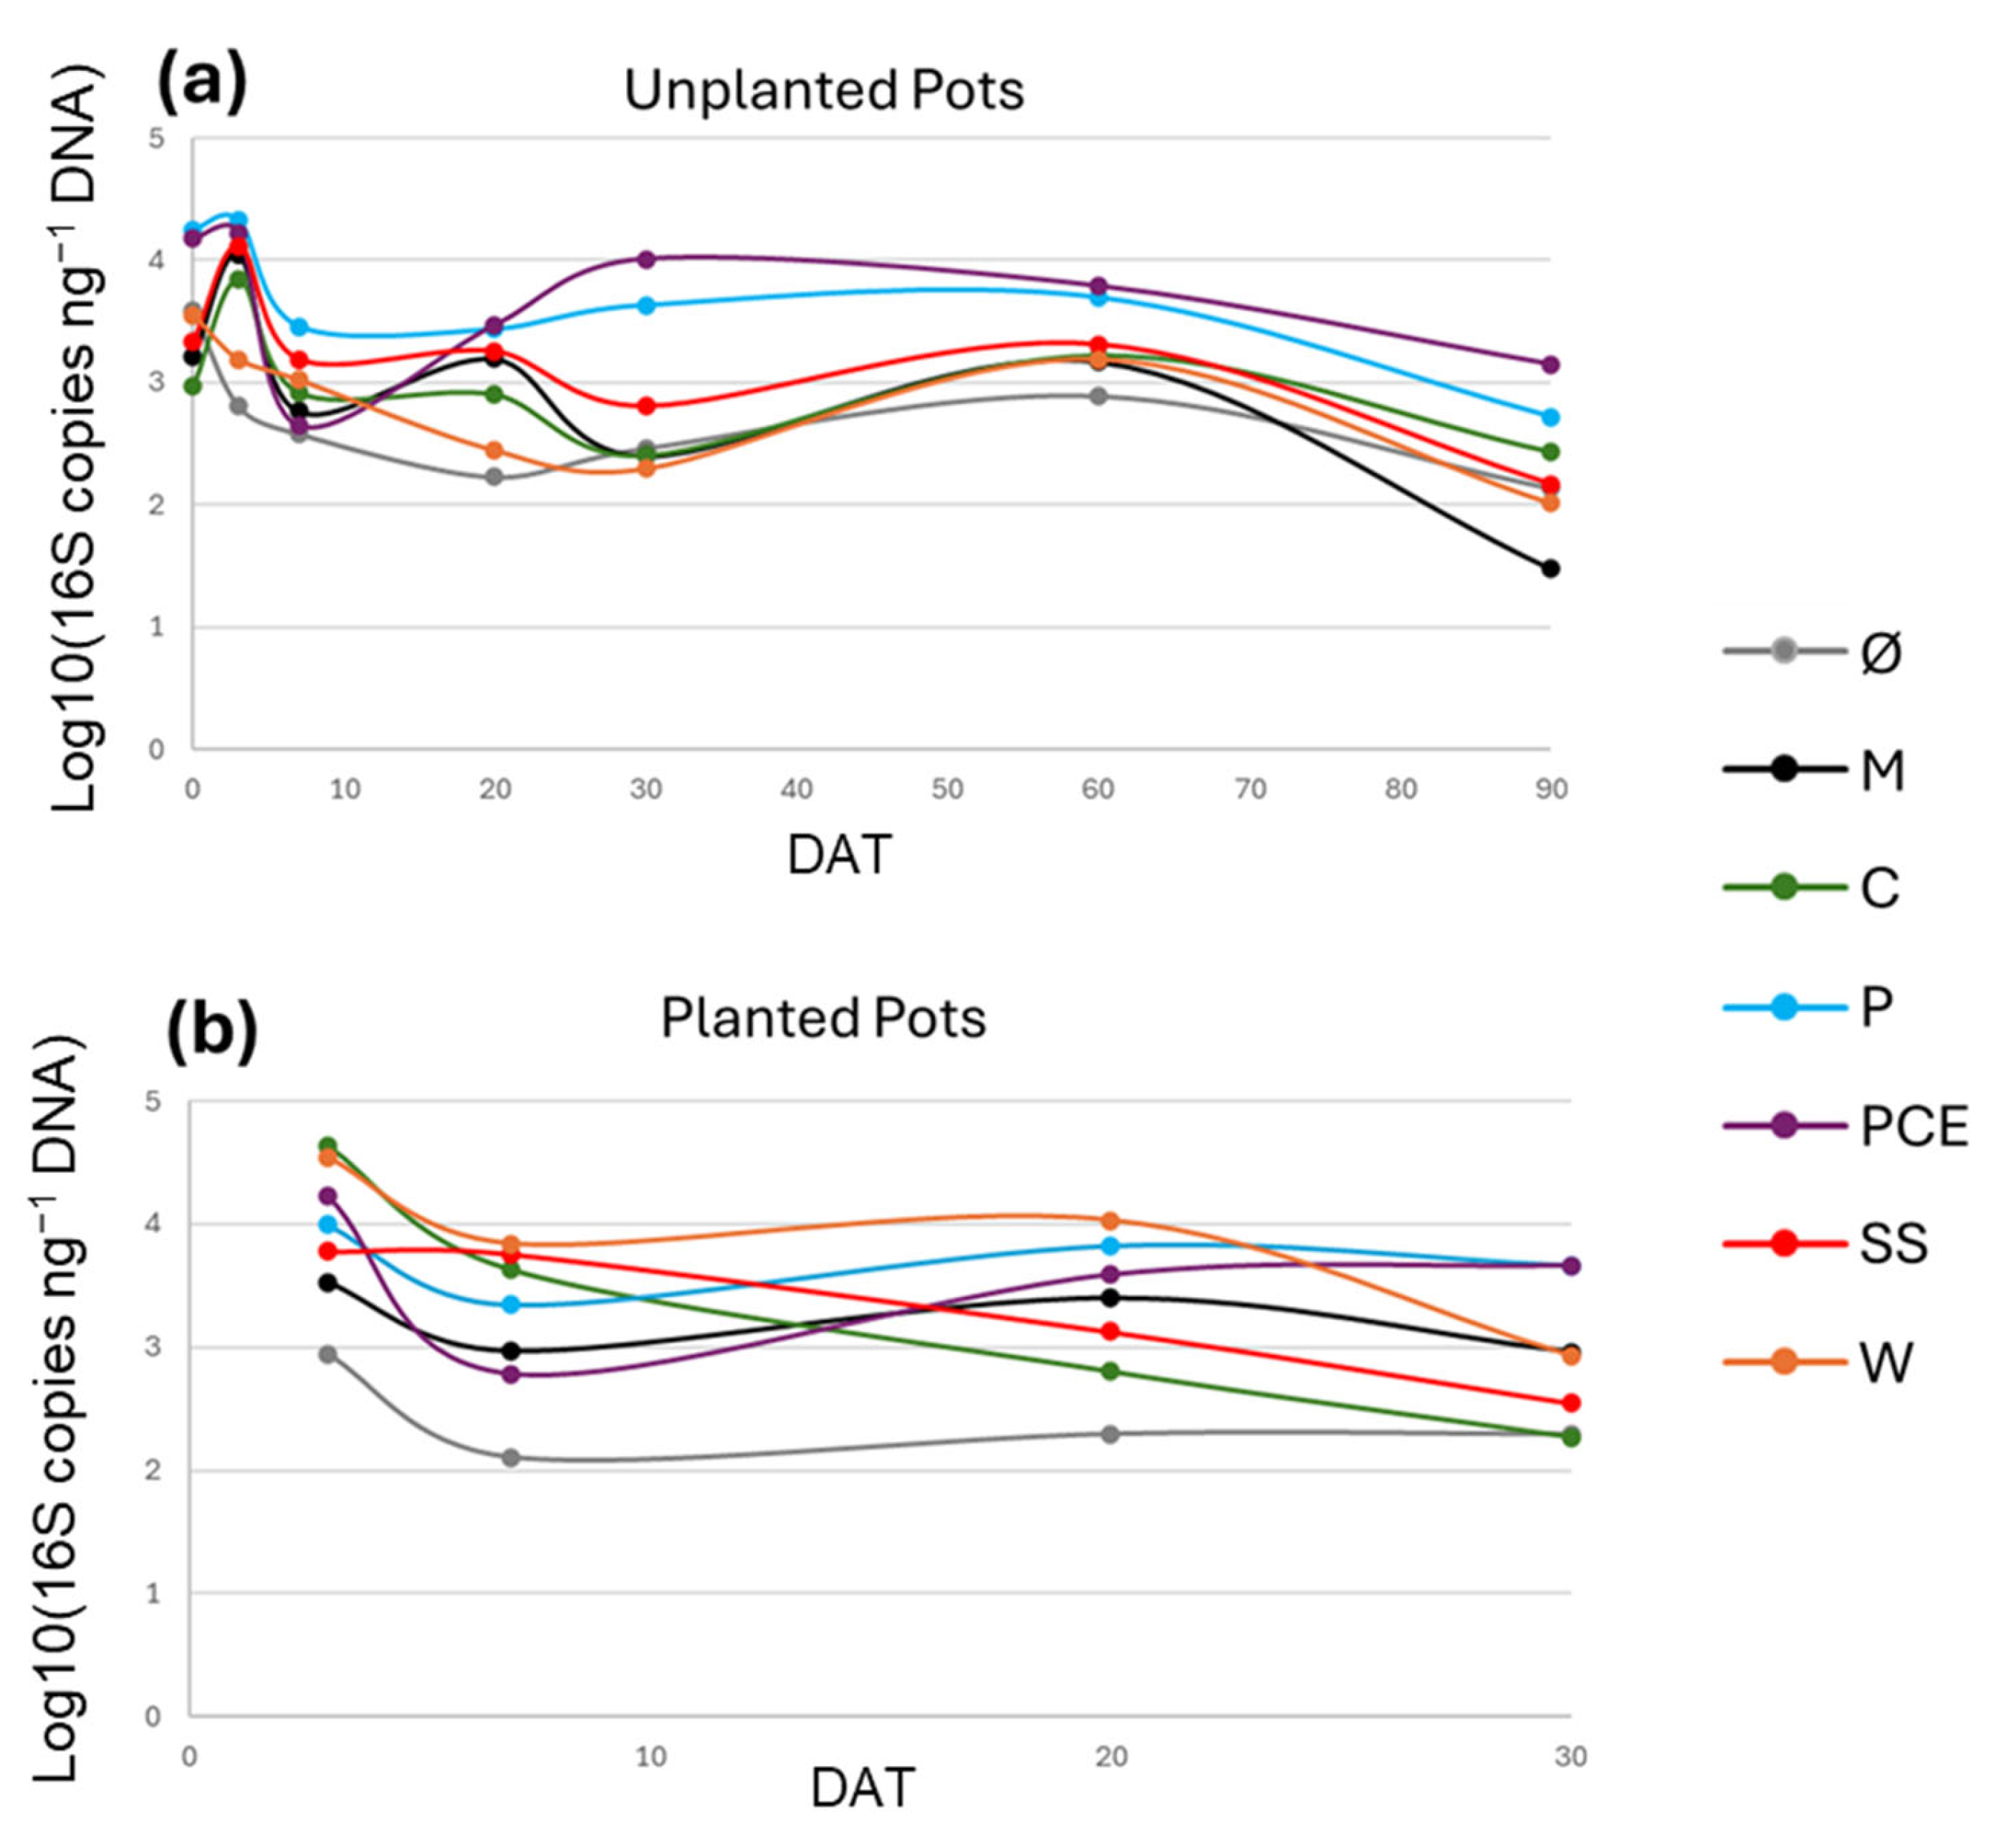
The amplification of the 16S gene with dPCR and qPCR techniques allowed for quantifying the number of 16S gene copies present in the samples. While different bacterial species can have a varying number of copies of the gene, the quantity of copies of this gene in the sample is correlated with the abundance of bacteria in the substrates. The starting concentration of 16S copies ranged from 103 to 104, and generally reached the peak at 3 DAT, in some cases reaching up almost up to 105 copies ng−1 DNA (Figure 6). After 3 DAT, the general trend shows a decrease in bacterial 16S abundance, except for P and PCE treatments: they show around 104 16S copies ng−1 DNA at 30 DAT and around 103 at 90 DAT in the unplanted pots. Overall, at 30 DAT, the lowest bacterial abundance can be found in Ø and C at 30 DAT, and in M at 90 DAT.
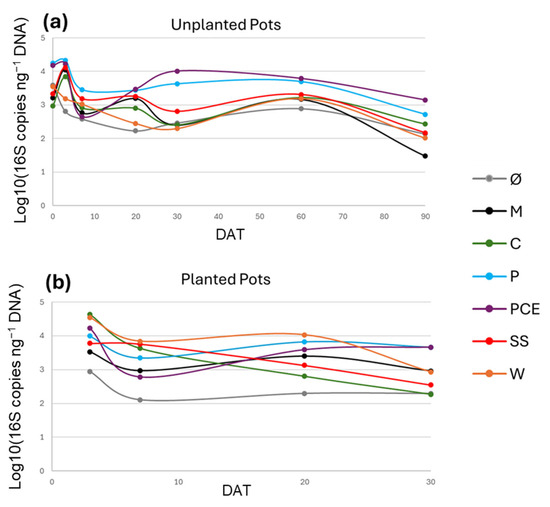
Figure 6.
Graphs reporting the 16S gene copy number during the trial in (a) unplanted and (b) planted pots. In the graphs, the X-axis reports the days after transplant (DAT), and the Y-axis reports the 16S gene copy numbers, expressed in logarithmic scale of 16S copy number normalized on the ng of DNA of the samples. Each line represents a different treatment, as reported in the legend. Treatments are (1) Ø, non-fertilized treatment; (2) M, mineral fertilized treatment; (3) C, cow slurry digestate; (4) P, pig slurry digestate; (5) PCE, pig slurry, cow slurry and energy crop digestate; SS, sewage sludge; W, organic fraction of municipal solid waste.
3.6. Bacterial Community Description
The number of reads obtained after sequencing with the MinION and of species identified in each sample—after removing all sequences from chloroplasts, mitochondria, and rare species appearing with abundance < 10 in the whole dataset—is reported in Supplementary Figure S1.
The dataset was then used to explore the bacterial diversity at both the phylum and family level.
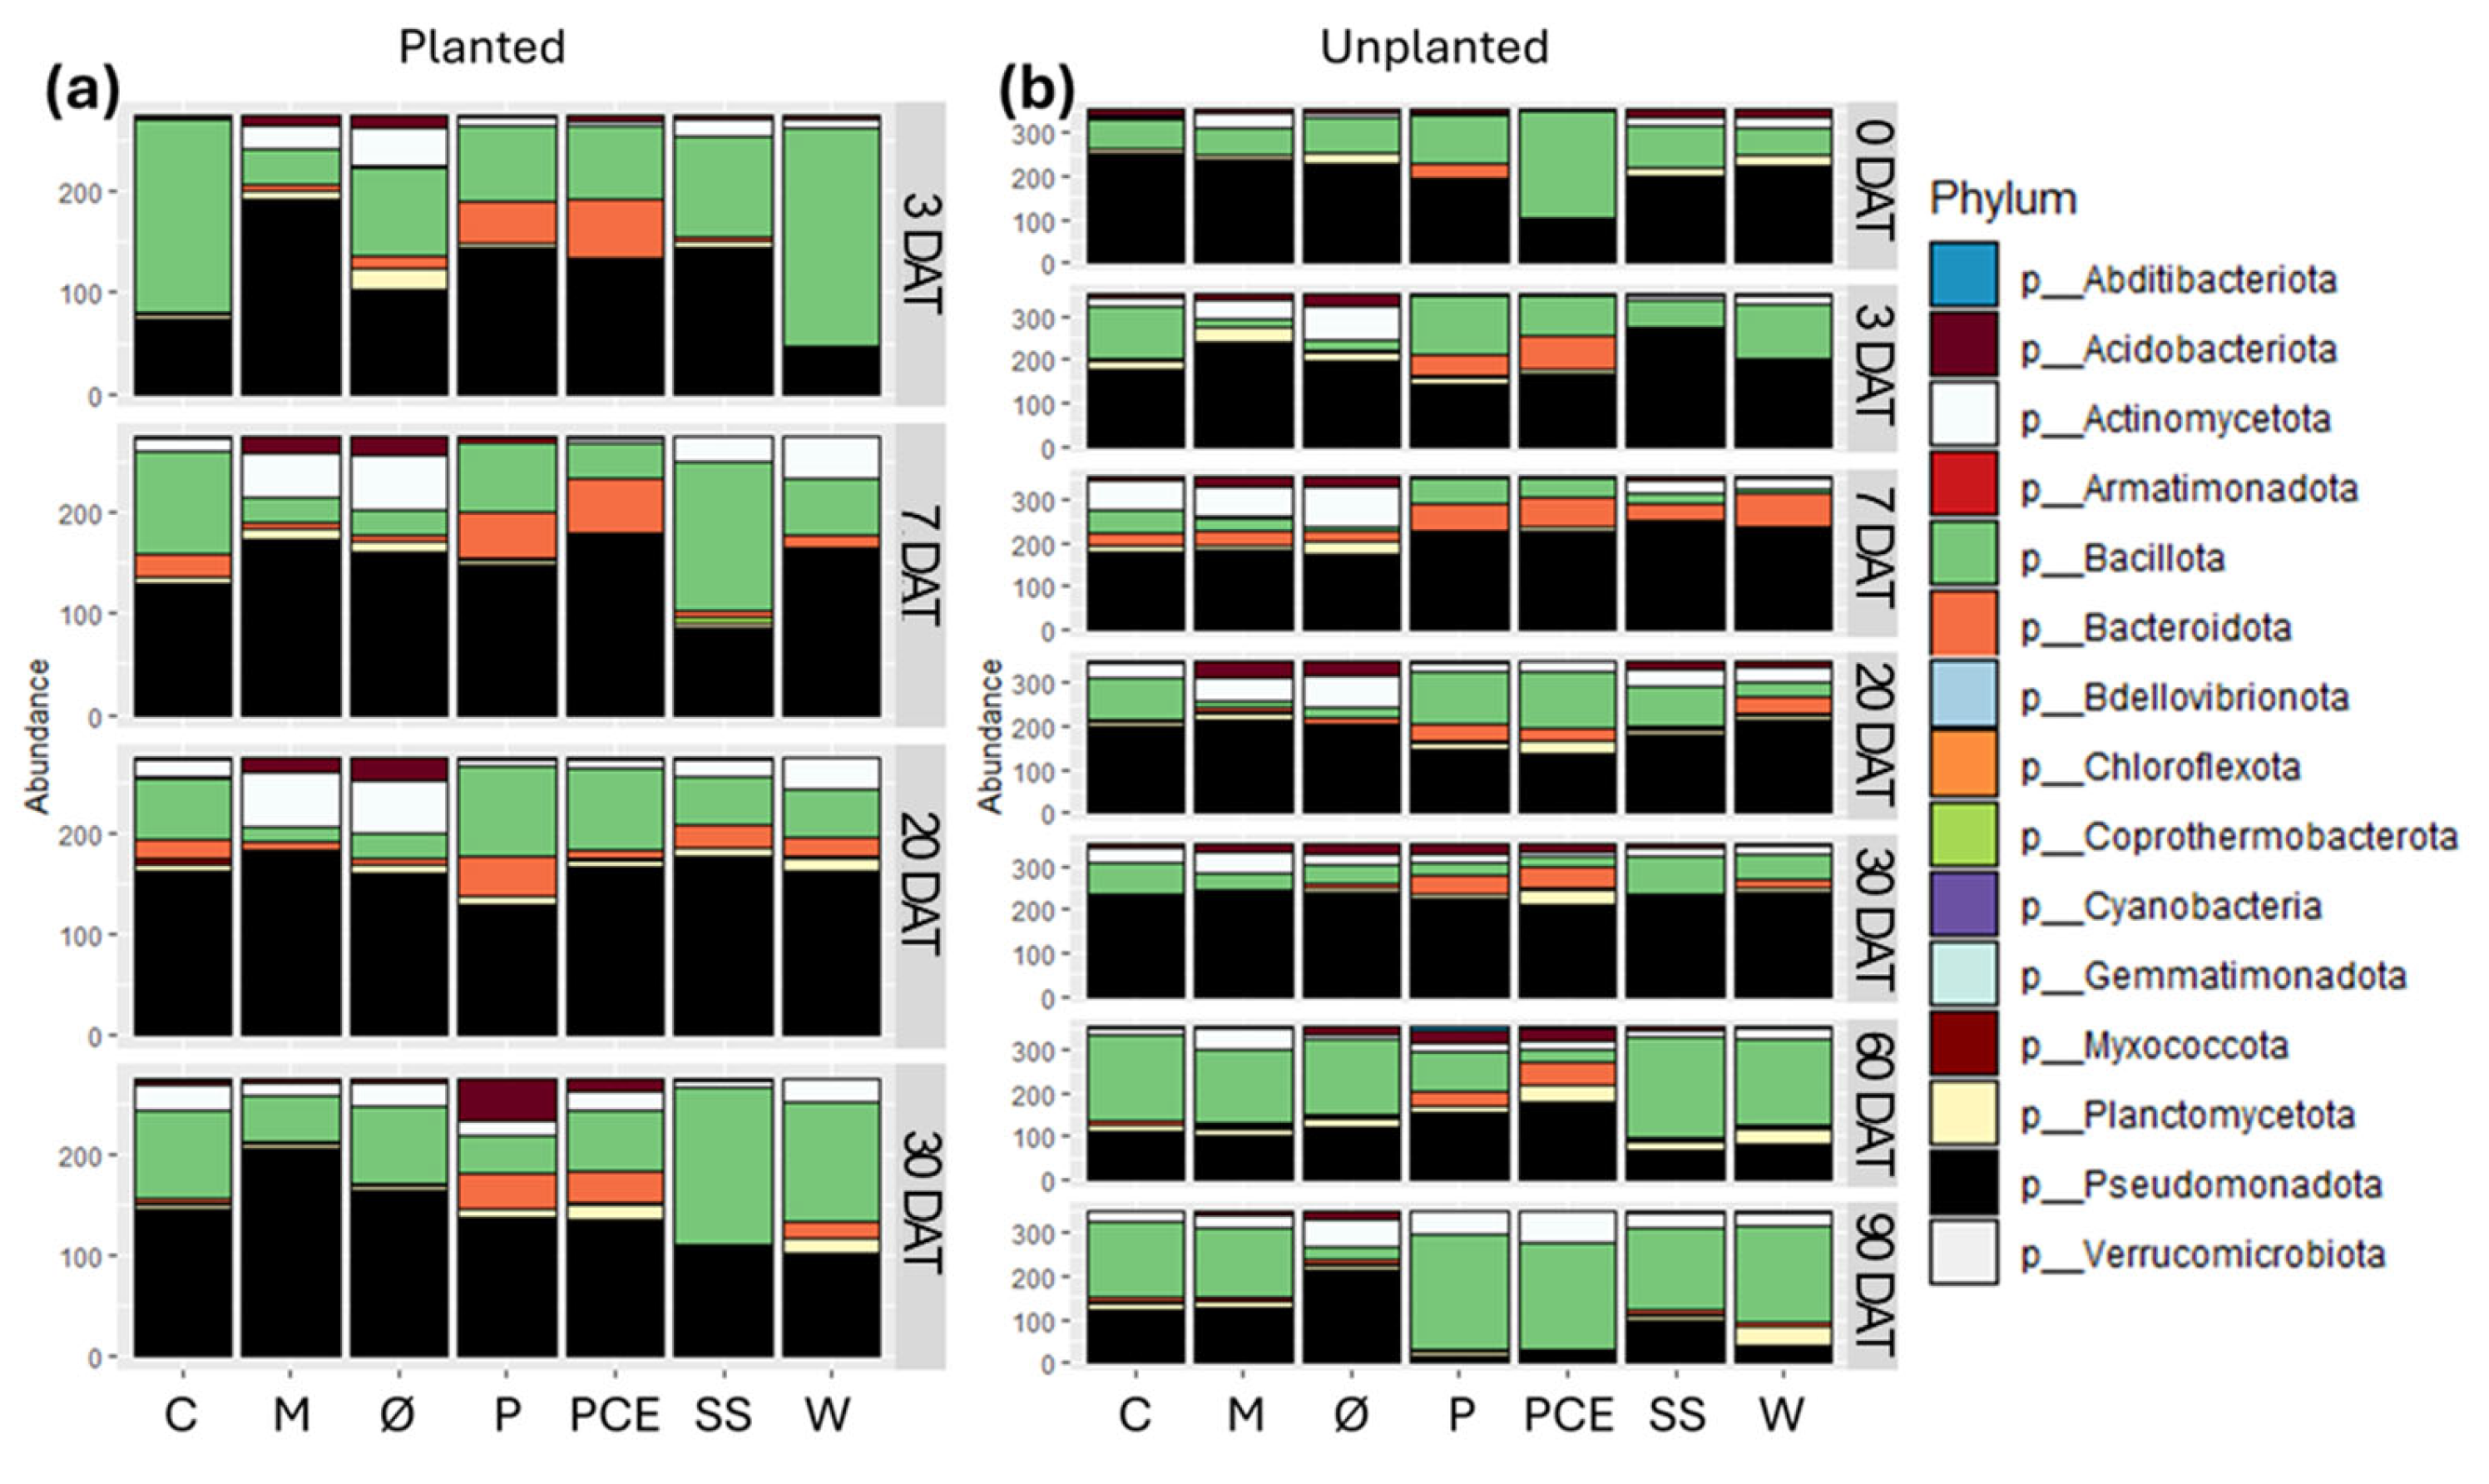
Starting from the phylum level, each bacterial community is dominated by three of these four phyla: Actinomycetota, Bacillota, Bacteroidota, and Pseudomonadota (Figure 7). The relative abundance between them varies for each sample and time point, but 3 of these phyla constitute together at least 75% of the whole bacterial population in every sample. A notable exception to this is the P treatment at 30 DAT in planted pots, in which there is a high population of Acidobacteriota. As a general trend, in most time points, both planted and unplanted, the Ø and M controls show a very similar composition of the bacterial community. The same can be said for the P and PCE treatments. The results obtained at 0 DAT, showing the effects right after the treatment with the digestates, show that only PCE immediately and strongly affected the substrates bacterial community structure by drastically increasing the quantity of Bacillota and reducing the Pseudomonadota. All treatments other than P and PCE maintain in general a similar structure to that of the non-fertilized substrates in the unplanted pots (Figure 7b) up until 60 DAT, while at 90 DAT the structure remains quite distinct between the fertilized and non-fertilized substrates.
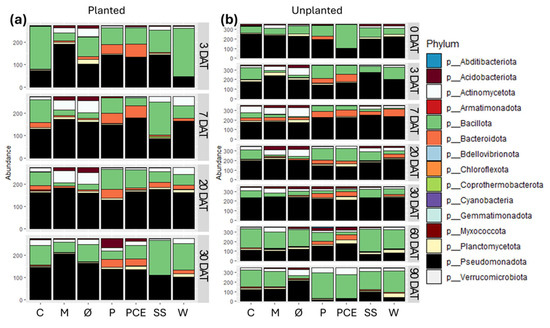
Figure 7.
Stacked bar graphs reporting the abundance of different bacterial phyla in the substrates samples coming from (a) planted and (b) unplanted pots. In each graph, the X-axis reports the different treatments, while the Y-axis reports the abundance of bacterial 16S reads, with samples rarefied to the same depth. Each row in the graphs reports the data for a single time point, as indicated on the right side of the row. Each color in the bars indicates a different bacterial phylum, as reported in the legend. Treatments are (1) Ø, non-fertilized treatment; (2) M, mineral fertilized treatment; (3) C, cow slurry digestate; (4) P, pig slurry digestate; (5) PCE, pig slurry, cow slurry and energy crop digestate; SS, sewage sludge; W, organic fraction of municipal solid waste.
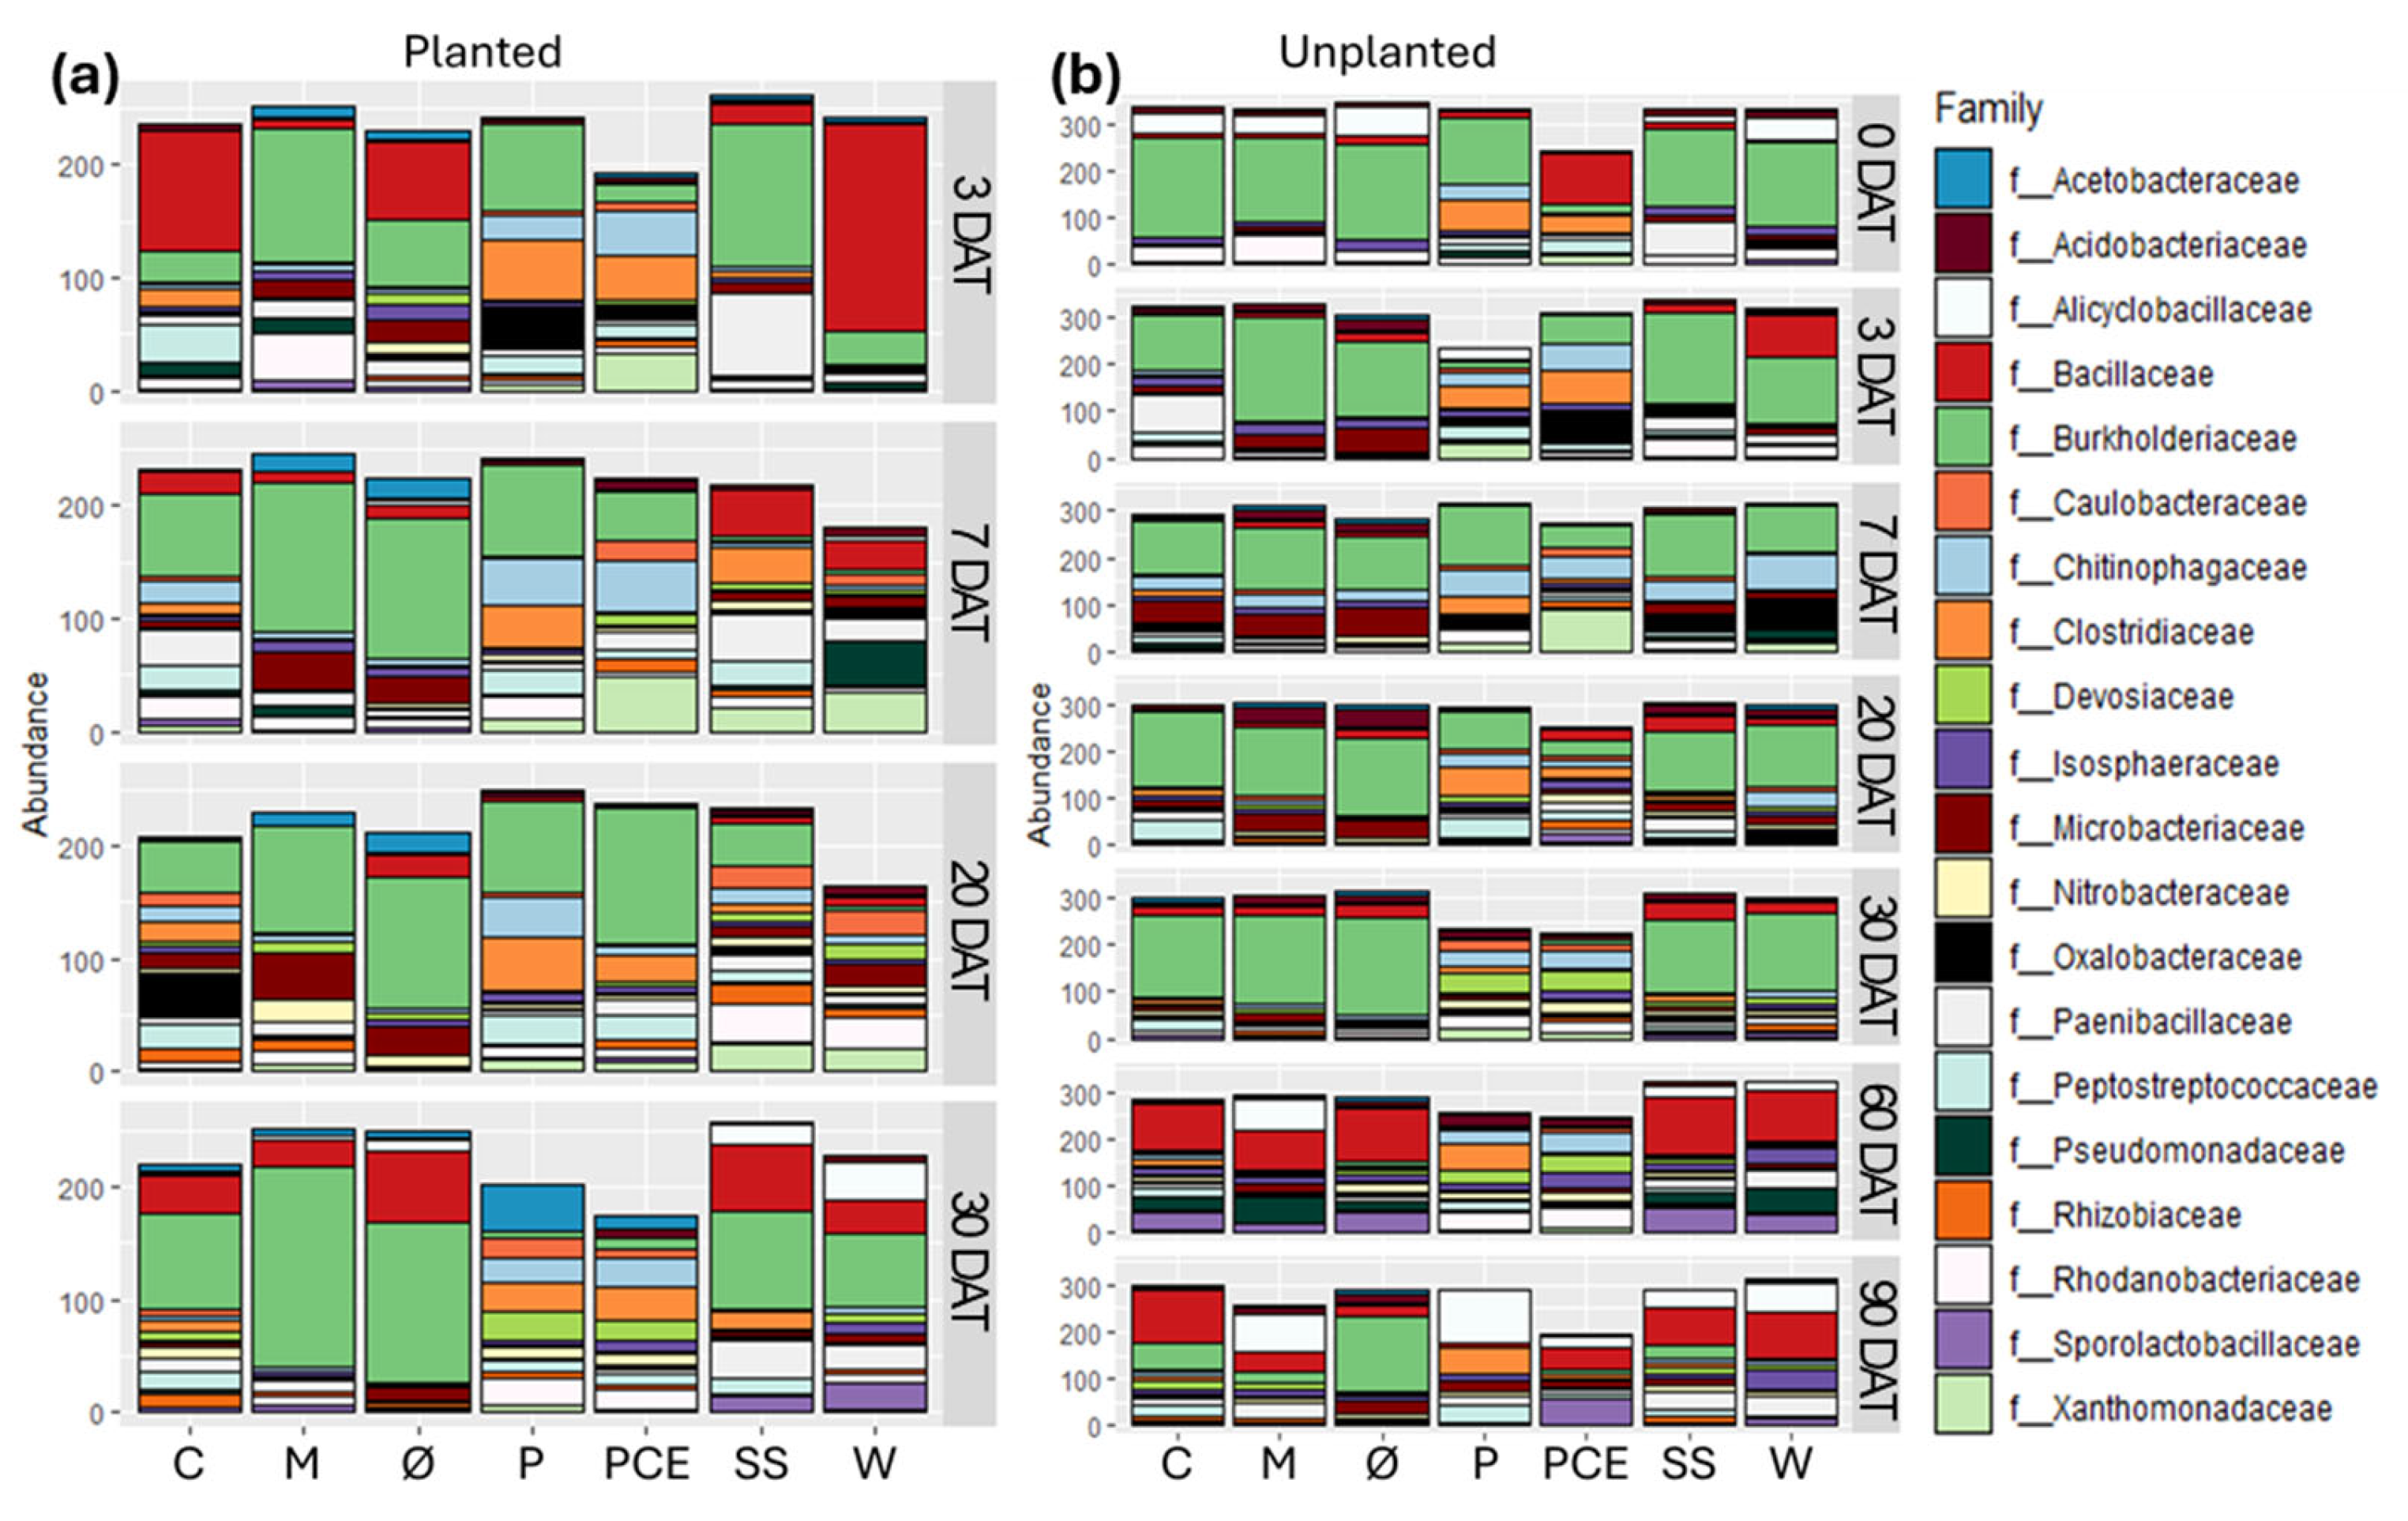
Increasing the depth of analysis to family level revealed more variability in the composition of the bacterial communities (Figure 8).
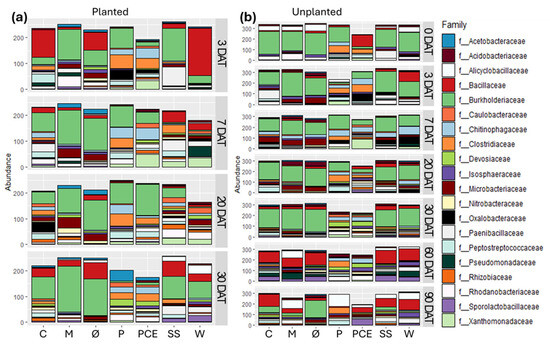
Figure 8.
Stacked bar graphs reporting the abundance of different bacterial families in the substrate samples coming from (a) planted and (b) unplanted pots. In each graph, the X-axis reports the different treatments, while the Y-axis reports the abundance of bacterial 16S reads, with samples rarefied to the same depth. Each row in the graphs reports the data for a single time point, as indicated on the right side of the row. Each color in the bars indicates a different bacterial phylum, as reported in the legend. The graphs report only the 20 most abundance families found in the dataset, empty space between the end of the bar and the top of the graph is the quantity of reads not included in these 20 families. Treatments are (1) Ø, non-fertilized treatment; (2) M, mineral fertilized treatment; (3) C, cow slurry digestate; (4) P, pig slurry digestate; (5) PCE, pig slurry, cow slurry and energy crop digestate; SS, sewage sludge; W, organic fraction of municipal solid waste.
First, the Bacillota reads mostly belong to three families: Bacillaceae, Clostridiaceae, or Paenibacillaceae. Which one is the dominant of the three is different in the different samples and, in particular, Clostridiaceae are present in abundance almost exclusively in the P and PCE samples. Some are found also in other samples treated with the digestates, but they are completely absent from all time points for the non-fertilized and mineral controls, making them akin to markers of the digestate treatment.
Among the Pseudomonadota, the main family found is that of Burkholderiaceae, with secondary families found including Pseudomonadaceae, Oxalobacteriaceae, and Nitrobacteriaceae. All these families are known to include species capable of being helpful to plant development and it is interesting to note that, at most time points, the P and PCE treatments show a lower abundance of Burkholderiaceae—which instead are dominant in other treatments—and a higher concentration of these secondary families.
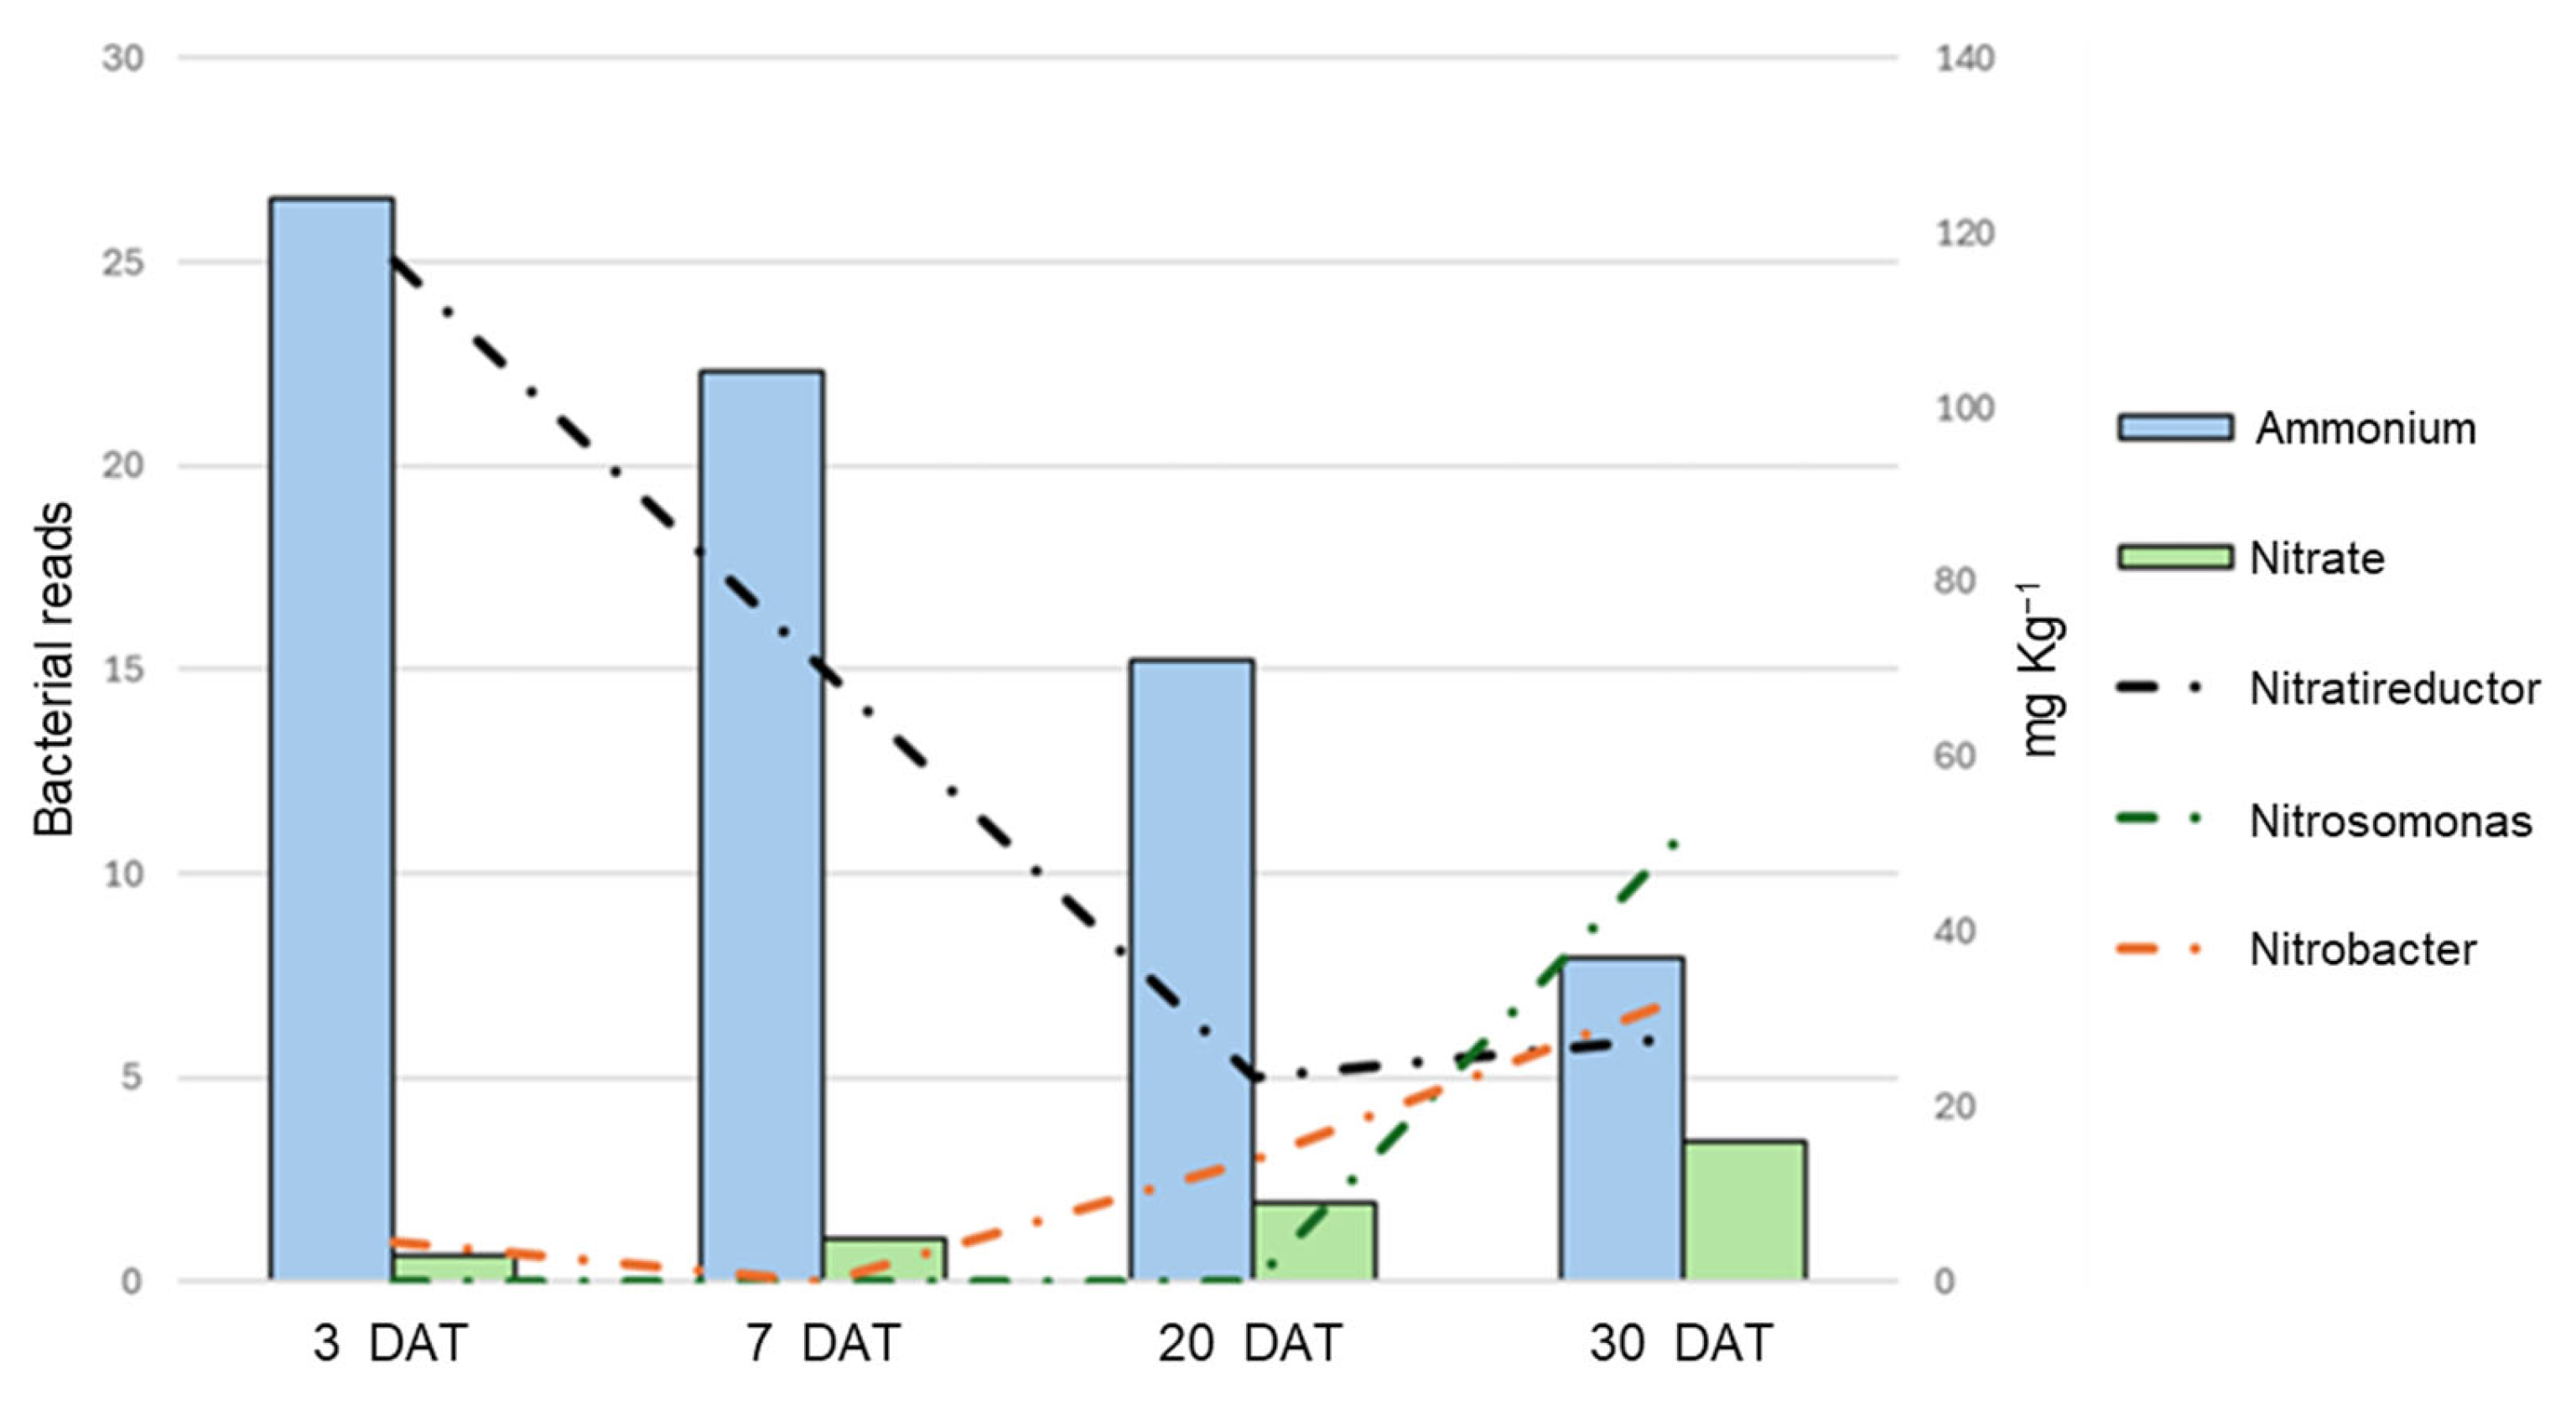
After noticing the presence of Nitrobacteriaceae in the dataset, an in-depth analysis focused only on bacteria known to take part in the nitrogen cycle was carried out. The dataset contained six different bacterial species associated with the nitrogen cycle: two Nitratireductor species, converting nitrites into ammonium (N. aestuarii and N. lucknowense); three Nitrobacter species (N. hamburgensis, N. vulgaris, and N. winogradskyi) and Nitrosospira multiformis, capable of converting nitrites into nitrates. These were detected only in a few sample types: W planted, P unplanted, and PCE both planted and unplanted. Comparing the average ammonium and nitrate quantity in these samples with the presence and abundance of these bacteria (Figure 9), it can be seen that the nitrogen evolution and shift in the presence of the nitrogen-cycle-associated bacteria overlaps perfectly: as ammonium decreases, so do the Nitratireductor bacteria; as nitrate increase, so do the Nitrobacter and Nitrosomonas.
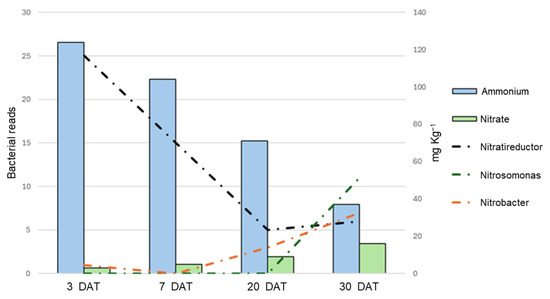
Figure 9.
Graphs comparing the abundance of specific nitrogen-cycle-associated bacterial genera with the evolution of nitrogen in the substrate. The X-axis reports the different time points, the main Y-axis reports the abundance of chosen bacterial 16S reads, while the secondary Y-axis reports the concentration of ammonium/nitrate. The bars of different colors report the abundance of ammonium and nitrate, while the dashed lines of different colors report the abundance of the bacterial reads, as indicated in the legend.
4. Discussion
Substitution of synthetic fertilizers with organic, more sustainable alternatives—such as liquid fractions of digestate—is an important goal to increase the overall sustainability of agriculture, considering that in Europe, the number of anaerobic digestion plants is increasing and consequently, a huge amount of digestate is available. The main parameters to assess the viability of this substitution are the effect on the yield and the quality of production, as well as potential environmental effects, which have been investigated in this study. The five different liquid fractions of digestate used in this study have been characterized and shown, as shown in Table 1, typical nutrients content in particular for species and concentration of nitrogen [8,11,16]. The detected differences are probably due to the infeed biomasses used in the five anaerobic digestion plants considered. The fertilizations were formulated basing on the nitrogen content and all the pots, except the control (Ø), received the same amount of nitrogen by liquid fraction of digestate or mineral fertilizer (M).
The diameter and height measurements throughout cultivation, as well as biomass at harvest, indicate that the digestates are able to sustain the growth of lettuce plants as efficiently as the mineral fertilizer. In particular, the digestate called W outperformed the mineral fertilizer yielding 43.5% more biomass. This is probably because the plants fertilized with this digestate immediately showed, in the substrate, a greater concentration of nitrogen in an available form (Figure 3b). These results are in accordance with a previous study that reported a significant increase up to 22% of leaf fresh weight [33]. Similar results were also registered on Zea mays [15], Brassica rapa “Joi Choi” [34], Triticum aestivum [35], Pennisetum purpureum [36], Solanum lycopersicum, and Cucumis sativum [37].
To determine the health conditions of the plants and the quality of the produce, several indexes were considered: the maximum quantum yield efficiency of PSII (Fv/Fm ratio) is a common index used to determine the stress status of plants, the threshold under which the plant is considered under stress can be set at 0.83 [34]; phenolic compounds and anthocyanins are secondary metabolites involved in stress protection [38]; chlorophyll is important both for biomass production and for the sale of the product, since it is also responsible for the greenness of the leaves; carotenoids are accessory pigments responsible for protection from oxidative stress in the plant, but they are also important as nutritional quality of the production [39]. All these indexes showed no major differences between mineral nutrition and the use of liquid fraction of digestates, although M and P showed the highest concentration of pigments, suggesting that all the treated samples were not under stress. This is partly in accordance with the findings reported in [40] where it is found that chlorophyll content is positively correlated with soil nitrogen content. In our study, the total amount of nitrogen is the same in all treatments, but M and P are those characterized by the highest ammonium concentration; therefore, it can be hypothesized that not only the nitrogen content but also its form is relevant for this effect.
The nitrate concentration in the leaves was significantly higher in the digestate treatments than in mineral nutrition, while remaining below the limits set by the European Commission [41] (Figure 2). The increase in nitrate could be possibly due to a general high concentration of nitrogen in available form, which induces a higher uptake by plants, as previously reported [42]. Also, a high level of light radiation (100–300 W/m2) is known to reduce the accumulation of nitrates [43], and this implies that the accumulation of nitrates might be a possible problem in real cultivation conditions and would need more investigation. The sugar concentrations were lower for all digestate treatments compared to the mineral fertilizer. While these results are difficult to interpret as the levels and forms of nitrogen should not significantly affect the sugars content in lettuce [42], the sugar values are in line with those previously reported in the literature for different cultivars of lettuce [44].
The ICP analysis assessed the plants’ meso- and micro-nutrient nutrition status to detect possible contamination of heavy metals (Table 2). No accumulation of heavy metals was detected. Of note is the sodium concentration that was significantly higher in the plants treated with the digestates: this could represent a limitation to the use of the digestate as it could induce salinity stress for crops with low sodium tolerance [45]. Considering the various elements as a whole, the concentrations detected in the plants fertilized with the liquid fraction of the digestate, although different from the treatment with mineral fertilizer, are on average with other experiments carried out on lettuce [44,45].
The nitrogen added through the digestate was mainly in N-NH4 form (Table 1). Over time, its concentration dropped, and more nitrogen was converted into N-NO3 following the nitrification process (Figure 3a,b). The total nitrogen was analyzed to be sure that no nitrogen escaped the system as ammonia, nitrogen protoxides, or nitrates. The constant concentration over time proves this, so it can be stated that the nitrogen only changed forms during the experiment without escaping the system.
The ammonium content dropped over time, even though during the first 7 days in some samples the concentration increased, potentially due to the presence of bacteria capable of producing ammonium (Figure 9). Compared to the digestates, mineral fertilization showed a more gradual conversion of ammonium to nitrate, having much lower values of nitrates at 20–30 DAT in both planted and unplanted pots, but showing a peak value comparable to that of the digestates at 60 DAT in unplanted pots. On the contrary, digestates treatments—except for P—had almost entirely depleted the ammonium by 30 DAT and showed higher contents of nitrates. Nitrate and ammonia evolution in the substrates agree with previous experiment on nitrogen evolution and speciation from digestate [16,19,46].
Despite having these differences in the evolution kinetic of nitrogen, both digestates and mineral fertilization proved effective in fully sustaining the plant’s growth in all treatments. Considering this, it is possible to state that the nitrates that evolve from the digestates are enough to sustain the plant’s needs without causing an excessive accumulation of nitrate in the plant (Figure 2e).
In the unplanted pots, the mineral fertilizer showed a lower pH compared to all other treatments (Figure 4). Over time, it increased until day 60, at which point it had the lowest value, and the pH increased again during the last 30 days up to the value measured at day 0. The mineral thesis was the most acidic of all for the first 7 days, after which, from 7 to 30 DAT, it had the same pH as all other treatments. At 60 DAT, the pH of M was similar to P and lower than all other samples. At 90 DAT, all measurements showed an increased pH compared to the previous time-step except for P and PCE.
In the planted pots, the pH evolution was similar as in the unplanted ones: the mineral thesis had the lowest pH for the first seven days. It is possible to state that the mineral fertilizer and two of the five digestates (P and PCE) had a greater acidification potential. This trend partially reflects nitrate evolution meaning: as expected, a good correlation between the two parameters (n = 7; r = −0.557; p < 0.05). This change in pH might also explain the differences between these two digestates and the other treatments when taking into consideration the microbial community, which is markedly different from other treatments but similar among P and PCE (Figure 7 and Figure 8).
The respiration test was performed as a measure of digestates degradation and relative nutrients release, nitrogen in particular (Figure 5). Indeed, the cumulative respiration data are correlated with the nitrate concentration (N-NO3 concentration vs cumulate respiration: n = 7; r = 0.729; p < 0.05). The digestates showed in general a higher respiration than the mineral fertilization or unfertilized control. Considering that the digestates are the only treatments that added carbon to the substrates, the difference in respiration may be due to the concentration of carbon, more than the nitrogen. Further research is needed to assess the final total carbon content of the substrate.
Regarding the microbial analyses, the overall quantity of bacteria decreases over time regardless of the treatment, with an initial concentration ranging from 103–104 16S copies ng−1 DNA, and the final concentration ranging from 101–103 copies ng−1 DNA. The starting concentration had no significant differences between the treatments, except the higher measure found in P and PCE treatments. The C and SS digestates showed an increase in the overall bacterial quantity, reaching the level of the P and PCE treatments at 3 DAT. This short-term increase in the number of bacterial cells is in line with what was previously reported [47,48], but this initial boost in the biomass is not maintained in the long-term observations.
Observing instead the composition of the bacterial communities, in most treatments and time points the main bacteria present belong to one of these four phyla: Actinomycetota, Bacillota, Bacteroidota, and Pseudomonadota.
Of these four phyla, Bacteroidota and Bacillota are often associated with the conditions of anaerobic digestion that are involved in the production of digestates, and the initial state of the bacterial community in the planted pots treated with digestates at 3 DAT show a high concentration of one or both phyla, similarly to what is reported in a previous study [20]. In particular, it is interesting to notice that in most cases the members of the Bacillota phylum in the digestate treatments belong to either the Sporolactobacillaceae or Clostridiaceae, characterized by being acid-tolerant and being involved in the anaerobic digestion processes and, for the latter, also possibly involved in the nitrogen cycle [49,50].
Pseudomonadota, which are the dominant phylum in all treatments except SS up to 30 DAT, are instead known to be involved in different nutrient cycles, including sulphur, nitrogen, and carbon [51,52]. Considering that they are not typically associated with anaerobic digestate maturation and are instead very common soil bacteria, their ubiquitous presence in the samples suggests that this phylum is the main component of the bacterial community in the substrate before any perturbation from the treatments. Similar considerations can be made for Actinomycetota bacteria that are found in lower abundance, but also are aerobic bacteria common in the soil and involved in nutrient cycles [53,54].
Overall, no single conclusion on the effect of the digestate treatments on the bacterial community can be drawn as the nature and origin of the digestate, as well as the presence or absence of the plant, can drastically alter the outcome. What can be taken as a general trend is that the treatment with the digestates seems to promote a higher degree of biodiversity in the substrate compared to the unfertilized control or the mineral fertilization. Observing our data, it cannot be determined whether this is a positive effect on the microbial community caused by the treatment, or a potentially detrimental effect caused by the bacteria contained in the digestates overtaking the local microbial community, and only further investigations should assess the impact of digestates on soil microbiota and plant health in the long-term.
Data obtained in this study suggest that due to the high plant nutrients content of digestate, this product can compete with mineral fertilizers coming from fossil resources with significant environmental benefits. In fact, it has been estimated that 1 ton of digestate, compared to 1 ton of synthetic fertilizer, could save 1 ton of oil, 108 tons of water and 7 tons of CO2 emission to achieve the goal of a green and circular economy [55].
Practical use requires a solids separation plant, which is often already present in biogas plants, and measurement of the nitrogen content to measure the appropriate dose of use according to the crops’ needs. For the latter, devices based on NIR analysis or electrical conductivity are already available and provide real-time nitrogen concentration of slurry. Liquid fraction of digestate can also be distributed by fertigation, fractioning the application during the growth of the crops, reducing the risks of losses to the environment.
Finally, although the results obtained in this study did not reveal potential risks for the environment deriving from the use of digestate (i.e., for example heavy metals accumulation on substrate and plants, or reduction in microbial diversity), only long-term studies carried out on a larger scale will be able to better clarify these aspects. Another element to consider is the variability in the nutrient content of digestates. Therefore, it is desirable that a useful effort to ensure greater standardization of the characteristics of digestates will allow for their wider use by farmers. However, it is important to underline how the use of digestate constitutes an excellent opportunity in rural areas, where its direct use for crop fertilization can minimize transport costs to user farms.
5. Conclusions
The liquid fraction of digestates obtained from different sources used in this study proved suitable for the cultivation of lettuce, sustaining its growth with an outcome similar to that of cultivation using mineral fertilizers for most of the measured parameters. Despite having very similar outcomes, the digestates showed differences in the nitrogen evolution and substrate bacterial populations after treatment. In particular, the latter is a topic that needs to be investigated more thoroughly in the future to understand how to best exploit the potential of digestates as fertilizers.
Supplementary Materials
The following supporting information can be downloaded at: https://www.mdpi.com/article/10.3390/horticulturae10070685/s1, Figure S1: Reads and OTUs in metagenomic analysis.
Author Contributions
Conceptualization, F.T.; methodology, F.T., A.F. (Antonio Ferrante) and A.P.; software, F.G.; formal analysis, D.C., A.P. and G.C.; investigation, D.C., A.F. (Alessia Follador), D.G., M.D. and J.G.; resources, E.R.; data curation, F.G. and A.P.; writing—original draft preparation, D.C. and A.P.; writing—review and editing, P.C., E.R., B.S. and F.T.; visualization, A.P. and D.C.; supervision, P.C.; funding acquisition, F.T. All authors have read and agreed to the published version of the manuscript.
Funding
This research and the APC were funded by the University of Milan—Department of Agricultural and Environmental Sciences—Production, Landscape, Agroenergy—Research Support Plan 2021—Project Title “Evolution of biogenic nitrate from digestate and effect on the nitrifying microbial community in growth tests in microcosms—DIMITRI”.
Data Availability Statement
All data used in the study are available as part of the study, in Supplementary Materials and at the links provided in the text.
Conflicts of Interest
The authors declare no conflicts of interest. The funders had no role in the design of the study; in the collection, analyses, or interpretation of data; in the writing of the manuscript; or in the decision to publish the results.
References
- United Nations, Department of Economic and Social Affairs, Population Division. World Population Prospects 2022: Summary of Results; United Nations, Department of Economic and Social Affairs, Population Division: New York, NY, USA, 2022; UN DESA/POP/2022/TR/NO. 3. [Google Scholar]
- Smil, V. Population growth and nitrogen: An exploration of a critical existential link. Environ. Sci. Phil. Popul. Devel. Rev. 1991, 17, 569–601. [Google Scholar] [CrossRef]
- Fertilizers Europe. Forecast of Food, Farming and Fertilizer Use in the European Union 2022–2023. 2023. Available online: https://www.fertiliserseurope.com/wp-content/uploads/2023/01/Forecast-2022-32.pdf (accessed on 16 May 2024).
- Köninger, J.; Lugato, E.; Panagos, P.; Kochupillai, M.; Orgiazzi, A.; Briones, M. Manure management and soil biodiversity: Towards more sustainable food systems in the EU. Agricult. Syst. 2021, 194, 103251. [Google Scholar] [CrossRef]
- European Commission. Communication from the Commission to the European Parliament, the Council, the European Economic and Social Committee and the Committee of the Regions. A new Circular Economy Action Plan For a Cleaner and More Competitive Europe. COM(2020) 98 Final. 2020. Available online: https://edz.bib.uni-mannheim.de/edz/doku/wsa/2020/ces-2020-1189-en.pdf (accessed on 16 May 2024).
- Ubando, A.T.; Rivera, D.R.T.; Chen, W.H.; Culaba, A.B. A comprehensive review of life cycle assessment (LCA) of microalgal and lignocellulosic bioenergy products from thermochemical processes. Bioresour. Technol. 2019, 291, 121837. [Google Scholar] [CrossRef]
- Chojnacka, K.; Moustakas, K.; Witek-Krowiak, A. Bio-based fertilizers: A practical approach towards circular economy. Bioresour. Technol. 2020, 295, 122223. [Google Scholar] [CrossRef]
- Tambone, F.; Scaglia, B.; D’Imporzano, G.; Schievano, A.; Orzi, V.; Salati, S.; Adani, F. Assessing amendment and fertilizing properties of digestates from anaerobic digestion through a comparative study with digested sludge and compost. Chemosphere 2010, 81, 577–583. [Google Scholar] [CrossRef]
- United States Environmental Protection Agency. Basic Information about Anaerobic Digestion. 2022. Available online: https://www.epa.gov/anaerobic-digestion/basic-information-about-anaerobic-digestion (accessed on 16 May 2024).
- Nkoa, R. Agricultural benefits and environmental risks of soil fertilization with anaerobic digestates: A review. Agron. Sustain. Dev. 2014, 34, 473–492. [Google Scholar] [CrossRef]
- Tambone, F.; Genevini, P.; D’Imporzano, G.; Adani, F. Assessing amendment properties of digestate by studying the organic matter composition and the degree of biological stability during the anaerobic digestion of the organic fraction of MSW. Bioresour. Technol. 2009, 100, 2140–3142. [Google Scholar] [CrossRef]
- Möller, K.; Müller, T. Effects of anaerobic digestion on digestate nutrient availability and crop growth: A review. Eng. Life Sci. 2012, 12, 242–257. [Google Scholar] [CrossRef]
- Tambone, F.; Terruzzi, L.; Scaglia, B.; Adani, F. Composting of the solid fraction of digestate derived from pig slurry: Biological processes and compost properties. Waste Manag. 2015, 35, 55–61. [Google Scholar] [CrossRef]
- Garg, R.N.; Pathak, H.; Das, D.K.; Tomar, R.K. Use of fly ash and biogas slurry for improving wheat yield and physical properties of the soil. Environ. Monit. Assess. 2005, 107, 1–9. [Google Scholar] [CrossRef]
- Riva, C.; Orzi, V.; Carozzi, M.; Acutis, M.; Boccasile, G.; Lonati, S.; Tambone, F.; D’Imporzano, G.; Adani, F. Short-term experiments in using digestate products as substitutes for mineral (N) fertilizer: Agronomic performance, odours, and ammonia emission impacts. Sci. Total Environ. 2016, 547, 206–214. [Google Scholar] [CrossRef]
- Tambone, F.; Adani, F. Nitrogen mineralisation from digestate in comparison to sewage sludge, compost and urea in a laboratory incubated soil experiment. J. Plant Nutr. Soil Sci. 2017, 180, 355–365. [Google Scholar] [CrossRef]
- Sharifi, M.; Baker, S.; Hojabri, L.; Hajiaghaei-Kamrani, M. Short-term nitrogen dynamics in a soil amended with anaerobic digestate. Can. J. Soil Sci. 2019, 99, 242–257. [Google Scholar] [CrossRef]
- Zilio, M.; Pigoli, A.; Rizzi, B.; Geromel, G.; Meers, E.; Schoumans, O.; Giordano, A.; Adani, F. Measuring ammonia and odours emissions during full field digestate use in agriculture. Sci. Total Environ. 2021, 782, 146882. [Google Scholar] [CrossRef]
- Alburquerque, J.A.; de la Fuente, C.; Ferrer-Costa, A.; Carrasco, L.; Cegarra, J.; Abad, M.; Bernal, M.P. Assessment of fertilizer potential of digestates from farm and agroindustrial residues. Biomass Bioenerg. 2012, 40, 181–189. [Google Scholar] [CrossRef]
- Luo, Y.; Chavez-Rico, V.N.; Sechi, V.; Bezemer, T.M.; Buisman, C.J.N.; ter Heijne, A. Effect of organic amendments obtained from different pretreatment technologies on soil microbial community. Environ. Res. 2023, 232, 116346. [Google Scholar] [CrossRef]
- American Public Health Association. Standard Methods for the Examination of Water and Wastewater, 20th ed.; APHA: Washington, DC, USA, 1998. [Google Scholar]
- Lenzi, A.; Orlandini, A.; Bulgari, R.; Ferrante, A.; Bruschi, P. Antioxidant and mineral composition of three wild leafy species: A comparison between microgreens and baby greens. Foods 2019, 8, 487. [Google Scholar] [CrossRef]
- Lichtenthaler, H.K. Chorophylls and carotenoids: Pigments of photosynthetic biomembranes. Meth. Enzymol. 1987, 148, 350–382. [Google Scholar] [CrossRef]
- Cataldo, D.A.; Maroon, M.; Schrader, L.E.; Youngs, V.L. Rapid colorimetric determination of nitrate in plant tissues by nitration of salicylic acid. Commun. Soil Sci. Plant Anal. 1975, 6, 71–80. [Google Scholar] [CrossRef]
- Toscano, S.; Ferrante, A.; Branca, F.; Romano, D. Enhancing the quality of two species of baby leaves sprayed with moringa leaf extract as biostimulant. Agronomy 2021, 11, 1399. [Google Scholar] [CrossRef]
- ISO 16072; Soil Quality—Laboratory Methods for Determination of Microbial Soil Respiration. International Organization for Standardization: Geneva, Switzerland, 2002.
- Sims, A.; Horton, J.; Gajaraj, S.; McIntoch, S.; Miles, R.J.; Mueller, R.; Reed, R.; Hu, Z. Temporal and spatial distribution of ammonia-oxidising archaea and bacteria and their ratio as indicator of oligotrophic conditions in natural wetlands. Water Res. 2012, 46, 4121–4129. [Google Scholar] [CrossRef] [PubMed]
- Lane, D.J. 16S/23S rRNA sequencing. In Nucleic Acid Techniques in Bacterial Systematic; Stackebrandt, E., Goodellow, M., Eds.; John Wiley and Sons: New York, NY, USA, 1991; pp. 115–175. [Google Scholar]
- R Development Core Team. R: A Language and Environment for Statistical Computing; R Foundation for Statistical Computing: Vienna, Austria, 2013. [Google Scholar]
- McMurdie, P.J.; Holmes, S. phyloseq: An R package for reproducible interactive analysis and graphics of microbiome census data. PLoS ONE 2013, 8, e61217. [Google Scholar] [CrossRef] [PubMed]
- Wickham, H. ggplot2: Elegant Graphics for Data Analysis; Springer: New York, NY, USA, 2016; ISBN 978-3-319-24277-4. [Google Scholar]
- Kumar, K.; Debnath, P.; Singh, S.; Kumar, N. An Overview of Plant Phenolics and Their Involvement in Abiotic Stress Tolerance. Stresses 2023, 3, 570–585. [Google Scholar] [CrossRef]
- Fedeli, R.; Celletti, S.; Loppi, S.; Vannini, A. Comparison of the Effect of Solid and Liquid Digestate on the Growth of Lettuce (Lactuca sativa L.) Plants. Agronomy 2023, 13, 782. [Google Scholar] [CrossRef]
- Weimers, K.; Bergstrand, K.J.; Hultberg, M.; Asp, H. Liquid Anaerobic Digestate as Sole Nutrient Source in Soilless Horticulture—Or Spiked with Mineral Nutrients for Improved Plant Growth. Front. Plant Sci. 2022, 13, 770179. [Google Scholar] [CrossRef] [PubMed]
- Singh, R.P.; Singh, P.; Ibrahim, M.H.; Hashim, R. Land Application of Sewage Sludge: Physicochemical and Microbial Response. Rev. Environ. Contam. Toxicol. 2012, 214, 41–61. [Google Scholar]
- Tan, F.; Zhu, Q.; Guo, X.; He, L. Effects of Digestate on Biomass of a Selected Energy Crop and Soil Properties. J. Sci. Food Agric. 2021, 101, 927–936. [Google Scholar] [CrossRef] [PubMed]
- Qi, X.; Zhang, S.; Wang, Y.; Wang, R. Advantages of the Integrated Pig-Biogas-Vegetable Greenhouse System in North China. Ecol. Eng. 2005, 24, 175–183. [Google Scholar] [CrossRef]
- Šamec, D.; Karalija, E.; Šola, I.; Vujcic Bok, V.; Salopek-Sondi, B. The Role of Polyphenols in Abiotic Stress Response: The Influence of Molecular Structure. Plants 2021, 10, 118. [Google Scholar] [CrossRef]
- Rao, A.V.; Rao, L.G. Carotenoids and human health. Pharmacol. Res. 2007, 55, 207–216. [Google Scholar] [CrossRef]
- Rashid, M.T.P.V.; Parkin, G. Predicting nitrogen fertilizer requirements for corn by chlorophyll meter under different N availability conditions. Can. J. Soil Sci. 2005, 85, 149–159. [Google Scholar] [CrossRef]
- European Union. Commission Regulation (EU) 2023/915 on maximum levels for certain contaminants in food and repealing Regulation (EC) No. 1881/2006. Off. J. Eur. Union 2023, 119, 103–157. [Google Scholar]
- M’hamdi, M.; Boughttas, I.; Chick-Rouhou, E.; Bettaieb, T. Effect of different levels of nitrogen fertilizer on morphological and physiological parameters and nitrates accumulation of lettuce cultivars (Lactuca sativa L.). Res. Plant Biol. 2014, 4, 27–38. [Google Scholar]
- Goberna, M.; Podmirseg, S.M.; Waldhuber, S.; Knapp, B.A.; García, C.; Insam, H. Pathogenic bacteria and mineral N in soil following the land spreading of biogas digestates and fresh manure. Appl. Soil Ecol. 2011, 49, 18–25. [Google Scholar] [CrossRef]
- Song, J.; Wang, Y.; Zhang, S.; Song, Y.; Xue, S.; Liu, L.; Lvy, X.; Wang, X.; Yang, G. Coupling biochar with anaerobic digestion in a circular economy perspective: A promising way to promote sustainable energy, environment and agriculture development in China. Renew. Sustain. Energ. Rev. 2021, 144, 110973. [Google Scholar] [CrossRef]
- Sublett, W.L.; Barickman, C.; Sams, C.E. The Effect of Environment and Nutrients on Hydroponic Lettuce Yield, Quality, and Phytonutrients. Horticulturae 2018, 4, 48. [Google Scholar] [CrossRef]
- Flavel, T.C.; Murphy, D.V. Carbon and nitrogen mineralization rates after application of organic amendments to soil. J. Environ. Qual. 2006, 35, 183–193. [Google Scholar] [CrossRef] [PubMed]
- Gomez-Brandon, M.; Juarez, M.F.D.; Zangerle, M.; Insam, H. Effects of digestate on soil chemical and microbiological properties: A comparative study with compost and vermicompost. J. Hazard Mater. 2016, 302, 267–274. [Google Scholar] [CrossRef] [PubMed]
- Odlare, M.; Arthurson, V.; Pell, M.; Svensson, K.; Nehrenheim, E.; Abubaker, J. Land application of organic waste—Effects on the soil ecosystem. Appl. Energy 2011, 88, 2210–2218. [Google Scholar] [CrossRef]
- Chen, J.S.; Toth, J.; Kasap, M. Nitrogen-fixation genes and nitrogenase activity in Clostridium acetobutylicum and Clostridium beijerinckii. J. Ind. Microbiol. Biotech. 2001, 27, 281–286. [Google Scholar] [CrossRef]
- Wainaina, S.; Lukitawesa, K.; Awasthi, M.; Taherzadeh, M.J. Bioengineering of anaerobic digestion for volatile fatty acids, hydrogen or methane production: A critical review. Bioengineered 2019, 10, 437–458. [Google Scholar] [CrossRef] [PubMed]
- Wei, H.; Wang, L.; Hassan, M.; Xie, B. Succession of the functional microbial communities and the metabolic functions in maize straw composting process. Bioresour. Technol. 2018, 256, 333–341. [Google Scholar] [CrossRef] [PubMed]
- Zhong, X.Z.; Ma, S.C.; Wang, S.P.; Wang, T.T.; Sun, Z.Y.; Tang, Y.Q.; Deng, Y.; Kida, K. A comparative study of composting the solid fraction of dairy manure with or without bulking material: Performance and microbial community dynamics. Bioresour. Technol. 2018, 247, 443–452. [Google Scholar] [CrossRef] [PubMed]
- Hamdali, H.; Hafidi, M.; Virolle, M.J.; Ouhdouch, Y. Growth promotion and protection against damping-off of wheat by two rock phosphate solubilizing actinomycetes in a P-deficient soil under greenhouse conditions. Appl. Soil Ecol. 2008, 40, 510–517. [Google Scholar] [CrossRef]
- Jog, R.; Pandya, M.; Nareshkumar, G.; Rajkumar, S. Mechanism of phosphate solubilization and antifungal activity of Streptomyces spp. isolated from wheat roots and rhizosphere and their application in improving plant growth. Microbiology 2014, 160, 778–788. [Google Scholar] [CrossRef]
- Bastabak, B.; Kocar, G. A review of the biogas digestate in agricultural framework. J. Mater. Cycles Waste Manag. 2020, 22, 1318–1327. [Google Scholar] [CrossRef]
Disclaimer/Publisher’s Note: The statements, opinions and data contained in all publications are solely those of the individual author(s) and contributor(s) and not of MDPI and/or the editor(s). MDPI and/or the editor(s) disclaim responsibility for any injury to people or property resulting from any ideas, methods, instructions or products referred to in the content. |
© 2024 by the authors. Licensee MDPI, Basel, Switzerland. This article is an open access article distributed under the terms and conditions of the Creative Commons Attribution (CC BY) license (https://creativecommons.org/licenses/by/4.0/).

