Abstract
Leaf photosynthesis largely determines the daughter corm yields in vegetative growth for saffron (Crocus sativus L.). Most of the previous researches focus on the spectral response in various species, but research on saffron leaves at different leaf ages is lacking. In this study, the action spectrum based on photosynthetic photon flux density (PPFD) and irradiance were distinguished and interpreted. The optical properties and photosynthetic performances of leaves were, respectively, investigated at two leaf ages, dependent on customized narrow-band LED spotlights from 380 nm to 780 nm with an interval of 20 nm and a band width of 10 nm. The younger leaves were characterized by higher reflectance and transmittance values at 500−600 nm, resulting in lower absorptance compared to the older leaves. The spectral response curves including the action spectrum and quantum yield for younger leaves were higher than the older, but their relative curves displayed coincidence. The spectral response curves exhibited two peaks at 440 and 640 nm, but no obvious troughs between 500 and 600 nm were observed. Nevertheless, the photosynthetic energy efficiencies of spotlights demonstrated very low values in the green/yellow region. Accordingly, more attention should be paid to green and yellow LED lighting during the vegetative stage for saffron, as well as improving their manufacturing technology.
1. Introduction
The dried stigma of saffron (Crocus sativus L.) has excellent preventive and therapeutic effects on circulatory system diseases, irregular menses, mental depression, tumors, etc. [1,2,3]. It can be used as a drug substitute to improve the immune system and self-repair ability for people, resulting in an increasing market demand for saffron [4]. Saffron is a perennial herbaceous plant and is vegetatively propagated by corms [5]. The reproduction of high-quality corms has become a crucial factor in increasing stigma yields. Nevertheless, the stigma yield is far below market demand at present, which is greatly affected by the corm size and environmental conditions (e.g., irrigation methods, growth cycles, and fertilization conditions, etc.) in the field [6,7,8]. After years of exploration, researchers have attempted to improve the stigma yield by controlling the environment, namely using a two-segment cropping system [9,10]. The corms without any culture medium are cultivated in cultivation rooms for dormancy and flowering from June to November, and they are then transplanted to the fields for vegetative development from December to May [11]. However, this system has not solved the problem of variable environments during corm development in the field, and, thus, a controllable environment in the field may be a solution to improve corm yields and quality.
Light is a crucial factor in controllable environments and can affect the crop yield and nutrient storage of roots and shoots by spectrum, light intensity and photoperiod [12,13]. Photosynthesis is the ultimate source of carbohydrates and supplies some ATP and NAD(P)H in photosynthetic tissues [14]. The vegetative development of daughter corms for saffron is mainly supplied from leaf photosynthesis and the carbon nutrients of mother corms. After flowering, most of the remaining mother corm reserves are depleted by the development of roots and leaves, and only a small portion of the biomass is provided to daughter corms. Entering February, the daughter corms initiate and rapidly develop. The photosynthetic capacity of leaves contributes about 90% of the biomass accumulations to the daughter organs [11]. Moradi et al. [15] have found that a high ratio of blue to red light-emitting diodes (LEDs) can improve the photosynthetic performance of saffron leaves by facilitating electron flow between photosystems I and II and enhance the daughter corm yields and carbohydrate accumulations for saffron. A higher light intensity and higher proportion of blue light significantly increased the leaf area, total yield of daughter corms, and proportion of larger-sized daughter corms, and 200 μmol m−2 s−1 (the ratio of blue and red light was 2:3 (namely 2B3R) in spectrum containing red, blue, green, and white LEDs) was regarded as optimal light in comparison to 56 μmol m−2 s−1 (1B3R), 200 μmol m−2 s−1 (1B3R), and 200 μmol m−2 s−1 (1B4R) [10]. However, both studies outlined above did not directly investigate the effect of LED lighting on leaf photosynthesis and corm yields during vegetative development. The corms in these studies were irradiated with LEDs in a cultivation room during the flowering period, and the subsequent effects of the light spectrum and intensity on corm development after transplanting to the field were then investigated. So far, the propagation of saffron corms still relies on traditional field production, and a gap still exists regarding applying LED to vegetative development in a controlled environment. Few studies have been conducted to explore the impact of light, especially the spectrum, on leaf photosynthesis and corm yields for saffron in the field.
The widely accepted spectral response curve in plant photosynthesis is proposed by McCree [16], which mainly determines blue (400–500 nm) and red (600–700 nm) regions as the most efficient light in LED controlled environments. Nevertheless, diverse studies exhibit various peaks and proportions of blue and red regions in the spectral response [16,17,18,19]. This phenomenon is not only influenced by species differences, plant growth conditions and experimental designs [20,21], but, more importantly, different photometric units can also cause differences in the spectral response curves of photosynthesis. Irradiance as the unit of incident light was used in photosynthetic measurement by McCree [16], but the results were less accurate than those obtained using the photosynthetic photon flux density (PPFD) as the measurement unit. Inada [21] directly determined the action spectrum from the reciprocal of the irradiance, referencing McCree’s method, and further obtained the action spectrum for unit incident quanta, but the conversion factor from irradiance to PPFD was not disclosed. The conversion relationship was provided by Balegh and Biddulph [22], but it was only a conversion between wavelengths, that is, using irradiance at 400 nm and the wavelength to calibrate irradiance at other wavelengths. Wu et al. [20] compared the action spectrum from several early reports and mentioned the photometric units of W m−2 and μmol m−2 s−1 in different studies, but their conversion was not clearly explained. For this reason, it is vital to quantitatively reinterpret the action spectrum for PPFD and irradiance.
Furthermore, narrow-band light has still been generated by traditional xenon lamps or tungsten halogen lamps combined with interference filters in the most studies of spectral response curves [16,17,21,23,24]. The irradiance or PPFD received by leaves at various narrow-band wavelengths is not uniform [16,17,21,24], especially within an ultraviolet region lower than 400 nm due to the low radiance power ratio. Plants receiving diverse light densities may have different photosynthetic rates and further affect their spectral response at the corresponding wavelength [25]. Our research group has measured the spectral response of saffron leaves before, but some data results are not ideal due to the poor stability and significant attenuation of short arc xenon lamps [26]. LEDs have gained popularity for horticultural applications due to their narrow spectrum, cold light source and long lifespan [27]. Narrow-band LEDs at 400−700 nm were used to investigate the photosynthetic spectral dependance for horticultural crops by Lee et al. [19], but a non-uniform wavelength interval may result in missing key wavelengths during measurements. The previous research about the spectral response in a range of plants is summarized and listed in Table 1.

Table 1.
Comparison of spectral response measurement in a range of plants in previous research.
The vegetative growth of saffron corms is mainly supported by carbon reserves accumulated through leaf photosynthesis; thus, it is of great significance to study the photosynthesis and spectral response of saffron leaves. The main purpose of this paper is to accurately measure the photosynthetic properties of saffron leaves at different leaf ages by developing an LED testing platform. Meanwhile, this work also aims to clarify the relationship between the photosynthetic spectral response based on PPFD and irradiance, as well as to provide suggestions for lighting conditions for saffron corms in controlled field environments.
2. Materials and Methods
2.1. Plant Materials and Growth Conditions
Plant samples in this study were obtained from the saffron production area on Chongming Island (121°40′ N, 31°62′ E, Shanghai, China). The saffron corms were transplanted in the field in late November 2022, after flowering on the culture shelf indoors. Thirty-six corms with a dry weight of 18–23 g were selected and planted in 3.5 L round flowerpots filled with sandy loam soil at a plant density of 78.6 corms per m2. The planting conditions in flowerpots such as soil, temperature, humidity, and nutrient management were completely consistent with those in the field. The relative humidity was 60−90% and the day/night temperature ranged from −10 to 10 °C. Earthworm organic fertilizer was applied once every month, and the amount was 3 kg m−2 every time. During the period of vigorous leaf growth from February to March, 0.003 kg m−2 of liquid organic fertilizer was applied every 2 weeks. Irrigation was based on rainfall to keep the soil moist without ponding [26]. The photosynthetic rates of saffron leaves were determined beforehand in mid-December and mid-January, and gained negative value. For this reason, two treatments with three replicates in the experiment were designed, including corm leaves from mid-February and mid-March. The saffron leaves reached total senescence at the end of March [11].
2.2. Methodology of Photosynthetic Spectral Response Based on PPFD and Irradiance
The photosynthetic spectral response of leaves includes the action spectrum and quantum yield in leaf photosynthesis. Due to the inconsistency in the measurement units of incident light during various experiments, there are mainly two forms of expression regarding the action spectrum [20]. The action spectrum based on PPFD can be expressed as SP(λ); it refers to the mole numbers of CO2 assimilated per mole number of incident light. Its expression is as follows:
where Pn and Pd refer to the net photosynthetic rate and dark respiration rate of leaves (μmol m−2 s−1), respectively, and Ep is the photosynthetic photon flux density (μmol m−2 s−1).
The other action spectrum based on irradiance represents the mole numbers of CO2 assimilated by incident light per unit irradiance, expressed as
where Sr(λ) represents the action spectrum based on irradiance (μmol W−1 s−1 or μmol J−1), and Er is irradiance (W m−2).
Moreover, due to the narrow-band incident light used in the photosynthetic spectral response, there exists the following relationship between PPFD and irradiance [28]:
where KP,r represents the conversion coefficient between PPFD and irradiance (μmol W−1 s−1 or μmol J−1), Pr(λ) indicates spectral irradiance of incident light, λ is the wavelength (nm), nA represents the Avogadro constant (nA = 6.02214076 × 10²³), h signifies the Planck constant (h = 6.626 × 10⁻³⁴ J s), and c expresses the speed of light (c = 2.99792458 × 10⁸ m s−1). Therefore, the action spectrum based on PPFD can also be expressed as:
In Equation (4), the action spectrum based on PPFD is inversely proportional to the wavelength. When the irradiance is adopted as the unit of incident light, the action spectrum based on PPFD should be obtained through dividing by the wavelength and multiplying by a constant nAhc.
Quantum yield Yp(λ) represents the mole number of CO2 assimilated per mole number of absorbed light, and it can thus be expressed as follows:
where A is absorptance of leaves, which can be obtained by measuring reflectance R and transmittance T of leaves, and its formula is:
Therefore, the action spectrum can be obtained by measuring Pn and Pd under different narrow-band lights. The measurement units of narrow-band lights can be expressed by PPFD or irradiance. The quantum yield can be calculated through the action spectrum and absorptance of leaves. The relationship diagram of formula and experimental settings is shown in Figure 1.
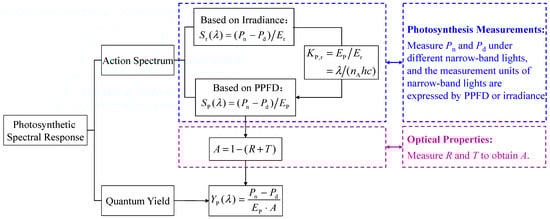
Figure 1.
Relationship diagram of formula and experimental settings.
2.3. Narrow-Band LED Spotlights and Testing Platform
Narrow-band light was obtained from 21 LED spotlights for photosynthesis measurements. They were made of LED modules with different peak wavelengths and interference filters with a band width of 10 nm. A convex lens, reflective cup and interference filter were equipped in front of the LED module to concentrate and filter light. The heat sink, fan and drive controller were placed at the back of the LED chip module to reduce the radiant heat load and adjust the radiant output. All components were covered with a lamp housing, as shown in Figure 2a. During photosynthesis measurements, the spotlight was placed on a self-designed testing platform, with a transparent leaf chamber 15 cm below the light outlet. The transparent leaf chamber is part of a portable photosynthetic system (LI-6400XT, LI-COR, Lincoln, NB, USA), which can be used to fix leaves and conduct photosynthetic rate measurements. There were two positions on the testing platform, one for PPFD calibration and the other for photosynthetic testing. In addition, to further reduce the radiant heat and avoid the ambient temperature interference around the leaf chamber, the interior of the testing platform was designed as a cavity with fans around, as shown in Figure 2b.
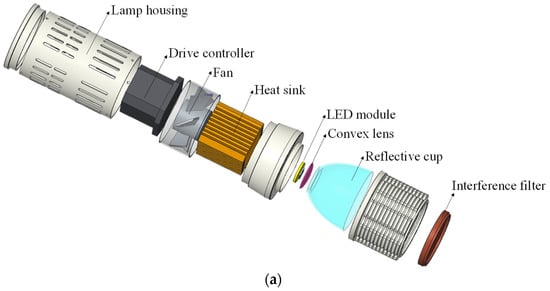
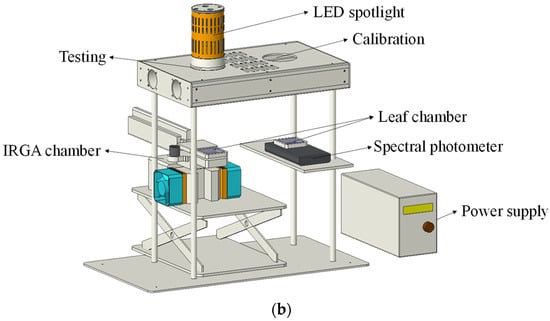
Figure 2.
Schematic diagram of narrow-band LED spotlight and testing platform. (a) Narrow-band LED spotlight. (b) Testing platform.
Before photosynthesis measurements, each LED spotlight should be preheated and calibrated. The spotlight was lit at the rated power for 20 min to stabilize on a preheating platform, and it was then placed on the testing platform for calibration. A spectral photometer (PLA-20, EVERFINE, Hangzhou, China) was utilized to measure the spectrum and PPFD in the leaf chamber. Its probe was covered with the leaf chamber and placed 15 cm below the calibration position to maintain the same level as the leaf chamber connected to an infrared gas analyzer (IRGA) chamber in the photosynthetic system. These two leaf chambers were identical. Their spectral transmittances at 380−780 nm were flat and very high, with an average of 88.6%. The PPFD within leaf chamber was adjusted to 100 μmol m−2 s−1 using an adjustable DC regulated power supply (HSPY-200-05, HANSHENG PUYUAN, Beijing, China) and the dimming controller. Since the spotlight was preheated, the PPFD reading could stabilize within 5 min. Then, the spotlight was moved to the testing position for photosynthesis measurements. The separation of calibration and testing can avoid interference caused by frequently opening the leaf chamber connected with the IRGA chamber for PPFD calibration. After the reading of net photosynthetic rate Pn was recorded, the spotlight was returned to the calibration position for further testing. Two PPFD tests were conducted to determine the stability of light output from the spotlight before and after the net photosynthetic rate measurements.
2.4. Photosynthesis Measurements
The photosynthesis measurements were, respectively, taken on the sunny mornings of mid-February and mid-March. Six saffron corms in the flowerpots for replicate were randomly selected with a completely randomized block design, and they were then moved into the laboratory. In order to make saffron leaves maintain high photosynthetic performance in the lab and avoid the closure of leaf stomata before measurements, a broad-band white background light with a high PPFD of 1000 μmol m−2 s−1 was adopted to active the leaves for light induction. The laboratory was ventilated to maintain the temperature and humidity consistent with the outside. The net photosynthetic rate Pn was measured using the photosynthetic system. The conditions inside the IRGA chamber were set as a constant leaf temperature of 20 °C, and a CO2 concentration of 400 μmol m−2 s−1 with a flow rate of 500 μmol s−1. Due to the elongated shape of saffron leaves, 8−10 leaves in each corm were arranged and paved side by side without a gap, and then the middle parts of the leaves were fixed to the leaf chamber, shown in Figure 3a. The leaves were exposed to 21 narrow-band lights ranging from 380 to 780 nm, in an interval of 20 nm with a band width of 10 nm. Under each light spectrum, five Pn readings were recorded with 10 s intervals, after PPFD and Pn in the leaf chamber were stable (generally about 4−10 min). Then, five Pn readings under the spectrum were averaged for analysis. The flowchart of photosynthesis measurements is shown in Figure 3b. After completing one spectrum, the narrow-band spotlight was removed from the calibration position and replaced with the next narrow-band spotlight. The leaves were exposed to the next spectrum for the next photosynthesis measurements. When changing the spectrum and adjusting the PPFD, the white LED spotlight still provided broad-band background light to maintain high photosynthetic activities of leaves. After all spectra measurements were completed, the dark respiration rate Pd was recorded in the dark. To avoid the potential impact of the order of spectra on the net photosynthetic rate of leaves, the spectrum was randomly selected with a Latin square design for each measurement [25]. Moreover, the PPFD on the leaf surface in the leaf chamber from narrow-band spectra was set as 100 μmol m−2 s−1, based on the region where the net photosynthetic rate and PPFD were linearly related [29].
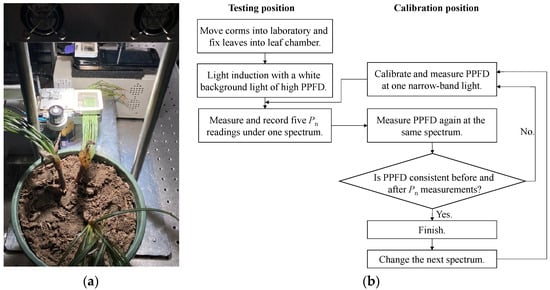
Figure 3.
Photos and experimental process of photosynthesis measurements. (a) Photos of saffron leaves fixed to the transparent leaf chamber in photosynthetic system. (b) Flowchart of photosynthesis measurements.
2.5. Optical Properties
After photosynthetic determinations, the optical properties of leaves per corm were measured including the spectral reflectance, transmittance, and absorptance at 380−780 nm. The reflectance and transmittance were determined by means of a high-accuracy array spectroradiometer (HASS-2000, EVERFINE, Hangzhou, China) coupled with a spectrum reflection/transmittance testing box (TR80, EVERFINE, Hangzhou, China). The reflection/transmittance testing box was utilized to provide a tungsten halogen lamp and a testing environment. The spectroradiometer was used to measure the spectrum of reflective/transmissive materials. A precision digital display DC stabilized current power supply (WY, EVERFINE, Hangzhou, China) was adopted to supply power for a standard tungsten halogen lamp in the reflection/transmittance testing box. Before reflectance testing, a standard whiteboard was used for calibration. And then 8–10 leaves in each corm were fixed to the light outlet of the testing box for reflectance measurements, shown in Figure 4a. For transmittance measurement, the spectrum of the tungsten halogen lamp was first measured. And then saffron leaves were fixed in the testing box to measure the spectrum passing through leaves and calculate the spectral transmittance of leaves, as shown in Figure 4b. The leaves of each corm were measured three times in total, and the results were averaged for analysis.
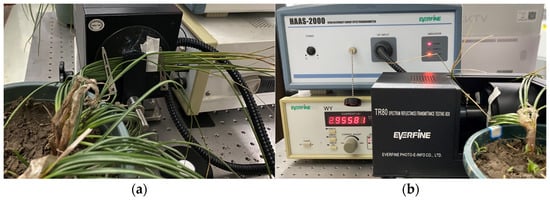
Figure 4.
Testing photos of optical properties of saffron leaves in mid-March. (a) Reflectance measurement. (b) Transmittance measurement.
2.6. Statistical Analysis
One-way analysis of variance (ANOVA) was performed using IBM SPSS Statistics software (version 25, Chicago, IL, USA), and significant differences among leaf optical properties were assessed using the LSD multiple range analysis test (p ≤ 0.05).
3. Results and Discussion
3.1. Leaf Optical Characteristic at Different Leaf Ages
The reflectance, transmittance, and absorptance curves of saffron leaves in mid-February and mid-March are shown in Figure 5. In the region of 380−500 nm, the reflectance and transmittance of leaves at different leaf ages were observed to be very low and relatively flat, around 5.2% and 2.6% on average, respectively. In 500−600 nm, the reflectance/transmittance reached a peak at about 550 nm, with an average of about 12.2% and 6.9% at 550 nm. Then, the two curves decreased slightly from 600 to 680 nm, and reached a minimum of 7.0% and 3.0% at 680 nm, respectively. After exceeding 680 nm, the reflectance and transmittance increased rapidly, reaching 51.6% and 34.8% at 750 nm, respectively. Finally, the reflectance basically remained stable, while the transmittance slightly increased above 750 nm.
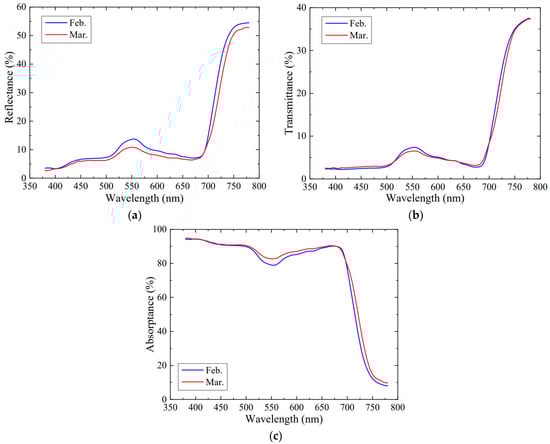
Figure 5.
Leaf optical properties at different leaf ages. (a) Reflectance. (b) Transmittance. (c) Absorptance. Each line represents the mean of six plants with three replicates.
The tendencies of absorptances in saffron leaves were shown to be similar to those of other species [16]. They displayed higher absorptance in the 380−500 nm range with an average of 92.2% and 600−680 nm with approximately 88.6% on average. In the region of 500−600 nm, there existed a small trough in the absorptance, and approximately 80.9% at 550 nm. After exceeding 680 nm, the absorptance decreased rapidly, down to 13.5% at 750 nm, and then slightly declined to 9.0% at 780 nm.
No pronounced differences in reflectance (p = 0.099), transmittance (p = 0.741), or absorptance (p = 0.269) were found at different leaf ages within 380−780 nm. However, in the region of 500−600 nm, the leaf ages significantly affected the reflectivity (p = 0.000 < 0.01), transmittance (p = 0.008 < 0.01), and absorptance (p = 0.000 < 0.01) for saffron leaves. As the leaves changing from younger to older, the leaf color varies from green to dark green. It is speculated that the leaf age and color affect variations in leaf optical properties [19,30]. In previous research, red leaves were shown to have higher absorptance than green leaves in lettuce, but their absorptances were very close and both exceeded 90% in 400–500 nm and 600–700 nm [19]. The photosynthetic pigment chlorophyll has a high rate of absorptance in both regions, which contributes to the high leaf absorptance for many species, including saffron. The great differences in terms of the absorptances in lettuces with two colors are mainly exhibited in the 500–600 nm range. This is mainly affected by the contents of anthocyanins in the leaves whose absorptive peak was at 530 nm [31]. For Eucalyptus tereticornis, the concentrations of anthocyanin in new leaves are relatively lower than that in older leaves. The carbon assimilation and photorespiration rates are enhanced, resulting in a descending requirement for photoprotection and lower absorptance in the green region for new leaves [32]. In the present study, the younger leaves in mid-February were green, and they had higher reflectance and lower absorptance in the 500–600 nm range than the older leaves in mid-March. It is likely that the lower contents of anthocyanins lead to lower absorptance in saffron leaves. In addition, the spongy tissue of the leaves in the older leaves is mature, and green light may vertically penetrate deeper spongy tissue and be absorbed by the chlorophyll in the lowest layer of chloroplasts [33]. Hence, the contents of anthocyanin and chlorophyll can be determined in future to confirm the above hypothesis.
3.2. Leaf Action Spectrum at Different Leaf Ages
The curve shapes of action spectrum were similar in saffron leaves at two leaf ages, as shown in Figure 6a. They both exhibited two obvious peaks, respectively, the main red peak at 640 nm and the second blue peak at 440 nm. The leaves in mid-February displayed an average 1.29 times higher action spectrum than those in mid-March. For younger leaves in mid-February, the action spectrum at the red peak reached 0.048, 1.36 times that at the blue peak. The curve descended significantly below 440 nm, only 0.008 at 380 nm. In the region from 440 nm to 500 nm, the curve reached a lower value at 480 nm, and then slowly ascended from 500 to 600 nm. After exceeding 640 nm, the action spectrum first slowly decreased to 0.043 at 680 nm, and then drastically declined above 700 nm. By normalizing the action spectrum, the relative action spectrum curves at two leaf ages were obtained in Figure 6b. The two curves were basically coincident, and there was no significant difference in each wavelength region.
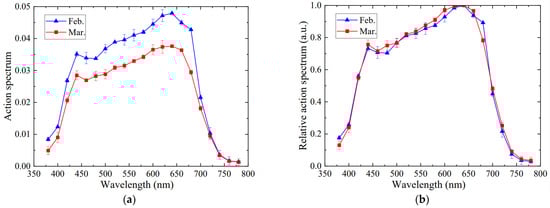
Figure 6.
Action spectrum based on PPFD of saffron leaves at different leaf ages. (a) Action spectrum. (b) Relative action spectrum. Each symbol represents the mean values ± SE of six plants with three replicates.
The saffron leaves in mid-February were green and entered the most active stage of photosynthesis. After entering March, the leaf tips began to turn yellow, but most of them were still dark green. For this reason, the younger leaves appeared higher on the absolute action spectrum compared to older leaves. Nevertheless, the relative action spectra at different growth stages were coincident in general, which agreed with McCree’s analysis about the effect of the leaf age on the action spectrum [16].
Relative action spectrum data from different reports were compared and replotted in Figure 7a, respectively; eight field crops were proposed by McCree [16]; herb species and arbor species from Inada [21], and peanut leaves [21], as well as the saffron leaves in mid-February in this study. It was worth noting that the curve by McCree was recalculated with Equation (4), with the data of the action spectrum based on irradiance. The peaks of all curves fell in blue and red regions, but their corresponding wavelengths and shapes of peaks were slightly different, especially the blue peaks. The blue peak in the McCree curve was 450 nm and was 74.5% of the red peak at 625 nm. The blue peak of both herbaceous and arborous plants was located at 437 nm, and their values were 100% and 68.3% that at red peak 646 nm, respectively. For saffron leaves, the blue peak at 440 nm was observed to not be very distinct; still, it constituted 73.3% of the red peak at 640 nm. Its wavelength and height of blue peak were relatively close to those of the McCree curve and fell between herbaceous and arborous plants.
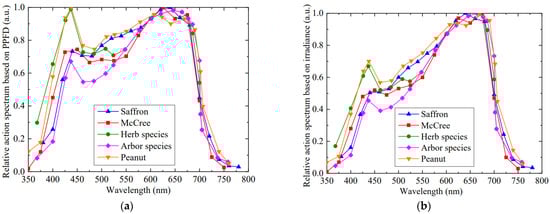
Figure 7.
Relative action spectrum of different plant leaves [16,21]. (a) Relative action spectrum based on PPFD. (b) Relative action spectrum based on irradiance. All curves are redrawn using original data and Equation (4).
Different blue peaks were influenced by the peak wavelength and band width of narrow-band light used in various spectral response studies, but basically located at the absorption peak region of chlorophyll a and chlorophyll b [22]. The diversity in the proportion of blue peaks among different species may be affected by various factors, such as growth conditions and green degrees of leaves, an increase or decrease of inactive absorption from photo-screened compounds such as carotenoids or anthocyanins in leaves, an ascending leaf absorptance within leaf tissue, and an incremental blue light reflection caused by wax deposition on the leaf epidermis [21]. Additionally, blue light irradiation with high PPFD may trigger an avoidance reaction of chloroplasts in leaves, resulting in a descending net photosynthetic rate by staying away from strong light [10]. If the PPFD from narrow-band blue light is higher than that of blue light in natural light, it may cause a reduction in the action spectrum of blue light [20]. In 350−440 nm, the relative action spectrum curve of saffron leaves fell between the McCree curve and arborous plants, which may be due to these plants growing in the field or outdoors. As for the region above 700 nm, the relative action spectrum curves among various species were observed to be basically consistent.
Furthermore, in contrast to the McCree curve, herbaceous and arborous plants, the relative action spectrum of saffron leaves was higher from 500 to 600 nm, but slightly lower than that of peanut leaves (Figure 7a). In fact, the McCree curve was mostly determined with light green leaves, while the saffron leaves exhibited a darker green state, leading to a higher action spectrum in the green/yellow region [21]. Therefore, in addition to red and blue light irradiation for driving photosynthesis, adding green and yellow lights may be conducive to photosynthetic accumulation for saffron leaves during vegetative development in the field.
In order to intuitively illustrate the effect of different photometric units on the action spectrum, the action spectra based on irradiance were obtained in Figure 7b for different plants. The values in a longer wavelength range were raised but that in shorter wavelength range was lowered compared to Figure 7a, due to the weighted wavelengths in Equation (4). A decrease in the proportion of blue to red peaks was observed in relative action spectrum for irradiance, demonstrating that irradiance as the photometric unit would underestimate the action spectrum in blue region. Consequently, it is noteworthy to distinguishing between irradiance and PPFD due to the determination of the action spectrum.
3.3. Leaf Quantum Yield at Different Leaf Ages
Similarly to the action spectrum, the quantum yield curves at two leaf ages also demonstrated the same shapes, with two peaks, respectively, located at 440 nm and 640 nm, as shown in Figure 8a. The quantum yield in mid-February was observed to be higher than that in mid-March. Nevertheless, different from the action spectrum (Figure 6a), the quantum yield above 700 nm was significantly raised and higher than that in the region of 380−400 nm. This was mainly affected by the fact that the absorptance drastically decreased in the far-red region (Figure 5c). The quantum yield for younger leaves reached 0.028 at 700 nm, 1.3 times greater than the action spectrum. Once over 700 nm, the quantum yield slowly decreased, down to 0.017 at 780 nm, 12.3 times more than the action spectrum. Moreover, the relative quantum yield curves for saffron leaves at two leaf ages basically coincide (Figure 8b), demonstrating that the quantum yield was mainly influenced by the action spectrum but little by the absorptance of the green/yellow region (Figure 5c), which was consistent with the results by McCree [16]. Plant photosynthesis is mainly adjusted by photosynthetic organs of leaves, not the absorption of pigments from leaves [25].
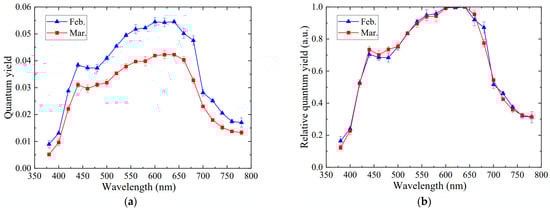
Figure 8.
Quantum yield of saffron leaves at different leaf ages. (a) Quantum yield. (b) Relative quantum yield. Each symbol represents the mean values ± SE of six plants with three replicates.
The differences observed in the relative action spectrum among diverse species resulted in a reduction in the relative quantum yield curve, as displayed in Figure 9a. The reduced differences existed in the height and profiles of the blue peak, owing to a higher absorptance in the blue region than others. The red peak shifted among various plants: 602 nm for herb species and 621 nm for arbor species, respectively, but the relative quantum yield was close to 1 from 600 to 640 nm. The shift in red peak is not only related to the absorptance but is also affected by the wavelength and band width of narrow-band light in various studies. When the band width exceeds 15 nm, narrow-band light at adjacent measurement wavelengths may cause unpredictable wavelength interference to photosynthesis, further resulting in an incorrect respond to the corresponding wavelength for plants [20].
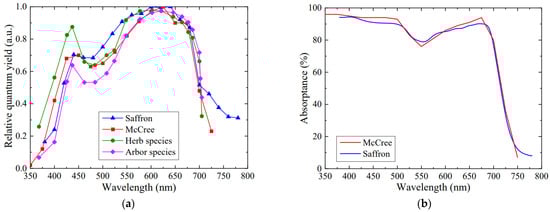
Figure 9.
Quantum yield and absorptance of different plant leaves [16,21]. (a) Relative quantum yield of different plant leaves. (b) Comparison of absorptance between saffron leaves and the leaves by McCree. All curves are redrawn using original data.
Moreover, the relative quantum yield of saffron leaves was higher than that of other plants above 700 nm, which was largely affected by the ratio of absorptance in the far-red region to the red or blue region. The leaf absorptances obtained by McCree are higher in the blue region (400–500 nm) and red region (600–700 nm) but lower in the far-red region (740–780 nm) compared to those of saffron leaves, as shown in Figure 9b. The average absorptance of leaves by McCree in the far-red region accounts for 43.6% and 46.6% in the blue and red region, respectively, while only 29.5% and 31.0% are accounted for in saffron leaves. For this reason, when the relative action spectrum of McCree’s curve and the saffron leaves basically coincide in the far-red region, the relative quantum yield from McCree is lower than that of saffron in this region. Some studies have not measured the absorptance and action spectrum above 750 nm; thus, comparison cannot be made in further detail here.
3.4. Assessment of Photosynthetic Energy Efficiency for Narrow-Band LED Spotlights
The absolute spectra of narrow-band LED spotlights are shown in Figure 10a, with a peak wavelength from 380 to 780 nm at an interval of 20 nm, as well as a band width of about 10 nm. The average PPFD received by leaves in the transparent leaf chamber was measured as 100.0 ± 1.3 μmol m−2 s−1, demonstrating that the spotlights had reliable light outputs during photosynthesis measurements. There were a few differences in the maximum absolute spectrum among diverse peaks, due to the band width of interference filters within an error range of 10 ± 2 nm, but they all closed to 10 μmol m−2 s−1 nm−1. Additionally, only a small overlapping area existed between adjacent wavelengths, which would not interfere with leaf photosynthesis at the corresponding wavelength. The PPFD received by leaves remained invariant before and after photosynthesis measurements at the same wavelength, further avoiding an inaccurate response from varying light outputs and attenuation by xenon lamps or tungsten halogen lamps in the previous studies [16,17,21,23,24]. The narrow-band LED spotlights in this study had excellent thermal management and could reduce the ambient temperature around the leaf chamber, making it more suitable for spectral response determination.
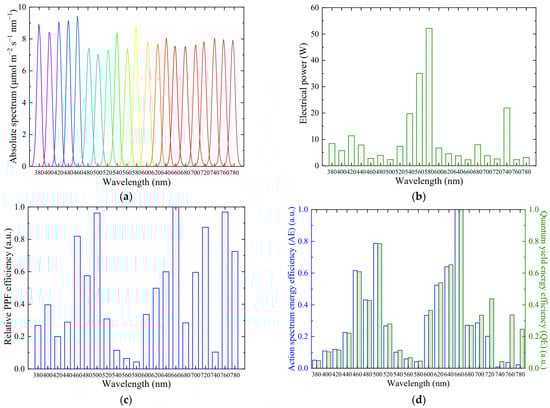
Figure 10.
Narrow-band LED spotlights. (a) Absolute spectrum with a peak wavelength from 380 to 780 nm with an interval of 20 nm and band width of 10 nm, PPFD = 100 μmol m−2 s−1. (b) Electrical power. (c) Relative PPF efficiency. (d) Relative action spectrum energy efficiency (AE) and relative quantum yield energy efficiency (QE).
The electrical power of narrow-band LED spotlights from 380 nm to 780 nm with an interval of 20 nm was described in Figure 10b. To further evaluate the electrical efficiency of narrow-band LED spotlights, the relative PPF efficiency of spotlights (Figure 10c) was obtained through dividing the PPFD by the electrical power followed by normalization. There were significant differences in the relative PPF efficiency at various peak wavelengths. The higher values were located at a partial wavelength from 460 to 500 nm and above 620 nm, while a lower value fell in the 540−580 nm range, similarity to the results reported by Lee et al. [19]. This was affected by various factors, such as the radiant efficiency of LED modules, overlapping degree of the spectrum range between LED modules and target measurement narrow-band light, and band width and transmittance of interference filters.
Owing to the demands for red and blue light in LED controlled environments, the process technology for blue and red LED chips and modules has been extensively developed nowadays [34]. The higher external quantum efficiency in blue and red LEDs is the direct reason for affecting PPF efficiency at these wavelengths. Band width and transmittance of interference filters are not consistent at different wavelengths, further leading to differences in PPF efficiency. However, even if no differences are mentioned above, a higher PPF efficiency will exist in longer wavelengths as a result of less photon energy compared to shorter wavelengths [35]. Moreover, the central wavelength and band width of LED modules also have an impact on the target measurement wavelength. If the central wavelength exactly falls in the target peak wavelength and the band width is very small, close to 10 nm, then the light output by LED modules will be utilized to the maximum extent. Conversely, if the central wavelength only slightly overlaps with the target, a portion of electrical power will be sacrificed in exchange for the target PPFD. As for the green/yellow LED modules at 540–580 nm, the production materials and process technology limited their external quantum efficiency, resulting in a lower radiant efficiency [28]. The LED modules at 580 nm had a low radiant efficiency, only 2.5%. The narrow-band LED spotlight at 580 nm was thus actually developed using broad-band white light with an interference filter at the corresponding wavelength, but still produced very low values regarding the PPF efficiency.
In addition to PPF efficiency, the relative action spectrum energy efficiency (AE) and relative quantum yield energy efficiency (QE) of narrow-band LED spotlights may more intuitively evaluate the energy efficiency of spotlights based on photosynthesis. The action spectrum and quantum yield of saffron leaves in mid-February were, respectively, divided by the electrical power of narrow-band LED spotlights and then normalized, as shown in Figure 10d, which represents the photosynthetic rate of leaves under unit electrical power. The relative distribution of AE and QE at each wavelength was similar; only slightly differences above 700 nm were observed, which depended on discrepancies in the action spectrum and quantum yield above 700 nm. The maximum values are in the 460–500 nm and 640–660 nm ranges for AE and QE due to high photosynthetic rates, leaf absorptances and PPF efficiency in these regions. The low photosynthetic rate of saffron leaves in the 380–400 nm range and above 740 nm contributed to low AE values in these regions. However, the limited technology of green/yellow LED chips and modules resulted in a lower AE and QE in the region of 540–580 nm, although the action spectrum and quantum yield of saffron leaves were not low in this band.
4. Conclusions
A narrow-band LED lighting system with a band width of 10 nm and stable 100 μmol m−2 s−1 light outputs and a 20 nm wavelength interval was developed for photosynthetic measurements of saffron leaves at different leaf ages. The photosynthetic spectral responses of younger leaves in February were higher than those of older leaves in March, but their peaks were both located at 440 nm and 640 nm. In green/yellow regions, saffron leaves did not display an obvious trough. For this reason, it is recommended to provide additional LED lighting containing blue, yellow, green and red LEDs during leaf development, so as to further promote vegetative growth and corm yields. Furthermore, the conversion of the action spectrum based on irradiance and PPFD can establish a clear theoretical basis for subsequent research on the spectral response for other species. The proposal of narrow-band LED spotlights and a testing platform can also be considered for more photosynthetic spectral dependence studies in future.
Author Contributions
Conceptualization, S.Z., Q.H., F.L. and D.G.; methodology, D.G., S.Z., Q.H., F.L., W.P. and X.Z.; investigation, D.G. and Q.Y.; resources, S.Z. and X.Z.; software, D.G.; data curation, D.G. and Q.Y.; writing—original draft preparation, D.G.; writing—review and editing, S.Z. and Q.H.; supervision, S.Z., Q.H., F.L., W.P. and X.Z.; project administration, Q.H. and S.Z.; funding acquisition, S.Z. All authors have read and agreed to the published version of the manuscript.
Funding
This research was supported by Key Technologies Research and Development Program of Science and Technology Commission of Shanghai Municipality, China (18391903600).
Data Availability Statement
The data presented in this study are available on request from the corresponding author due to ongoing researches using a part of the data.
Acknowledgments
The authors are grateful to Shanghai Leets Lighting Electric Co., Ltd. for their technical assistance on the preparation of narrow-band LED spotlights and test platform.
Conflicts of Interest
Author W.P. and X.Z. were employed by Shanghai Traditional Chinese Medicine Co., Ltd. in China. The remaining authors declare that the research was conducted in the absence of any commercial or financial relationships that could be construed as a potential conflict of interest.
References
- Bhandari, P.R. Crocus sativus L. (saffron) for cancer chemoprevention: A mini review. J. Tradit. Complement. Med. 2015, 5, 81–87. [Google Scholar] [CrossRef] [PubMed]
- Moratalla-López, N.; Bagur, M.J.; Lorenzo, C.; Martínez-Navarro, M.E.; Salinas, M.R.M.; Alonso, G.L. Bioactivity and bioavailability of the major metabolites of Crocus sativus L. flower. Molecules 2019, 24, 2827. [Google Scholar] [CrossRef] [PubMed]
- Cardone, L.; Castronuovo, D.; Perniola, M.; Cicco, N.; Candido, V. Saffron (Crocus sativus L.), the king of spices: An overview. Sci. Hortic. 2020, 272, 109560. [Google Scholar] [CrossRef]
- Bagur, M.J.; Salinas, G.L.A.; Jiménez-Monreal, A.M.; Chaouqi, S.; Llorens, S.; Martínez-Tomé, M.; Alonso, G.L. Saffron: An old medicinal plant and a potential novel functional food. Molecules 2018, 23, 30. [Google Scholar] [CrossRef] [PubMed]
- Lotfi, L.; Kalbasi-Ashtari, A.; Hamedi, M.; Ghorbani, F. Effects of enzymatic extraction on anthocyanins yield of saffron tepals (Crocus sativus) along with its color properties and structural stability. J. Food Drug Anal. 2015, 23, 210–218. [Google Scholar] [CrossRef] [PubMed]
- Khorramdel, S.; Nasrabadi, S.E.; Mahmoodi, G. Evaluation of mother corm weights and foliar fertilizer levels on saffron (Crocus sativus L.) growth and yield components. J. Appl. Res. Med. Aroma. 2015, 2, 9–14. [Google Scholar] [CrossRef]
- Koocheki, A.; Seyyedi, S.M.; Eyni, M.J. Irrigation levels and dense planting affect flower yield and phosphorus concentration of saffron corms under semi-arid region of Mashhad, Northeast Iran. Sci. Hortic. 2014, 180, 147–155. [Google Scholar] [CrossRef]
- Yarami, N.; Sepaskhah, A.R. Saffron response to irrigation water salinity, cow manure and planting method. Agric. Water Manag. 2015, 150, 57–66. [Google Scholar] [CrossRef]
- Wang, Z.; Li, X.; Xu, J.X.; Yang, Z.; Zhang, Y.C. Effects of ambient temperature on flower initiation and flowering in saffron (Crocus sativus L.). Sci. Hortic. 2021, 279, 109859. [Google Scholar] [CrossRef]
- Zhou, T.; Qiu, X.; Zhao, L.; Yang, W.; Wen, F.; Wu, Q.; Yan, J.; Xu, B.; Chen, J.; Ma, Y.; et al. Optimal light intensity and quality increased the saffron daughter corm yield by inhibiting the degradation of reserves in mother corms during the reproductive stage. Ind. Crops Prod. 2022, 176, 114396. [Google Scholar] [CrossRef]
- Renau-Morata, B.; Nebauer, S.G.; Sánchez, M.; Molina, R.V. Effect of corm size, water stress and cultivation conditions on photosynthesis and biomass partitioning during the vegetative growth of saffron (Crocus sativus L.). Ind. Crops Prod. 2012, 39, 40–46. [Google Scholar] [CrossRef]
- Bantis, F.; Ouzounis, T.; Radoglou, K. Artificial LED lighting enhances growth characteristics and total phenolic content of Ocimum basilicum, but variably affects transplant success. Sci. Hortic. 2016, 198, 277–283. [Google Scholar] [CrossRef]
- Chen, X.; Xue, X.; Guo, W.; Wang, L.; Qiao, X. Growth and nutritional properties of lettuce affected by mixed irradiation of white and supplemental light provided by light-emitting diode. Sci. Hortic. 2016, 200, 111–118. [Google Scholar] [CrossRef]
- Keller, M. Photosynthesis and respiration. In The Science of Grapevines: Anatomy and Physiology; Academic Press: Cambridge, MA, USA, 2010; pp. 107–123. [Google Scholar] [CrossRef]
- Moradi, S.; Kafi, M.; Aliniaeifard, S.; Salami, S.A.; Shokrpour, M.; Pedersen, C.; Moosavi-Nezhad, M.; Wróbel, J.; Kalaji, H.M. Blue light improves photosynthetic performance and biomass partitioning toward harvestable organs in saffron (Crocus sativus L.). Cells 2021, 10, 1994. [Google Scholar] [CrossRef] [PubMed]
- McCree, K.J. The action spectrum, absorptance and quantum yield of photosynthesis in crop plants. Agric. Meteorol. 1971/1972, 9, 191–216. [Google Scholar]
- Paradiso, R.; Meinen, E.; Snel, J.F.H.; Visser, P.D.; Ieperen, W.V.; Hogewoning, S.W.; Marcelis, L.F.M. Spectral dependence of photosynthesis and light absorptance in single leaves and canopy in rose. Sci. Hortic. 2011, 127, 548–554. [Google Scholar] [CrossRef]
- Zhen, S.; Haidekker, M.; Iersel, M.W. Far-red light enhances photochemical efficiency in a wavelength-dependent manner. Physiol. Plant. 2019, 167, 21–33. [Google Scholar] [CrossRef] [PubMed]
- Lee, J.W.; Kang, W.H.; Park, K.S.; Son, J.E. Spectral dependence of electrical energy-based photosynthetic efficiency at single leaf and canopy levels in green- and red-leaf lettuces. Hortic. Environ. Biotechnol. 2017, 58, 111–118. [Google Scholar] [CrossRef]
- Wu, B.; Rufyikiri, A.; Orsat, V.; Lefsrud, M.G. Re-interpreting the photosynthetically action radiation (PAR) curve in plants. Plant Sci. 2019, 289, 110272. [Google Scholar] [CrossRef]
- Inada, K. Action spectra for photosynthesis in higher plants. Plant Cell Physiol. 1976, 17, 355–365. [Google Scholar]
- Balegh, S.E.; Biddulph, O. The photosynthetic action spectrum of the bean plant. Plant Physiol. 1970, 46, 1–5. [Google Scholar] [CrossRef] [PubMed]
- Nilsen, S.; Mortensen, L. Spectral response of photorespiration effect of plant age and chlorophyll content in spruce. Z. Pflanzenphysiol. 1978, 89, 433–441. [Google Scholar] [CrossRef]
- Evans, J.R. The dependence of quantum yield on wavelength and growth irradiance. Aust. J. Plant Physiol. 1987, 14, 69–79. [Google Scholar] [CrossRef]
- Liu, J.; Iersel, M.V. Photosynthetic physiology of blue, green, and red light: Light intensity effects and underlying mechanisms. Front. Plant Sci. 2021, 12, 619987. [Google Scholar] [CrossRef] [PubMed]
- Ji, X.Y.; Gao, D.; Pei, W.Z.; Zhang, X.; Li, F.S.; Han, Q.Y.; Zhang, S.D. Photosynthetic spectral response curves of saffron leaves. Appl. Opt. 2021, 60, 10207–10213. [Google Scholar] [CrossRef]
- Kohler, A.E.; Lopez, R.G. Duration of light-emitting diode (LED) supplemental lighting providing far-red radiation during seedling production influences subsequent time to flower of long-day annuals. Sci. Hortic. 2021, 281, 109956. [Google Scholar] [CrossRef]
- Nelson, J.A.; Bugbee, B. Economic analysis of greenhouse lighting: Light emitting diodes vs. high intensity discharge fixtures. PLoS ONE 2014, 9, 99010. [Google Scholar] [CrossRef] [PubMed]
- Singsaas, E.L.; Ort, D.R.; Delucia, E.H. Variation in measured values of photo-synthetic quantum yield in ecophysiological studies. Oecologia 2001, 128, 15–23. [Google Scholar] [CrossRef]
- Paradiso, R.; Visser, P.H.B.; Arena, C.; Marcelis, L.F.M. Light response of photosynthesis and stomatal conductance of rose leaves in the canopy profile: The effect of lighting on the adaxial and the abaxial sides. Funct. Plant Biol. 2020, 47, 639–650. [Google Scholar] [CrossRef]
- Steele, M.R.; Gitelson, A.A.; Rundquist, D.C.; Merzlyak, M.N. Nondestructive estimation of anthocyanin content in grapevine leaves. Am. J. Enol. Vitic. 2009, 60, 87–92. [Google Scholar] [CrossRef]
- Wujeska-Klause, A.; Ctous, K.Y.; Ghannoum, O.; Ellsworth, D.S. Leaf age and eCO2 both influence photosynthesis by increasing light harvesting in mature Eucalyptus tereticornis at EucFACE. Environ. Exp. Bot. 2019, 167, 103857. [Google Scholar] [CrossRef]
- Terashima, I.; Fujita, T.; Inoue, T.; Chow, W.S.; Oguchi, R. Green light drives leaf photosynthesis more efficiently than red light in strong white light: Revisiting the enigmatic question of why leaves are green. Plant Cell Physiol. 2009, 50, 684–697. [Google Scholar] [CrossRef] [PubMed]
- Stutte, G.W.; Edney, S. Photoregulation of bioprotectant content of red leaf lettuce with light-emitting diodes. HortScience 2009, 44, 79–82. [Google Scholar] [CrossRef]
- Yeh, N.; Chung, J.P. High-brightness LEDs–Energy efficient lighting sources and their potential in indoor plant cultivation. Renew. Sustain. Energy Rev. 2009, 13, 2175–2180. [Google Scholar] [CrossRef]
Disclaimer/Publisher’s Note: The statements, opinions and data contained in all publications are solely those of the individual author(s) and contributor(s) and not of MDPI and/or the editor(s). MDPI and/or the editor(s) disclaim responsibility for any injury to people or property resulting from any ideas, methods, instructions or products referred to in the content. |
© 2024 by the authors. Licensee MDPI, Basel, Switzerland. This article is an open access article distributed under the terms and conditions of the Creative Commons Attribution (CC BY) license (https://creativecommons.org/licenses/by/4.0/).